
Genome-Wide Analysis of the Protein Phosphatase 2C Genes in Tomato
by
 and
and
Jianfang Qiu
1,2,†, 
Lei Ni
1,2,†,
Xue Xia
1,2,
Shihao Chen
1,2,
Yan Zhang
1,2,
Min Lang
1,
Mengyu Li
1,2,
Binman Liu
1,2,
Yu Pan
1,2,
Jinhua Li
1,2 and
Xingguo Zhang
1,2,* 1
Key Laboratory of Horticulture Science for Southern Mountainous Regions, The Ministry of Education, College of Horticulture and Landscape Architecture, Southwest University, No. 2 Tiansheng Road, Beibei, Chongqing 400715, China
2
State Cultivation Base of Crop Stress Biology for Southern Mountainous Land of Southwest University, Academy of Agricultural Sciences, Southwest University, Beibei, Chongqing 400715, China
*
Author to whom correspondence should be addressed.
†
These authors contributed equally to this work.
Genes 2022, 13(4), 604; https://doi.org/10.3390/genes13040604
Submission received: 5 March 2022
/
Revised: 23 March 2022
/
Accepted: 24 March 2022
/
Published: 28 March 2022
(This article belongs to the Section Plant Genetics and Genomics)
Abstract
:The plant protein phosphatase 2C (PP2C) plays an irreplaceable role in phytohormone signaling, developmental processes, and manifold stresses. However, information about the PP2C gene family in tomato (Solanum lycopersicum) is relatively restricted. In this study, a genome-wide investigation of the SlPP2C gene family was performed. A total of 92 SlPP2C genes were identified, they were distributed on 11 chromosomes, and all the SlPP2C proteins have the type 2C phosphatase domains. Based on phylogenetic analysis of PP2C genes in Arabidopsis, rice, and tomato, SlPP2C genes were divided into eight groups, designated A–H, which is also supported by the analyses of gene structures and protein motifs. Gene duplication analysis revealed that the duplication of whole genome and chromosome segments was the main cause of SLPP2Cs expansion. A total of 26 cis-elements related to stress, hormones, and development were identified in the 3 kb upstream region of these SlPP2C genes. Expression profile analysis revealed that the SlPP2C genes display diverse expression patterns in various tomato tissues. Furthermore, we investigated the expression patterns of SlPP2C genes in response to Ralstonia solanacearum infection. RNA-seq and qRT-PCR data reveal that nine SlPP2Cs are correlated with R. solanacearum. The above evidence hinted that SlPP2C genes play multiple roles in tomato and may contribute to tomato resistance to bacterial wilt. This study obtained here will give an impetus to the understanding of the potential function of SlPP2Cs and lay a solid foundation for tomato breeding and transgenic resistance to plant pathogens.
1. Introduction
Plants may inevitably encounter many kinds of unpredictable environmental challenges, such as pathogen infection, extreme temperature, salt, and drought, which will adversely affect their growth, development, and production [1]. To adapt to these adversities, plants have evolved signaling mechanisms to deliver stimuli to different cellular compartments and then feedback to these stresses. Protein kinases (PKs) and protein phosphatases (PPs) modulate the protein function by reversible protein phosphorylation mechanism and are known to play a vital role in pivotal stress signaling processes [2]. In the past years, several PKs had been massively investigated and proved to be positive regulation factors responding to a variety of stresses [3,4,5,6]. On the contrary, PPs have not been studied as extensively as PKs.
PPs can remove phosphate groups from phosphorylated proteins through their special structure and can change protein function to respond to external pressure [7]. They are categorized into three major classes: tyrosine phosphatases (PTPs), serine/threonine phosphatases (PSPs), and dual-specificity phosphatases (DSPTPs), which is determined by the specificity of a substrate [8]. Moreover, PSPs are further classified into phosphoprotein phosphatases (PPP) and phosphoprotein metallophosphatase (PPM) based on distinct amino acid sequences, different dependencies on metal ions, and sensitivities to inhibitors [9]. PP1, PP2A, PP2B, PP4, PP5, PP6, and PP7 were included in the PPP family, whereas the PPM family is represented by PP2C and others [8,10,11].
Due to the special differences between amino acid and crystal structure, PP2C proteins require metal ion Mg2+ or Mn2+ to accomplish their function [12]. In eukaryotes, the catalytic domain of PP2C proteins is located at either the N-terminus or the C-terminus. Further research revealed that the regions of the catalytic domain in eukaryotic PP2C proteins are relatively conserved, whereas the regions of a non-catalytic domain have diverse amino acid sequences [13]. PP2Cs are quite conserved in evolution from prokaryotes to higher eukaryotes, having been found in archaea, bacteria, fungi, plants, and animals, significantly modulate stress signaling pathways, and reverse the stress-induced PK cascades in response to environmental stimuli [14]. In plants, PP2Cs form the largest family of phosphatase genes, accounting for 60–65% of all phosphorylases [8,15]. The high proportion of PP2C genes in plants indicates their evolutionary significance, requirement, and participation in varying plant cellular functions [10]. As a major class of protein phosphatases, PP2Cs catalyze the dephosphorylation of substrate proteins to regulate signaling pathways and participate in various physiological and biochemical processes in plants. Current studies have indicated that PP2Cs play important regulatory roles in different processes, such as ABA signaling, biotic and abiotic stress responses, plant immunity, K+ nutrient signaling, and plant development [8,10,13,14,15,16,17]. There were extensive studies on the role of PP2C proteins. For example, PpABI1A and PpABI1B in moss are directly involved in ABA responses [18]. In higher plants, the function of PP2Cs is more diverse, among which PP2Cs in group A is the most intensively studied. In Arabidopsis thaliana, the PP2Cs of group A, well-studied as ABA co-receptors, negatively regulate the ABA signaling pathway. For instance, ABI1, ABI2, and HAB1 participate in plant abiotic stress by negatively regulating ABA signaling and ABI1 plays a negative regulatory role in response to ABA-mediated drought stress [19,20,21]. In tomato, SlPP2C1, an ABI2 homology, negatively regulates ABA signaling and fruit ripening. SlPP2C1-RNAi led to increased endogenous ABA accumulation and advanced release of ethylene in transgenic fruit compared with wild-type (WT) fruit. SlPP2C1-RNAi plants were hypersensitized to ABA and displayed delayed seed germination and primary root growth, and increased resistance to drought stress compared with WT control plants [22]. In maize, ZmPP2C-A10 is tightly associated with drought tolerance, and similar to its Arabidopsis orthologs, it interacts with ZmPYL ABA receptors and ZmSnRK2 protein kinases, suggesting that ZmPP2C-A10 is involved in mediating ABA signaling. Transgenic studies confirmed that ZmPP2C-A10 functions as a negative regulator of drought tolerance [23]. Similar results have been obtained from poplar [24] and sweet cherry [25] studies. On the contrary, in Brachypodium distachyon, BdPP2CA6, a member of group A of PP2C, was found to be a positive regulator in both ABA and stress signaling pathways [26]. These studies indicate that the PP2Cs of group A have diverse functions in different plants. In Arabidopsis, the PP2Cs of group B function as mitogen-activated protein kinase (MAPK) phosphatases. AtAP2C1 regulates phytohormone and defense responses by cooperating with MPK4 and MPK6 [27,28,29], whereas AtAP2C3 mediates stomata development; thus, negatively regulating MAPK signaling [30]. Group D comprises nine PP2Cs in Arabidopsis, all of which have different expression patterns and subcellular localization [31]. In group E, AtPP2C-6-6 interacts with histone acetyltransferase (AtGCN5) to control the activation of stress-responsive genes in the stomatal signaling network. In group F, AtWIN2 may interact with the bacterial effector HopW1-1 and regulates HopW1-1 to induce disease response [32]. These studies indicate that PP2Cs have diverse functions worth investigating.
To date, there are 80, 78, 257, 62, and 131 genes coding for PP2C proteins identified using bioinformatics surveys in Arabidopsis, rice [33], wheat [34], woodland strawberry [35], and Brassica rapa [36], respectively. The studies mentioned above have proved the diverse roles of PP2C genes. Hence, it is necessary to delve into the comprehension and functional characterization of the PP2C gene family.
Tomato is one of the most consumed vegetables in the world, and its annual output has reached 181 million tons (Food and Agriculture Organization of the United Nations, http://www.fao.org/ (accessed on 5 March 2022)). Tomato and its derivatives have become an indispensable part of daily life. Ralstonia solanacearum, previously known as Pseudomonas solanacearum, is internationally recognized as one of the leading models in the analysis of plant pathogenicity. This soil bacterium is a severe and devastating disease of solanaceous crops (https://iant.toulouse.inra.fr/R.solanacearum (accessed on 5 March 2022)). Tomato genome sequencing has been completed (https://solgenomics.net (accessed on 5 March 2022)), but the tomato PP2C family genetic research in plant pathogen, R. solanacearum, remains unknown. In this study, bioinformatics analysis of tomato PP2C gene family members was conducted to preliminarily explore the expression characteristics and response rules of this gene family in tomato which were infected with R. solanacearum. In our study, 92 SlPP2Cs were identified, and their physical and chemical properties, subcellular localization, exon–intron structure, phylogenetic comparison, gene duplication, chromosome distribution, and cis-acting elements were analyzed. SlPP2Cs under R. solanacearum infection were also examined. Our results were a reliable prediction for the function and structure of SlPP2Cs, which would provide a solid basis for performing further functional analysis of these genes.
2. Materials and Methods
2.1. Identification of SlPP2C Members
To gain the whole SlPP2C genes of tomato, genome data of ITAG 4.0 were downloaded from Phytozome (http://phytozome.jgi.doe.gov/pz/portal.html (accessed on 5 March 2022)) [37] to set up a local database, and seed file of the SlPP2C protein domain (PF00481) [38] was downloaded from the Pfam (http://pfam.xfam.org/ (accessed on 5 March 2022)) [39]. The HMMER [40] procedures of hmm build and hmm search were fully used to retrieve all assumed SlPP2C sequences with default parameters in tomato and the ID of the relevant sequences was collected (E-value < 1.0). The ID was submitted to the SGN (http://solgenomics.net/ (accessed on 5 March 2022)) [41] to eliminate the sequence that shows no difference in their amino acid. After manually removing the redundant sequences, all these predicted genes were examined in SMART (http://smart.embl-heidelberg.de/ (accessed on 5 March 2022)) [42] and CDD (https://www.ncbi.nlm.nih.gov/cdd (accessed on 5 March 2022)) [43]. Protein physicochemical properties and subcellular localization of SlPP2Cs were calculated by the online software ExPASy (https://www.expasy.org/ (accessed on 5 March 2022)) [44] and Cell-PLoc 2 (http://www.csbio.sjtu.edu.cn/bioinf/plant-multi/ (accessed on 5 March 2022)) [45]. The chromosome length of tomato and the location data of each SlPP2C gene were retrieved from SGN.
2.2. Phylogenetic Analysis
Validated tomato PP2C protein sequences were employed for establishing an evolutionary relationship with the known PP2C members of Arabidopsis (AtPP2Cs) and Oryza sativa (OsPP2Cs) [33]. This analysis included 250 amino acid sequences. ClustalW [46] was used to conduct multiple sequence alignment. Ground on the outcomes of aa sequence alignment, the maximum likelihood method in MEGA-X [47] was used to design the phylogenetic tree with default parameters. The Blast program was applied to discern tandem repeat genes. If the identity between two genes was more than 75% and the alignment length was more than 75% of the longer sequence, they were considered to be tandem repeat gene pairs [48]. Ka/Ks of all SlPP2C tandem repeat gene pairs was calculated using KaKs_Calculator [49]. The relationship of tandem repeats was displayed via TBtools [50].
2.3. Chromosomal Location, Gene Structure, and Sequence Alignment
The PP2C genes were mapped to tomato chromosomes by identifying their chromosomal positions according to the SGN database. The proportion chart of the chromosomal location was drawn using TBtools. The exon and intron structures of SlPP2Cs were generated using the Gene Structure Display Server 2.0 (http://gsds.cbi.pku.edu.cn (accessed on 5 March 2022)) [51] by aligning the CDS sequences with the corresponding genomic DNA sequences from the SGN database. Domains were confirmed using the Pfam and the SMART programs.
2.4. Cis-Element Prediction for PP2C Gene Promoter
It is well known that most of the functional cis-active elements in vivo (about 80%) are concentrated in the proximal promoter [52]. However, how to determine the boundary of the promoter region has not been determined. Generally speaking, 1 kb, 2 kb, or longer upstream of ATG is taken. Therefore, the aim of this paper was to take 3 kb. The promoter sequence (3 kb upstream of the putative genes ATG) was extracted from the ITAG 4.0 gff3 file. All the promoter sequences were uploaded to the PlantCARE database (http://bioinformatics.psb.ugent.be/webtools/plantcare/html/ (accessed on 5 March 2022)) [53] for cis-element prediction. The result was visualized with TBtools.
2.5. Expression Analysis of SlPP2Cs of Tomato Tissue
RNA-seq data from the platform TFGD (Tomato Functional Genomics Database) (http://ted.bti.cornell.edu/ (accessed on 5 March 2022)) [54] played a part in the expression patterns of SlPP2Cs. The data included reads from the Illumina RNA-seq analysis of leaves, roots, flower buds, fully opened flowers, and 1, 2, and 3 cm, mature green, breaker, and breaker +10 fruit of the tomato cultivar Heinz. Gene expression level was defined on the basis of the normalized expression value, that is, reads per kilobases per million (RPKM) for each tissue/stage. The log2 logarithmic transformation of the RPKM values was selected from the platform, and heat maps were plotted to analyze their expression levels.
2.6. Transcriptional Profiling of SlPP2C Genes in Tomato Infected with Ralstonia solanacearum
RNA-seq data from our laboratory (unpublished data) were performed to gain insight into the expression profiles of the SlPP2C gene families under R. solanacearum infection. Gene expression level was defined on the basis of the normalized expression value, that is, reads per kilobases per million (RPKM) for each sample. The log2 logarithmic transformation of the RPKM values was selected, and heat maps were plotted to analyze their expression levels. The expression values of SlPP2C genes that were upregulated or downregulated by more than two-fold with p < 0.05 were considered as differentially expressed.
2.7. Bacterial Strain of Ralstonia solanacearum
The standard strain GMI1000 of R. solanacearum was used to infect tomato stems. The tested pathogen GMI1000 was grown on solid TTC medium plates for 3 days at 28 °C; then inoculated in liquid TTC medium to grow overnight at 28 °C [55]. Then, 100 μL overnight bacterial solution was absorbed into TTC liquid medium and activated for 24 h at 28 °C, which can be used for the inoculation test.
2.8. Plant Material and Treatments
The germinated seeds of tomato were grown in plastic pots containing a mixture of soil and vermiculite (3:1). The pots were then placed in greenhouse with a 16 h light/8 h dark cycle photoperiod, and the temperature was 25 ± 2 °C. The humidity was maintained at approximately 60–70%, and the photosynthetic photon flux density was controlled at about 120 μmol photons/m2/s. When the seedlings were six weeks old, the plants were used in the inoculation experiment. Untreated plants were used as controls to avoid the effects of biological clock on differential gene expression. Specific treatments were provided to the seedlings as follows: The stem of selected tomato plants was needled with 1 mL of activated bacterial solution and cultured in an artificial climate chamber with 28 °C for 3 days. After 3 days of treatment, the materials of stems were immediately frozen in liquid nitrogen and then stored at −80 °C until use.
2.9. RNA Isolation and Real-Time PCR
A total of 100 uL of RNA was extracted using the Total RNA Kit (BioTeke Corporation, Beijing, China), following the manufacturer’s instructions. The integrity of the RNA was verified by agarose gel electrophoresis. Synthesis of the cDNA was performed from the total RNA samples using the PrimeScript™ RT Reagent Kit, according to the protocol with gDNA Eraser (TaKaRa, Dalian, China). Specific primers were designed using qPrimerDB [56] and are presented in Supplementary Table S1. The SlELF-α gene was used as the internal control [57] to quantitate the expression of SlPP2C genes. Real-time PCR was performed using CFX96 Touch™ Real-time PCR System (Bio-Rad, Hercules, CA, USA) with a SYBR Premix Ex Taq™ II Kit (Bio-Rad). The reactions were carried out in the following conditions: denaturation at 94 °C for 4 min, 40 cycles of 5 s at 95 °C, 30 s at 60 °C, 15 s at 95 °C, 20 s at 60 °C, and 15 s at 95 °C. Three biological duplications were used. The 2−∆∆Ct method was used to analyze the real-time PCR data [58]. Relative expressions were visualized using Graphpad Prism [59].
3. Results
3.1. Identification of PP2C Genes in Tomato
To identify the PP2C genes in the tomato, we searched for sequences that contained the particular domain in the tomato protein database using the hidden Markov model (HMM) model of PF00481 and confirmed the presence of PP2C domains using Pfam and Batch CD-search and found 92 PP2C genes (Supplementary Table S2). These genes were labeled as SlPP2C01 to SlPP2C92 on the basis of their distributions and relative linear orders among their respective chromosomes. The information of gene ID, the amino acid (aa) length, isoelectric point (pI), molecular weight (Mw), hydrophilic coefficient, instability index, and subcellular localization prediction of 92 PP2C proteins were analyzed (Table 1). The lengths of proteins varied from 59 aa residues (SlPP2C62) to 1080 aa residues (SlPP2C37), with an average length of 190 aa. Most of the lengths of the PP2C proteins were between 300 and 400 aa. The pI varied from 4.62 (SlPP2C90) to 11.39 (SlPP2C08) and Mw ranged from 6738.81Da (SlPP2C62) to 119917.55Da (SlPP2C37). The result of hydropathicity (GRAVY) showed that SlPP2Cs except for SlPP2C92 were hydrophilic proteins. The result of the instability index proclaimed that 67.4% SlPP2Cs were unstable proteins. The result of subcellular localization prediction showed that most tomato PP2C proteins were predicted to be in the intracellular (97.8%), such as the cytoplasm, chloroplast, mitochondrion, nucleus, and peroxisome, but some proteins may be located in extracellular or cell membrane (2.1%). These results revealed that SlPP2C proteins were organelle-specific and had a function in various environments.
3.2. Phylogenetic and Comparative Synteny Analysis
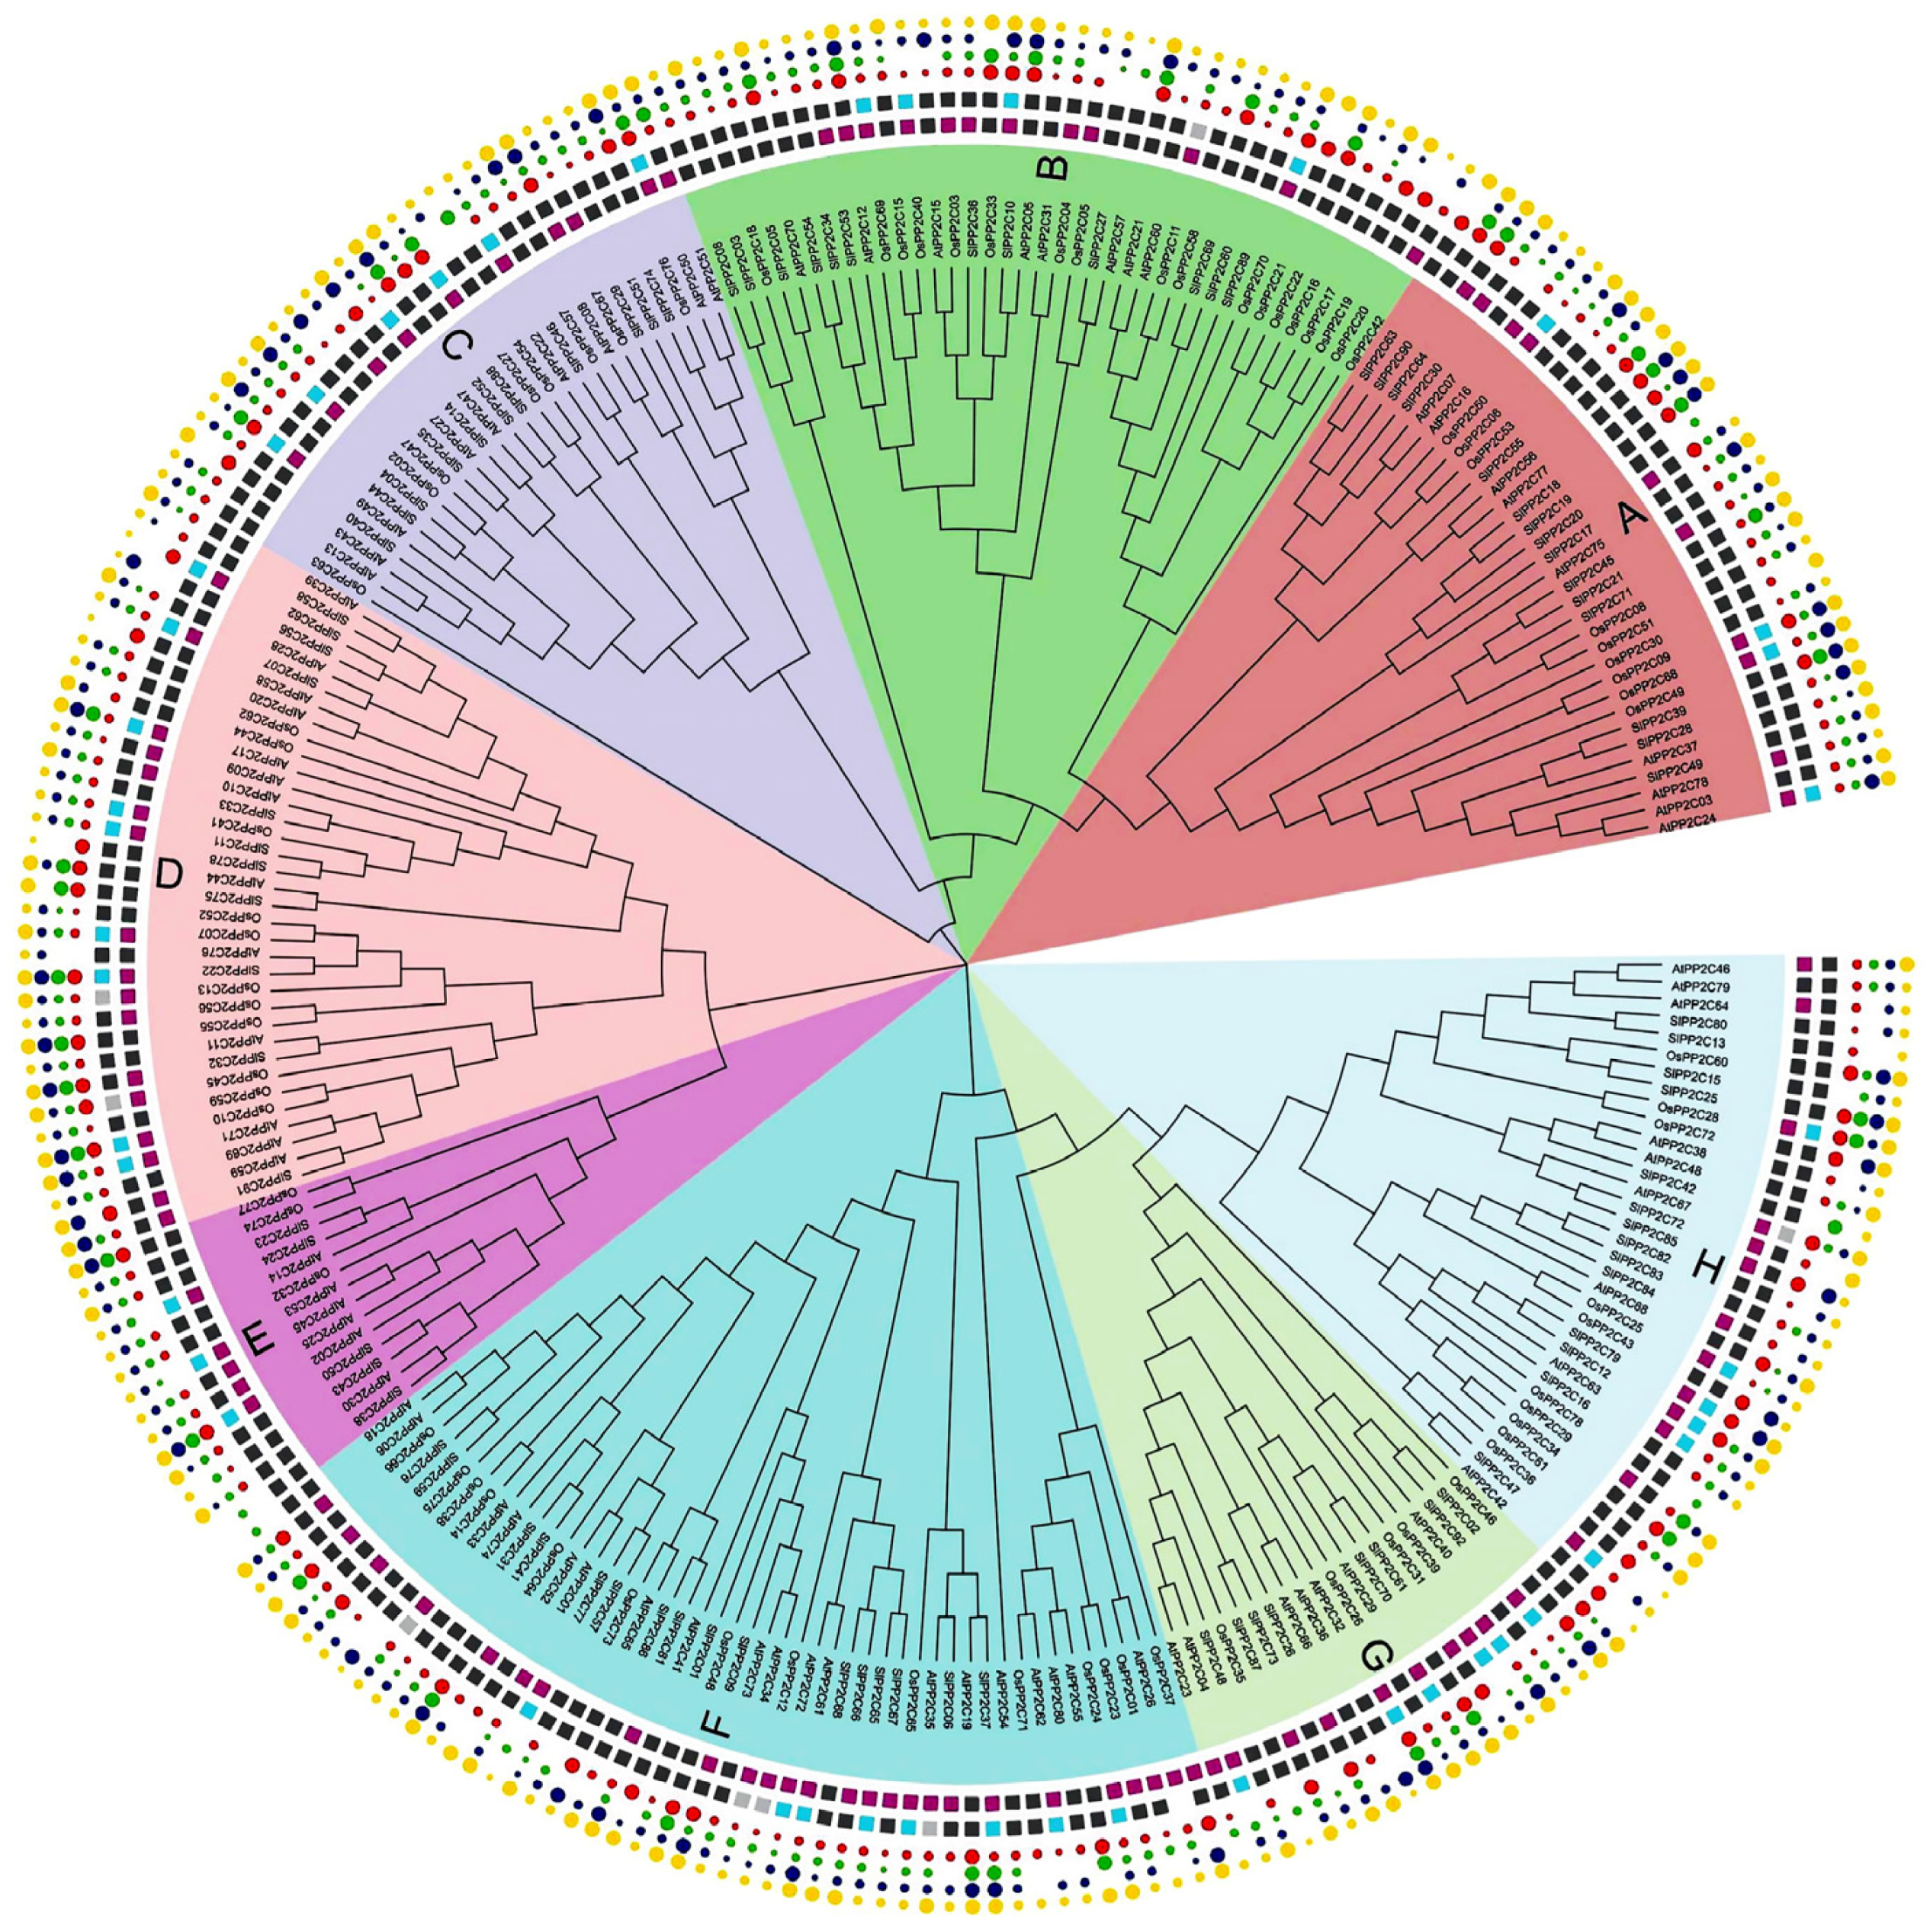
To gain insights into the evolutionary relationship within the PP2C gene family in Arabidopsis, rice, and tomato, an unrooted phylogenetic tree was structured with the amino acid of 78 OsPP2Cs of rice, 80 AtPP2Cs of Arabidopsis, and 92 SlPP2Cs of tomato using the MEGA-X by the adopting maximum likelihood (ML) approach (Supplementary Table S3). The findings of the phylogenetic tree depicted that PP2C genes were further divided into eight groups, labeled from A to H, which was also supported by the analyses of SlPP2Cs gene structures and protein motifs. Group F is the largest, with 49 members, while group E is the smallest, with only 14 members (Figure 1, Table 2). The SlPP2Cs showed a species-specific evolutionary classification.
To better understand the difference in evolution and replication events involved in the PP2C gene family, the collinear relationship was analyzed in PP2C genes from tomato, rice, and Arabidopsis. The result showed that a total of 63 PP2C members participated in the synteny relationship (Figure 2, Supplementary Table S4). There are 17, 9, and 3 gene pairs represented as collinear in tomato, Arabidopsis, and rice, respectively, and the number of collinear gene pairs between tomato and rice, tomato and Arabidopsis, rice and Arabidopsis were 6, 12, and 5 pairs separately, which showed that PP2C genes of tomato, rice, and Arabidopsis reflected more diversity in evolution, and the number of homologous genes was relatively less (Supplementary Table S5).
Duplication genes and their synonymous (Ks) and nonsynonymous (Ka) substitution rates (Ka/Ks) could reveal the evolutionary relationship and show the kind of selection pressure being encountered. Ka, Ks mutations, and Ka/Ks of 17 syntenic gene pairs of SlPP2C genes were calculated (Table 3, Supplementary Table S6). Commonly, if the value of Ka/Ks < 1, the duplicated gene pairs may evolve from purifying selection (also called negative selection); Ka/Ks = 1 means neutral selection; while Ka/Ks > 1 means positive selection [60]. The result proposed that 17 pairs of SlPP2Cs duplicated genes represented less than 1.00, suggesting that all duplicated SlPP2C genes have evolved mainly from purifying selection. We also calculated the divergence time (as T = Ks/2λ) among 17 pairs of duplicated SlPP2C genes based on a clock-like rate of 1.5 × 10⁻⁸ mutations per synonymous site per year, as proposed previously [61]. The result in Table 2 showed that divergence events of duplicated SlPP2C genes were estimated to have occurred around 2.33–73.33 Mya (million years ago). The average divergence time among these genes is 31.59 MYA.
3.3. Chromosomal Localization and Duplication of SlPP2C Genes
The 92 SlPP2C genes were mapped with the published chromosomes of the tomato genome to identify their distribution (Figure 3). They are scattered on 11 of the 12 chromosomes. Macroscopically, these SlPP2Cs were unevenly distributed across these chromosomes and mostly existed in the form of gene clusters. High-density regions harboring PP2Cs were found in chromosomes 01, 03, 06, 08, and 10 and discretely distributed in chromosomes 02, 04, 05, 07, 09, and 12. The most and the least SlPP2Cs were distributed on chromosome 03 (14 SlPP2C genes, accounting for 15.22%) and chromosome 02 (3 SlPP2C genes: 3.26%).
Previous studies in rice, Arabidopsis, and B. distachyon showed that PP2C gene families mainly expanded by whole-genome and chromosomal segment duplication [14,33]. Closely related genes located within a distance of fewer than 200 kb on the same chromosome are defined as tandem duplications; otherwise, they are segmental duplication [62]. According to this principle, 17 pairs of duplication SlPP2C genes were found to be involved in segmental duplication events and three of them may be involved in tandem duplication. These 17 pairs of duplicated SlPP2C genes are distributed on chromosomes 01, 02, 03, 04, 05, 06, 07, 08, 09, and 10, but not on chromosome 12. These three pairs of tandem duplication are distributed on chromosomes 03, 08, and 10.
3.4. Conserved Motif and Gene Structure of SlPP2Cs
In order to better understand the conservation and diversity of motif compositions and gene structures of SlPP2Cs, the conserved motifs and exon–intron organization of SlPP2Cs were analyzed and a new phylogenetic tree as a reference was also structured (Figure 4). The conserved motifs of SlPP2C proteins were analyzed using the software MEME and 10 distinct conserved motifs were identified (Table 4). In Figure 4A, the number of motifs ranged from 1 to 10 with 15–50 residues in all SlPP2C proteins. Motifs 1, 2, 3, 4, 5, 6, 8, 9, and 10 ubiquitously existed in SlPP2Cs, which showed that these motifs may have similar conserved positions and functions. Interestingly, motif 7 was selectively presented in a few SlPP2Cs, and they all belong to group H. Therefore, motif 7 may have an unusually special role in the process of regulation.
The whole SlPP2Cs gene structures were analyzed using TBtools. As shown in Figure 4B, tomato PP2C gene exon–intron organizations were diverse. The difference in the number of exons (1–20) was apparent for SlPP2Cs. SlPP2C74 was encoded by at least 20 exons which had the largest number of exons, whereas SlPP2C51 only was encoded by one exon. Among the aligned 92 SlPP2C members, 98.91% of them had at least two introns except SlPP2C51 where no introns were found. Furthermore, the members of the same group showed structural similarities, such as intron phase, intron number, and exon length. The result indicated that SlPP2Cs had evolutionary stability and versatility in tomato.
3.5. Cis-Elements in the Promoters of Tomato PP2C Genes
Gene transcription levels were regulated by the interaction of transcription factors with the cis-acting element in the upstream promoter sequences. Therefore, studying the cis-element in the promoter of PP2C genes in the tomato may help decrypt the function of SlPP2C genes. The promoter regions (3 kb upstream ATG) of 92 SlPP2C genes were analyzed using the online software PlantCARE. After excluding the common cis-elements, such as the TATA-box and CAAT-box, the remaining 26 cis-elements can be divided into six parts (Table 5). Then depicted by TBtools (Figure 5, Supplementary Table S7). Eight cis-elements, namely, GT1-motif, G-box, MRE, ACE, 3-AF1 binding site, Sp1, 4cl-CMA2b, and AAAC-motif are associated with light responsiveness. Ten cis-elements, including CGTCA-motif, TGACG-motif, ABRE, TGA-, AuxRR-core, TCA-, SARE, GARE-motif, P-box, and TATC-box are related to hormone induction. Two stress-related elements, including MBS and LTR, are induced by abiotic and biotic stresses. O2-site and MBSI have a connection with growth and development. Moreover, an element called Box III, which is a protein binding site, a regulatory element called MSA-like, and an element circadian-related circadian is found. Clearly, many cis-elements related to abiotic stress in plants were identified at the promoter of PP2C gene, and the promoter of 70 out of 92 PP2C genes had ABRE (cis-element involved in the ABA responsiveness), indicating that PP2Cs played a decisive role in abiotic stress resistance via ABA response.
3.6. Expression of SlPP2C Genes in Different Tomato Tissues
The processes that SlPP2C genes may be involved in tomato growth and development were studied. The RNA-seq data of 10 tissues/stages, including roots, leaves, flowers, flower buds, 1, 2, and 3 cm fruits, mature green fruits, breaker fruits, and fruits on day 10 after breaking in Heinz were downloaded from TFGD to analyze the tissue expression pattern of SlPP2Cs (Supplementary Table S8). As shown in Figure 6, SlPP2Cs have different expression levels in different tissues and stages, 17 genes, including SlPP2C04, SlPP2C10, SlPP2C11, SlPP2C13, SlPP2C22, SlPP2C30, SlPP2C31, SlPP2C32, SlPP2C39, SlPP2C55, SlPP2C58, SlPP2C60, SlPP2C78, SlPP2C79, SlPP2C80, SlPP2C90, and SlPP2C91 were highly expressed in all tissues/stages. By contrast, 14 genes, including SlPP2C03, SlPP2C07, SlPP2C08, SlPP2C12, SlPP2C17, SlPP2C18, SlPP2C19, SlPP2C23, SlPP2C24, SlPP2C26, SlPP2C62, SlPP2C68, SlPP2C69, and SlPP2C71, showed low expression levels in all tissues/stages. The expression patterns of the other SlPP2Cs showed different patterns of temporal and tissue-specific expressions. SlPP2C67 was highly expressed in roots and SlPP2C91 accumulated in the buds. SlPP2C27 and SlPP2C39 were expressed in leaves. In addition, four genes named SlPP2C09, SlPP2C13, SlPP2C30, and SlPP2C91 were abundant in fully opened flowers. SlPP2C58 was highly expressed in break fruit and +10 break fruit. Intriguingly, these genes indicated a possible role in the organ development of tomato.
3.7. Transcriptional Profiling of SlPP2C Genes of Tomato Infected with Ralstonia solanacearum
R. solanacearum, originally named Pseudomonas solanacearum, is a destructive soil-borne plant pathogen [63]. With strong environmental adaptability and a wide host range, it can cause lethal wilting diseases of 200 plant species [63], ranking second among the 10 most harmful plant pathogenic bacteria worldwide [64]. Many important economic crops in China such as peanut, potato, tomato, tobacco, and banana are deeply affected by this pathogen [63]. Therefore, we sequenced the stem of tomato infected with R. solanacearum. RNA-seq data were drawn into a heat map to further examine the expression patterns of SlPP2C genes under R. solanacearum infection treatment. In Figure 7, under R. solanacearum-infection condition, a total of 65 SlPP2C genes (70.65%) were found (Supplementary Table S9), nine SlPP2C genes (SlPP2C28, SlPP2C38, SlPP2C40, SlPP2C43, SlPP2C44, SlPP2C48, SlPP2C50, SlPP2C89, SlPP2C92) were obviously upregulated and three SlPP2C genes (SlPP2C14, SlPP2C27, and SlPP2C36) were obviously downregulated. This indicated that the function of SlPP2Cs might be related to R. solanacearum resistance.
3.8. Analysis of SlPP2C Gene Expression in Tomato under Ralstonia solanacearum Infection
To further analyze the function of these gene families, qRT-PCR was used to investigate the expression of PP2C genes in tomato under R. solanacearum treatment. Based on the transcriptome data available in our laboratory, six upregulated and three downregulated expression genes were chosen. As shown in Figure 8, under R. solanacearum treatment, the expression levels of all five PP2C genes (SlPP2C28, SlPP2C38, SlPP2C43, SlPP2C48, and SlPP2C92) have varying degrees of increasing, the expression of SlPP2C40 change is not significant, but that of all three PP2C genes (SlPP2C14, SlPP2C27, and SlPP2C36) significantly decreased. This is mostly consistent with our transcriptome data. The small difference may be due to the inconsistency between the RNA-seq and qRT-PCR samples. The above transcriptome and qRT-PCR data indicated that the PP2C gene may play an important role in resistance to plant pathogen infection. Therefore, these genes are worthy of further functional verification experiments.
4. Discussion
The PP2C gene family is one of the most significant gene families that plays a vital role in response to stresses such as drought, salt, alkali, fungal pathogens as well as in plant development [65]. Previously, many studies have been carried out on the functional analysis of PP2C genes in Arabidopsis [66] and tobacco [67]. To date, many PP2Cs have already been identified in maize [7], rice [33], wheat [34], Arabidopsis [33], hot pepper [68], woodland strawberry [35], and Medicago truncatula [69] using advanced techniques of bioinformatics. In this study, a comprehensive genome-wide analysis of the SlPP2Cs gene family was performed, including gene identification, phylogenetic relationships, evolutionary analysis, synteny relationships, chromosomal localizations, gene structures, conserved domains, and motifs. In addition, gene expression patterns of some key SlPP2C genes were also determined under pathogen stress conditions. Herein, a total of 92 SlPP2C genes were identified.
4.1. Evolution of the SlPP2C Gene Family
PP2Cs have been evolutionarily conserved from prokaryotes to higher eukaryotes. Compared to other gene families, the PP2C gene family is one of the largest families in the plant kingdom. In lower plants, such as Chlamydomonas reinhardtii, Physcomitrella patens, and Selaginella tamariscina, the PP2C gene family members are much less common than those in higher plants. The increase in the diversity and the total number of PP2C genes from lower plants to higher plants may correlate with adaptations to the environmental stresses [70].
Gene duplication is one of the main driving forces of biological evolution [71], and it may contribute to the diversity of SlPP2C. The prediction of evolutionary patterns by calculating Ka/Ks provides information about the type of selection, such as purifying, positive, and neutral selection of gene pairs during divergence [72]. In this study, 17 SlPP2C tandem repeat gene pairs were identified. Ka/Ks of these tandem repeats were calculated. The result showed that Ka/Ks for 17 pairs of duplicated SlPP2C genes was <1, suggesting that all duplicated SlPP2C genes have evolved mainly from purifying selection. This conclusion was mutually corroborated with the fact that the members of the SlPP2C gene family were conserved. In evolution, most of the genes copied from SlPP2Cs are adjacent to parental genes. Furthermore, for divergence time, we further utilized Ks values. The divergence time ranged from 0.07 to 2.2 (Ks values) and the mean duplication time is 31.59 MYA of these paralogous genes, which suggested that their divergence occurred later than the divergence time of Arabidopsis (about 16.1 MYA) [35]. The findings of our study demonstrated that Arabidopsis AtPP2Cs duplication time is much earlier than that of tomato SlPP2C. Therefore, the functional study of AtPP2Cs in Arabidopsis can provide a research basis for the study of SlPP2C.
4.2. Expression of SlPP2Cs
Environmental conditions cannot always maintain the optimal state needed for plant growth without artificial control. Therefore, plants are constantly challenged by a variety of environmental abiotic stress factors, such as drought, salt, high/low temperature, and biological stresses. These stresses seriously affect the yield and quality of tomato [73,74]. Until now, molecular mechanisms of plant responses to the above stress have been extensively studied. Plant hormones, such as ABA, SA, and GA, play a vital role in the ability of plants to cope with abiotic stresses by mediating growth, development, nutrient allocation, and source/sink transitions [75]. Among these, the significance of ABA signaling is well-documented in stress-adaptive modifications and stress resistance mechanisms. All PP2C group A genes in rice could be induced by ABA, and their relative expression levels were increased under high salt and low temperature treatment [33]. In Arabidopsis ABI1, ABI2, HAB1, HAB2, AHG1, and PP2C-A have reported encoding in ABA signaling networks [76,77,78,79,80]. Previous studies reported that PP2C regulates positively against salt tolerance in Arabidopsis and drought in peach to modulate the stress severity [81,82]. For example, the Arabidopsis AtPP2CG1 positively modulates the abiotic stresses, including salt, drought, and ABA [81]. The ZmPP2C-A10 gene has a negative regulatory role in maize response to drought stress [23]. Moreover, not all PP2C genes have a similar response to abiotic stresses. In Arabidopsis, two members of PP2C genes responded differently, such as AP2C1 expression was strongly induced by cold, drought, and wounding, but AP2C2 was slightly influenced under the same treatments, suggesting their functional diversity [83]. Arabidopsis PP2C-D is mainly expressed in the roots, while the wild soybean PP2C-D is mainly expressed in the stem. Therefore, the wild soybean PP2C-D and Arabidopsis PP2C-D have different regulatory roles in different stress. Some PP2C-D in wild and cultivated soybean are involved in different signal transduction pathways; thus, adapting to different resistance mechanisms [84]. These findings highlighted the significance of the PP2C gene family. Aiming to obtain gene expression patterns of SlPP2C, we downloaded the previously reported RNA-sequence data and analyzed the expression profile of PP2C genes. By comparing PP2C gene transcription profiling in 10 tissues/stages, including leaves, roots, flowers, flower buds, 1, 2, and 3 cm fruits, mature green fruits, breaker fruits, and fruits on day 10 after breaking, the expression of all the SlPP2C genes showed diverse tissue-specific patterns, such as some of the genes were highly expressed in all the tissues, while some expressed only in one and/or two tissues, intimating that SlPP2C proteins may play multiple roles in plants. Thus, their functions are worthy of further study.
The yield of crops is largely affected by different types of biotic stresses [85]. Many abiotic stress conditions have been shown to weaken the defense mechanism of plants and enhance their sensitivity to pathogen infection [86,87]. Thus, finding resistance genes that can resist pathogen infection is very important to improve crop yield. Previous studies have shown that PP2C proteins play multiple roles in plants. In the case of tomato infected with R. solanacearum, RNA-seq and expression pattern of some SlPP2Cs were explored. R. solanacearum is a devastating soil-borne plant pathogen that brings serious losses to tomato production [63]. In our study, nine SlPP2C genes were upregulated under R. solanacearum infection treatment, showing that the SlPP2C gene family was indeed closely related to R. solanacearum. However, understanding whether or not each gene plays a critical role in abiotic stress tolerance still requires functional characterization of individual genes.
4.3. Possible Function of SlPP2Cs
The combination of our research and previous studies revealed that SlPP2Cs might have a variety of functions. The subcellular localization indicated that SlPP2Cs mainly had enzyme catalytic function in the cytoplasm and a few of them appeared in other cellular compartments, which may take part in other biochemical processes. For example, AtAPD7, an Arabidopsis PP2C protein, widely acted in the nucleus and cytoplasm of root cells and cytoplasm of mesophyll protoplasts [88]. OsSIPP2C1 was located in the nucleus and it was negatively regulated by ABL1 which could respond to abiotic stresses and regulate panicle development in rice [89]. The cis-element analysis revealed that there were many light response elements in the promoter regions of SlPP2C genes, such as sp1, G-box, ACE, and 3-AF1 binding sites. Among them, G-box appeared in 70 out of 92 SlPP2Cs, which may have an important influence on regulating tomato accumulation dry matter by light and action. Furthermore, a large number of stress- and hormone-related elements were also found, such as ABA-responsive elements (ABREs) that are responsive to ABA, drought, or salt signals [90], LTR is involved in low-temperature response and regulation [91], TCA-element and CGTCA-motif have good correlation with the expression levels after MeJA and SA treatment [92], respectively. Further elucidating the predicated and the possible functions of SlPP2C genes in transcriptional regulation, the result represented significant variation among SlPP2C genes and was mostly responsive to R. solanacearum. Therefore, PP2C genes play a very important role in abiotic stress or biotic stress. It is of great research significance.
5. Conclusions
In this study, the PP2C gene family in tomato was classified and general analysis of the 92 members in this family was carried out including the proteins’ physical and chemical properties, subcellular localization, evolutionary relationship, gene duplication, environmental pressure, gene structure, conserved domains, cis-acting elements, conserved motifs, and expression patterns. Most of them showed tissue and developmental stage-specific expression profiles, and some of them can be induced by biotic stress (R. solanacearum), indicating that the SlPP2Cs play an important role in plants. The results of this study laid a foundation for more in-depth genetic transformation and gene function analysis and were necessary to advance research on the stress resistance of tomato. In summary, the integration of our findings has provided a novel insight and unique features of SlPP2C genes, which is also important for accelerating the cloning of stress resistance genes in tomato.
Supplementary Materials
The following supporting information can be downloaded at: https://www.mdpi.com/article/10.3390/genes13040604/s1, Supplementary Table S1: List of primers used for RT-PCR; Supplementary Table S2: The PP2C genes ID were submitted into SGN; Supplementary Table S3: The PP2C gene family of Arabidopsis and rice; Supplementary Table S4: Total number of PP2C genes participating in the synteny relationship; Supplementary Table S5: The syntenic PP2C gene pairs in tomato, Arabidopsis, rice, and between them; Supplementary Table S6: KaKs of all SlPP2Cs tandem repeat gene pairs; Supplementary Table S7: Cis-elements identified in the promoters of SlPP2Cs; Supplementary Table S8: Expression of PP2C genes in different Henzi tomato tissues; Supplementary Table S9: Information of probe sets used for microarray expression analysis.
Author Contributions
The work presented here was carried out in collaboration between all authors. Conceptualization, J.Q., L.N. and X.Z.; methodology, X.Z.; software, J.Q., L.N. and X.X.; validation, J.Q.; formal analysis, J.Q. and L.N.; investigation, J.Q.; resources, J.Q. and L.N.; data curation, X.X., S.C., Y.Z., M.L. (Min Lang), M.L. (Mengyu Li) and B.L.; writing—original draft preparation, J.Q. and L.N.; writing—review and editing, J.Q., L.N. and X.Z.; visualization, J.Q.; supervision, X.Z., J.L. and Y.P.; project administration, X.Z.; funding acquisition, X.Z. All authors have read and agreed to the published version of the manuscript.
Funding
This research was funded by the National Natural Science Foundation of China grant number (#31872119).
Data Availability Statement
Not applicable.
Conflicts of Interest
The authors declare no conflict of interest.
References
- Long, L.; Gao, W.; Xu, L. GbMPK3, a mitogen-activated protein kinase from cotton, enhances drought and oxidative stress tolerance in tobacco. Plant Cell Tissue Organ Cult. 2014, 116, 153–162. [Google Scholar] [CrossRef]
- Sheng, L. Protein phosphatases and signaling cascades in higher plants. Trends Plant Sci. 1998, 3, 271–275. [Google Scholar]
- Mizoguchi, T.; Ichimura, K.; Shinozaki, K. Environmental stress response in plants: The role of mitogen-activated protein kinases. Trends Biotechnol. 1997, 15, 15–19. [Google Scholar] [CrossRef]
- Boudsocq, M.; Barbier-Brygoo, H.; Lauriere, C. Identification of nine sucrose nonfermenting 1-related protein kinases 2 activated by hyperosmotic and saline stresses in Arabidopsis thaliana. J. Biol. Chem. 2004, 279, 41758–41766. [Google Scholar] [CrossRef] [Green Version]
- Ma, S.Y.; Wu, W.H. AtCPK23 functions in Arabidopsis responses to drought and salt stresses. Plant Mol. Biol. 2007, 65, 511–518. [Google Scholar] [CrossRef]
- Franz, S.; Ehlert, B.; Liese, A.; Kurth, J.; Cazalé, A.C.; Romeis, T. Calcium-dependent protein kinase CPK21 functions in abiotic stress response in Arabidopsis thaliana. Mol. Plant 2011, 4, 83–96. [Google Scholar] [CrossRef]
- Wei, K.; Pan, S. Maize protein phosphatase gene family: Identification and molecular characterization. BMC Genom. 2014, 15, 773. [Google Scholar] [CrossRef] [Green Version]
- Kerk, D.; Templeton, G.; Moorhead, G.B. Evolutionary radiation pattern of novel protein phosphatases revealed by analysis of protein data from the completely sequenced genomes of humans, green algae, and higher plants. Plant Physiol. 2008, 146, 351–367. [Google Scholar] [CrossRef] [Green Version]
- Cohen, P. The structure and regulation of protein phosphatases. Annu. Rev. Biochem. 1989, 58, 453–508. [Google Scholar] [CrossRef]
- Singh, A.; Pandey, A.; Srivastava, A.K.; Tran, L.S.; Pandey, G.K. Plant protein phosphatases 2C: From genomic diversity to functional multiplicity and importance in stress management. Crit. Rev. Biotechnol. 2016, 36, 1023–1035. [Google Scholar] [CrossRef]
- Chae, L.; Pandey, G.K.; Luan, S.; Cheong, Y.H.; Kim, K. Protein kinases and phosphatases for stress signal transduction in plants. In Abiotic Stress Adaptation in Plants; Springer: Berlin/Heidelberg, Germany, 2010; pp. 123–163. [Google Scholar]
- Mackintosh, C.; Coggins, J.; Cohen, P. Plant protein phosphatases. subcellular distribution, detection of protein phosphatase 2C and identification of protein phosphatase 2A as the major quinate dehydrogenase phosphatase. Biochem. J. 1991, 273, 733–738. [Google Scholar] [CrossRef] [Green Version]
- Schweighofer, A.; Hirt, H.; Meskiene, I. Plant PP2C phosphatases: Emerging functions in stress signaling. Trends Plant Sci. 2004, 9, 236–243. [Google Scholar] [CrossRef]
- Cao, J.; Jiang, M.; Li, P.; Chu, Z. Genome-wide identification and evolutionary analyses of the PP2C gene family with their expression profiling in response to multiple stresses in Brachypodium distachyon. BMC Genom. 2016, 17, 175. [Google Scholar] [CrossRef] [Green Version]
- Singh, A.; Giri, J.; Kapoor, S.; Tyagi, A.K.; Pandey, G.K. Protein phosphatase complement in rice: Genome-wide identification and transcriptional analysis under abiotic stress conditions and reproductive development. BMC Genom. 2010, 11, 435. [Google Scholar] [CrossRef] [Green Version]
- Sugimoto, H.; Kondo, S.; Tanaka, T.; Imamura, C.; Muramoto, N.; Hattori, E.; Ogawa, K.; Mitsukawa, N.; Ohto, C. Overexpression of a novel Arabidopsis PP2C isoform, AtPP2CF1, enhances plant biomass production by increasing inflorescence stem growth. J. Exp. Bot. 2014, 65, 5385–5400. [Google Scholar] [CrossRef] [Green Version]
- Manohar, M.; Wang, D.; Manosalva, P.M.; Choi, H.W.; Kombrink, E.; Klessig, D.F. Members of the abscisic acid co-receptor PP2C protein family mediate salicylic acid –abscisic acid crosstalk. Plant Direct 2017, 1, e00020. [Google Scholar] [CrossRef] [Green Version]
- Komatsu, K.; Suzuki, N.; Kuwamura, M.; Nishikawa, Y.; Nakatani, M.; Ohtawa, H.; Takezawa, D.; Seki, M.; Tanaka, M.; Taji, T.; et al. Group A PP2Cs evolved in land plants as key regulators of intrinsic desiccation tolerance. Nat. Commun. 2013, 4, 2219. [Google Scholar] [CrossRef] [Green Version]
- Rodriguez, P.L.; Leube, M.P.; Grill, E. Molecular cloning in Arabidopsis thaliana of a new protein phosphatase 2C (PP2C) with homology to ABI1 and ABI2. Plant Mol. Biol. 1998, 38, 879–883. [Google Scholar] [CrossRef]
- Gosti, F.; Beaudoin, N.; Serizet, C.; Webb, A.A.; Vartanian, N.; Giraudat, J. ABI1 protein phosphatase 2C is a negative regulator of abscisic acid signaling. Plant Cell 1999, 11, 1897–1910. [Google Scholar] [CrossRef] [Green Version]
- Merlot, S.; Gosti, F.; Guerrier, D.; Vavasseur, A.; Giraudat, J. The ABI1 and ABI2 protein phosphatases 2C act in a negative feedback regulatory loop of the abscisic acid signalling pathway. Plant J. 2010, 25, 295–303. [Google Scholar] [CrossRef]
- Zhang, Y.; Li, Q.; Jiang, L.; Kai, W.; Liang, B.; Wang, J.; Du, Y.; Zhai, X.; Wang, J.; Zhang, Y.; et al. Suppressing type 2C protein phosphatases alters fruit ripening and the stress response in tomato. Plant Cell Physiol. 2018, 59, 142–154. [Google Scholar] [CrossRef] [Green Version]
- Xiang, Y.; Sun, X.; Gao, S.; Qin, F.; Dai, M. Deletion of an endoplasmic reticulum stress response element in a ZmPP2C-A gene facilitates drought tolerance of maize seedlings. Mol. Plant 2017, 10, 456–469. [Google Scholar] [CrossRef] [Green Version]
- Arshad, M.; Mattsson, J. A putative poplar PP2C-encoding gene negatively regulates drought and abscisic acid responses in transgenic Arabidopsis thaliana. Trees 2014, 28, 531–543. [Google Scholar] [CrossRef]
- Wang, Y.; Chen, P.; Sun, L.; Li, Q.; Dai, S.; Sun, Y. Transcriptional regulation of PaPYLs, PaPP2Cs and PaSnRK2s during sweet cherry fruit development and in response to abscisic acid and auxin at onset of fruit ripening. Plant Growth Regul. 2015, 75, 455–464. [Google Scholar] [CrossRef]
- Zhang, F.; Wei, Q.; Shi, J.; Jin, X.; He, Y.; Zhang, Y.; Luo, Q.; Wang, Y.; Chang, J.; Yang, G.; et al. Brachypodium distachyon BdPP2CA6 interacts with BdPYLs and BdSnRK2 and positively regulates salt tolerance in transgenic Arabidopsis. Front. Plant Sci. 2017, 8, 264. [Google Scholar] [CrossRef] [Green Version]
- Schweighofer, A.; Kazanaviciute, V.; Scheikl, E.; Teige, M.; Doczi, R.; Hirt, H.; Schwanninger, M.; Kant, M.; Schuurink, R.; Mauch, F.; et al. The PP2C-type phosphatase AP2C1, which negatively regulates MPK4 and MPK6, modulates innate immunity, jasmonic acid, and ethylene levels in Arabidopsis. Plant Cell 2007, 19, 2213–2224. [Google Scholar] [CrossRef] [Green Version]
- Shubchynskyy, V.; Boniecka, J.; Schweighofer, A.; Simulis, J.; Kvederaviciute, K.; Stumpe, M.; Mauch, F.; Balazadeh, S.; Mueller-Roeber, B.; Boutrot, F.; et al. Protein phosphatase AP2C1 negatively regulates basal resistance and defense responses to Pseudomonas syringae. J. Exp. Bot. 2017, 68, 1169–1183. [Google Scholar]
- Sidonskaya, E.; Schweighofer, A.; Shubchynskyy, V.; Kammerhofer, N.; Hofmann, J.; Wieczorek, K.; Meskiene, I. Plant resistance against the parasitic nematode Heterodera schachtii is mediated by MPK3 and MPK6 kinases, which are controlled by the MAPK phosphatase AP2C1 in Arabidopsis. J. Exp. Bot. 2016, 67, 107–118. [Google Scholar] [CrossRef] [Green Version]
- Umbrasaite, J.; Schweighofer, A.; Kazanaviciute, V.; Magyar, Z.; Ayatollahi, Z.; Unterwurzacher, V.; Choopayak, C.; Boniecka, J.; Murray, J.A.; Bogre, L.; et al. MAPK phosphatase AP2C3 induces ectopic proliferation of epidermal cells leading to stomata development in Arabidopsis. PLoS ONE 2010, 5, 15357. [Google Scholar] [CrossRef] [Green Version]
- Tovar-Mendez, A.; Miernyk, J.A.; Hoyos, E.; Randall, D.D. A functional genomic analysis of Arabidopsis thaliana PP2C clade D. Protoplasma 2014, 251, 265–271. [Google Scholar] [CrossRef]
- Min, W.L.; Jelenska, J.; Greenberg, J.T. Arabidopsis proteins important for modulating defense responses to Pseudomonas syringae that secrete HopW1-1. Plant J. 2010, 54, 452–465. [Google Scholar]
- Xue, T.; Wang, D.; Zhang, S. Genome-wide and expression analysis of protein phosphatase 2C in rice and Arabidopsis. BMC Genom. 2008, 9, 550. [Google Scholar] [CrossRef] [PubMed] [Green Version]
- Yu, X.; Han, J.; Wang, E.; Xiao, J.; Hu, R.; Yang, G.; He, G. Genome-wide identification and homoeologous expression analysis of PP2C genes in wheat (Triticum aestivum L.). Front. Genet. 2019, 10, 561. [Google Scholar] [CrossRef] [PubMed] [Green Version]
- Haider, M.S.; Khan, N.; Pervaiz, T.; Zhongjie, L.; Nasim, M.; Jogaiah, S.; Mushtaq, N.; Jiu, S.; Jinggui, F. Genome-wide identification, evolution, and molecular characterization of the PP2C gene family in woodland strawberry. Gene 2019, 702, 27–35. [Google Scholar] [CrossRef]
- Khan, N.; Ke, H.; Hu, C.M.; Naseri, E.; Haider, M.S.; Ayaz, A.; Amjad, K.W.; Wang, J.; Hou, X. Genome-wide identification, evolution, and transcriptional profiling of PP2C gene family in Brassica rapa. BioMed Res. Int. 2019, 2019, 2965035. [Google Scholar] [CrossRef] [Green Version]
- Hosmani, P.S.; Flores-Gonzalez, M.; van de Geest, H.; Maumus, F.; Bakker, L.V.; Schijlen, E.; van Haarst, J.; Cordewener, J.; Sanchez-Perez, G.; Peters, S.; et al. An improved de novo assembly and annotation of the tomato reference genome using single-molecule sequencing, Hi-C proximity ligation and optical maps. bioRxiv 2019, 767764. [Google Scholar] [CrossRef]
- Wang, Y.F.; Liao, Y.Q.; Wang, Y.P. Genome-wide identification and expression analysis of StPP2C gene family in response to multiple stresses in potato (Solanum tuberosum L.). J. Integr. Agric. 2020, 19, 1609–1624. [Google Scholar] [CrossRef]
- Jaina, M.; Sara, C.; Lowri, W. Pfam: The protein families database in 2021. Nucleic Acids Res. 2021, 49, 412–419. [Google Scholar]
- Potter, S.C.; Luciani, A.; Eddy, S.R.; Park, Y.; Lopez, R.; Finn, R.D. HMMER web server: 2018 update. Nucleic Acids Res. 2018, 1, 200–204. [Google Scholar] [CrossRef] [Green Version]
- Fernandez-Pozo, N.; Menda, N.; Edwards, J.D.; Saha, S.; Tecle, I.Y.; Strickler, S.R.; Bombarely, A.; Fisher-York, T.; Pujar, A.; Foerster, H.; et al. The Sol Genomics Network (SGN)—From genotype to phenotype to breeding. Nucleic Acids Res. 2015, 43, 1036–1041. [Google Scholar] [CrossRef]
- Letunic, I.; Khedkar, S.; Borkm, P. SMART: Recent updates, new developments and status in 2020. Nucleic Acids Res. 2021, 49, 458–460. [Google Scholar] [CrossRef]
- Lu, S.; Wang, J.; Chitsaz, F.; Derbyshire, M.K.; Geer, R.C.; Gonzales, N.R.; Gwadz, M.; Hurwitz, D.I.; Marchler, G.H.; Song, J.S.; et al. CDD/SPARCLE: The conserved domain database in 2020. Nucleic Acids Res. 2019, 48, 265–268. [Google Scholar] [CrossRef] [Green Version]
- Duvaud, S.; Gabella, C.; Lisacek, F.; Stockinger, H.; Ioannidis, V.; Durinx, C. Expasy, the swiss bioinformatics resource portal, as designed by its users. Nucleic Acids Res. 2021, 49, 216–227. [Google Scholar] [CrossRef]
- Chou, K.C.; Shen, H.B. Plant-mPLoc: A top-down strategy to augment the power for predicting plant protein subcellular localization. PLoS ONE 2010, 5, e11335. [Google Scholar] [CrossRef] [Green Version]
- Hung, J.H.; Weng, Z. Sequence alignment andhomology search with BLAST and ClustalW. Cold Spring Harb. Protoc. 2016, 11, pdb–rot093088. [Google Scholar]
- Kumar, S.; Stecher, G.; Li, M.; Knyaz, C.; Tamura, K. MEGA X: Molecular Evolutionary genetics analysis across computing platforms. Mol. Biol. Evol. 2018, 6, 1547–1549. [Google Scholar] [CrossRef]
- Gu, Z.; Cavalcanti, A.; Chen, F.C.; Bouman, P.; Li, W.H. Extent of gene duplication in the genomes of drosophila, nematode, and yeast. Mol. Biol. Evol. 2002, 3, 256–262. [Google Scholar] [CrossRef] [Green Version]
- Zhang, Z. KaKs_calculator 3.0: Calculating selective pressure on coding and non-coding sequences. Genom. Proteom. Bioinform. 2022. [Google Scholar] [CrossRef]
- Chen, C.; Chen, H.; Zhang, Y.; Thomas, H.R.; Frank, M.H.; He, Y.; Xia, R. TBtools: An integrative toolkit developed for interactive analyses of big biological data. Mol. Plant 2020, 13, 1194–1202. [Google Scholar] [CrossRef]
- Hu, B.; Jin, J.; Guo, A.Y.; Zhang, H.; Luo, J.; Gao, G. GSDS 2.0: An upgraded gene feature visualization server. Bioinformatics 2015, 31, 1296–1297. [Google Scholar] [CrossRef] [Green Version]
- Yu, C.P.; Lin, J.J.; Li, W.H. Positional distribution of transcription factor binding sites in Arabidopsis thaliana. Sci. Rep. 2016, 6, 25164. [Google Scholar] [CrossRef]
- Lescot, M.; Déhais, P.; Thijs, G.; Rombauts, S. PlantCARE, a database of plant cis-acting regulatory elements and a portal to tools for in silico analysis of promoter sequences. Nucleic Acids Res. 2002, 30, 325–327. [Google Scholar] [CrossRef]
- Fei, Z.; Je-Gun, J.; Tang, X. Tomato Functional Genomics Database: A comprehensive resource and analysis package for tomato functional genomics. Nucleic Acids Res. 2011, 39, 1156–1163. [Google Scholar] [CrossRef] [Green Version]
- Kelman, A. The relationship of the pathogenicity of Pseudomonas solanacearum to colony appearance on a tetrazolium medium. Phytopathology 1954, 44, 693–695. [Google Scholar]
- Lu, K.; Li, T.; He, J.; Chang, W.; Zhang, R.; Liu, M. qPrimerDB: A thermodynamics-based gene-specific qPCR primer database for 147 organisms. Nucleic Acids Res. 2018, 46, 1229–1236. [Google Scholar] [CrossRef]
- Ding, X.; Li, J.; Pan, Y.; Zhang, Y.; Ni, L.; Wang, Y.; Zhang, X. Genome-wide identification and expression analysis of the UGLcAE gene family in tomato. Int. J. Mol. Sci. 2018, 19, 1583. [Google Scholar] [CrossRef] [Green Version]
- Livak, K.J.; Schmittgen, T.D. Analysis of relative gene expression data using real-time quantitative PCR and the 2-DDCt method. Methods 2001, 25, 402–408. [Google Scholar] [CrossRef]
- Le Berre, M.; Gerlach, J.Q.; Dziembała, I.; Kilcoyne, M. Calculating half maximal inhibitory concentration (IC50) values from glycomics microarray data using GraphPad Prism. Methods Mol. Biol. 2022, 2460, 89–111. [Google Scholar]
- Lynch, M.; Conery, J.S. The evolutionary fate and consequences of duplicate genes. Science 2000, 290, 1151–1155. [Google Scholar] [CrossRef] [Green Version]
- Blanc, G.; Wolfe, K.H. Widespread paleopolyploidy in model plant species inferred from age distributions of duplicate genes. Plant Cell 2004, 16, 1667–1678. [Google Scholar] [CrossRef] [Green Version]
- Cheung, J.; Estivill, X.; Khaja, R.; MacDonald, J.R.; Lau, K.; Tsui, L.C.; Scherer, S.W. Genome-wide detection of segmental duplications and potential assembly errors in the human genome sequence. Genome Biol. 2003, 4, 25. [Google Scholar] [CrossRef] [PubMed] [Green Version]
- Denny, T.P. Ralstonia solanacearum—A plant pathogen in touch with its host. Trends Microbiol. 2000, 8, 486–489. [Google Scholar] [CrossRef]
- Mansfield, J.; Genin, S.; Magori, S.; Citovsky, V.; Sriariyanum, M.; Ronald, P.; Dow, M.; Verdier, V.; Beer, S.V.; Machado, M.A.; et al. Top 10 plant pathogenic bacteria in molecular plant pathology. Mol. Plant Pathol. 2012, 13, 614–629. [Google Scholar] [CrossRef] [Green Version]
- Haider, M.S.; Kurjogi, M.M.; Khalil-Ur-Rehman, M.; Fiaz, M.; Pervaiz, T.; Jiu, S.; Haifeng, J.; Chen, W.; Fang, J. Grapevine immune signaling network in response to drought stress as revealed by transcriptomic analysis. Plant Physiol. Biochem. 2017, 121, 187–195. [Google Scholar] [CrossRef] [PubMed]
- Kerk, D.; Bulgrien, J.; Smith, D.W.; Barsam, B.; Veretnik, S.; Gribskov, M. The complement of protein phosphatase catalytic subunits encoded in the genome of Arabidopsis. Plant Physiol. 2002, 129, 908–925. [Google Scholar] [CrossRef] [PubMed] [Green Version]
- Djami-Tchatchou, A.T.; Maake, M.P.; Piater, L.A.; Dubery, I.A. Isonitrosoacetophenone drives transcriptional reprogramming in Nicotiana tabacum cells in support of innate immunity and defense. PLoS ONE 2015, 10, e0117377. [Google Scholar] [CrossRef] [PubMed] [Green Version]
- Kim, S.; Park, M.; Yeom, S.I. Genome sequence of the hot pepper provides insights into the evolution of pungency in Capsicum species. Nat. Genet. 2014, 46, 270–278. [Google Scholar] [CrossRef]
- Yang, Q.; Liu, K.; Niu, X.; Wang, Q.; Wan, Y.; Yang, F.; Li, G.; Wang, Y.; Wang, R. Genome-wide identification of PP2C genes and their expression profiling in response to drought and cold stresses in Medicago truncatula. Sci. Rep. 2018, 8, 12841. [Google Scholar] [CrossRef] [Green Version]
- Fuchs, S.; Grill, E.; Meskiene, I.; Schweighofer, A. Type 2C protein phosphatases in plants. FEBS J. 2013, 280, 681–693. [Google Scholar] [CrossRef]
- Moore, R.C.; Purugganan, M.D. The early stages of duplicate gene evolution. Proc. Natl. Acad. Sci. USA 2003, 100, 15682–15687. [Google Scholar] [CrossRef] [Green Version]
- Juretic, N.; Hoen, D.R.; Huynh, M.L.; Harrison, P.M.; Bureau, T.E. The evolutionary fate of MULE-mediated duplications of host gene fragments in rice. Genome Res. 2005, 15, 1292–1297. [Google Scholar] [CrossRef] [Green Version]
- Pervez, M.A.; Ayub, C.M.; Khan, H.A.; Shahid, M.A.; Ashraf, I. Effect of drought stress on growth, yield and seed quality of tomato (Lycopersicon esculentum L.). Pak. J. Agric. Sci. 2009, 46, 174–178. [Google Scholar]
- Zhang, P.; Senge, M.; Dai, Y. Effects of salinity stress at different growth stages on tomato growth, yield, and water-use efficiency. Commun. Soil Sci. Plant Anal. 2017, 48, 624–634. [Google Scholar] [CrossRef]
- Peleg, Z.; Blumwald, E. Hormone balance and abiotic stress tolerance in crop plants. Curr. Opin. Plant Biol. 2011, 14, 290–295. [Google Scholar] [CrossRef]
- Rubio, S.; Rodrigues, A.; Saez, A.; Dizon, M.B.; Galle, A.; Kim, T.; Santiago, J.; Flexas, J.; Schroeder, J.I.; Rodriguez, P.L. Triple loss of function of protein phosphatases type 2C leads to partial constitutive response to endogenous abscisic acid. Plant Physiol. 2009, 150, 1345–1355. [Google Scholar] [CrossRef] [Green Version]
- Saez, A.; Apostolova, N.; Gonzalez-Guzman, M.; Gonzalez-Garcia, M.P.; Nicolas, C.; Lorenzo, O.; Rodriguez, P.L. Gain-of-function and loss-of-function phenotypes of the protein phosphatase 2C HAB1 reveal its role as a negative regulator of abscisic acid signalling. Plant J. 2004, 37, 354–369. [Google Scholar] [CrossRef]
- Sun, H.L.; Wang, X.J.; Ding, W.H.; Zhu, S.Y.; Zhao, R.; Zhang, Y.X.; Xin, Q.; Wang, X.F.; Zhang, D.P. Identification of an important site for function of the type2C protein phosphatase ABI2 in abscisic acid signalling in Arabidopsis. J. Exp. Bot. 2011, 62, 5713–5725. [Google Scholar] [CrossRef] [Green Version]
- Allen, G.J.; Kuchitsu, K.; Chu, S.P.; Murata, Y.; Schroeder, J.I. Arabidopsis abi1-1 and abi2-1 phosphatase mutations reduce abscisic acid-induced cytoplasmic calcium rises in guard cells. Plant Cell 1999, 11, 1785–1798. [Google Scholar]
- Kuhn, J.M.; Boisson-Dernier, A.; Dizon, M.B.; Maktabi, M.H.; Schroeder, J.I. The protein phosphatase AtPP2CA negatively regulates abscisic acid signal transduction in Arabidopsis, and effects of abh1 on AtPP2CA mRNA. Plant Physiol. 2006, 140, 127–139. [Google Scholar] [CrossRef] [Green Version]
- Liu, X.; Zhu, Y.; Zhai, H.; Cai, H.; Ji, W.; Luo, X.; Li, J.; Bai, X. AtPP2CG1, a protein phosphatase 2C, positively regulates salt tolerance of Arabidopsis in abscisic acid-dependent manner. Biochem. Biophys. Res. Commun. 2012, 422, 710–715. [Google Scholar] [CrossRef]
- Haider, M.S.; Kurjogi, M.M.; Khalil-Ur-Rehman, M. Drought stress revealed physiological, biochemical and gene-expressional variations in ‘Yoshihime’ peach (Prunus persica L.) cultivar. J. Plant Interact. 2018, 13, 83–90. [Google Scholar] [CrossRef] [Green Version]
- Choopayak, C. Characterization and Functional Analysis of a Novel PP2C Phosphatase AP2C2 from Arabidopsis; University of Vienna: Vienna, Austria, 2008. [Google Scholar]
- Chen, C.; Yu, Y.; Ding, X.; Liu, B.; Duanmu, H.; Zhu, D.; Sun, X.; Cao, L. Genome-wide analysis and expression profiling of PP2C clade D under saline and alkali stresses in wild soybean and Arabidopsis. Protoplasma 2017, 255, 643–654. [Google Scholar] [CrossRef]
- Ali, M.; Javaid, A.; Naqvi, S.H.; Batcho, A.; Kayani, W.K.; Lal, A.; Sajid, I.A.; Nwogwugwu, J.O. Biotic stress triggered small RNA and RNAi defense response in plants. Mol. Biol. Rep. 2020, 47, 5511–5522. [Google Scholar] [CrossRef]
- Atkinson, N.J.; Urwin, P.E. The interaction of plant biotic and abiotic stresses: From genes to the field. J. Exp. Bot. 2012, 63, 3523–3543. [Google Scholar] [CrossRef] [Green Version]
- Suzuki, N.; Rivero, R.M.; Shulaev, V.; Blumwald, E.; Mittler, R. Abiotic and biotic stress combinations. New Phytol. 2014, 203, 32–43. [Google Scholar] [CrossRef]
- Xiao, D.; Cui, Y.; Xu, F.; Xu, X.; Gao, G.; Wang, Y.; Guo, Z.; Wang, D.; Wang, N.N. Senescence-suppressed protein phosphatase directly interacts with the cytoplasmic domain of senescence-associated receptor-like kinase and negatively regulates leaf senescence in Arabidopsis. Plant Physiol. 2015, 169, 1275–1291. [Google Scholar] [CrossRef] [Green Version]
- Li, Y.S.; Sun, H.; Wang, Z.F.; Duan, M.; Huang, S.D.; Yang, J.; Huang, J.; Zhang, H.S. A novel nuclear protein phosphatase 2C negatively regulated by ABL1 is involved in abiotic stress and panicle development in rice. Mol. Biotechnol. 2013, 54, 703–710. [Google Scholar] [CrossRef]
- Li, W.; Cui, X.; Meng, Z.; Huang, X.; Xie, Q.; Wu, H.; Jin, H.; Zhang, D.; Liang, W. Transcriptional regulation of Arabidopsis MIR168a and ARGONAUTE1 homeostasis in ABA and abiotic stress responses. Plant Physiol. 2012, 158, 1279–1292. [Google Scholar] [CrossRef] [Green Version]
- Maestrini, P.; Cavallini, A.; Rizzo, M.; Giordani, T.; Bernardi, R.; Durante, M.; Natali, L. Isolation and expression analysis of low temperature induced genes in white poplar (Populus alba). Plant Physiol. 2009, 166, 1544–1556. [Google Scholar] [CrossRef]
- Wen, F.; Zhu, H.; Li, P.; Jiang, M.; Mao, W.; Ong, C.; Chu, Z. Genome-wide evolutionary characterization and expression analyses of WRKY family genes in Brachypodium distachyon. DNA Res. 2014, 21, 327–339. [Google Scholar] [CrossRef] [Green Version]
Figure 1.
Phylogenetic analysis of the tomato PP2C family. It is based on protein sequence aligned by the ClustalW program. MEGA-X was used to construct a phylogenetic tree with the maximum likelihood method. Different colors indicate different subfamily members according to sequence similarity annotation analysis.

Figure 2.
Duplication event analysis of SlPP2C genes and comparative synteny analysis among tomato, Arabidopsis, and rice, between tomato and Arabidopsis, and between tomato and rice. The red line represents the syntenic gene pairs between rice and Arabidopsis. The blue line indicates the syntenic gene pairs between rice and tomato. The green line represents the syntenic gene pairs between tomato and Arabidopsis. The golden line represents the syntenic gene pairs in tomato. The yellow line represents the syntenic gene pairs in Arabidopsis. The purple line represents the syntenic gene pairs in rice. Tomato chromosomes are depicted as green segments, and Arabidopsis and rice are shown in red and orange, respectively. The chromosome number and syntenic gene pairs are marked. The size of chromosomes was consistent with the actual pseudo-chromosome size. Positions are in Mb.

Figure 3.
Chromosome distribution of tomato PP2C genes. Chromosome localization is based on the physical location (Mb) of 12 tomato chromosomes. Chromosome numbers are displayed at the top of each bar chart. Locations of tomato PP2C genes in chromosomes were obtained from the SGN (http://solgenomics.net (accessed on 5 March 2022)). Grey blocks were represented by the tandem duplicated genes, and the segmentally duplicated genes were linked by red lines. Scale bar on the left indicated the length (Mb) of tomato chromosomes.

Figure 4.
Phylogenetic relationships, conserved motifs of SlPP2C proteins, and structures of SlPP2C genes in tomato. (A) Arrangement of conserved motifs in SlPP2C proteins. Ten predicted motifs were represented by different colored boxes, and motif details referred to Table 3. A-H depicted that PP2C genes were divided into eight groups. Scale bar indicates amino acid length (B) Gene structure of SlPP2C members. The phylogenetic tree was constructed using MEGA-X software and the gene structures were visualized by TBtools. Boxes represented exons, and yellow boxes represented CDS and the upstream and downstream regions of SlPP2C genes were indicated by green boxes. For all genes, black lines represent introns. The sizes of genes can be estimated by the scale at the bottom.

Figure 5.
Identified cis-elements in the promoters of SlPP2C genes. The grey line represents the 2000 bp upstream of the SlPPCs transcription start site. Different colored wedges represent different cis-elements. The length and position of each SlPP2C gene are drawn to scale. Scale bar indicates DNA sequence length.

Figure 6.
Heat map of the expression patterns of SlPP2Cs in 10 tissues/stages. Data of 10 tissues in the TFGD database were collected to reconstruct the expression pattern of SlPP2C genes. Heat map is presented in blue/yellow/red colors that indicate low/medium/high expression, respectively. The result was processed through cluster analysis.

Figure 7.
Expression profiles of SlPP2C genes in tomato roots infected by plant pathogen Ralstonia solanacearum. Blocks with colors represent decreased (blue) or increased (red) transcript levels relative to the control.
Figure 7.
Expression profiles of SlPP2C genes in tomato roots infected by plant pathogen Ralstonia solanacearum. Blocks with colors represent decreased (blue) or increased (red) transcript levels relative to the control.

Figure 8.
Expression of SlPP2C genes under plant pathogen Ralstonia solanacearum infection treatment. Control means untreated plants playing a controlling role. Treatment is R. solanacearum infection treatment plant. Expression of treated plants was compared with that in untreated plants after normalization of values with reference to the tomato β-actin gene and is presented as the relative expression level. All samples were collected from three biological replicates of each treatment at specified intervals. The error bars represent the SEM. ** p < 0.01, *** p < 0.001, **** p < 0.0001, Ns: not significant. The expression patterns of the selected SlPP2C genes were analyzed by qRT-PCR with gene-specific primers (Supplementary Table S8).


Table 1.
Information of the protein phosphatase 2C (PP2C) gene family in tomato.
| Gene | Identifier | Chromosome | AA | PIs/MW | GRAVY | Instability | Subcellular |
|---|---|---|---|---|---|---|---|
| Location | Index | Localization | |||||
| SlPP2C01 | Solyc01g065700.3.1 | chr01: 72,289,658–72,295,088 | 361 | 6.47/39,992.45 | −0.266 | 35.78 | Cyto |
| SlPP2C02 | Solyc01g066870.3.1 | chr01: 750,92,877–75,095,866 | 522 | 5.09/57,125.35 | −0.202 | 42.69 | Cyto |
| SlPP2C03 | Solyc01g067980.1.1 | chr01: 77,027,259–77,032,781 | 202 | 6.19/20,650.27 | −0.001 | 31.43 | Extr. Nucl |
| SlPP2C04 | Solyc01g068000.4.1 | chr01: 77,050,710–77,057,722 | 297 | 4.89/32,913.15 | −0.202 | 54.88 | Nucl |
| SlPP2C05 | Solyc01g079720.3.1 | chr01: 78,822,308–78,843,121 | 613 | 6/68,185.28 | −0.282 | 45.77 | Cyto |
| SlPP2C06 | Solyc01g080400.3.1 | chr01: 79,645,915–79,653,551 | 414 | 4.81/45,150.79 | −0.406 | 46.18 | Nucl |
| SlPP2C07 | Solyc01g087460.3.1 | chr01: 82,424,646–82,428,543 | 372 | 6.17/41,583.98 | −0.655 | 38.39 | Nuc |
| SlPP2C08 | Solyc01g094230.4.1 | chr01: 85,781,740–85,791,508 | 627 | 11.39/64,450.04 | −0.476 | 35.66 | Nucl |
| SlPP2C09 | Solyc01g100040.3.1 | chr01: 90,110,898–90,115,136 | 367 | 6.22/40,919.44 | −0.258 | 38.73 | Nucl |
| SlPP2C10 | Solyc01g100110.4.1 | chr01: 90,196,815–90,202,470 | 427 | 6.91/46,135.74 | −0.146 | 43.86 | Cyto. Nucl |
| SlPP2C11 | Solyc01g105280.3.1 | chr01: 93,506,692–93,513,168 | 283 | 6.8/30,954.82 | −0.426 | 36.53 | Cyto. Nuc |
| SlPP2C12 | Solyc01g107300.4.1 | chr01: 94,888,760–94,892,503 | 278 | 7.79/31,335.87 | −0.128 | 46.13 | Cyto |
| SlPP2C13 | Solyc01g111730.3.1 | chr01: 97,915,696–97,923,710 | 388 | 8.23/42,809.56 | −0.263 | 44.55 | Chlo. Nucl |
| SlPP2C14 | Solyc02g082490.4.1 | chr02: 46,189,450–46193937 | 384 | 5.67/41,815.49 | −0.313 | 50.46 | Nucl |
| SlPP2C15 | Solyc02g083420.3.1 | chr02: 46,831,821–46,836,739 | 390 | 7.74/43,034.89 | −0.226 | 48.53 | Nucl |
| SlPP2C16 | Solyc02g092750.3.1 | chr02: 53,716,175–53,721,010 | 366 | 5.45/40,529.01 | −0.229 | 39.32 | Nucl |
| SlPP2C17 | Solyc03g006930.3.1 | chr03: 1,502,552–1,506,122 | 331 | 6.09/36,843.85 | −0.25 | 59.95 | Cyto |
| SlPP2C18 | Solyc03g006940.3.1 | chr03: 1,509,616–1,512,540 | 345 | 4.95/37,872.93 | −0.185 | 57 | Nucl |
| SlPP2C19 | Solyc03g006950.3.1 | chr03: 1,514,383–1,518,178 | 347 | 6.02/38,049.53 | −0.147 | 53.69 | Nucl |
| SlPP2C20 | Solyc03g006960.4.1 | chr03: 1,519,421–1,523,583 | 304 | 5.7/33,397.94 | −0.255 | 56.99 | Cyto |
| SlPP2C21 | Solyc03g007230.4.1 | chr03: 1,791,778–17,95,346 | 397 | 5.72/43,979.53 | −0.424 | 50.8 | Nucl |
| SlPP2C22 | Solyc03g007270.3.1 | chr03: 1,828,441–1,838,542 | 299 | 4.96/32,489.18 | −0.432 | 43.54 | Nucl |
| SlPP2C23 | Solyc03g013100.1.1 | chr03: 47,516,649–47,518,201 | 114 | 6.51/12,939.8 | −0.337 | 35.03 | Mito |
| SlPP2C24 | Solyc03g013140.1.1 | chr03: 47,332,347–47,334,696 | 163 | 5.81/18,565.16 | −0.428 | 20.18 | Cyto |
| SlPP2C25 | Solyc03g033340.3.1 | chr03: 4,912,004–4,918,389 | 397 | 7.65/43,970.18 | −0.217 | 47.54 | Chlo. Nucl |
| SlPP2C26 | Solyc03g065190.1.1 | chr03: 40,216,058–40,218,346 | 123 | 9.55/14,453 | −0.293 | 32.52 | Cyto. Extr. Nucl |
| SlPP2C27 | Solyc03g082960.2.1 | chr03: 52,814,842–52,820,023 | 395 | 6.29/43,427.5 | −0.203 | 44.71 | Nucl |
| SlPP2C28 | Solyc03g096670.3.1 | chr03: 58,989,562–58,992,297 | 406 | 6/44,683.73 | −0.397 | 52.59 | Cyto. Nucl |
| SlPP2C29 | Solyc03g118890.4.1 | chr03: 67,672,668–67,679,525 | 329 | 6.22/36,093.73 | −0.248 | 42.26 | Cyto |
| SlPP2C30 | Solyc03g121880.4.1 | chr03: 69,911,090–69,918,573 | 548 | 5.86/59,716.58 | −0.095 | 38.86 | Cyto |
| SlPP2C31 | Solyc04g056560.4.1 | chr04: 54,528,741–54,538,177 | 401 | 4.87/43,785.08 | −0.266 | 32.37 | Nucl |
| SlPP2C32 | Solyc04g064500.4.1 | chr04: 55,645,130–55,673,295 | 372 | 4.95/40,544.4 | −0.481 | 45.68 | Nucl |
| SlPP2C33 | Solyc04g074190.3.1 | chr04: 60,189,483–60,198,295 | 278 | 6.32/30,483.44 | −0.345 | 49.68 | Cyto. Nucl |
| SlPP2C34 | Solyc04g079120.3.1 | chr04: 63,704,094–63,711,682 | 428 | 5.28/46,166.21 | −0.296 | 47.94 | Nucl |
| SlPP2C35 | Solyc04g082600.3.1 | chr04: 66,227,666–66,234,622 | 387 | 4.85/42,607.25 | −0.265 | 47.37 | Chlo. Nucl |
| SlPP2C36 | Solyc05g009070.4.1 | chr05: 3,216,982–3,221,083 | 339 | 8.01/37,083.37 | −0.231 | 35.43 | Nucl |
| SlPP2C37 | Solyc05g018300.3.1 | chr05: 20,358,675–20,387,085 | 1080 | 4.81/119,917.55 | −0.203 | 42.53 | Nucl |
| SlPP2C38 | Solyc05g052520.3.1 | chr05: 62,745,936–62,749,176 | 396 | 5.56/42,845.56 | −0.233 | 53.55 | Nucl |
| SlPP2C39 | Solyc05g052980.4.1 | chr05: 63,149,350–63,151,994 | 437 | 5.69/48,147.65 | −0.281 | 52.66 | Nucl |
| SlPP2C40 | Solyc05g053290.3.1 | chr05: 63,421,852–63,425,476 | 411 | 4.73/44,751.23 | −0.109 | 43.03 | Nucl |
| SlPP2C41 | Solyc05g055790.4.1 | chr05: 65,291,032–65,295,556 | 499 | 5.23/55,284.13 | −0.375 | 52.06 | Nucl |
| SlPP2C42 | Solyc05g055980.4.1 | chr05: 65,383,352–65,389,926 | 314 | 6.91/35,158.87 | −0.366 | 43.45 | Chlo. Nucl |
| SlPP2C43 | Solyc06g007190.4.1 | chr06: 1,265,243–1,268,111 | 412 | 7.97/4,4889.01 | −0.182 | 44.84 | Nucl |
| SlPP2C44 | Solyc06g009390.3.1 | chr06: 3,311,448–3,316,710 | 352 | 4.94/38,881.06 | −0.11 | 56.6 | Nucl |
| SlPP2C45 | Solyc06g051940.4.1 | chr06: 35,603,081–35,605,882 | 471 | 5.8/51,885.49 | −0.36 | 43.54 | Nucl |
| SlPP2C46 | Solyc06g065610.3.1 | chr06: 40,985,604–40,992,533 | 375 | 5.59/40,805.91 | −0.342 | 45.11 | Nucl |
| SlPP2C47 | Solyc06g065920.4.1 | chr06: 41,312,022–41,318,633 | 374 | 8.51/41,712.42 | −0.298 | 46.39 | Nucl |
| SlPP2C48 | Solyc06g076100.3.1 | chr06: 47,243,874–47,248,381 | 708 | 5.41/79,199.49 | −0.537 | 38.2 | Nucl |
| SlPP2C49 | Solyc06g076400.3.1 | chr06: 47,471,880–47,474,601 | 410 | 5.12/44,859.67 | −0.346 | 46.42 | Nucl |
| SlPP2C50 | Solyc06g082080.3.1 | chr06: 48,014,366–48,017,179 | 379 | 8.18/40,564.02 | −0.241 | 52.55 | Nucl |
| SlPP2C51 | Solyc06g082700.1.1 | chr06: 48,429,677–48,430,277 | 142 | 6.09/15,813.08 | −0.125 | 26.13 | Cell membrane. Chlo. Cyto |
| SlPP2C52 | Solyc07g007220.3.1 | chr07: 1,956,469–1,961,556 | 383 | 5.07/42,272.7 | −0.264 | 47.32 | Nucl |
| SlPP2C53 | Solyc07g024010.2.1 | chr07: 23,836,770–23,838,030 | 136 | 6.07/15,409.59 | −0.258 | 24.63 | Chlo |
| SlPP2C54 | Solyc07g024020.2.1 | chr07: 23,848,754–23,851,910 | 321 | 5.09/34,819.28 | −0.321 | 40.61 | Nucl |
| SlPP2C55 | Solyc07g040990.4.1 | chr07: 51,484,565–51,489,081 | 536 | 5.38/59,196.43 | −0.267 | 47.81 | Nucl |
| SlPP2C56 | Solyc07g053760.4.1 | chr07: 62,192,070–62,195,463 | 286 | 6.67/31,303.63 | −0.331 | 37.81 | Nucl |
| SlPP2C57 | Solyc07g054300.3.1 | chr07: 62,654,289–62,659,599 | 478 | 5.38/53,166.78 | −0.45 | 44.34 | Nucl |
| SlPP2C58 | Solyc07g062970.3.1 | chr07: 65,595,765–65,600,127 | 282 | 5.67/30,943.93 | −0.327 | 28.7 | Nucl |
| SlPP2C59 | Solyc07g066260.3.1 | chr07: 67,742,920–67,748,833 | 515 | 5.75/56,463.59 | −0.371 | 38.51 | Chlo. Nucl |
| SlPP2C60 | Solyc08g006060.3.1 | chr08: 803,615–827,195 | 368 | 4.99/40,229.15 | −0.398 | 38.43 | Nucl |
| SlPP2C61 | Solyc08g007000.3.1 | chr08: 1,574,889–1,583,560 | 781 | 5.23/86,116.34 | −0.491 | 47.03 | Chlo |
| SlPP2C62 | Solyc08g044610.3.1 | chr08: 18,794,957–18,799,764 | 59 | 6.71/6738.81 | 0.012 | 42.27 | Chlo. Nucl. |
| SlPP2C63 | Solyc08g062640.3.1 | chr08: 51,623,577–51,625,677 | 134 | 7.61/15,444.01 | −0.244 | 40.43 | Nucl. |
| SlPP2C64 | Solyc08g062650.2.1 | chr08: 51,624,426–51,632,488 | 469 | 4.89/51,638.63 | −0.057 | 38.97 | Nucl |
| SlPP2C65 | Solyc08g065500.2.1 | chr08: 53,632,222–53,634,431 | 336 | 5.06/36,816.81 | −0.137 | 40.85 | Nucl |
| SlPP2C66 | Solyc08g065540.3.1 | chr08: 53,677,271–53,679,628 | 332 | 5.59/36,782.71 | −0.185 | 39.99 | Nucl |
| SlPP2C67 | Solyc08g065670.4.1 | chr08: 53,898,474–53,901,007 | 306 | 5.22/33,454.16 | −0.075 | 40.12 | Nucl |
| SlPP2C68 | Solyc08g065680.3.1 | chr08: 53,924,816–53,927,725 | 205 | 5.24/22,537.35 | −0.166 | 44.21 | Nucl |
| SlPP2C69 | Solyc08g074230.1.1 | chr08: 58,350,631–58,355,073 | 271 | 4.76/30,183.9 | −0.518 | 37.99 | Nucl |
| SlPP2C70 | Solyc08g077150.3.1 | chr08: 61,046,865–61,055,706 | 796 | 5.19/87,391.85 | −0.456 | 50.57 | Chlo |
| SlPP2C71 | Solyc08g082260.2.1 | chr08: 65,099,205–65,101,710 | 393 | 6.17/44,173.95 | −0.55 | 45.52 | Nucl |
| SlPP2C72 | Solyc09g007080.3.1 | chr09: 727,617–731,731 | 378 | 9.06/41,932.11 | −0.266 | 41.45 | Chlo. Cyto. Mito. Nucl |
| SlPP2C73 | Solyc09g010780.3.1 | chr09: 4,070,320–4,073,958 | 623 | 5.4/69,387.69 | −0.394 | 29.6 | Chlo |
| SlPP2C74 | Solyc09g065650.3.1 | chr09: 63,821,833–63,855,480 | 955 | 5.43/109,110.03 | −0.408 | 38.77 | Nucl |
| SlPP2C75 | Solyc09g090280.3.1 | chr09: 69,809,431–69,813,531 | 257 | 9.78/28,883.02 | −0.807 | 42.35 | Chlo. Nucl |
| SlPP2C76 | Solyc10g005640.4.1 | chr10: 513,071–520,386 | 556 | 5.56/61,356.83 | −0.502 | 41.89 | Nucl |
| SlPP2C77 | Solyc10g008490.3.1 | chr10: 2,617,430–2,620,523 | 469 | 5.02/51,815.01 | −0.455 | 46.09 | Nucl |
| SlPP2C78 | Solyc10g047290.2.1 | chr10: 40,367,471–40,374,422 | 281 | 8.32/30,574.56 | −0.431 | 40.11 | Nucl |
| SlPP2C79 | Solyc10g049630.2.1 | chr10: 46,299,689–46,303,378 | 381 | 9.06/42,379.44 | −0.334 | 48.38 | Nucl |
| SlPP2C80 | Solyc10g055650.2.1 | chr10: 57,152,293–57,156,799 | 388 | 8.67/43,047.9 | −0.271 | 42.35 | Nucl. Pero |
| SlPP2C81 | Solyc10g076320.3.1 | chr10: 59,239,617–59,243,965 | 344 | 6.05/38,842.14 | −0.424 | 40.32 | Chlo. Nucl |
| SlPP2C82 | Solyc10g078800.3.1 | chr10: 60,493,362–60,504,498 | 947 | 5.26/105,611.28 | −0.386 | 45.49 | Nucl |
| SlPP2C83 | Solyc10g078810.1.1 | chr10: 60,504,641–60,507,279 | 438 | 4.93/48,492.24 | −0.355 | 39.39 | Nucl |
| SlPP2C84 | Solyc10g078820.2.1 | chr10: 60,508,870–60,512,342 | 460 | 4.99/51,210.32 | −0.422 | 46.42 | Nucl |
| SlPP2C85 | Solyc10g084410.2.1 | chr10: 63,960,722–63,963,486 | 376 | 9.42/41,906.86 | −0.346 | 47.56 | Nucl |
| SlPP2C86 | Solyc10g085370.3.1 | chr10: 64,570,827–64,575,317 | 453 | 5.86/51,847.37 | −0.654 | 36.8 | Nucl |
| SlPP2C87 | Solyc10g086490.2.1 | chr10: 65,295,550–65,298,502 | 596 | 5.67/66,435.52 | −0.392 | 39 | Cell membrane. Chlo |
| SlPP2C88 | Solyc12g010450.3.1 | chr12: 3,470,481–3,476,558 | 316 | 5.75/34,814.63 | −0.272 | 43.32 | Cyto |
| SlPP2C89 | Solyc12g042570.2.1 | chr12: 39,939,943–39,959,306 | 362 | 4.92/39,315.91 | −0.512 | 39.46 | Nucl |
| SlPP2C90 | Solyc12g096020.3.1 | chr12: 65,098,300–65,101,758 | 508 | 4.62/55,681.53 | −0.235 | 45.3 | Nucl |
| SlPP2C91 | Solyc12g096520.3.1 | chr12: 65,400,452–65,408,533 | 293 | 5.04/31,552.91 | −0.349 | 34.47 | Cyto |
| SlPP2C92 | Solyc12g099600.2.1 | chr12: 66,688,468–66,694,648 | 497 | 5.35/53,856.74 | −0.189 | 47.82 | Nucl |
AA: number of amino acids; pIs: theoretical isoelectric point; MW: molecular weight (kDa). GRAVY: grand average of hydropathicity (GRAVY < 0, hydrophilic protein/GRAVY > 0, hydrophobic protein), Instability Index (<40, the protein is stable/>40, the protein is unstable). Cyto: cytoplasm; Extr: extracellular; Nucl: nucleus; Chlo: chloroplast; Mito: mitochondria; Pero: peroxisome.
Table 2.
The distribution of PP2C genes in Arabidopsis, rice, and tomato.
| Subgroup of PP2C Genes | Numbers of AtPP2Cs | Numbers of OsPP2Cs | Numbers of SlPP2Cs |
|---|---|---|---|
| A | 9 | 9 | 15 |
| B | 8 | 18 | 12 |
| C | 9 | 8 | 11 |
| D | 13 | 11 | 11 |
| E | 6 | 3 | 5 |
| F | 19 | 14 | 16 |
| G | 7 | 5 | 8 |
| H | 9 | 10 | 14 |
AtPP2Cs: Arabidopsis thaliana PP2Cs; OsPP2Cs: Oryza sativa PP2Cs; SlPP2Cs: Solanum lycopersicum PP2Cs.
Table 3.
SlPP2C syntenic gene pairs present in tomato genome.
| Gene ID | Ka | Ks | Ka/Ks | Divergence Time (Myr) |
|---|---|---|---|---|
| SlPP2C04/44 | 0.09 | 0.69 | 0.12 | 23 |
| SlPP2C11/78 | 0.1 | 0.54 | 0.19 | 18 |
| SlPP2C13/80 | 0.08 | 0.63 | 0.12 | 21 |
| SlPP2C15/25 | 0.07 | 0.6 | 0.11 | 20 |
| SlPP2C15/12 | 0.12 | 2.04 | 0.06 | 68 |
| SlPP2C15/80 | 0.14 | 2.2 | 0.06 | 73.33 |
| SlPP2C18/19 | 0.08 | 0.09 | 0.93 | 3 |
| SlPP2C25/13 | 0.14 | 2.01 | 0.07 | 67 |
| SlPP2C33/11 | 0.19 | 1.68 | 0.11 | 56 |
| SlPP2C41/31 | 0.28 | 0.85 | 0.33 | 28.33 |
| SlPP2C57/57 | 0.09 | 0.75 | 0.12 | 25 |
| SlPP2C61/70 | 0.09 | 0.72 | 0.12 | 24 |
| SlPP2C66/65 | 0.08 | 0.37 | 0.22 | 12.33 |
| SlPP2C67/65 | 0.02 | 0.07 | 0.26 | 2.33 |
| SlPP2C80/25 | 0.15 | 1.93 | 0.08 | 64.33 |
| SlPP2C84/83 | 0.08 | 0.12 | 0.64 | 4 |
| SlPP2C85/72 | 0.12 | 0.82 | 0.15 | 27.33 |
Table 4.
Conserved motifs in the amino acid sequences of SlPP2C proteins.
| Motif | Width | Multilevel Consensus Sequence |
|---|---|---|
 1 1 | 15 | FLILASDGLWDVLSN |
 2 2 | 21 | VIQGETLYVANVGDSRAVLCR |
 3 3 | 15 | TFFGVYDGHGGPGAA |
 4 4 | 20 | VWRVKGGLAVSRAIGDKYLK |
 5 5 | 15 | AIQLSVDHKPNREDE |
 6 6 | 15 | RGSHDBISVIVVFLD |
 7 7 | 50 | HEGGDLGGRQDGLLWYKDLGQHANGEFSMAVVQANNLLEDQSQVESGPLS |
 8 8 | 41 | AVDIVHSYPRGGIARRLVKAALQEAAKKREMRYSDLKKIDR |
 9 9 | 20 | SQQGRRGEMEDAHIVWPBFC |
 10 10 | 14 | KKALRKAFLKTDEE |
Table 5.
Functionally annotated cis-elements identified in the promoters of 92 SlPP2Cs.
| Cis-Element | Number of Genes | Functions of Cis-Elements | |
|---|---|---|---|
 | circadian | 19 | circadian control |
 | GT1-motif | 57 | light responsiveness |
 | G-box | 70 | light responsiveness |
 | MRE | 36 | light responsiveness |
 | ACE | 21 | light responsiveness |
 | 3-AF1 | 10 | light responsive |
 | Sp1 | 9 | light responsive |
 | 4cl-CMA2b | 1 | light responsive |
 | AAAC-motif | 3 | light responsive |
 | CGTCA-motif | 60 | MeJA-responsiveness |
 | TGACG-motif | 60 | MeJA-responsiveness |
 | ABRE | 70 | abscisic acid responsiveness |
 | TGA- | 26 | auxin-responsive |
 | AuxRR-core | 11 | auxin responsiveness |
 | TCA- | 47 | salicylic acid responsiveness |
 | SARE | 1 | salicylic acid responsiveness |
 | GARE-motif | 21 | gibberellin-responsive |
 | P-box | 31 | gibberellin-responsive |
 | TATC-box | 16 | gibberellin-responsiveness |
 | LTR | 24 | low-temperature responsiveness |
 | MBS | 38 | drought-inducibility |
 | MBSI | 8 | flavonoid biosynthetic genes regulation |
 | MSA-like | 4 | cell cycle regulation |
 | O2-site | 25 | zein metabolism regulation |
 | Box III | 4 | protein binding site |
Publisher’s Note: MDPI stays neutral with regard to jurisdictional claims in published maps and institutional affiliations. |
© 2022 by the authors. Licensee MDPI, Basel, Switzerland. This article is an open access article distributed under the terms and conditions of the Creative Commons Attribution (CC BY) license (https://creativecommons.org/licenses/by/4.0/).
Share and Cite
MDPI and ACS Style
Qiu, J.; Ni, L.; Xia, X.; Chen, S.; Zhang, Y.; Lang, M.; Li, M.; Liu, B.; Pan, Y.; Li, J.; et al. Genome-Wide Analysis of the Protein Phosphatase 2C Genes in Tomato. Genes 2022, 13, 604. https://doi.org/10.3390/genes13040604
AMA Style
Qiu J, Ni L, Xia X, Chen S, Zhang Y, Lang M, Li M, Liu B, Pan Y, Li J, et al. Genome-Wide Analysis of the Protein Phosphatase 2C Genes in Tomato. Genes. 2022; 13(4):604. https://doi.org/10.3390/genes13040604
Chicago/Turabian StyleQiu, Jianfang, Lei Ni, Xue Xia, Shihao Chen, Yan Zhang, Min Lang, Mengyu Li, Binman Liu, Yu Pan, Jinhua Li, and et al. 2022. "Genome-Wide Analysis of the Protein Phosphatase 2C Genes in Tomato" Genes 13, no. 4: 604. https://doi.org/10.3390/genes13040604
Note that from the first issue of 2016, this journal uses article numbers instead of page numbers. See further details here.