
Genetic Interactions of Awnness Genes in Barley


1
Key Laboratory for Genetics, Breeding and Multiple Utilization of Crops, Ministry of Education, Fujian Agriculture and Forestry University, Fuzhou 350002, China
2
Fujian Collegiate Key Laboratory of Applied Plant Genetics, Fujian Agriculture and Forestry University, Fuzhou 350002, China
3
Department of Plant Sciences, University of Idaho, Moscow, ID 83844, USA
4
Fujian Key Laboratory of Crop Breeding by Design, Fujian Agriculture and Forestry University, Fuzhou 350002, China
*
Authors to whom correspondence should be addressed.
Genes 2021, 12(4), 606; https://doi.org/10.3390/genes12040606
Submission received: 15 March 2021
/
Revised: 8 April 2021
/
Accepted: 16 April 2021
/
Published: 20 April 2021
(This article belongs to the Section Plant Genetics and Genomics)
Abstract
:Awns are extending structures from lemmas in grasses and are very active in photosynthesis, contributing directly to the filling of the developing grain. Barley (Hordeum vulgare L.) awns are highly diverse in shape and length and are known to be controlled by multiple awn-related genes. The genetic effects of these genes on awn diversity and development in barley are multiplexed and include complementary effect, cumulative effect, duplicate effect, recessive epistasis, dominant epistasis, and inhibiting effect, each giving a unique modified Mendelian ratio of segregation. The complexity of gene interactions contributes to the awn diversity in barley. Excessive gene interactions create a challenging task for genetic mapping and specific strategies have to be developed for mapping genes with specific interactive effects. Awn gene interactions can occur at different levels of gene expression, from the transcription factor-mediated gene transcription to the regulation of enzymes and metabolic pathways. A better understanding of gene interactions will greatly facilitate deciphering the genetic mechanisms underlying barley awn diversity and development.
1. Background
Barley (Hordeum vulgare L.) is one of the oldest domesticated grain crops and has been cultivated for over 8000 years. With an annual production of 150 million tones worldwide, barley is ranked fourth in quantity produced among grains behind maize, rice, and wheat. Different from rice and wheat, most barley cultivars develop awns. Awns are extending structures from lemmas in grasses and are very active in photosynthesis, contributing directly to the filling of the developing grain. In addition, awns can protect against animal predation before grain harvest and help disperse dry seeds in the wild and anchor germinating seeds to the soil [1].
In a living cell of higher organisms, thousands of genes are expressed simultaneously and a specific trait is often determined or influenced by more than one genetic locus. Thus, gene interaction is very common in genetic studies. Interactions among genes frequently lead to distortion of simple Mendelian segregation ratios, even producing novel phenotypes. For two pairs of independent genes, a segregation ratio of 9:3:3:1 in F2 is expected. However, this ratio could be distorted when the two pairs of genes interact with duplicate effect, complementary effect, cumulative effect, dominant epistasis, recessive epistasis, or inhibiting effect [2]. When two dominant genes have the same effect on a trait, indicating duplicate effect, it leads to a segregation ratio of 15:1. When two dominant genes complement each other, the complementation effect produces a segregation ratio of 9:7. A ratio of 9:6:1 is often indicative of the cumulative effect of two dominant genes, while a ratio of 13:3 suggests the inhibiting effect of two dominant genes. When one gene suppresses the effect of another, the epistasis effect would be observed, with a ratio of 12:3:1 in dominant epistasis and 9:3:4 in recessive epistasis [2].
The effect of gene interaction is often observed in plants [3,4,5,6,7]. In wheat (Triticum aestivum L.), purple grain is controlled by two complementary dominant genes; waxiness of grain endosperm by three duplicate recessive genes [8]; and awn development by the interactions among three dominant awnless genes, B1, B2, and Hd (hooded) [9]. In rice (Oryza sativa L.), male fertility is determined by two duplicate genes [10], the color of exoceomum by two complementary genes, and awn development by An-1 and An-2 with additive effect [11,12,13].
Modern genetic studies have revealed that genes usually function in networks to control trait development. Thus, it is important to characterize the function of genes in the whole context of gene interaction. Development of near isogenic lines (NILs) is a strategy for distinguishing the function of individual genes [14]. In barley, there has been a world-wide effort since 1985 to introduce various mutated genes into a common genetic background, the cultivar Bowman, to produce specific NILs [15,16,17]. Some of the NILs carry genes affecting morphological and developmental processes, such as the floral bract gene Hooded lemma 1 (Kap1) and the spike row-type gene Six-rowed spike 1 (Vrs1) [18,19]. As different mutant genes carried by the NILs function in the same cultivar, the effect of genetic background variation can be eliminated. This will enable more precise comparison of gene effects and, therefore, more reliable analysis of gene interactions. A number of different genes have been identified for awn length development in barley NILs, such as lks5, lks9, and lks11, and have been shown to play very important roles in awn development [16]. This review will be focused on the advances in genetic studies of barley awnness gene interaction types, specific gene mapping strategies, and gene interaction mechanisms.
2. Interactions of Awnness Genes in Barley
The development of grass awns has become a topic of intense research largely owing to its important function in grain filling [1]. Awn in barley (Hordeum vulgare L.) is more diverse than in rice and wheat [20]. The awnness trait can be distinguished into different phenotypes, including awnless, straight (long, longer than the length of spike axis; short, shorter than the length of spike axis; and awnlet, shorter than 1 cm), hooded, leafy, and crooked at the end of a lemma (Figure 1). They are controlled by different awnness loci that interact with each other. Analysis of the interactions among these loci can potentially reveal the mechanisms by which awn development is regulated. This topic has not been systematically studied, although some historic and recent investigations may have provided interesting hints [21,22,23].
When a hooded-awn line is crossed with a long-awn line, the hooded awn is always dominant over the long awn, and the awn trait is inherited as a single locus independent of the row type gene [24,25]. However, when a hooded-awn line is crossed with an awnless line, the inheritance becomes more complicated. The F2 population segregates into hooded and normal awns in a ratio of 9:7, suggesting that the hooded-awn phenotype is controlled by two complementary factors [26]. It has been proposed that two dominant awn genes are necessary for the development of hooded awn, indicating the complementary effect of hooded genes, or the recessive epistasis of normal awn over hooded awn [22]. Analysis has revealed that the recessive short awn gene lks2 is epistatic over the hooded gene Kap1 (K), giving a ratio of 9:3:4 in F2 [23].
A recent study on the interaction of awnness loci has led to the identification of Lsa1, a dominant locus underlying the awnlessness on lateral spikelets [21]. Different from the above recessive epistasis of awned over hooded, a hierarchical dominant epistasis of awnless over hooded and awned trait has been identified, and the awnless gene of central row has been shown to be epistatic over the awn trait of lateral row [21]. Interestingly, the awnless gene B1 in wheat acts as a dominant suppressor of the hooded phenotype [8]. Similarly, barley Lsa1 also exhibits a dominant epistatic effect over the hooded allele Kap1. A candidate of the wheat B1 homologs in barley has been identified as HvFT-3, which has a similar chromosome location as Lsa1, implying that HvFT-3 might be the candidate gene of Lsa1 [21,27].
The awn phenotype of mutant leafy lemma (lel) is controlled by two independent and duplicate loci, lel1 and lel2 [15], as suggested by analysis of segregation data of a cross between lel and the wild type (WT) control, which produces an F2 ratio of 15:1 for WT and lel awns [28]. The lel2 locus has been identified as lks5 on chromosome 4H, while lel1 is inferred on chromosome 2H [15,16,28]. Awn length determined by two duplicate dominant genes with an F2 ratio of 15:1 for long-awned to short-awned has also been reported [29].
Grunewaldt (1974) reported that awnless (S) is dominant to awned (s) and long awn (A) is dominant to short awn (a), respectively, and the F2 generation of the cross between a short awn mutant and an awnless variety segregates into 13 awnless/short awn versus 3 long awn [30]. He proposed that S is an inhibitor of A, suppressing the awn development. Therefore, the genotypes S_A_, S_aa, and ssaa show the phenotype of awnless or short awn, while the genotype ssA_ shows the phenotype of long awn.
The length of awns is a complex trait controlled by the interactions of several genes, including lr1 (for reduced length of lateral awns), lks5 (or lk5, for short awn 5), and lks2 (or lk and lk4, for short awns) [22,31]. Understanding of the specific effect of an awn gene among the interactive loci will help define the awn gene and illustrate its function. lr1 is similar to lr reported by Leonard (1942), both leading to the reduced length of lateral awns, but Lr has no effect on the awn length on the central rows and is allelic to the row-type gene vrs1 [32,33,34]. Lr1 controls the awn development on the central and lateral rows, having additional effects on the awn length on the lateral rows. The homozygous genotype of lr1 leads to the awnless phenotype on the lateral rows. lr1, lks2, and lks5 act together to regulate the awn length in a predicted manner [22,31]. The central awn is about half of the full length in the genotype Lr1_ lks5/lks5 and about one-quarter of the full length in lr1/lr1 Lks5_, suggesting that the effect on central awn length of Lr1 is more prominent than Lks5, and the awns are in full length when the two genes are dominant, and awnlet when the two genes are recessive [22]. In the presence of Lr1, the two short awn loci, Lks2 and Lks5, act additively to regulate awn length. The F2 population is segregated into a ratio of 9 long awn (Lks2/_ Lks5/_) to 6 short awn (Lks2/_ lks5/lks5 and lks2/lks2 Lks5_) to 1 awnless (lks2/lks2 lks5/lks5). The effect of Lks2 is dependent upon the presence of Lr1, because the awn genotypes of both lr1/lr1 Lks2_ Lks5_ and lr1/lr1 lks2/lks2 Lks5_ are indistinguishable, having short awns, indicating lr1lr1 may have recessive epistasis on the expression of Lks2 [31].
Complementation test, also known as cis-trans test, is commonly used to determine if the genetic loci of two similar mutants are allelic or non-allelic. In this test, F1 plants of two allelic mutants would display mutant phenotype, whereas two non-allelic mutant genes would complement each other, leading to a wild-type phenotype in their F1 plants. If non-allelic genes determine the similar traits, then an interaction between them happens. Allelism tests among int-b.3, int-b.6, int-b.75, and vrs2 indicate that they are allelic to the row type gene Vrs2 [35]. Complementation tests exclude the allelism between short awned suK loci, lks2, and Hooded (K) [36]. Preliminary data from allelism tests indicate that the short-awn mutation lk2 and two incomplete dominant mutations for short awns in Morex and KM-200, respectively, are allelic, and that the short-awn mutation lk5 in Morex and a lk5 mutation in KT4-218 and a mutation designated lk are likewise allelic [37].
In short, the genetic control of awn development in barley is very complicated, involving all sorts of gene interactions. Part of the genes and interactions for awn development found in barley are summarized in Table 1.
3. Strategies for Mapping Interactive Genes
Genetic mapping and linkage analysis are often complicated by the presence of gene–gene interactions. Special models and methods are required for mapping interactive loci. A strategy for mapping interactive genes in an F2 population has been proposed, in which markers linked with one of the interactive loci (say, A/a) are identified by bulked segregant analysis (BSA) at first, and then the markers are used to genotype a group of segregants of the same genotype(s) at the target locus (either all A_or all aa) and the genetic distances between the markers and the target locus are estimated by linkage analysis using the software Mapmaker/Exp 3.0 [38]. The core of this mapping strategy is to identify the linked markers of the interactive loci by finding out and comparing the allelic difference between segregant groups in the mapping population. With this mapping strategy, two interactive genes, prbs and vrs1, between which prbs is recessive epistatic over Vrs1/vrs1, have been mapped on the SSR (Simple Sequence Repeat) linkage map in barley [39,40]. This strategy will be useful for mapping barley awnness genes involving various types of interactions among them. Specific methods for mapping these awnness genes with different interaction situations are described below.
Mapping of L/l and H/h with recessive epistasis. Based on awn morphology, the F2 population can be distinguished into three segregant groups: hooded awn (L_H_), long awn (L_hh), and short awn (llH_ + llhh). The linker markers of L/l locus can be identified by comparing the long awn group or hooded awn group with the short awn group, while those of H/h locus can be identified by comparing the hooded awn group with the long awn group (Figure 2A). The subsequent marker linkage analysis can be performed using any of the groups for L/l and the hooded awn or long awn group for H/h, respectively.
Mapping of N/n and H/h with complementary effect. The F2 population can be divided into two segregant groups: hooded awn (N_H_) and normal awn (3 N_hh + 3 nnH_ + 1 nnhh). There are no allelic differences between the two groups. However, the NNHH individuals inside the hooded awn group can be identified from their F3 families, in which the awnness trait does not segregate. Thus, the linked markers of either N/n or H/h locus can be identified by comparing the NNHH group with the normal awn group (Figure 3A). The subsequent marker linkage analysis can be performed using the hooded awn group for both loci.
Mapping of C/c and D/d with cumulative effect. There are three segregant groups in F2: long awn (C_D_), short awn (C_dd + ccD_), and awnlet (ccdd). The linked markers of either C/c and D/d locus can be identified by comparing the long awn group or short awn group with the awnlet group (Figure 4A). The subsequent marker linkage analysis can be performed using the long awn or awnlet group for both loci.
Mapping of N/n and L/l with duplicate effect. There are two segregant groups in F2: normal awn (N_L_ + N_ll + nnL_) and leafy awn (nnll). The linked markers of either N/n or L/l locus can be identified by comparing the two groups (Figure 5A), and the subsequent marker linkage analysis can be performed using the leafy group for both loci.
Mapping of I/i and F/f with inhibiting effect. There are two segregant groups: awnless (I_F_ + I_ff + iiff) and long awn (iiF_). The linked markers of I/i locus can be identified by comparing the two groups (Figure 6A). For F/f locus, however, it is necessary to use the F3 of the long awn F2, in which there are two segregant groups: long awn (iiF_) and awnless (iiff). Therefore, a comparison can be made between these two F3 groups to identify the linked markers of F/f locus. The subsequent marker linkage analysis can be performed using the long awn group for both loci.
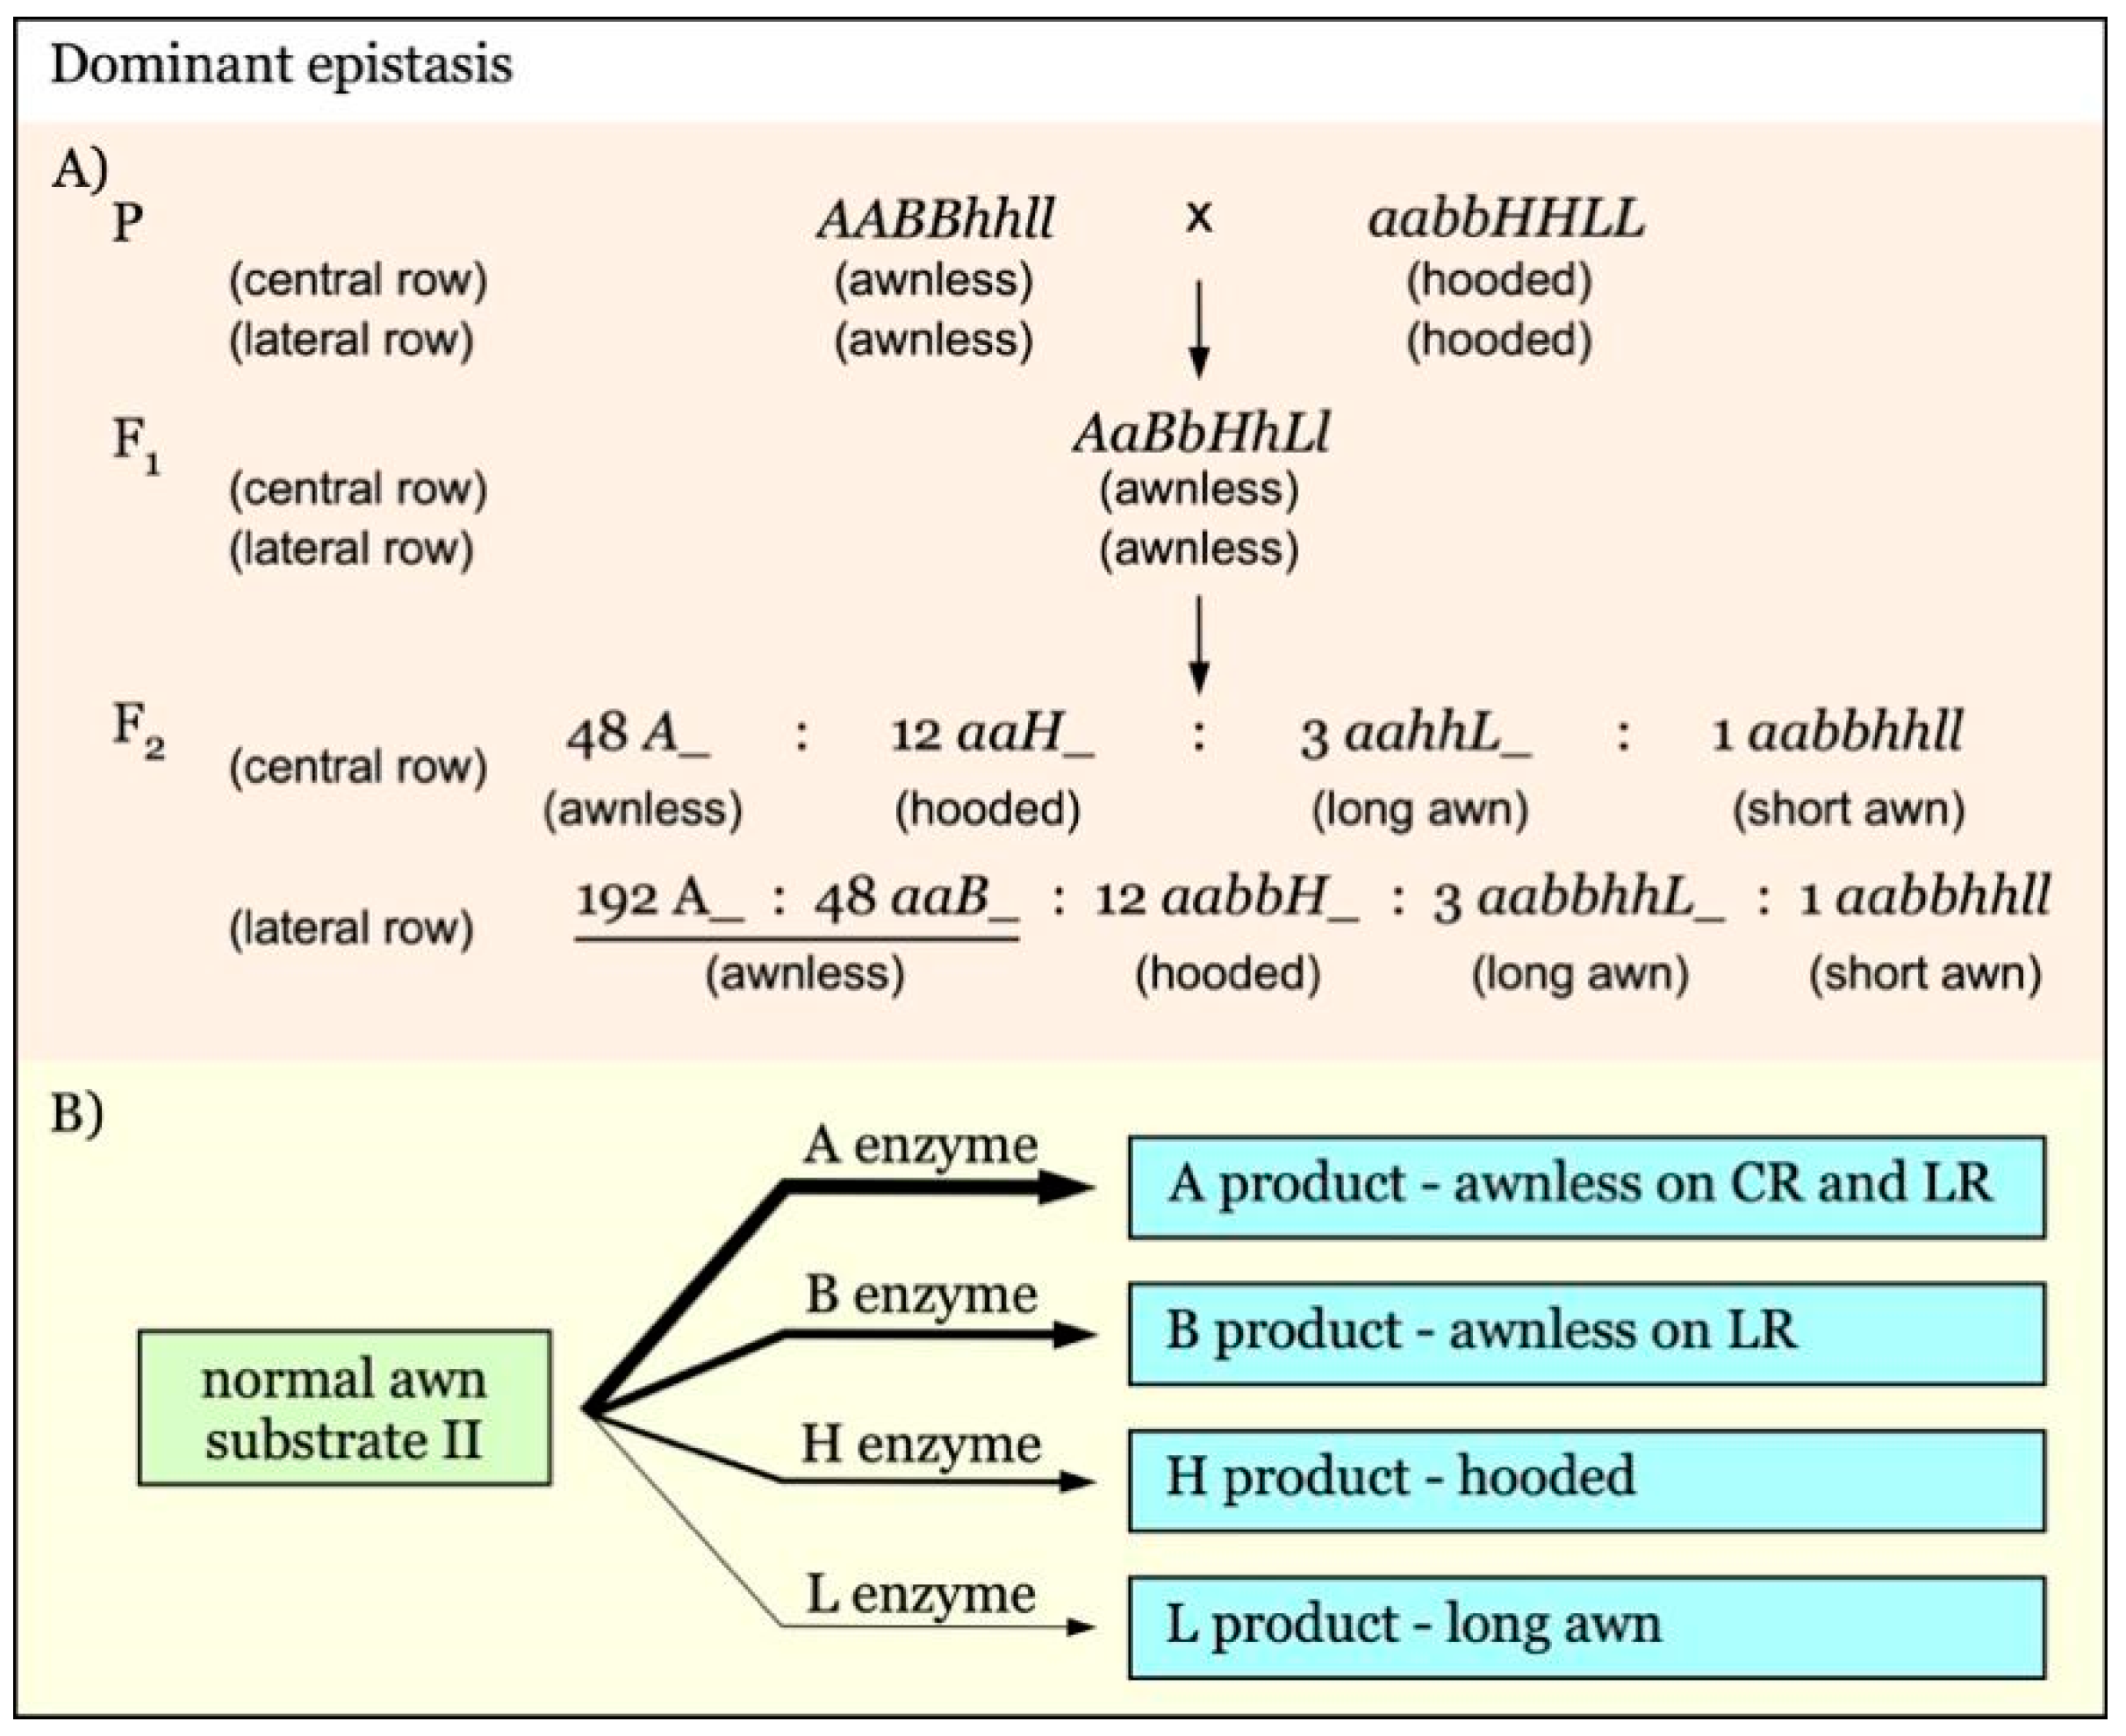
Similar strategies can be applied to more complicated inheritance. For example, in the hierarchical dominant epistasis interactions involving four pairs of genes in barley (Figure 7A), there are four segregant groups: awnless (A_ + aaB_), hooded awn (aabbH_), long awn (aabbhhL_), and short awn (aabbhhll) [21]. The linked markers of loci L/l, H/h, and A/a or B/b can be identified by comparing the long awn group with the short awn group, hooded awn group with long awn group, and awnless group with hooded awn group, respectively. The subsequent marker linkage analysis can be performed using any of the groups for A/a, any except the awnless group for B/b and H/h, and long awn or short awn group for L/l, respectively.
4. Possible Models of Awness Gene Interactions at Metabolic Level in Barley
A specific phenotype is often the result of a genotype that is expressed through metabolic pathways. Some specific phenotypes that are determined by gene interactions can be explained at the metabolic level [41].
The recessive epistasis of lks2 (l) over the hooded gene H/h could be explained as illustrated in the diagram (Figure 2B) [23]. The coexistence of H and L results in the hooded phenotype. In the recessive mutant lks2, which lacks functional Lks2 protein, the LKS2 product (long awn) could not be produced and the plants would only develop short awns regardless of the presence of the H enzyme. Thus, lks2 acts as a recessive epistatic gene over the Hooded (H) gene. This would produce an F2 segregation ratio of 9 hooded to 3 long awned to 4 short awned (Figure 2A). This metabolic pathway explanation of recessive epistasis has been verified by DNA electrophoresis of short awn lks2 plants having the Kap band of hooded plants [42].
The complementation of two dominant awnness genes results in the hooded phenotype [26], as diagrammed in Figure 3. N and H are independent awnness genes with a complementary effect. Enzyme N and enzyme H alone produce no new phenotype, maintaining normal awn phenotype. However, when both N and H enzymes are present, their products complement each other, giving rise to the new hooded awn phenotype (Figure 3B). The F2 segregation ratio would be 9:7 for hooded versus normal awn (Figure 3A).
The cumulative effect of awnness genes controlling awn length is diagrammed in Figure 4A. C and D are independent genes with a cumulative effect on awn length [31]. An F2 segregation ratio of 9:6:1 for long to short to awnlet would be expected. C or D enzyme alone could convert awnlet to short awn phenotype. When both of them are present, their products are additive, giving rise to the long awn phenotype (Figure 4B).
Gene interaction with a duplicate effect has been observed in the leafy awn mutants, as shown in Figure 5. N and L are independent genes with a duplicate effect on leafy awn morphology [28]. The presence of either of them will give a dominant phenotype, having normal awns. The N and L enzymes are redundant, and only one of them is sufficient to convert leafy awn substrate to normal awn product (Figure 5B). This type of gene interaction would give rise to an F2 segregation ratio of 15:1 for normal awn versus leafy awn (Figure 5A).
Gene interaction with an inhibiting effect is diagrammed in Figure 6. The I gene has an inhibiting effect on the dominance of F [30]. In the presence of I, the dominant effect of F is completely suppressed, producing awnless phenotype in F1 and an F2 ratio of 13:3 for awnless versus long awn (Figure 6A). In this type of gene interaction, I enzyme inhibits the transformation of the awnless substrate, giving awnless phenotype. In the absence of I enzyme, F enzyme will catalyze the conversion of awnless substrate into long awn product. When F enzyme encounters with I emzyme, F enzyme loses its activity, producing awnless phenotype, rather than the long awn phenotype (Figure 6B).
Gene interaction with hierarchical dominant epistasis is shown in Figure 7. In this model, A, B, H, and L are independent awnness genes with a dominant epistatic effect. The strength of their epistatic effect is in the order of A-B-H-L. The epistatic gene A exerts its function on both the central row (CR) and lateral row (LR), whereas B acts only on LR. The final awn phenotype is determined by the presence of the epistatic gene with the highest supremacy (Figure 7B) [21]. The expected F2 segregation ratio would be 48:12:3:1 for awnless to hooded to long awn to short awn on the central rows, and 240:12:3:1 for awnless to hooded to long awn to short awn on the lateral rows (Figure 7A).
5. Molecular Mechanisms of Awnness Gene Interactions in Barley
There has so far been a limited understanding of molecular mechanisms of awn gene interactions. Analysis of the expression patterns of awn genes An-1 and An-2 in rice suggests that An-1 regulates the formation of awn primordia, while An-2 promotes awn elongation [12]. The upstream genes often regulate the expression of downstream genes. In barley, the mutant gene prbs (poly-rowed-and-branched spike) is recessive epistatic over the row type gene Vrs1/vrs1, and prbs may function upstream of vrs1 [7,39]. Two awnness-specific genes have so far been cloned in barley and they each encode a type of transcription factor. One is Kap1 for hooded lemma 1, while the other is lks2 for short awn 2. Barley lks2 is recessive epistatic over the hooded-awn gene Kap1, and may function upstream of Kap1 [42,43]. Lks2 encodes a SHORT INTERNODES (SHI)-type transcription factor [43]. The SHI proteins contain two conserved regions, the RING-finger motif and the IGGH domain—the former being implicated in zinc-binding and the latter being required for dimerization and transcription activation [44]. Kap1 encodes KNOX-type transcription factor. KNOX family is known to regulate the maintenance of the shoot apical meristem and the initiation of lateral organs in plants [17]. Awnless gene B1 in wheat encodes C2H2 zinc finger proteins [27], which may act as transcriptional repressors to regulate gene expression in developmental processes such as the formation of flower, seed, and rudimentary glume [45]. Barley HvFT3, as the counterpart of awnless gene B1 in wheat, functions upstream of the row-type genes (Vrs1, Vrs4, and Int-c) [27,46].
Genomics studies could be helpful to reveal molecular mechanisms of gene interactions in the future. CRISPR (clustered regularly interspaced short palindromic repeats) knocking out could be a method to prove gene interaction at molecular level. By knocking out the upstream genes, the downstream genes will be expressed and produce corresponding phenotypes. Time-series transcriptomics data provided abundant proof of metabolic processes [47], then gene interactions at molecular and metabolic level could be proved. The yeast two-hybrid technique is also a good system to find the interactive protein, and then provides direct proof for gene interaction.
6. Concluding Remarks
Barley awns are highly diverse in morphology, varying from long, short, awnlet, to awnless in length, and from straight to hooded or crooked in shape. A set of genetic loci associated with the diversity of awns have been identified. Interactions among awn genes contribute to this diversity. Further research on awn gene interactions at the genetic, metabolic, and molecular levels will provide insights into the essence of the interactions and elucidate the mechanisms of awn initiation and development in barley.
Author Contributions
All authors conceived the idea, designed the study, discussed the content, and wrote the manuscript. Z.H. designed the graphics and diagrams. Images of Figure 1, courtesy of B.H., were taken with barley mutants obtained from the National Small Grains Collection, USDA-ARS, Aberdeen Idaho. All authors revised the manuscript. All authors have read and agreed to the published version of the manuscript.
Funding
This work was supported by IAEA project grant D2.30.30 17522 to B.H. and USDA Hatch grant IDA01529 and Idaho Barley Commission grant AP4617 to Z.H.
Institutional Review Board Statement
Not applicable.
Informed Consent Statement
Not applicable.
Data Availability Statement
Not applicable.
Acknowledgments
We thank Allan Caplan (University of Idaho) and Daiqing Huang (NRC, Canada) for their suggestions and critical comments on the manuscript. We also thank the reviewers for their insightful comments on this manuscript.
Conflicts of Interest
The authors declare no competing interest.
References
- Ntakirutimana, F.; Xie, W. Morphological and genetic mechanisms underlying awn development in monocotyledonous grasses. Genes 2019, 10, 573. [Google Scholar] [CrossRef] [PubMed] [Green Version]
- Phillips, P.C. The language of gene interaction. Genetics 1998, 149, 1167–1171. [Google Scholar] [PubMed]
- Li, H.; Liu, A.; Tang, L.; Zhang, Q.; Zou, J. Complementary genes controlling temperature-sensitive sterility in hybrids between indica and japonica types. Rice Genet. Newsl. 1995, 12, 184. [Google Scholar]
- He, G.H.; Wang, W.M.; Liu, G.Q.; Hou, L.; Pei, Y. Mapping of two fertility-restoring gene for WA cytoplasmic male sterility in Minhui63 using SSR markers. Acta Genet. Sin. 2002, 29, 798–802. [Google Scholar] [PubMed]
- Bingham, E.T.; Groose, R.W.; Woodfield, D.R.; Kidwell, K.K. Complementary gene interactions in alfalfa are greater in autotetraploids than diploids. Crop Sci. 1994, 34, 823–829. [Google Scholar] [CrossRef]
- Lee, J.M.; Bush, A.L.; Specht, J.E.; Shoemaler, R.C. Mapping of duplicate genes in soybean. Genome 1999, 42, 829–836. [Google Scholar] [CrossRef]
- Wu, J.Y.; Ding, J.Q.; Du, Y.X.; Chen, W.C. Identification and molecular tagging of two complementary dominance resistant genes to maize dwarf mosaic virus. Acta Genet. Sin. 2002, 29, 1095–1099. [Google Scholar]
- Huang, B. Genetic analysis of purple and waxy grain in wheat. Sci. Agric. Sin. 2011, 44, 3501–3507. [Google Scholar]
- Yoshioka, M.; Iehisa, J.C.M.; Ohno, R.; Kimura, T.; Enoki, H.; Nishimura, S.; Nasuda, S.; Takumi, S. Three dominant awnless genes in common wheat: Fine mapping, interaction and contribution to diversity in awn shape and length. PLoS ONE 2017, 12, e0176148. [Google Scholar] [CrossRef] [PubMed] [Green Version]
- Huang, B.; Lu, Y. Study on the heredity of color and fertility in rice. Fujian J. Agric. Sci. 2002, 17, 215–216. [Google Scholar]
- Paramasivam, K.S. The relation between F2 segregation pattern and heterosis prediction in rice, Oryza sativa L. Madras Agric. J. 1986, 73, 573–578. [Google Scholar]
- Luo, J.; Liu, H.; Zhou, T.; Gu, B.; Huang, X.; Shangguan, Y.; Zhu, J.; Li, Y.; Zhao, Y.; Wang, Y.; et al. An-1 encodes a basic helix-loop-helix protein that regulates awn development, grain size, and grain number in rice. Plant Cell 2013, 25, 3360–3376. [Google Scholar] [CrossRef] [PubMed] [Green Version]
- Gu, B.; Zhou, T.; Luo, J.; Liu, H.; Wang, Y.; Shangguan, Y.; Zhu, J.; Li, Y.; Sang, T.; Wang, Z.; et al. An-2 encodes a cytokinin synthesis enzyme that regulates awn length and grain production in rice. Mol. Plant 2015, 8, 1635–1650. [Google Scholar] [CrossRef] [PubMed]
- Chen, G.D.; Li, H.B.; Zheng, Z.; Wei, Y.M.; Zheng, Y.L.; McIntyre, C.L.; Zhou, M.X.; Liu, C.J. Characterization of a QTL affecting spike morphology on the long arm of chromosome 3H in barley (Hordeum vulgare L.) based on near isogenic lines and a NIL-derived population. Theor. Appl. Genet. 2012, 125, 1385–1392. [Google Scholar] [CrossRef] [PubMed]
- Franckowiak, J.D.; Foster, A.E.; Pederson, V.D.; Pyler, R.E. Registration of ‘Bowman’ barley. Crop Sci. 1985, 25, 883. [Google Scholar] [CrossRef]
- Franckowiak, J.D.; Kleinhofs, A.; Lundqvist, U. Descriptions of barley genetic stocks for 2016. Barley Genet. Newsl. 2016, 46, 1–47. [Google Scholar]
- Druka, A.; Franckowiak, J.; Lundqvist, U.; Bonar, N.; Alexander, J.; Houston, K.; Radovic, S.; Shahinnia, F.; Vendramin, V.; Morgante, M.; et al. Genetic dissection of barley morphology and development. Plant Physiol. 2011, 155, 617–627. [Google Scholar] [CrossRef] [PubMed] [Green Version]
- Müller, K.J. The barley hooded mutation caused by a duplication in a homeobox gene intron. Nature 1995, 374, 727–730. [Google Scholar] [CrossRef] [PubMed]
- Komatsuda, T.; Pourkheirandish, M.; He, C.; Azhaguvel, P.; Kanamori, H.; Perovic, D.; Stein, N.; Graner, A.; Wicker, T.; Tagiri, A.; et al. Sixrowed barley originated from a mutation in a homeodomain leucine zipper I-class homeobox gene. Proc. Natl. Acad. Sci. USA 2007, 104, 1424–1429. [Google Scholar] [CrossRef] [PubMed] [Green Version]
- Terzi, V.; Tumino, G.; Pagani, D.; Rizza, F.; Ghizzoni, R.; Morcia, C.; Stanca, A.M. Barley developmental mutants: The high road to understand the cereal spike morphology. Diversity 2017, 9, 21. [Google Scholar] [CrossRef] [Green Version]
- Huang, B.; Huang, D.; Hong, Z.; Owie, S.O.; Wu, W. Genetic analysis reveals four interacting loci underlying awn trait diversity in barley (Hordeum vulgare). Sci. Rep. 2020, 10, 1–8. [Google Scholar] [CrossRef] [PubMed]
- Myler, J.L. Awn inheritance in barley. J. Agric. Res. 1942, 65, 405–412. [Google Scholar]
- Woodward, R.W.; Rasmussen, D.C. Hood and awn development in barley determined by two gene pairs. Agron. J. 1957, 49, 92–94. [Google Scholar] [CrossRef]
- Chen, W. Genetic study on prism quantity and awned shape of barley. Fujian Agric. 2014, 8, 144–146. [Google Scholar]
- Wang, Z.; Tang, Z.; Xiong, S. Genetic study on prism quantity and awned shape of barley. J. Sichuan Teach. Coll. (Nat. Sci.) 1993, 14, 138–139. [Google Scholar]
- Miyake, K.; Imai, Y. Genetic studies in barley. I. Bot. Mag. Tokyo 1922, 36, 25–38. [Google Scholar] [CrossRef]
- Huang, D.; Zheng, Q.; Melchkart, T.; Bekkaoui, Y.; Konkin, D.J.F.; Kagale, S.; Martucci, M.; You, F.M.; Clarke, M.; Adamski, N.M.; et al. Dominant inhibition of awn development by a putative zinc-finger transcriptional repressor expressed at the B1 locus in wheat. New Phytol. 2020, 225, 340–355. [Google Scholar] [CrossRef] [Green Version]
- Pozzi, C.; Faccioli, P.; Terzi, V.; Stanca, A.M.; Cerioli, S.; Castiglioni, P.; Fink, R.; Capone, R.; Müller, K.J.; Bossinger, G.; et al. Genetics of mutations affecting the development of a barley floral bract. Genetics 2000, 154, 1335–1346. [Google Scholar] [PubMed]
- Ahuja, S.L.; Sethi, G.S. Allelic relationships of genes for long awned mutants in barley Hordeum vulgare. Bangladesh J. Bot. 1988, 17, 81–84. [Google Scholar]
- Grunewaldt, J. The transmission of awn-length in barley: I. Factor analysis of a short awned mutant and an awnless primitive form. Theor. Appl. Genet. 1974, 44, 211–215. [Google Scholar] [CrossRef] [PubMed]
- Litzenberger, S.C.; Green, J.M. Inheritance of awns in barley. Agron. J. 1951, 43, 117–123. [Google Scholar] [CrossRef]
- Leonard, W.H. Inheritance of reduced lateral spikelet appendages in the Nudihaxtoni variety of barley. J. Am. Soc. Agron. 1942, 34, 211–221. [Google Scholar] [CrossRef]
- Takahashi, R.; Hayashi, J. Studies on classification and inheritance of barley varieties having awnless or shorter-awned lateral spikelets (Bozu barley). II. Mode of inheritance of spike characteristics of Bozu barley-1. Nogaku Kenkyu 1982, 60, 25–37. [Google Scholar]
- Robertson, D.W.; Immer, F.R.; Wiebe, G.A.; Stevens, H. The location of two genes for mature plant characters in barley in linkage group I. J. Am. Soc. Agron. 1944, 36, 66–72. [Google Scholar] [CrossRef] [Green Version]
- Youssef, H.M.; Eggert, K.; Koppolu, R.; Alqudah, A.M.; Poursarebani, N.; Fazeli, A.; Sakuma, S.; Tagiri, A.; Rutten, T.; Govind, G.; et al. VRS2 regulates hormone-mediated inflorescence patterning in barley. Nat. Genet. 2017, 49, 157–163. [Google Scholar] [CrossRef] [PubMed]
- Roig, C.; Pozzi, C.; Santi, L.; Müller, J.; Wang, Y.; Stile, M.R.; Rossini, L.; Stanca, M.; Salamini, F. Genetics of barley hooded suppression. Genetics 2004, 167, 439–448. [Google Scholar] [CrossRef] [PubMed] [Green Version]
- Ramage, R.T. Alleles at the short-awned loci lk2 on chromosome 1 and lk5 on chromosome 4. Barley Genet. Newsl. 1986, 16, 22–23. [Google Scholar]
- Wu, W.; Huang, B. Strategy for the mapping of interactive genes using bulked segregant analysis method and Mapmaker/Exp software. Chin. Sci. Bull. 2006, 51, 2619–2623. [Google Scholar] [CrossRef]
- Huang, B.; Wu, W.; Liu, S.; Huang, Z. Genetic analysis on poly-row-and-branched spike mutant in barley. Hereditas (Beijing) 2004, 26, 903–906. [Google Scholar]
- Huang, B.; Wu, W. Mapping of mutant gene prbs controlling poly-row-and-branched spike in barley (Hordeum vulgare L.). Agric. Sci. China 2011, 10, 1501–1505. [Google Scholar] [CrossRef]
- Winter, P.C.; Hickey, G.I.; Fletcher, H.L. (Eds.) More Mendelian genetics. In Instant Notes in Genetics; BIOS Scientific Publishers Limited: Oxford, UK, 1998; pp. 126–133. [Google Scholar]
- McCoy, S.B. Understanding Epistasis in Linkage Analysis: The Kap and lks2 Loci in the Oregon Wolfe Barley Population. Bachelor’s Thesis, Oregon State University, Corvallis, OR, USA, 2000. [Google Scholar]
- Yuo, T.; Yamashita, Y.; Kanamori, H.; Matsumoto, T.; Lundqvist, U.; Sato, K.; Ichii, M.; Jobling, S.A.; Taketa, S. A SHORT INTERNODES (SHI) family transcription factor gene regulates awn elongation and pistil morphology in barley. J. Exp. Bot. 2012, 63, 5223–5232. [Google Scholar] [CrossRef] [PubMed] [Green Version]
- Kuusk, S.; Sohlberg, J.J.; Eklund, D.M.; Sundberg, E. Functionally redundant SHI family genes regulate Arabidopsis gynoecium development in a dose-dependent manner. Plant J. 2006, 47, 99–111. [Google Scholar] [CrossRef] [PubMed]
- Lyu, T.; Liu, W.; Hu, Z.; Xiang, X.; Liu, T.; Xiong, X.; Cao, J. Molecular characterization and expression analysis reveal the roles of Cys2/His2 zinc-finger transcription factors during flower development of Brassica rapa subsp. chinensis. Plant Mol. Biol. 2020, 102, 123–141. [Google Scholar]
- Mulki, M.A.; Bi, X.; von Korff, M. FLOWERING LOCUS T3 controls spikelet initiation but not floral development. Plant Physiol. 2018, 178, 1170–1186. [Google Scholar] [CrossRef] [PubMed] [Green Version]
- Bechtold, U.; Penfold, C.A.; Jenkins, D.J.; Legaie, R.; Moore, J.D.; Lawson, T.; Matthews, J.S.A.; Vialet-Chabrand, S.R.M.; Baxter, L.; Subramaniam, S.; et al. Time-series transcriptomics reveals that AGAMOUS-LIKE22 affects primary metabolism and developmental processes in drought-stressed Arabidopsis. Plant Cell 2016, 28, 345–366. [Google Scholar] [CrossRef] [Green Version]
Figure 1.
Barley awn diversity. Barley awn mutants obtained from the National Small Grains Collection, USDA-ARS (Agricultural Research Service, United States Department of Agriculture), Aberdeen Idaho. 1-lks2, short awn; 2-vrs1(lr), six-rowed with awnless lateral spikelet; 3-trp1, triple awned lemma; 4-sbk1, subjacent hooded lemma; 5-Lks1, awnless; 6-sca1, short crooked awn; 7-ari-a, short awn; 8-Kap1, hooded lemma; 9-lks5, short awn; 10-lel1, leafy lemma; 11-lks6, short awn; 12-WT1, wild type, two-rowed with long awn; 13-WT2, wild type, six-rowed with long awn. Yellow scale bar = 3 cm; White scale bar = 1 cm.

Figure 2.
Model of interaction of awnness genes with recessive epistatic effect. (A). The short awn gene lks2 (l) is a recessive epistatic gene over the Hooded locus (H/h). The hooded awn phenotype is the result of coexistence of both L and H. At the lack of H gene (hh), Lks2 gives the long awn phenotype. (B). In the absence of Lks2 enzyme, there would not be LKS2 product and only short awns are produced regardless of the presence of H. Thus, the recessive lks2 acts as a recessive epistatic gene that suppresses the effect of the Hooded (H or h) gene.

Figure 3.
Model of interaction of awnness genes with a complementary effect. (A). N and H are independent genes with a complementary effect. (B). In the presence of either N enzyme or H enzyme, only normal awns are produced. In the coexistence of H enzyme and N enzymes, the normal awn intermediate would be further converted to the hooded product (Hooded phenotype).

Figure 4.
Model of interaction of awnness genes with a cumulative effect. (A). C and D are independent awnness genes that act additively to regulate awn length. (B). In the presence of either C or D product, only short awns are developed from the awnlet substrate. The long awn phenotype is produced only with the co-existence of both C and D enzymes, indicating an additive effect.

Figure 5.
Model of interaction of awnness genes with a duplicate effect. (A). N and L are independent awnness genes with a duplicate effect. The presence of either N or L is sufficient to result in the formation of normal awns. In the absence of both genes (nnll), leafy awns are developed. (B). N and L enzymes have a redundant function and only one of them is required for converting the leafy awn substrate to the normal awn phenotype.

Figure 6.
Model of interaction of awnness genes with an inhibiting effect. (A). Awnness gene I inhibits the dominant expression of the F gene. (B). In the presence of I enzyme, the conversion of the awnless substrate is inhibited, giving awnless phenotype. In the lack of I enzyme, F enzyme will catalyze the awnless substrate into long awn product. When both F and I enzymes are present, I could inhibit F enzyme, resulting in the awnless phenotype.

Figure 7.
Model of interaction of awnness genes with multiple dominant epistatic effects. (A). A, B, and H are dominant epistatic genes over L. The strength of their epistatic effect is in the order of A-B-H. The A gene functions on both the central row (CR) and lateral row (LR). The B gene exerts its epistatic effect only on LR. (B). The final awn phenotype is determined by the supremacy of the epistatic gene. The thicker arrows indicate genes with a stronger epistatic effect.


Table 1.
Gene interactions for awn development in barley.
| Interaction | Genes | Segregation in F2 generation | Reference |
|---|---|---|---|
| Comp. | N/n and H/h | 9 HA (N_H_): 7 NA (N_hh + nnH_ + nnhh) | [26] |
| Dup. | Lel1/lel1 and Lel2/lel2 | 15 NA (Lel1_Lel2_ + Lel1_lel2lel2 + lel1lel1Lel2_): 1 LF (lel1lel1lel2lel2) | [28] |
| Cum. | Lks2/lks2 and Lks5/lks5 | 9 LA (Lks2_ Lks5_): 6 SA (Lks2_ lks5lks5 +lks2lks2 Lks5_): 1 AL (lks2lks2 lks5lks5) | [31] |
| Rec. epi. | Lks2/lls2 and Kap1/kap1 | 9 HA (Lls2_Kap1_): 3 LA (Lks2_kap1kap1): 4 SA (lks2lks2Kap1_ + lks2lks2kap1kap1) | [23] |
| Dom. epi. | Lsa1/lsa1 and Kap1/kap1 | 12 AL (Lsa1_Kap1_ + Lsa1_kap1kap1): 3 HA (lsa1 lsa1Kap1_): 1 ST (lsa1 lsa1kap1kap1) | [21] |
| Inh. | S/s and A/a | 13 AL (S_A_ + S_aa + ssaa): 3 LA (ssA_) | [30] |
Note: Comp., complementary; Dup., duplicate; Cum., cumulative; Rec. epi., recessive epistasis; Dom. epi., dominant epistasis; Inh., inhibiting; HA, hooded awn; NA, normal awn; LF, leafy awn; LA, long awn; SA, short awn; AL, awnless; ST, straight awn.
Publisher’s Note: MDPI stays neutral with regard to jurisdictional claims in published maps and institutional affiliations. |
© 2021 by the authors. Licensee MDPI, Basel, Switzerland. This article is an open access article distributed under the terms and conditions of the Creative Commons Attribution (CC BY) license (https://creativecommons.org/licenses/by/4.0/).
Share and Cite
MDPI and ACS Style
Huang, B.; Wu, W.; Hong, Z. Genetic Interactions of Awnness Genes in Barley. Genes 2021, 12, 606. https://doi.org/10.3390/genes12040606
AMA Style
Huang B, Wu W, Hong Z. Genetic Interactions of Awnness Genes in Barley. Genes. 2021; 12(4):606. https://doi.org/10.3390/genes12040606
Chicago/Turabian StyleHuang, Biguang, Weiren Wu, and Zonglie Hong. 2021. "Genetic Interactions of Awnness Genes in Barley" Genes 12, no. 4: 606. https://doi.org/10.3390/genes12040606
Note that from the first issue of 2016, this journal uses article numbers instead of page numbers. See further details here.