Article

Genome-Wide Mining and Identification of Protein Kinase Gene Family Impacts Salinity Stress Tolerance in Highly Dense Genetic Map Developed from Interspecific Cross between G. hirsutum L. and G. darwinii G. Watt

1
State Key Laboratory of Cotton Biology, Institute of Cotton Research, Chinese Academy of Agricultural Sciences, Anyang 455000, Henan, China
2
Cotton Group, Plant Breeding and Genetics Division, Nuclear Institute for Agriculture and Biology (NIAB), Jhang road Faisalabad 3800, Punjab, Pakistan
3
Anyang Institute of Technology, Anyang 455000, Henan, China
4
Henan Key Laboratory of Plant Stress Biology/State Key Laboratory of Cotton Biology, School of Life Science, Henan University, Kaifeng, Henan 475004, China
5
Farmland and Irrigation Research Institute, Chinese Academy of Agricultural Sciences, Xinxiang 453003, China
6
School of Agricultural Sciences, Zhengzhou University, Zhengzhou 450001, Henan, China
*
Authors to whom correspondence should be addressed.
Agronomy 2019, 9(9), 560; https://doi.org/10.3390/agronomy9090560
Submission received: 11 July 2019 / Revised: 12 September 2019 / Accepted: 16 September 2019 / Published: 18 September 2019
(This article belongs to the Section Crop Breeding and Genetics)

Abstract

:
Abiotic stress is an important limiting factor in crop growth and yield around the world. Owing to the continued genetic erosion of the upland cotton germplasm due to intense selection and inbreeding, attention has shifted towards wild cotton progenitors which offer unique traits that can be introgressed into the cultivated cotton to improve their genetic performance. The purpose of this study was to characterize the Pkinase gene family in a previously developed genetic map of the F2 population derived from a cross between two cotton species: Gossypium hirsutum (CCRI 12-4) and Gossypium darwinii (5-7). Based on phylogenetic analysis, Pkinase (PF00069) was found to be the dominant domain with 151 genes in three cotton species, categorized into 13 subfamilies. Structure analysis of G. hirsutum genes showed that a greater percentage of genes and their exons were highly conserved within the group. Syntenic analysis of gene blocks revealed 99 duplicated genes among G. hirsutum, Gossypium arboreum and Gossypium raimondii. Most of the genes were duplicated in segmental pattern. Expression pattern analysis showed that the Pkinase gene family possessed species-level variation in induction to salinity and G. darwinii had higher expression levels as compared to G. hirsutum. Based on RNA sequence analysis and preliminary RT-qPCR verification, we hypothesized that the Pkinase gene family, regulated by transcription factors (TFs) and miRNAs, might play key roles in salt stress tolerance. These findings inferred comprehensive information on possible structure and function of Pkinase gene family in cotton under salt stress.

1. Introduction

Cotton (Gossypium spp.) is an important crop cultivated for its fiber and oil around the world, producing about 35% of the fiber worldwide. The annual global production is estimated to be approximately $500 billion per annum [1]. The genus Gossypium is comprised of 53 identified species, including 7 tetraploid (2n = 4x = 52) and 46 diploid (2n = 2x = 26) species. Four species, two diploids (Gossypium arboreum, Gossypium herbaceum) and two tetraploids (Gossypium hirsutum, Gossypium barbadense), are cultivated for their fiber production [2,3,4]. It has been proposed that two major events have contributed to the evolution of the genus. First, about 5 to 10 million years ago (MYA), D genome diploids diverged from A genome diploids [5], followed by interspecific hybridization between genome D, ancestor to Gossypium raimondii, and genome A, ancestor to G. arboreum, about 1 to 2 MYA, resulted in the evolution of the heterogeneous polyploid G. hirsutum genome [6]. Exogenous polyploid G. hirsutum is inherently diverse from its parent species G. raimondii and G. arboreum, both morphologically and economically [7,8]. G. darwinii (AD5) is a tetraploid wild species endemic to the Galapagos Islands, characterized by its fine fiber quality and resistance to major abiotic stresses and fungal wilt diseases [9]. The use of wild progenitors has been of great significance in boosting the genetic diversity of various crops [10]. In other crops such as rice, several new and improved genotypes have been developed by crossing the cultivated species to its wild relatives [11].
Salt stress, the most common abiotic stress, is a serious threat to agriculture and the environment by limiting crop productivity worldwide. A complex combination of factors causes high salt concentrations in soil, including arid climates, high underground water levels, seawater infiltration and improper management practices [12,13]. High concentrations of Na+ causes ionic imbalance, disrupts osmotic adjustments, metabolic dysfunction, membrane disorganization, damage to cellular structures within plant cells and inhibits photosynthesis leading to a reduction in growth [14,15]. Various hormones, Ca2+-related and reactive oxygen species (ROS) signaling pathways play the key role in signal transduction [16]. It is well known that abscisic acid (ABA), ethylene (ET), salicylic acid (SA) and jasmonates (JA) are the major mediators in regulating plant defense response against pathogens and abiotic stresses [17,18].
Plants have evolved an integrated homoeostasis mechanism to cope with ionic imbalance involving numerous transcription factors such as MYB (myeloblastosis), TCP (teosinte branched1 cycloidea PCF1) and WRKY (tryptophan, arginine, lysine, tyrosine containing domain), which control many of the crucial natural processes in plants [19]. The eukaryotic protein kinases are defined as enzymes that use the γ-phosphate of adenosine triphosphate (ATP) to phosphorylate serine, threonine or tyrosine residues in protein [20]. Protein kinases have been reported to regulate the responses of plants to salt and osmotic stress. Salt overly sensitive (SOS) pathway, a novel pathway linking Ca2+ signaling in response to salt stress [21,22], results in the exclusion of excess Na+ ions out of the cell via the plasma membrane. Briefly, following exposure to salt stress, Ca2+ signals are generated, that are sensed by Ca2+ sensors or Ca2+-binding proteins, leading to strong responses of downstream factors, for instance, SOS3 kinase; the binding of calcium and myristoylation of SOS3 activates its function which in turn activates SOS2 kinase. Once activated, SOS2 phosphorylates the SOS1 Na+/H+ antiporter, which pumps Na+ out of the cytosol and reinstates cellular ion homeostasis [23].
Cotton is a moderately salt-tolerant crop, with a salinity threshold level of 7.7 dS m−1 [24]. However, the productivity and quality of cotton is adversely affected by salinity stress in different ways. Germination and seedling growth are particularly affected with increasing salinity resulting in lower crop quantity and quality ultimately reducing total agricultural production. Moreover, the continual soil salinization process is gradually limiting the arable land for cultivation. Owing to the significant agricultural and economic importance of cotton as a major source of fiber and oil, sustainable cotton production is deemed paramount. Therefore, the growing demand for cotton requires the development of new cotton varieties with enhanced productivity in saline environments [25,26]. As such, researchers have focused on exploring the key molecular factors involved in response to salt stress in order to breed salt-tolerant cotton cultivars. Although, Pkinases from various plants have been identified and the regulatory mechanisms in plant development or responses to stress have been explored [27,28], little is known about the involvement of Pkinase genes in response to salt stress in cotton. In the present study, a total of 151 candidate Pkinase genes were identified, with 75 genes in G. hirsutum, 41 in G. raimondii and 35 in G. arboreum. Further detailed investigations such as collinearity analysis of the genetic and physical map of the At and Dt subgenome of G. hirsutum, phylogenetic tree analysis, gene structure and syntenic analysis, subcellular localization, possible functions based on gene ontology and expression analysis in different organs of G. hirsutum and G. darwinii in response to salt stress, were performed to assess the importance of these genes in cotton. These analyses can be used as an important indicator that Pkinase genes could have key roles in response to salt stress. Our findings provide a fundamental background by revealing the evolutionary history of the Pkinase gene family and presents valuable data for efficient use in breeding salt-tolerant cotton varieties.

2. Materials and Methods

2.1. Plant Material

A genetic map generated from the F2 population was developed from an interspecific cross between G. hirsutum L. var. CCRI 12-4 and G. darwinii 5-7 as female and male parents, respectively [9]. The maternal parental line is currently the predominantly cultivated variety (over 90%) in China, but its production is limited due to its low tolerance to drought and salt stress [29]. G. hirsutum var. CCRI 12-4 was established by the Institute of Cotton Research, Chinese Academy of Agricultural Sciences (CAAS), Anyang, Henan Province, People’s Republic of China. G. darwinii is a wild species originating from the Galapagos Islands; it is genetically close to G. barbadense and has many valuable agronomic traits such as fiber fineness, salinity and drought tolerance, verticillium and fusarium wilt resistance [9]. A genetic map was constructed using JoinMap (4.0) [30]. This genetic map was first developed using the same interspecific cross for 188 F2 population mainly composed of expressed sequence tagged-simple sequence repeat (EST-SSR) primers accessible at Cotton Marker Database (CMD) http://www.cottonmarker.org [9]. A total of 2763 polymorphic markers were used in this study. The physical positions of 1523 markers available from the cotton functional genomics database, were downloaded from the website (https://cottonfgd.org) [31], and the collinearity analysis between the genetic and physical maps of these markers was performed using CIRCOS software (v 0.69).

2.2. Gene Mining within SSR Markers

The complete sequences of 1523 polymorphic markers were obtained from the cotton functional genomic database (cottonFGD) [31] and BLASTx with an E-value cut-off ≤ 1 × 10⁻⁵ and identity ≥90%, which was used to find homologous genes in the genomes of G. hirsutum, G. raimondii and G. arboreum. The mining of genetic structures within the marker regions used for constructing genetic maps has been applied previously [32]. The protein kinase domain of each Pkinase gene was confirmed from Simple Modular Architecture Research Tool (SMART) and Protein Families (PFAM) databases [33,34].

2.3. Phylogenetic Analysis

The full-length amino acid sequences encoded by Pkinase genes were aligned by ClustalX program (version 2.0) with default settings and then manually adjusted in Molecular Evolutionary Genetic Analysis (MEGA v6.06) [35]. Subsequently, the evolutionary distance was inferred using the neighbor-joining (NJ) method with 1000 bootstrap replicates using the Jones–Taylor–Thornton (JTT) substitution model in MEGA 6.06 for phylogenetic tree construction. To identify the orthologous genes in cotton, the protein sequences of G. hirsutum Pkinases were subjected to a BLASTp search against the protein database of G. arboreum and G. raimondii; hits with E-values ≤1 × 10⁻⁵ and ≥90% similarity were considered significant.

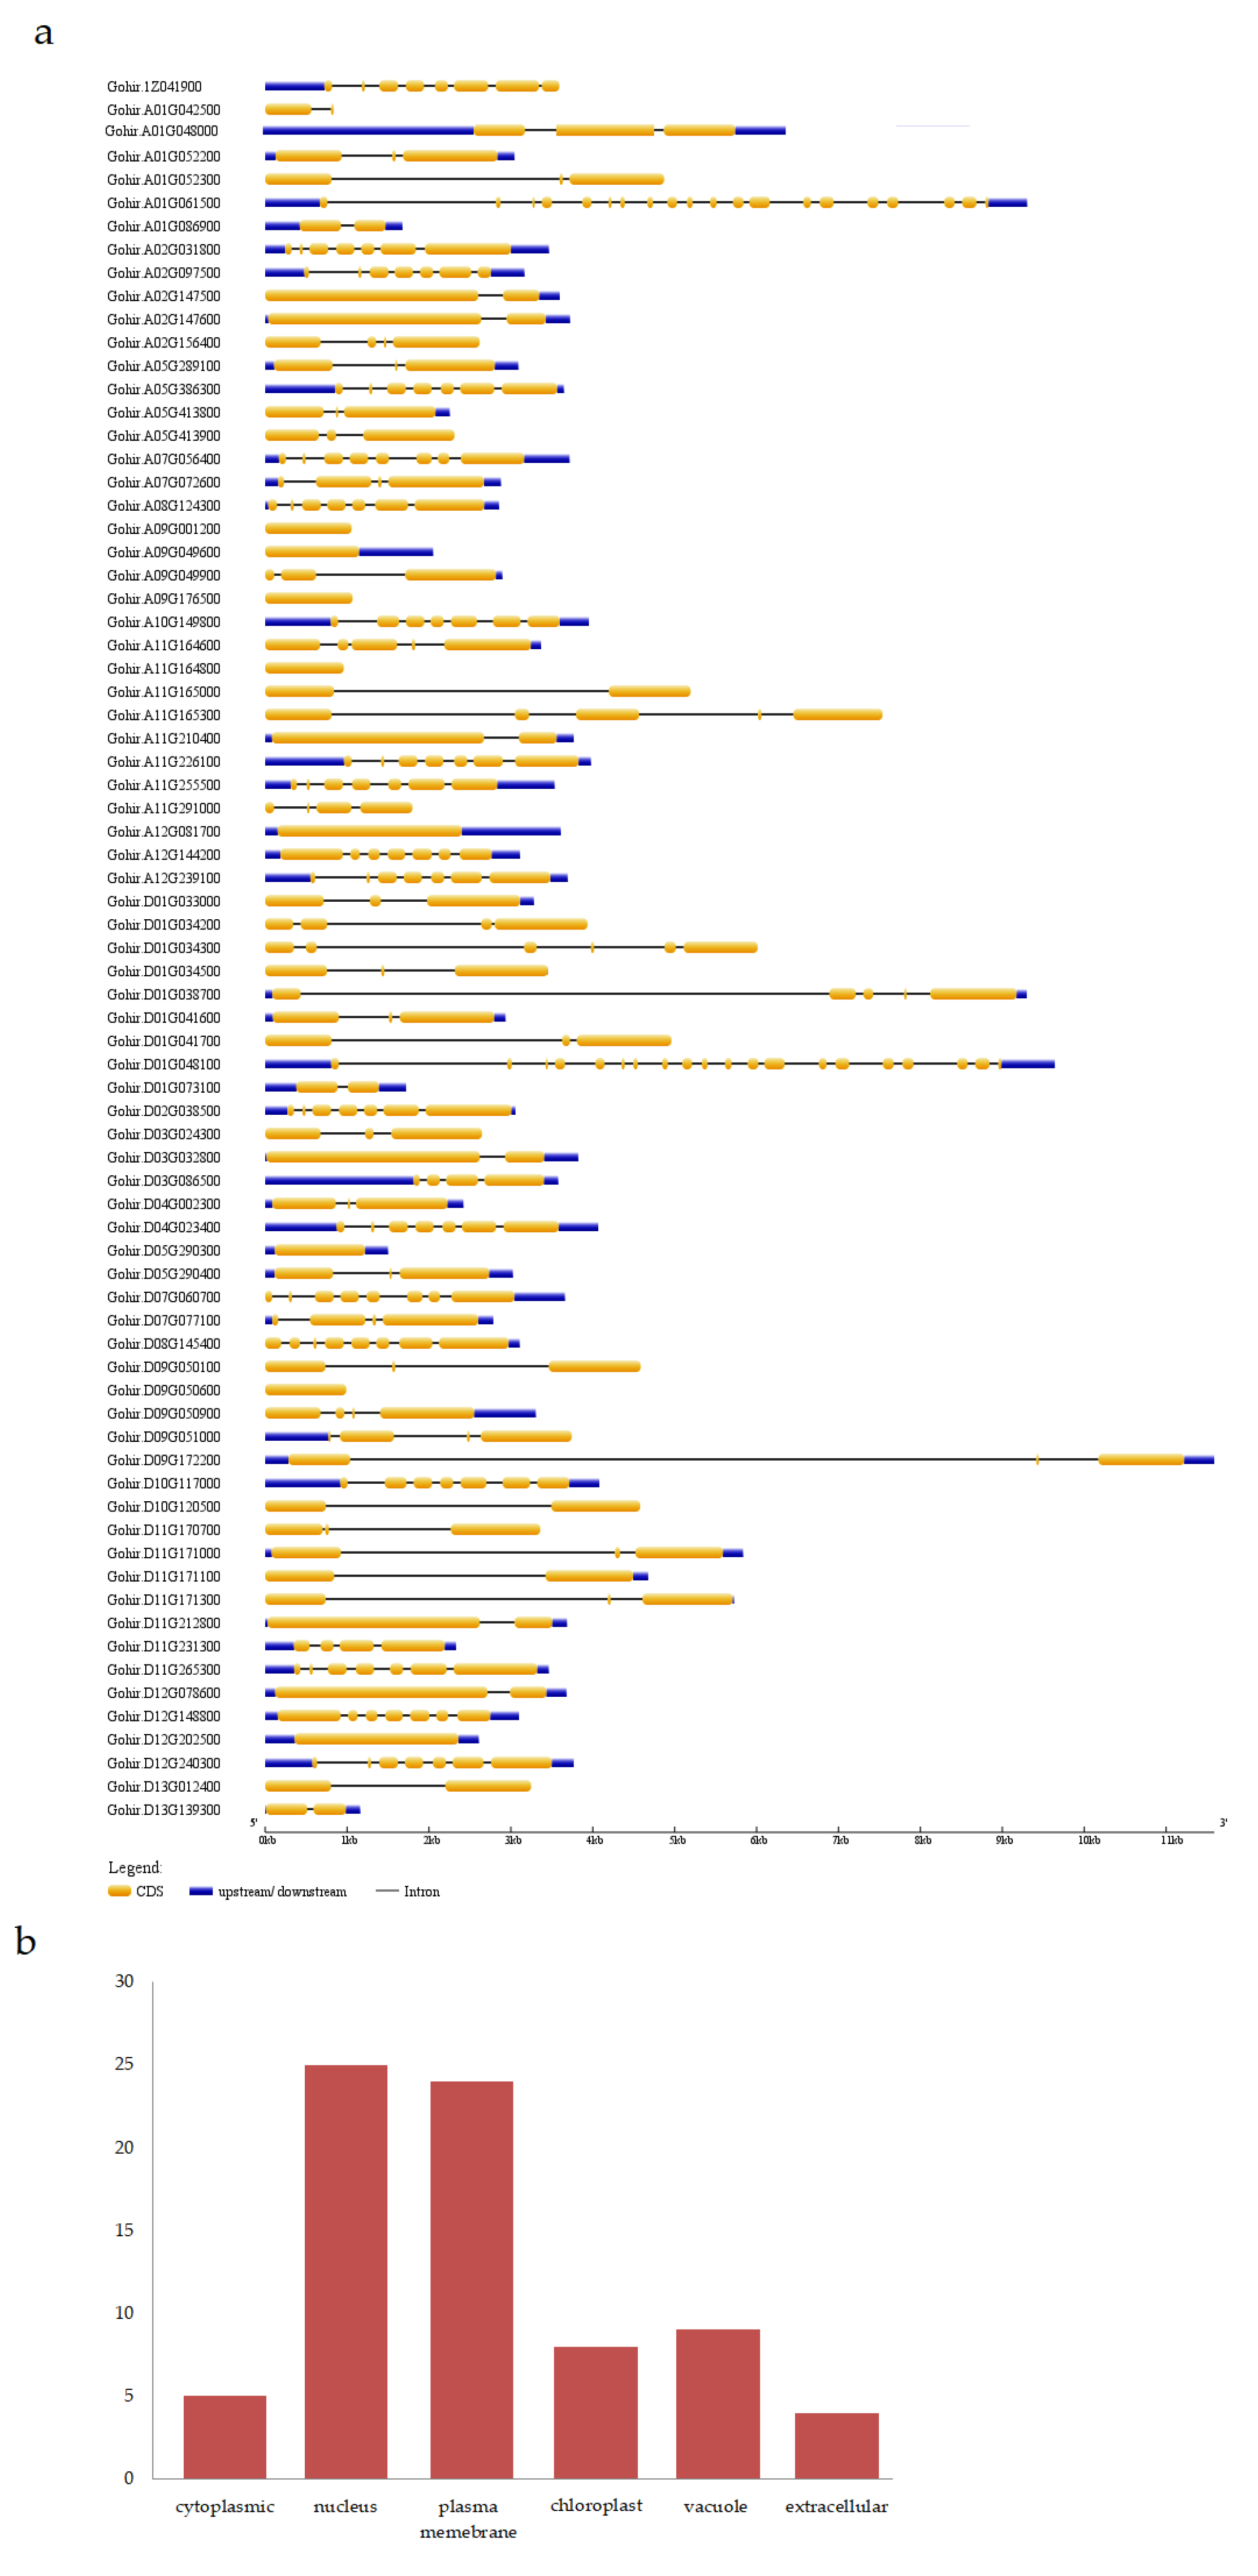
2.4. Subcellular Localization and Structure Analysis

Subcellular location prediction of G. hirsutum genes was conducted using the TargetP1.1 server (http:/www.cbs.dtu.dk/services/TargetP/) and validation for the determination of the possible cell compartmentalization of all the Pkinase proteins was done by WoLFPSORT [36]. The structure of genes was graphically visualized by the Gene Structure Display Server (GSDS) (version 2.0) [37]. Mapchart software was used to plot the gene loci on G. hirsutum, G. arboreum and G. darwinii chromosomes [38]

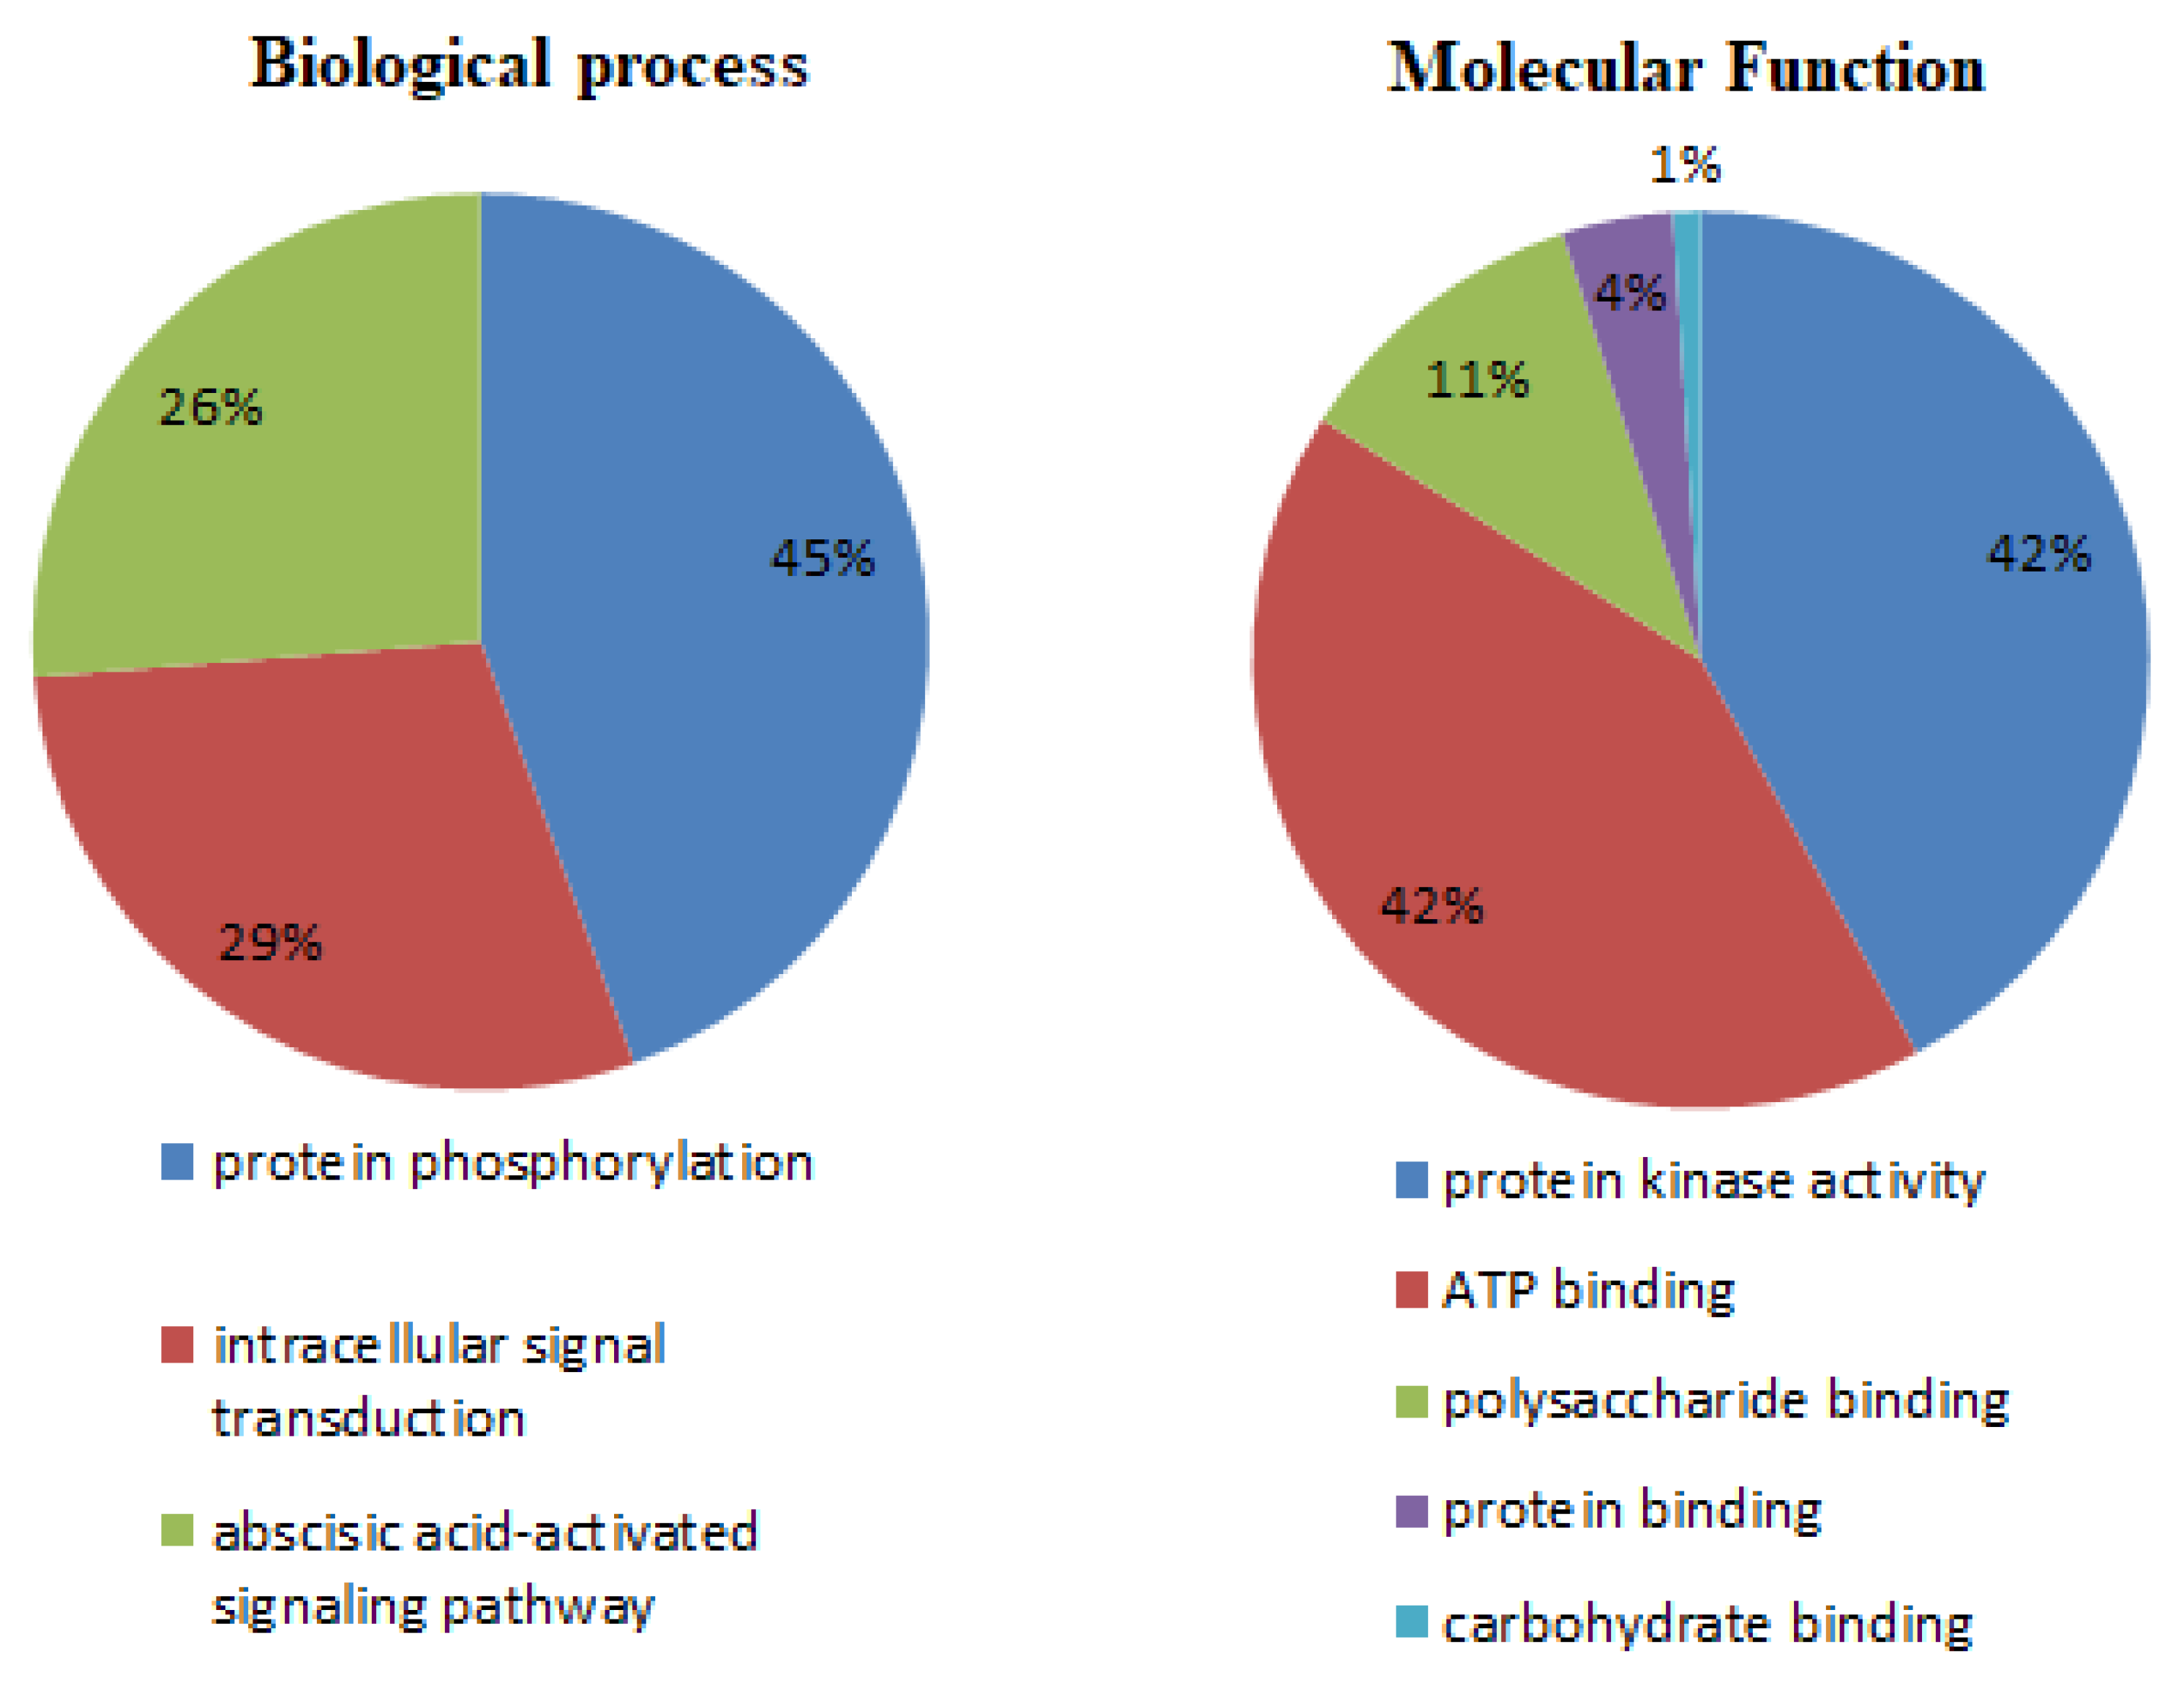
2.5. Gene Ontology (GO) Annotation

Functional classification of genes including cellular component (CC), biological process (BP) and molecular functions (MF) was determined using the cotton functional genomic database (cottonFGD) [31]. A heat map was constructed with R statistical software package based on RNA expression data.

2.6. Syntenic Analysis and Duplication of Genes

Chromosomal distributions of Pkinase genes were mapped on cotton chromosomes by CIRCOS (Circular Genome Data Visualization) software (v 0.69) [39]. Distribution of genes on chromosomes was examined based on gene position. Homologous genes of G. hirsutum, G. raimondii and G. arboreum were identified using BLASTp with a threshold of >80% similarity and at least an 80% alignment ratio based on the protein length. All orthologous genes sequences were aligned using MEGA 6.06 software selecting clustalX with default parameters for alignment. An aligned FASTA file which resulted from MEGA 6.06 was submitted to DNaSP 5.10 (DNA Sequence Polymorphism) to conclude the non-synonymous (Ks), synonymous (Ka) and synonymous/nonsynonymous substitutions (Ka/Ks) [40]. MCScanX, a package from the Plant Genome Duplication Database (PGDD) (http://chibba.pgml.uga.edu/duplication/), was used to perform syntenic analysis of orthologous genes among the genomes of the three cotton species as described previously [41].

2.7. Prediction of miRNA Target and Transcription Factor Binding Sites (TFBS) Analysis

The microRNA (miRNA) sequences of G. hirsutum were obtained from miRBase [42], the plant microRNA database (PMRD) [43] and EST database (dbEST) [44]. Pkinase genes targeted by miRNAs were predicted by searching their coding sequence (CDS) regions for complementary sequences atcottonFGD [31], and the sequences were blasted through online software http://bioinformatics.cau.edu.cn/PMRD, to obtain miRNA sequences. In order to find the gene targeted by miRNAs, both 5′ and 3′ untranslated regions and CDS sequences of all the mined genes were searched for complementary sequences of the cotton miRNAs using the psRNATarget server with default parameters [45]. Additionally, for cis-element or TFBS analysis, the genomic sequences of 1.5 kb upstream of the translation start site (TSS) of each Pkinase gene was extracted from the assembly files of G. hirsutum, downloaded from CottonFGD [31]. The putative transcription response elements (TREs) of the Pkinase gene promoter regions were predicted using the online tool at the PLACE database [46].

2.8. Plant Material and Hydroponic Culture

The experiment was carried out in a controlled environment at the Institute of Cotton Research (ICR), Chinese Academy of Agricultural Sciences (CAAS) Anyang, Henan Province, China. Hydroponic culture used for this experiment was based on the method described by Oluoch [47], with three replicates. Seeds of cotton (G. hirsutum CCRI 12-4 and G. darwinii 5-7) were surface-disinfected in 0.5% sodium hypochlorite (NaClO) for 5 min and washed five times with sterile distilled water. Afterwards, healthy seeds were sorted out after seed grading and transferred to autoclaved petri plates containing sterile double-layered Whatman filter paper in an incubator at room temperature for 3 days until germinated. The filter papers were soaked in 100 mL of distilled water and retained in the incubator at 33 °C. Three similar seedlings were chosen and transferred into holes of thermo-pore sheets and fixed in the tray with the help of a soft sponge. About 7 L of half strength modified Hoagland nutrient solution was maintained in every container [48], air pumps were attached to each container for aeration in the solution to ensure proper root growth. Temperature in the greenhouse was kept between 27–30 °C with photoperiod of 14-h/10-h light/dark cycle. At the three-leaf stage, the nutrient solution was supplemented with 200 mM sodium chloride (NaCl) solution, while the control plants were treated with sterile distilled water in the same way. The samples for RNA extraction were collected at 0, 1, 3, 6 and 12 h after stress exposure from leaves, roots and stems of both stressed and control plants. All samples were directly frozen in liquid nitrogen and stored at −80 °C for extraction of RNA.

2.9. RNA Sequence and RT-qPCR Analysis

The RNA sequence data was extracted from the website at cottonFGD [31], with reference to control and salt stress expression profiles at different time intervals. SIGMA Life Science STRN50-1KT, SpectrumTM RNA kit (Sigma-aldrich, Darmstadt, Germany) was used for extraction of RNA according to the manufacturer’s protocol. The concentration and quality of RNA samples were determined by NanoDrop 2000 spectrophotometer (Thermo Fisher Scientific, Wilmington, DE, USA) and RNA at the standard spectrum of 260–280 and range of 1.85–2.0 were used for RT-qPCR analysis. Single strand cDNA was synthesized using reverse transcriptase and TranScript-All-in-One Single Strand cDNA Synthesis SuperMix (TransGen Biotech kit, Beijing, China) for RT-qPCR analysis following the manufacturer’s procedure. Primers for 12 genes were designed using NCBI (National Center for Biotechnology Information) primer blast tool. Detailed information about primers is presented in Table S1. Fast real-time PCR machine (7500) with 10 µL of FastStart Universal SYBR Green Master (Rox) sigma solution (Roche Diagnotics, Mannheim, Germany) for each sample was used to perform RT-qPCR analysis. The final reaction volume was adjusted to 20 µL, containing 6 µL double distilled water, 2 µL cDNA, 10 µL SYBR green, 1 µL each of forward and reverse primer and 2 µL of Ghactin7 primer pair used as a reference. Three technical repeats were used for RT-qPCR. The expression profile of genes was calculated using the formula E = 2−∆∆Ct.
The expression value of cotton (FPKM, fragments per kilobase per million reads), calculated from high-throughput RNA-sequencing data was downloaded from CottonFGD [31] and used to systematically analyze the expression profiling of cotton Pkinase genes in different tissues and under different stress regimes. Gene expression levels were calculated according to the log10 of FPKM values and the default empirical abundance threshold of FPKM >1 was used to identify the expressed gene.

3. Results

3.1. Genetic Linkage Map Features

The genetic map used in this study was based on Chen et al. [9], consisting of 2922 markers amplifying 2763 loci plotted into 26 linkage groups corresponding to 26 chromosomes. It comprised 4176.7 cM of the genome with an average inter loci distance of 1.51 cM. In total, 636 eSSRs were distributed on the At subgenome while 683 loci were on the Dt subgenome. In addition, 715 gSSRs were distributed on the At subgenome and 729 gSSRs on the Dt subgenome. More loci were distributed on the Dt rather than the At subgenome.

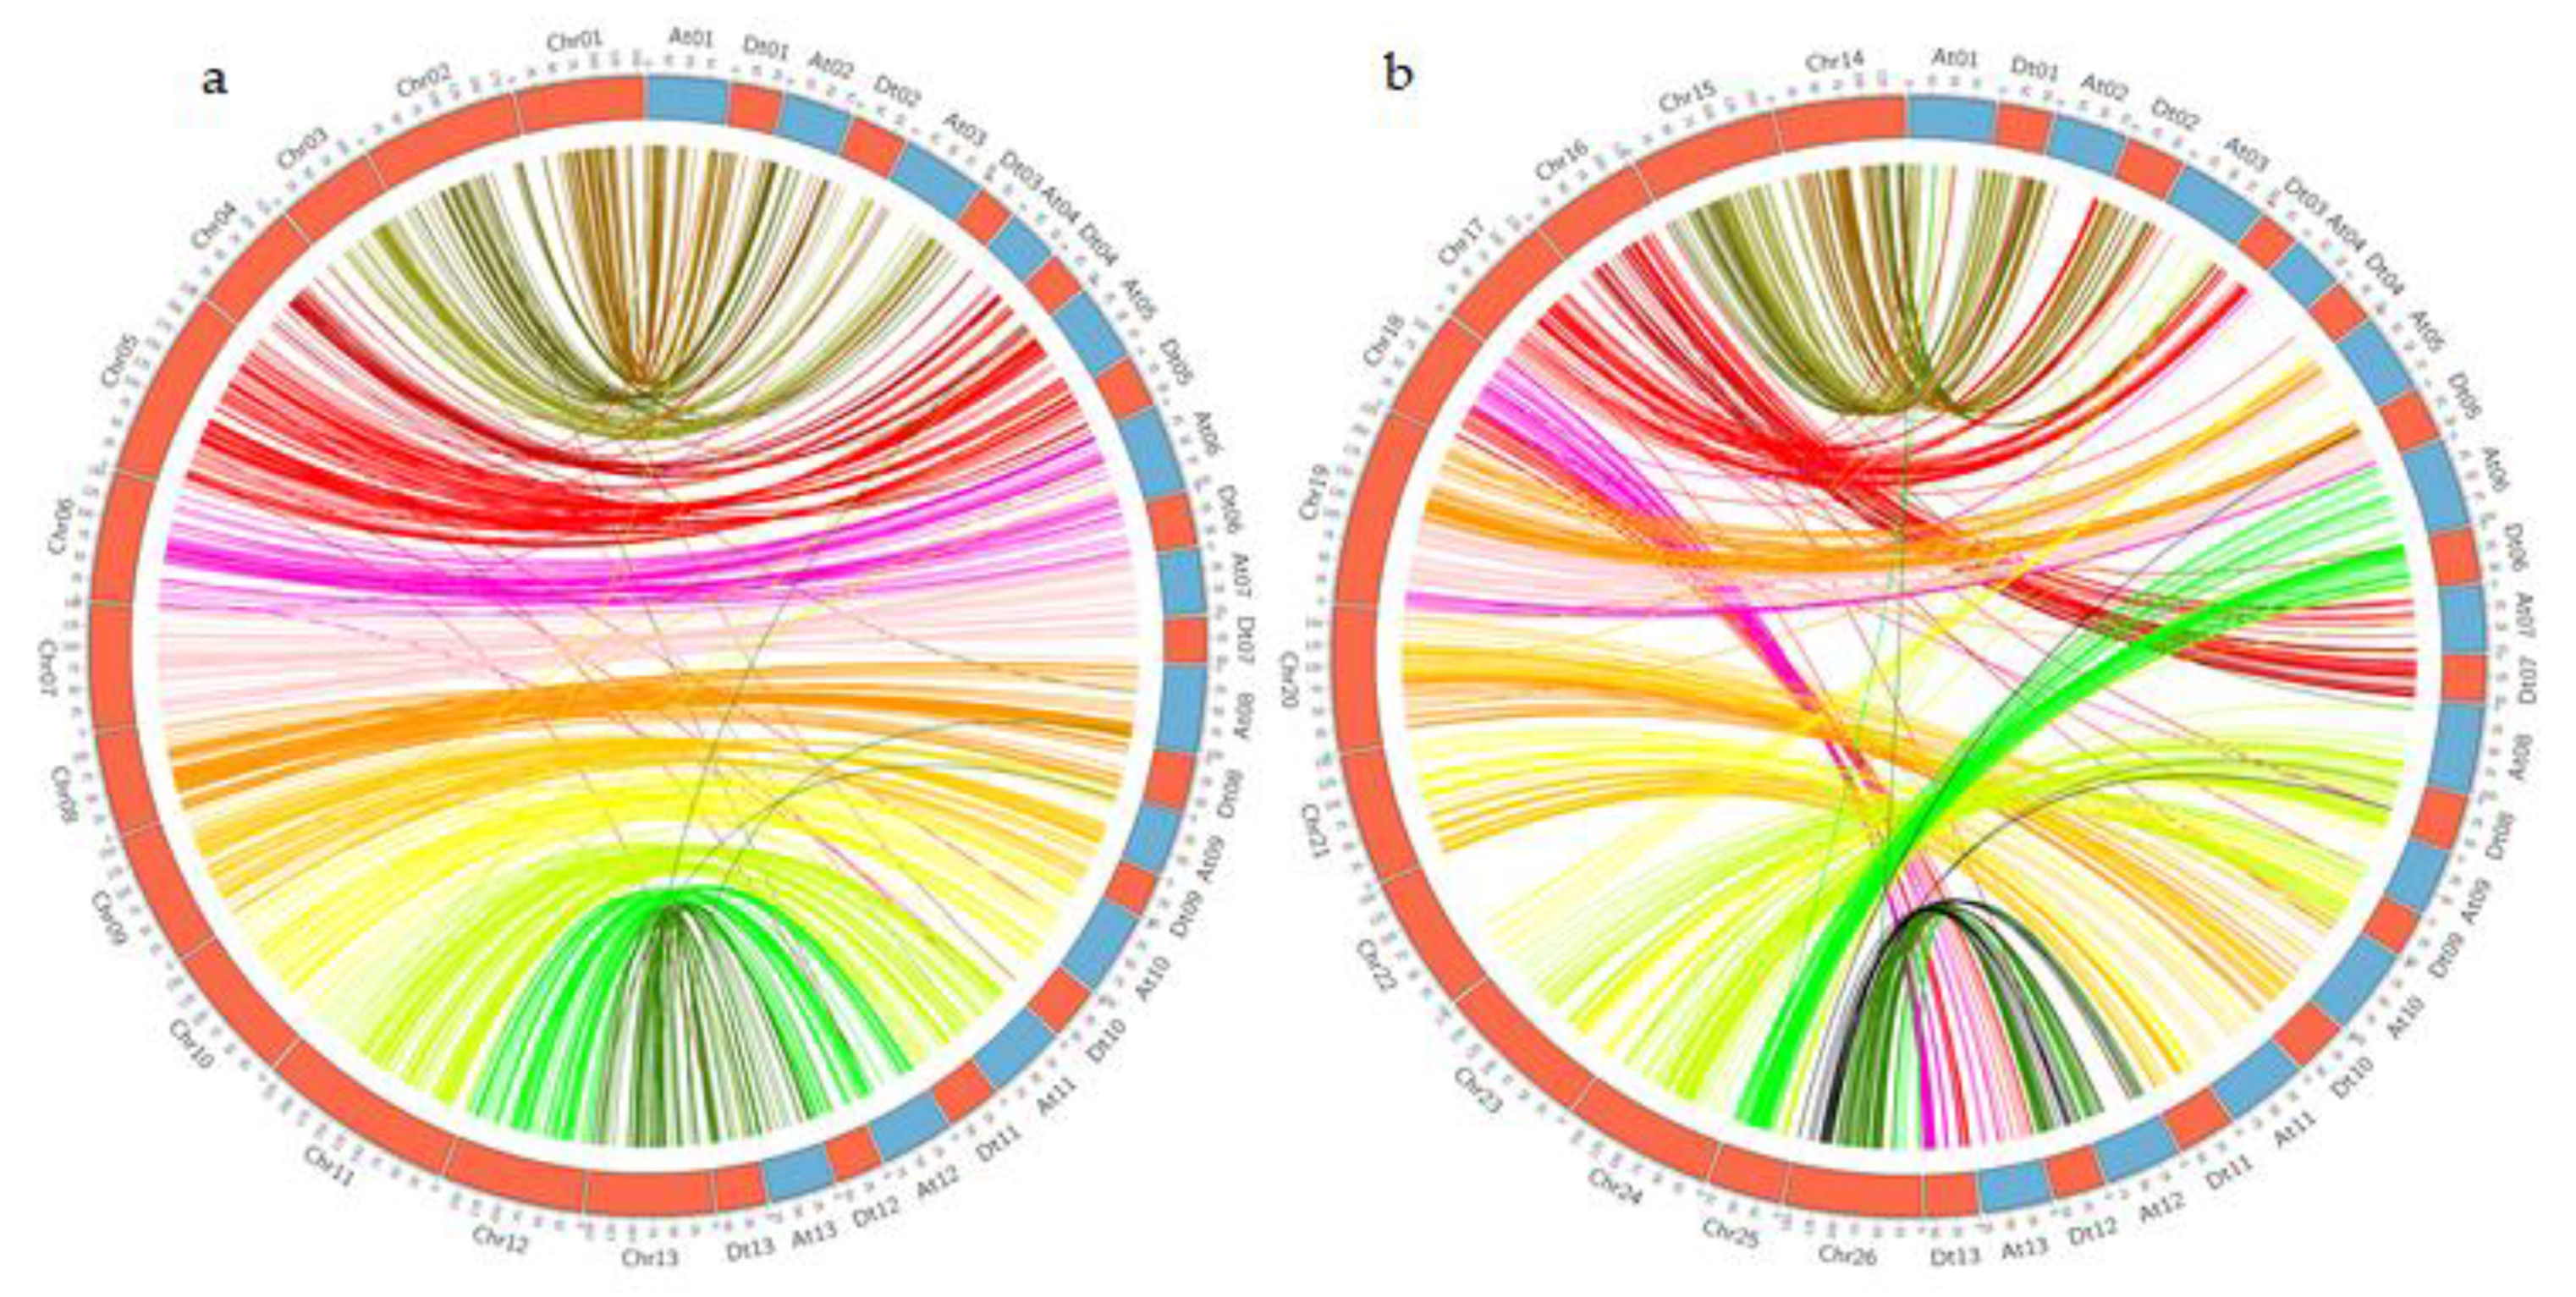
3.2. Assessment of Collinearity of the Genetic and Physical Map of G. hirsutum

A total of 2763 polymorphic markers were blasted against At and Dt subgenomes of G. hirsutum and 1523 matches were obtained after removing redundant markers. Finally, 1523 markers were used for collinearity analysis between the genetic and physical map of At and Dt subgenomes of G. hirsutum. In the At subgenome, chromosomes 1–13 in the genetic map showed collinearity with At and Dt subgenomes of the physical map. In the At subgenome, chr1 homologs with A1 and chr2 with A2 in sequence, but in the Dt genome the chromosomes have random collinearity such as chr14 homologs with D1 and chr22 homologs with D4 (Figure 1). The results indicated that most of the markers on At and Dt subgenomes of G. hirsutum exhibited good collinearity blocks (Table S2).

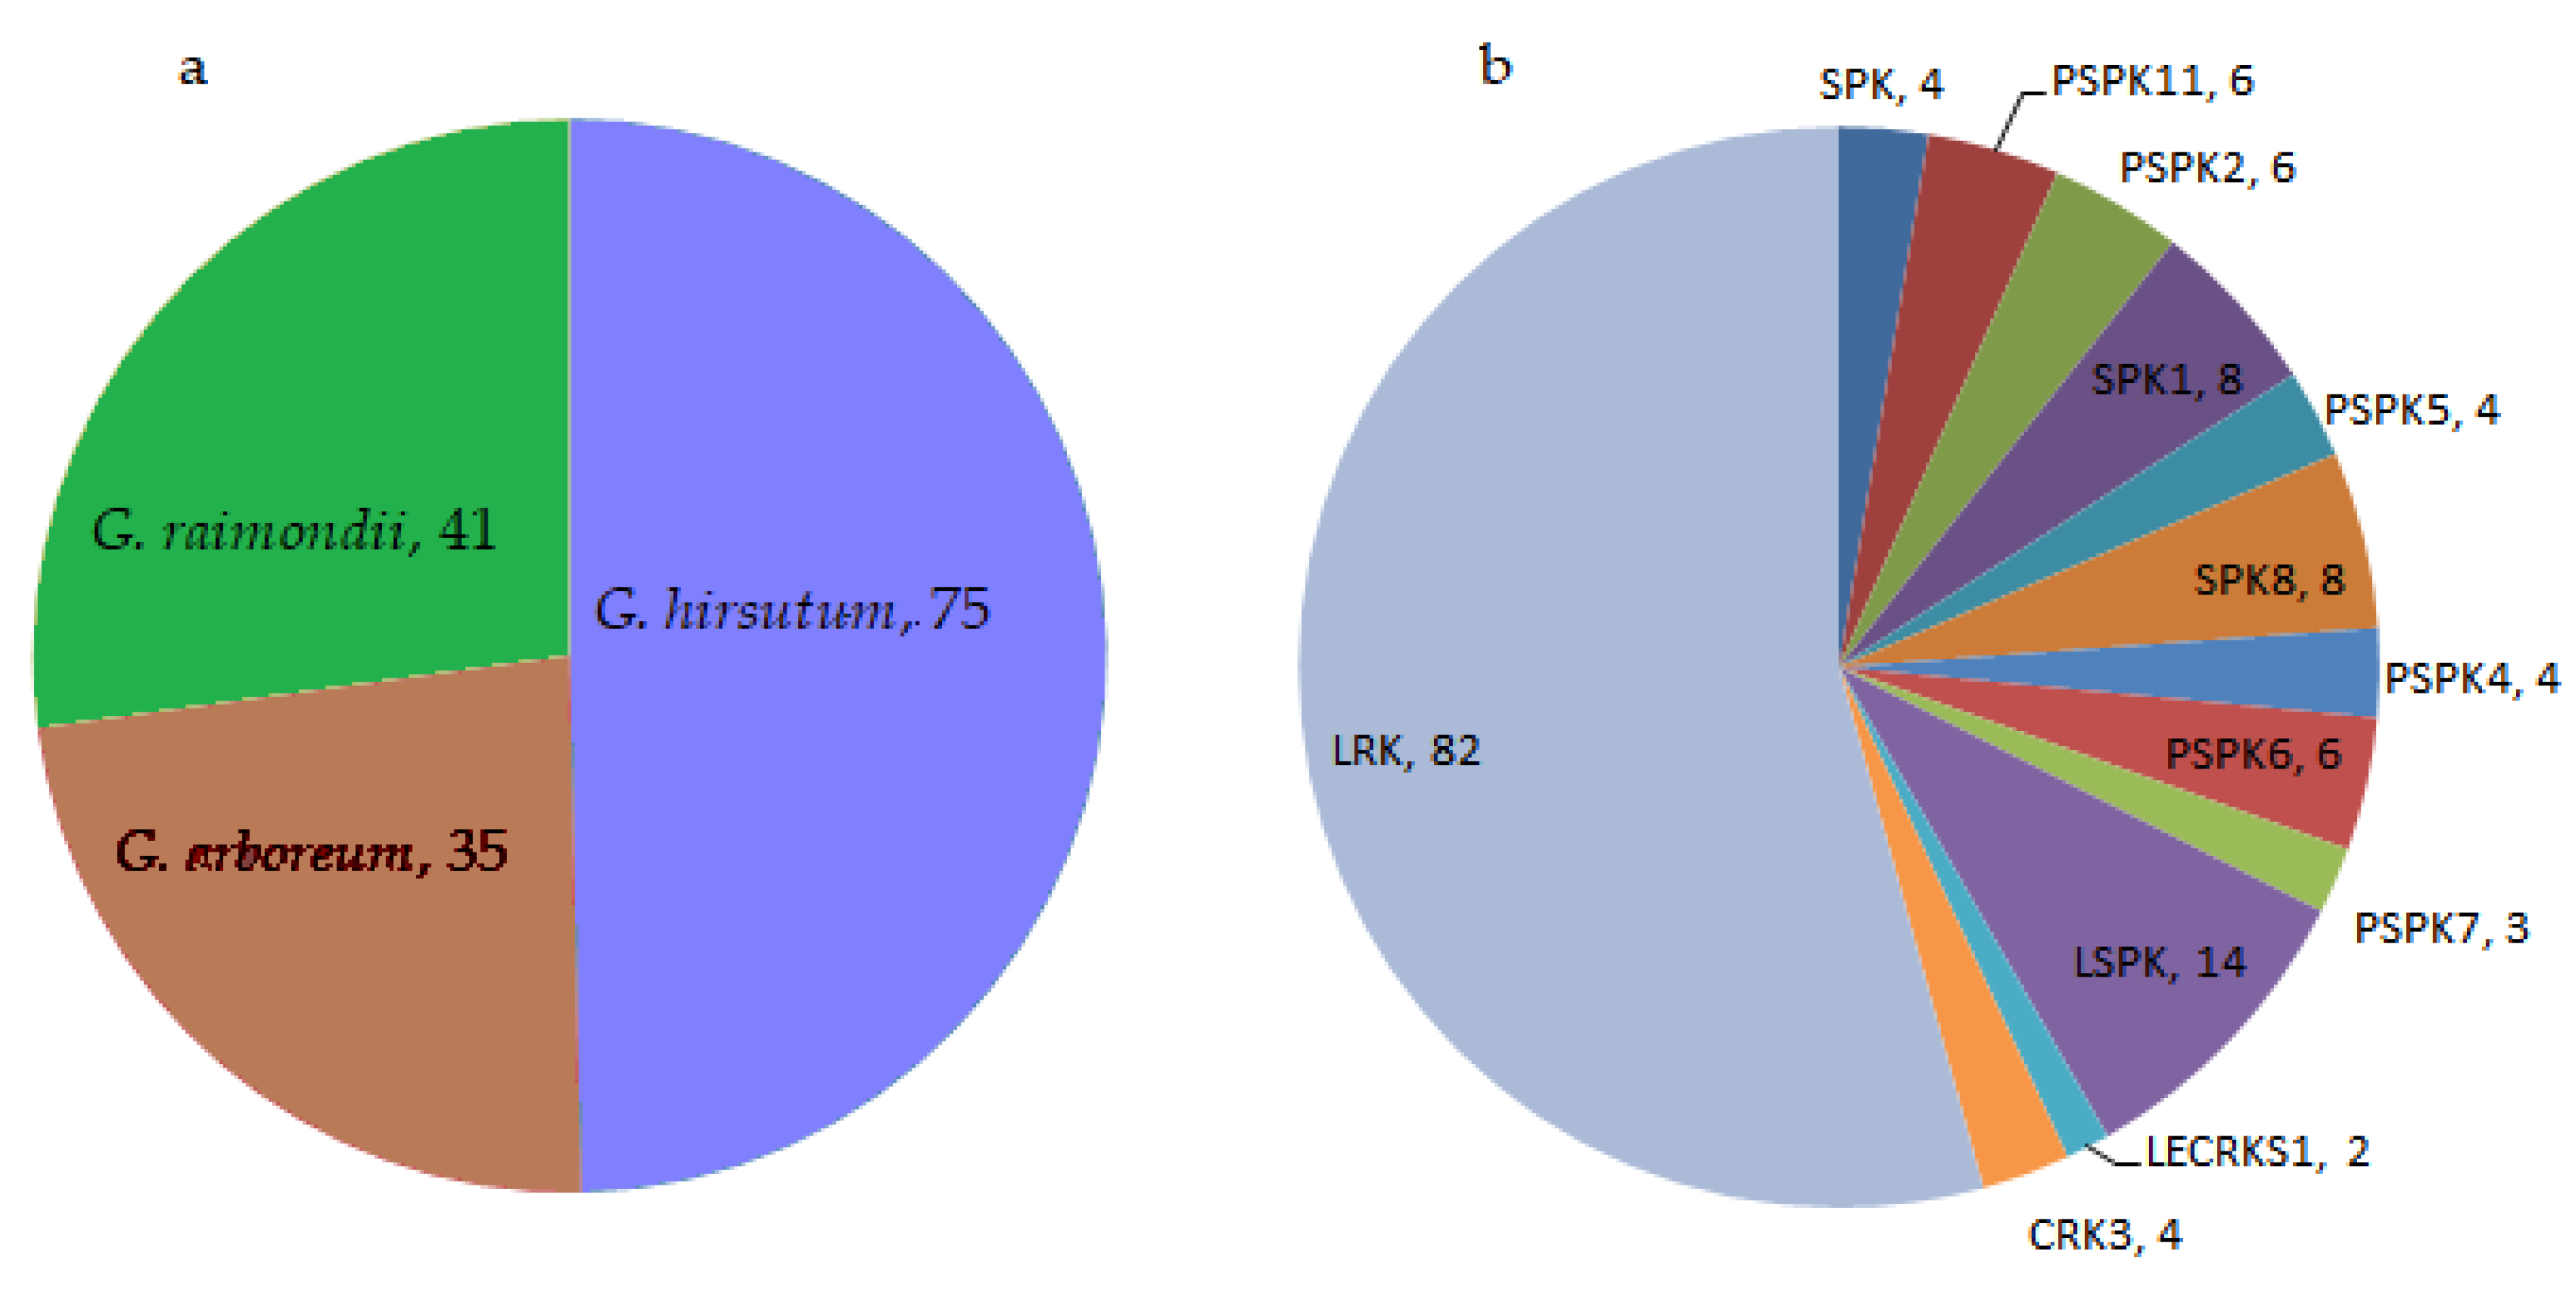
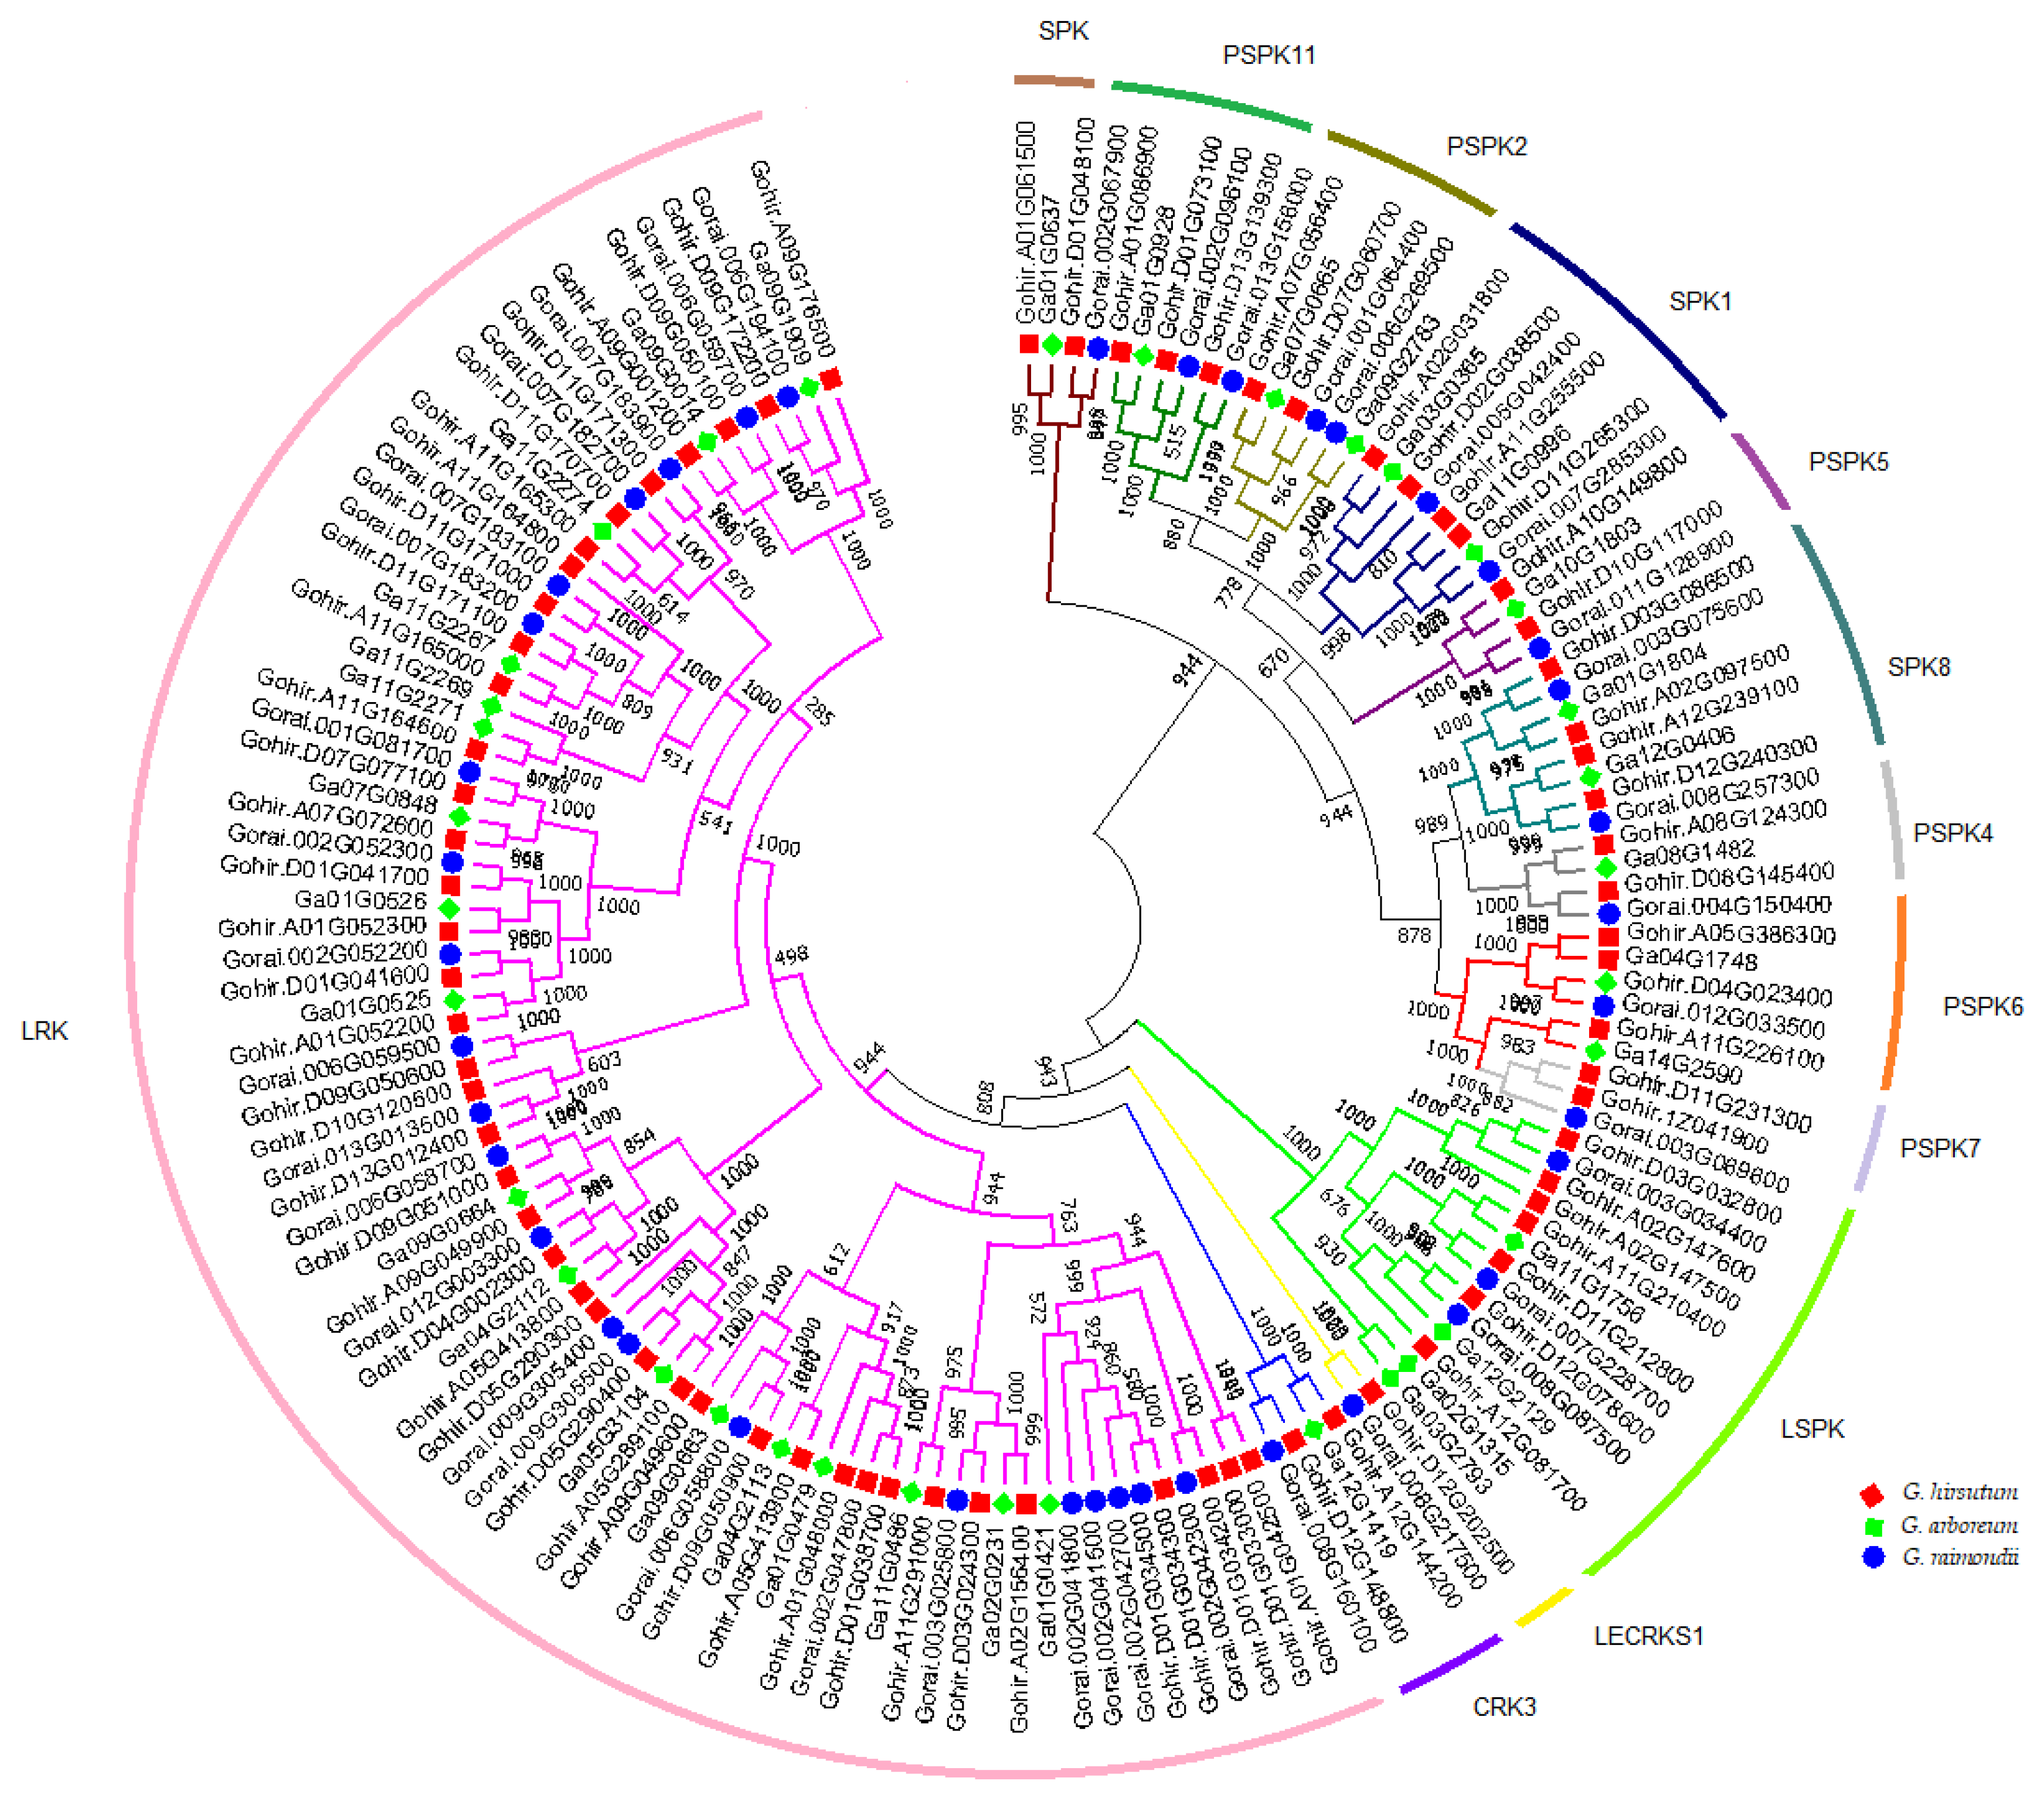
3.3. Phylogenetic Analysis

Phylogenetic tree analysis provides valuable knowledge on the lines of evolutionary descent of different genes or proteins from a common ancestor, and a powerful tool for structure classifications, biological diversity and for providing insight into events that occurred during gene evolution [49]. A total of 1257 genes were predicted from the blast of 1523 SSR polymorphic markers in all three species. Since it was technically unfeasible to analyze all the gene domains simultaneously, the domains with the highest frequency of occurrence, termed as the dominant domains, were selected for further analysis. Based on this criterion, 151 genes belonging to the Pkinase domain were analyzed; G. raimondii, G. arboreum and G. hirsutum were found to have 41, 35 and 75 genes of the Pkinase domain (PF00069), respectively (Table S3, Figure 2a). A neighbor-joining phylogenetic tree was constructed to comprehend the evolutionary history and relationships among Pkinase gene classes in cotton species (Figure 3).
The resulting phylogenetic tree showed that the cotton Pkinase genes tend to cluster together. Based on the clustering pattern, Pkinase genes in cotton were further classified into 13 subfamilies including probable types of serine/threonine-protein kinases (four genes), serine/threonine-protein kinase WNK11 (six genes), serine/threonine-protein kinase WNK2 (six genes), serine/threonine-protein kinase WNK1 (eight genes), serine/threonine-protein kinase WNK5 (four genes), serine/threonine-protein kinase WNK8 (eight genes), serine/threonine-protein kinase WNK4 (four genes), serine/threonine-protein kinase WNK6 (six genes) and serine/threonine-protein kinase WNK7 (three genes); as well as leucine-rich repeat receptor-like serine/threonine-protein kinase (14 genes), L-type lectin-domain containing receptor kinase (two genes), cysteine-rich receptor-like protein kinase 3 (four genes) and leaf rust resistance kinase (82 genes) (Figure 2b). Leaf rust resistance kinase (LRK) was the largest group with 82 genes from G. hirsutum (41), G. raimondii (22) and G. arboreum (19); the second largest group was LSPK (leucine-rich repeat receptor-like serine/threonine-protein kinase), with 14 genes, while the smallest number belonged to L-type lectin-domain containing receptor kinase (two genes). Several Pkinases contained other domains in addition to the kinase domain with a maximum number of five different domains coded by a single gene (Table S3). For instance, leucine-rich repeat receptor-like serine/threonine-protein kinase was involved in others domains including LRRNT_2 (leucine-rich repeat N-terminal domain, PF08263), LRR_8 (leucine-rich repeat, PF13855) and LRR_1 (leucine-rich repeat, PF08263). The total number of orthologous genes among G. hirsutum, G. arboreum and G. raimondii were 92 out of 151 genes, translating to 60.92% of the mapped genes in the phylogenetic tree. Thirteen subfamilies were made into separate groups in the phylogenetic tree with each one indicated by a different color as shown in Figure 3.
Among the three Gossypium species, the sum total of Pkinase genes in G. arboreum and G. raimondii, regarded as A-genome and D-genome ancestors of the allotetraploid species, respectively, were roughly equal to G. hirsutum, which has been a consistent feature regarding the respective diploids and tetraploids genomes (Table S3). Additionally, the Pkinases localized in the At subgenome of upland cotton mainly clustered with that of G. arboreum, and those situated in the Dt subgenome clustered with the Pkinases of G. raimondii (Figure 3). These results are consistent with the hypothesis that allopolyploid cotton types arose as a result of the two diploid species reuniting geographically followed by chromosome polyploidization approximately 1–2 million years ago (MYA) [6,50], suggesting that the Pkinase gene family of allotetraploid cotton types might have expanded by hybridization and a subsequent polyploidization event.

3.4. Chromosomal Distribution of Pkinase Genes

A blast search was conducted to identify a total of 151 Pkinase genes in all three species, using the sequences of 1523 polymorphic markers on both At and Dt subgenomes. Distribution of genes on chromosomes was determined based on their relative positions and information retrieved from reference cotton genome sequences. Chromosomal distribution was revealed using BLASTn against the three reference cotton genomes in the cotton functional genomic database [31] (Figure S1 and Table S4). In total, 75 Pkinase genes were mapped on 21 chromosomes of G. hirsutum. Two genes could not be mapped on any chromosome, alternatively they were assumed to be located in scaffolds. The highest numbers of mapped genes were distributed on the Dt subgenome as compared to the At subgenome. More genes were distributed on the chromosomes At11 and Dt15. In G. hirsutum, At8, At10, Dt14 and Dt24 contained smaller number of genes; one in each At and Dt subgenome (Table 1).
In the A genome of G. arboreum, 35 genes for the Pkinase gene family were mapped and dispersed on 11 different chromosomes, one gene was observed in the scaffold. The chromosomes A01 and A11 contained the highest number of genes (seven genes) accounting for 20% of the total genes in the A genome.
In G. raimondii, 41 genes for the Pkinase gene family were mapped on 13 chromosomes of the D genome. The highest number of genes (nine genes) was found on chromosome D02 with 21.95% in the D genome (Table 1). A distinct clustering scheme was observed in particular regions of the chromosomes of the three species at the time of mapping; most of the genes were clustered on the top and lower arm regions of the chromosomes (At1, At7, At12, Dt1, Dt3, Dt16, Dt18, Dt19, Dt20, A02, A03, A07, A09, A011, D01, D03, D09, D12 and D13) while only a smaller number occurred in the middle region.

3.5. Structural Analysis and Localization of Genes

Analysis of the exon­/intron structure of the Pkinase genes in G. hirsutum was done using the Gene Structure Display Server [37]. Gene structural diversity is regarded as a possible indicator for the evolution of multigene families [51]. To gain further information into the structural diversity of cotton Pkinase genes, the exon/intron organization in the full-length cDNAs was analyzed in comparison with their corresponding genomic DNA sequences of individual genes in G. hirsutum (Figure 4a,b), and it was found that a greater percentage of the Pkinase genes and their exons were highly conserved within the group (Table S5). Pkinase genes are generally identified with the presence of three exons and two introns. The maximum number of exons and introns were noted in Gohir.D01G048100 (21 exons, 20 introns) and Gohir.A01G061500 (20 exons, 19 introns). Interestingly, five genes had just one exon and no introns. Exons and introns for different Pkinase genes were observed to be dissimilar based on their lengths. For instance, 16 genes have similar structures having two exons and one intron. Another 20 genes have three exons and two introns; the number of exons in genes ranged between nine and one while introns ranged between zero to eight. The remarkable structural diversity suggests the divergent functions performed by this group of the protein family in upland cotton. The detailed information such as number of exons and introns, isoelectric point, grand average hydropathy, molecular weight and the length of protein in G. hirsutum is given in Table S5.
The physicochemical parameters of each Pkinase gene were calculated using the online tool, ExPASy [52]. All the Pkinases in G. hirsutum had negative grand average of hydropathy (GRAVY) values ranging from −0.701 (Gohir.D01G048100) to −0.015 (Gohir.D01G034300), which implied that the cotton Pkinases are hydrophobic, a common property found among the stress inductive genes, such as late embryogenesis abundant (LEA) genes with average GRAVY values lower than 0 [53]. Similarly, the molecular weights in kilodalton (kDa) varied from 22.818 (Gohir.A01G042500) to 112.001 (Gohir.D03G032800). Protein lengths ranged from 198 (Gohir.A01G042500) to 1026 amino acids (Gohir.D03G032800, Gohir.A02G147600), while the isoelectric point (PI) ranged between 4.332 (Gohir.D03G086500) and 9.373 (Gohir.D09G050600). Very low GRAVY values <0 and a high net charge on the Pkinases point to a unique feature also observed among the cyclin-dependent kinase (CDK) genes in Arabidopsis [54]. Various stress inducible proteins are commonly characterized by low hydrophobicity and a high net charge, which enables them to be totally or partially disordered; this feature gives the Pkinase proteins the ability to form flexible molecular structures such as molecular chaperones, which are central to the protection of plants from desiccation effects [55].
The online WoLFPSORT analysis indicated that Pkinase proteins are distributed in six different sites with the majority of the proteins found to be localized within the nucleus (25) or embedded in the plasma membrane (24), accounting for 33% and 32% of all the Pkinase proteins, respectively, while a lesser number were found to be localized in chloroplast (eight), vacuole (nine), cytoplasm (five) and extracellular matrix (four) (Figure 4a,b and Table S6). Subcellular location prediction was elaborated using the TargetP1.1 server and validated for possible cell compartmentalization by WoLFPSORT [36].

3.6. Gene Annotation by GO Analysis

Putative functions of 75 genes in G. hirsutum Pkinase gene family, including biological processes (BP), molecular functions (MF) and cellular components (CC), were identified using cotton functional genomics database [31]. In biological processes, the functions include protein phosphorylation (GO:0006468) (45%), intracellular signal transduction (GO:0035556) (29%) and abscisic acid activated signaling pathway (GO:0009738) (26%). Various molecular functions were noted such as protein kinase activity (GO:0004672), (42%), ATP binding (GO:0005524) (42%), polysaccharide binding (GO:0030247) (11%), protein binding (GO:0005515) (4%) and carbohydrate binding (GO:0030246) (1%) (Figure 5).

3.7. Duplication and Syntenic Analysis of Genes

Three types of duplication events are primarily responsible for the expansion of gene families, namely, tandem, segmental and whole genome duplications [56]. The genomes of the three cotton species were combined to explore relationships between gene synteny and duplication in the Pkinase family. A total of 99 genes were found to be duplicated across three cotton species subjected to analysis (Figure 6, Table S7). Most of the gene duplication occurred between G. hirsutum and its progenitors, G. raimondii and G. arboreum, resulting in the origin of polyploid AD genome from A and D genomes and the evolution of the new species, G. hirsutum. Results indicated that mostly two types of duplication events occurred in Pkinase (tandem and segmental). Most of the duplicated genes belonged to the segmental type, implying that segmental duplication played a crucial role during the course of evolution of gene families (Figure 6). The resultant calculation of Ka/Ks gene orthologs indicated that 92 pairs had values less than one while seven genes had more than one Ka/Ks value, which shows that genes have negative/purifying selection (Table S8). Previously, the Ka/Ks ratio of 156 paralogous pairs had values less than one and 20 pairs had more than one for the LEA family in cotton [57]. The highest Ka ratio of 0.2912 was noted for gene pairs in Dt vs. DD genome of gene pairs. The Ka value of At vs. AA ranged from 0–0.0848. The Ka/Ks value was higher for Dt vs. DD genome gene pairs (2.69014) as compared to At vs. AA and AA vs. DD (Figure 6; Table S8). These results are similar with previous findings for other gene families in the same cotton species, such as in the case of reactive oxygen species (ROS) gene family where Ka/Ks value of 1.8 for Dt vs. DD genome, 1.7 for At vs. AA and 1.0 for AA vs. DD genomes was observed [58].

3.8. Prediction of Transcription Factor Binding Sites

Transcription factors (TFs) temporarily and spatially regulate the transcription of their target genes through binding cis-acting regulatory elements and also acting as terminal points in the signal transduction process [59]. The cis-regulatory promoters are located upstream of genes which function as binding sites for transcription factors (TFs) that are essential in determining the tissue-specificity or stress responsive expression patterns of the genes [60]. To explore regulatory interactions between TFs and cotton Pkinase promoter elements, we collected the upstream 1.5 kb genomic sequences relative to the translation start site (TSS) of each Pkinase gene as putative promoter regions. Several stress responsive cis-acting regulatory elements were present abundantly in Pkinase genes in G. hirsutum such as ABRE (abscisic acid responsiveness), MBS (drought-inducibility), MYBS (abiotic stress tolerance), TCA element (salicylic acid responsiveness) and CCAAT-box (plant MYBHv1 binding site), among others (Table 2). Several of the identified cis-regulatory elements such as ABRE, DRE and MYB have been previously known to be linked with top-ranked plant stress responsive genes [61]. The presence of promoter elements involved in stress response strongly suggests the possible role of upland cotton Pkinase genes in growth and development processes as well as responding to various stress stimuli in cotton.

3.9. miRNA Target Analysis of Genes

MicroRNAs (miRNAs) are small RNA molecules, which function as regulators of gene expression in a range of developmental and signaling pathways in plants and animals. A number of studies have shown that abiotic stress trigger aberrant expression of many miRNAs, thus indicating that miRNAs may be a new target for genetically improving plant tolerance to certain stresses [62]. Similarly, in cotton, G. hirsutum, a group of miRNAs have been found to target several of the identified genes, and some of them respond to salt and drought stress [63]. To preliminarily explore the miRNA-mediated posttranscriptional regulatory mechanisms of the Pkinase gene family in cotton, we searched putative target sites of cotton miRNAs in CDS sequences using the psRNATarget server. The prediction of different genes targeted by miRNAs by the use of psRNATarget has already been applied for other functional genes in cotton [45,53]. Upon examining the association of G. hirsutum genes to the known cotton ghr-miRNAs, it was found that a total of 33 genes out of the 75 were targeted by 17 ghr-miRNAs, translating to 44% of all the genes of the protein kinase group.
The highest levels of target were detected for the following miRNA (six genes): ghr-miR396f targeted Gohir.D12G202500, Gohir.D03G032800, Gohir.A02G147600, Gohir.D12G078600, Gohir.A02G147500 and Gohir.A12G081700; other miRNAs targeted two genes: ghr-miR5565b, ghr-miR7493, ghr-miR7501, ghr-miR482a, ghr-n25, ghr-miR399j, ghr-miR395b, ghr-miR162a, miR172c, and lastly ghr-miR156f; while the rest of the genes were targeted by single miRNAs: Gohir.D04G002300 (ghr-n29), Gohir.D01G033000 (ghr-n26), Gohir.D01G041600 (ghr-miR156e), Gohir.D08G145400 (ghr-miR399k), Gohir.A01G042500 (ghr-miR395b) and Gohir.D13G012400 (ghr-miR159b) (Table S9). The variations in miRNA targets of Pkinase genes suggest that this class of protein family has diverse functions in salt stress. The 19 genes belonging to the serine/threonine-protein kinase subfamily were targeted by higher number of miRNAs as compared to other subfamilies of Pkinase. For instance, ghr-mirR156e/f targeted serine/threonine-protein kinase genes involved in salinity and drought stress [63]. It has been found that miRNAs might be playing a role in response to salinity stress through targeting a series of stress-related genes. Moreover, the availability of genome-wide characterization of cotton miRNA genes enabled us to perform the prediction of the miRNA targets involved in salt response.

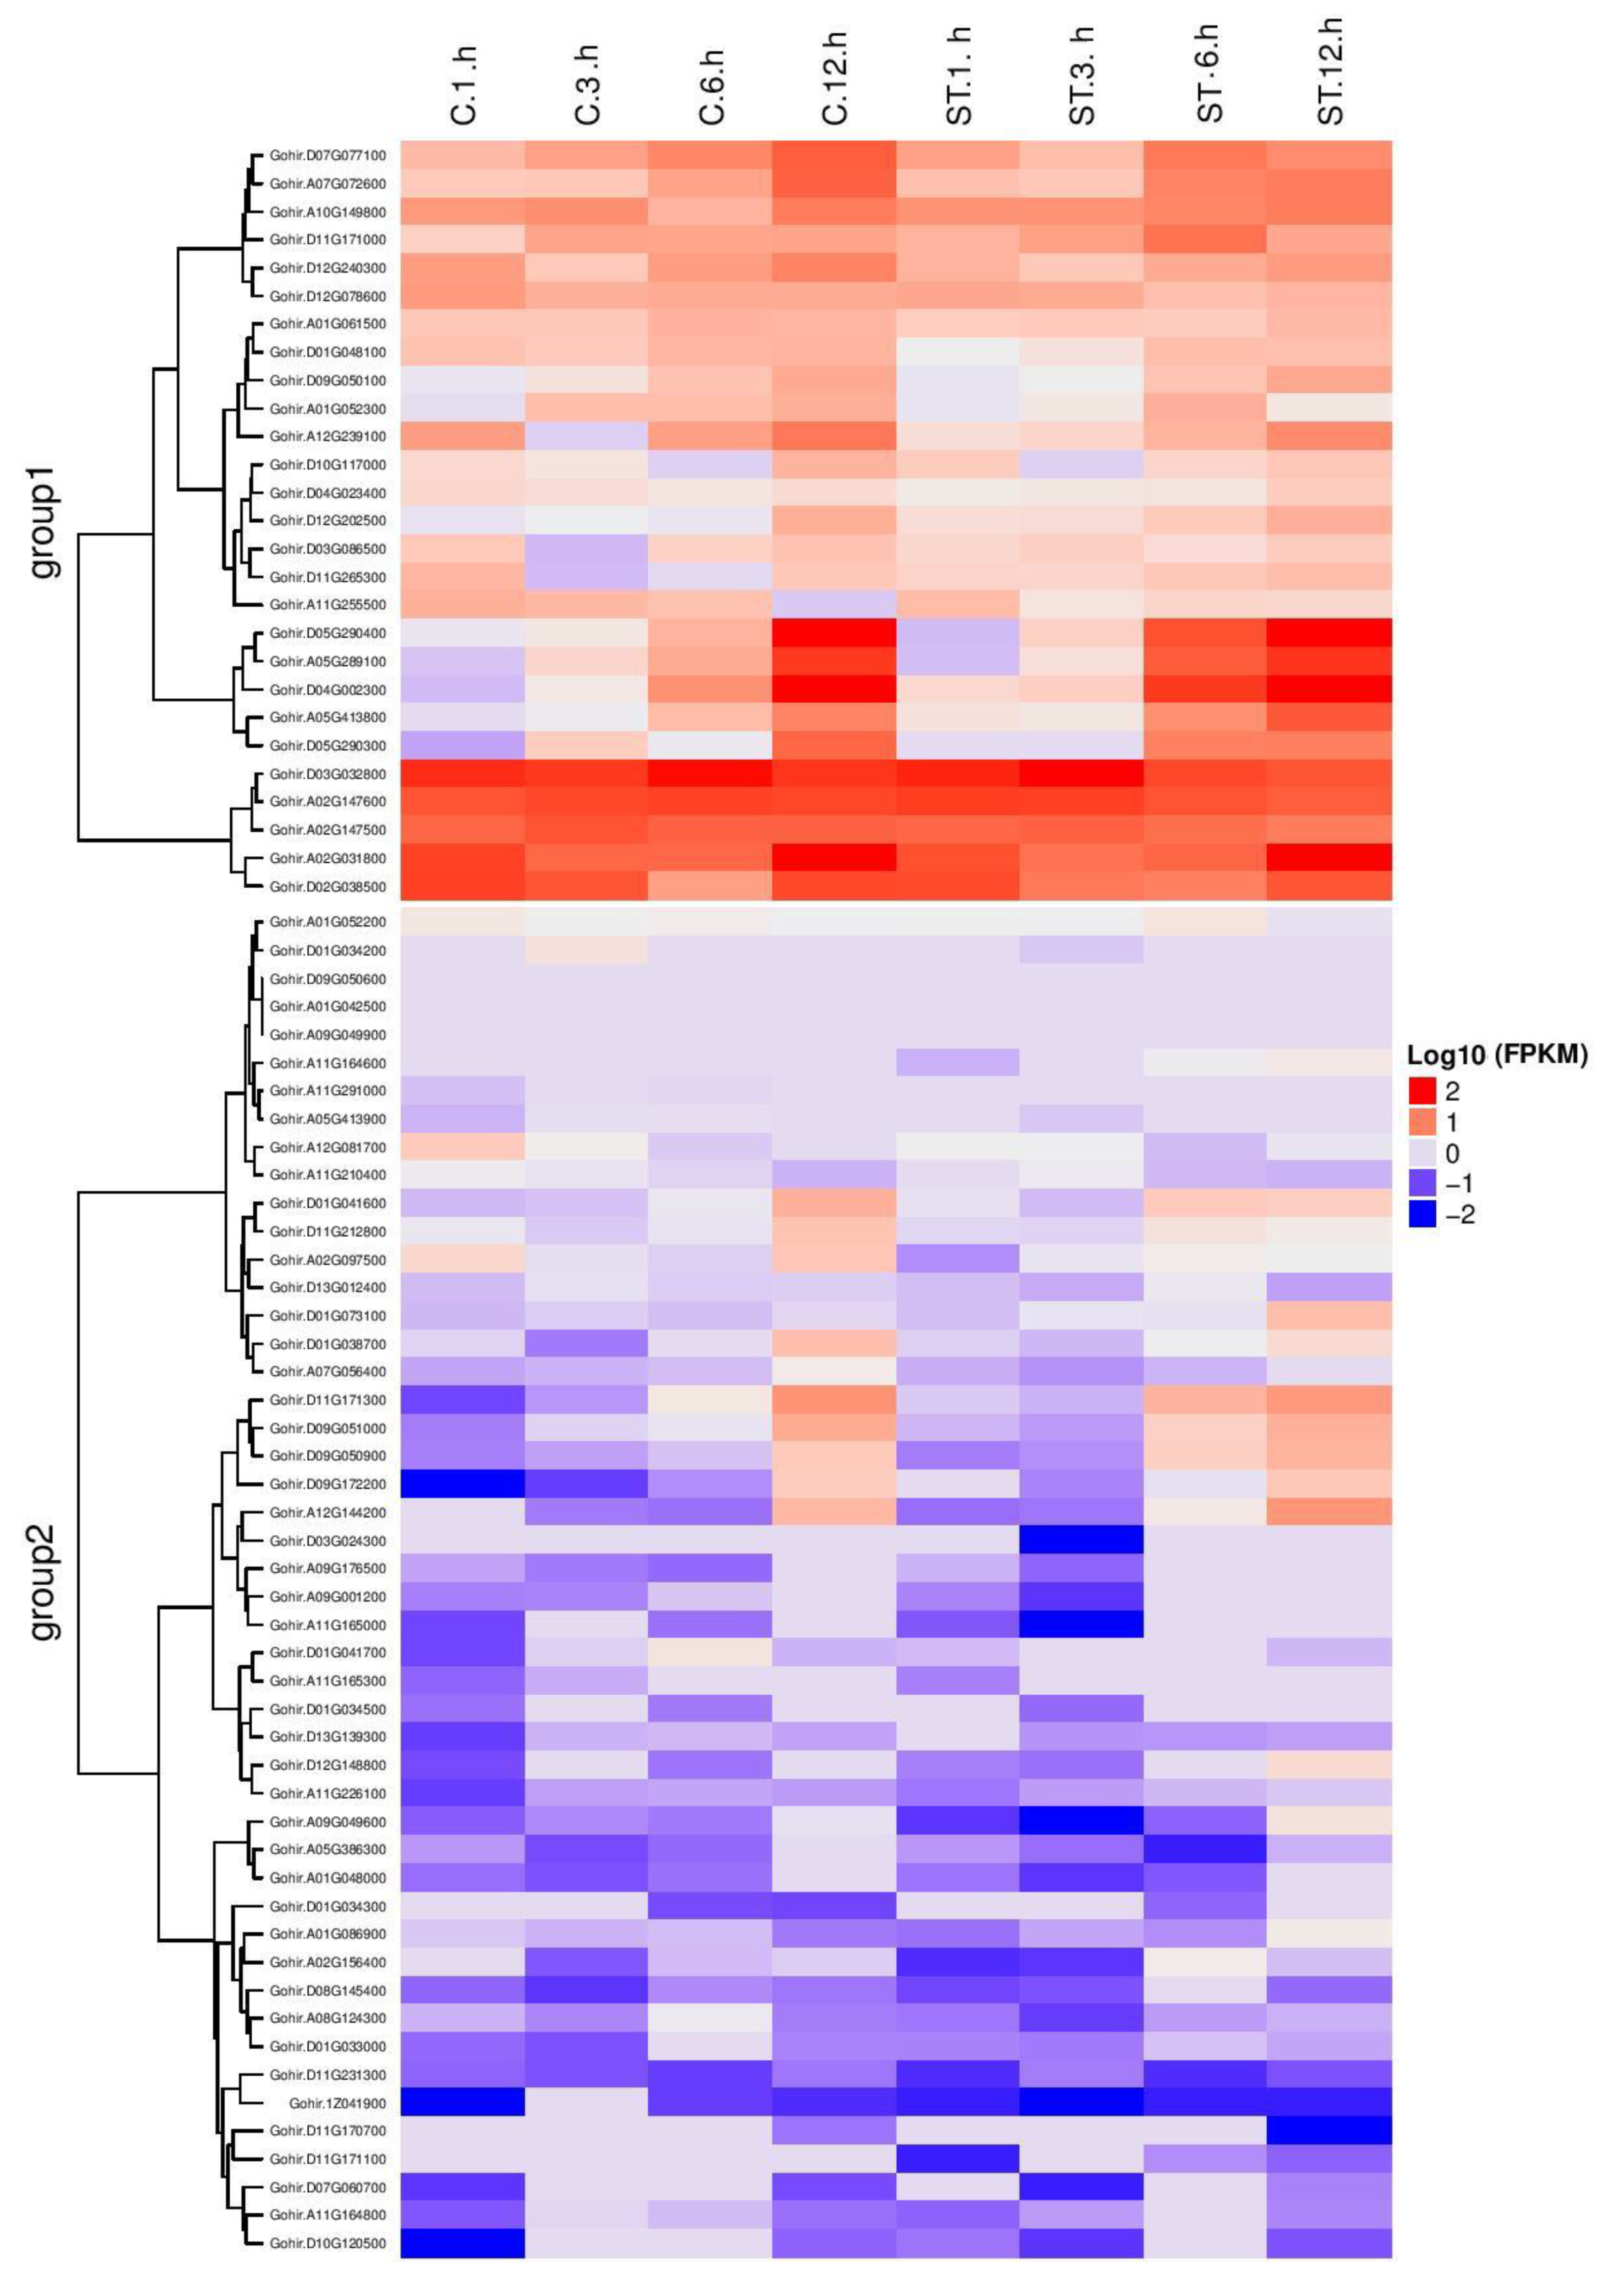
3.10. RNA Sequence Data of Salt Tolerant Genes

RNA sequence is an important tool for providing the cumulative role of genes. It delivers information about the richness of genes in many plant organs as well as gene expression when plants are treated with abiotic and biotic stress. RNA sequence data of 1, 3, 6 and 12 h of control and salt stress of 75 salt responsive genes were downloaded from the cotton functional genomic database.
RNA sequence data of these 75 genes was changed into log10 and used to determine the expression levels at 1, 3, 6 and 12 h in control and salt stress conditions. The genes were divided into two groups: genes in the first group were mostly upregulated, while in the second group, almost all genes were downregulated (Figure 7). Twelve genes in the first group were highly upregulated in control and salt stress conditions. These highly upregulated genes including Gohir.A10G149800, Gohir.A02G147500, Gohir.D03G032800, Gohir.D12G024300, Gohir.D12G078600, Gohir.A01G061500, Gohir.D02G038500, Gohir.A02G147600, Gohir.D11G171000, Gohir.D07G077100, Gohir.A07G072600 and Gohir.A02G031800 were selected for further validation.

3.11. RT-qPCR Analysis of the Candidate Genes under Salt Stress

We used twelve highly upregulated genes, as per the RNA sequence data, for RT-qPCR to determine the expression of genes in roots, stems and leaves at different time intervals under stress conditions (Table S1). Two parent species, a wild G. darwinii and elite cultivated G. hirsutum, were grown in a greenhouse under a controlled environment. The RT-qPCR analysis was performed on RNA samples collected from leaves, roots and stem tissues after 0, 1, 3, 6, and 12 h of exposure to stress treatment. The results presented indicate that genes were differentially expressed in different tissues under 200 mM salt stress conditions (Figure 8a,b).
In G. hirsutum, gene expression profiles were clustered into two groups. Group 1 contained three genes which were upregulated in all tissues except stem, after 3 and 12 h of salt stress, while high levels of expression were observed after 6 and 12 h in roots and after 3 h in stem tissue. Group 2 contained nine genes, in which seven genes were differentially expressed and two genes were downregulated in all tissues (Figure 8a).
Similarly, in G. darwinii, the genes expressed in response to salt were also patterned into two groups: group 1 has four genes, most of which were upregulated in all tissues at 12 h stress exposure except Gohir.D03G032800, which was only partially expressed. Group 2 consists of eight genes, in which five genes were differentially expressed at 0, 1, 3, 6 and 12 h after salt treatment (Figure 8b). Three genes showed downregulated expression in all tissues. The results indicated that these genes were directly or indirectly involved in salt stress with major effects on leaves and roots (Figure 8b).
Gohir.D12G024300 and Gohir.D12G078600 were highly upregulated genes in the roots of both species after 12 h of salt treatment, which exhibited their role in root development in salt tolerance. The Gohir.A02G147600 and Gohir.A02G147500 were highly upregulated in leaves and stem tissue in both species, respectively. Furthermore, the two highly upregulated genes in G. darwinii, Gohir.A02G147600 and Gohir.D03G032800 showed the reverse pattern in G. hirsutum. Most of the genes had higher expression levels in roots of G. darwinii. This is comprehensible because the first part of the plant that is affected by stress is the root. In G. hirsutum, most of the genes were observed with high expression in leaves. In G. darwinii, more genes were upregulated as compared to G. hirsutum, which is an indication that the wild variety has enhanced salt stress tolerance in contrast to its cultivated relative. Similar results have been previously reported for Fructose-1, 6-bisphosphate Aldolase (FBA) genes with a higher expression of genes in G. darwinii as compared to G. hirsutum [64].

4. Discussion

There has been a decline in cotton production due to the adverse effects of various abiotic and biotic stresses which have been exasperated by the narrow genetic base of elite cotton cultivars [65]. Wild cotton progenitors provide an important reservoir of agronomic characters that can be introgressed into cultivated varieties to enhance their performance in the face of different biotic and abiotic stress epidemics in cotton plants [66]. The application of simple sequence repeat (SSR) markers in mapping F2 population developed from two wild cotton species of the D genome, has led to the identification of key genes such as the NAC (NAM, ATAF1/2 and CUC2) genes, which have previously been implicated in alleviating the various stress effects in plants [66]. Therefore, the detection of myriad genes of the protein kinase family, based on already developed highly dense genetic maps in G. hirsutum, G. arboreum and G. raimondii, could offer a better alternative in solving the problem of salt stress in cotton breeding approaches. In the present study, we identified 151 Pkinase genes in three cotton species, G. raimondii, G. arboreum and G. hirsutum, which were found to have 41, 35 and 75 genes, respectively. The number identified in upland cotton (G. hirsutum) was relatively higher (more than double) than in G. arboreum and G. raimondii, which indicates that whole genome duplication (WGD) or polyploidy events played a major role in Pkinase gene family expansion [67]. Allotetraploid cotton possibly emerged from the polyploidization of the A and D genomes, suggesting that the expansion of Pkinase family genes from diploid to allotetraploid cotton is mainly a consequence of gene duplication and the conservation of the Pkinase genes during the polyploidization process. This indicates the significant role played by this group of genes in the process of plant growth and development [68]. Similar findings have been reported in the case of the FBA gene family with 19, 9 and 9 genes and CDK family with 31, 15 and 12 genes in G. hirsutum, G. raimondii and G. arboreum, respectively [64,69].
As a consequence of the selection pressure imposed by exposure to extreme environmental conditions, plants undergo drastic transformation by modulating stress regulatory responses and sensing mechanisms. One of the significant strategies employed by plants to combat stress response is gene duplication [70]. Gene duplication is a major feature of genomic architecture, with a central role in plant genomic evolution by acting as a source of new genetic materials for genetic drift, mutation and selection, expanding the existing gene pool that enable plants to gain new gene functions and explore novel gene networks [71]. Thus, gene duplication mechanism not only leads to the expansion of genomic content but assists in the diversification of gene function to ensure adequate adaptability to changing environments [56]. In this study, the majority of the genes were found to be duplicated segmentally. Segmental duplication is known to be dominant over the tandem duplication in the process of gene evolution. For instance, large-scale segmental duplications were uncovered upon examining the complete sequence of A. thaliana genome [72]. Similarly, in Arabidopsis, 22 cell cycle genes belonging to the CDK family were found to have emerged through segmental duplication [73]. The role of segmental duplicated genes in relation to drought stress has been reported, such as, the expansion of Hsf genes in sesame was found to have occurred through segmental duplication [74]. Moreover, the tetraploid cotton G. hirsutum, has gone through whole genome duplication and allopolyploidization events during the course of evolution [5,75]. Therefore, this process is significant for the ability of the plants to sense and respond in new ways to abiotic stimuli which is critical for plant survival [76]. Tetraploidization of G. hirsutum occurred about 1.5 MYA and corresponds to a Ks peak [5]. In our study, we also identified G. hirsutum Pkinase orthologs Ks peaks (0–0.6) (Table S8), indicating that the tetraploidization event of G. hirsutum was important for Pkinase expansion. We also identified several PK collinearities among G. raimondii (D), G. arboreum (A), and G. hirsutum (At, Dt) (Figure 6).
Phylogenetic tree analyses provide valuable information on the patterns of gene evolution by discerning the evolutionary descent of different genes/proteins from a common ancestor. It provides evidence of the contribution of whole genome duplication on the excess of upland cotton Pkinase genes as compared to its parental donors. The genomes of G. arboreum and G. raimondii contained 35 and 41 genes in comparison to the 75 genes in G. hirsutum. These results showed that the gene number and phylogeny of Pkinases were consistent with the genome paleo-history, which suggested that the Pkinase gene family expanded and plant genomes became more complex as result of gene expansion during evolution. Briefly, it can be inferred that Gossypium Pkinases descended from one common ancestor, which expanded in diploid cotton types by a duplication event after splitting from the cacao lineage about 16.6 MYA, followed by a reunion and polyploidization of the diploid cotton species forming the allopolyploid cotton approximately 1–2 MYA, combining and expanding the Pkinase gene family along with A and D genome [77]. Moreover, the gene distribution across the whole cotton genome was mostly limited to the chromosome arms, while some of the chromosomes were found to lack the genes altogether. Pkinase genes were mapped on 21, 11 and 12 chromosomes across the three cotton species (Table 1). It has been observed previously that this type of expansion can be ascribed to large segmental duplications that have been subjected to scrambling by chromosomal rearrangements in CDK genes in cotton, tomato and Arabidopsis [69,78].
The structural analysis of the Pkinase genes in cotton revealed a variation in terms of the exon/ intron ratios, the number of exons in genes ranged between nine and one while introns ranged between zero to eight. Interestingly, out of 75 genes, five had one exon and no intron. Our results are consistent with previous findings about the reduced intron numbers in stress responsive genes, such as the trehalose-6-phosphate synthase gene family which plays an important role in abiotic stress and metabolic regulation [79]. Similarly, about 45% and 41% of genes in the F-box subfamily are speculated to be intronless in Arabidopsis and Oryza sativa, respectively. In Arabidopsis and O. sativa, the genes without introns accounts for 20.7% and 19.9% of the whole genomes, respectively [80,81]. Gene integration and reverse transcription might be responsible for the loss of introns from genes in plants [82]. The presence of introns has been presumed to cause considerable burden in terms of transcription efficiency since intron splicing requires a large molecular complex called the spliceosome composed of five sRNAs and approximately 150 proteins; the expression and assembly of these components costs the cell substantial amounts of time and energy [83,84]. Therefore, intronless genes are known to be effective in transcription initiation and elongation as compared to spliced genes [85]. The grand average hydropathy value of all genes was less than zero, indicating that they were hydrophilic in nature. Hydrophilic protein-encoding genes have a high solubility, hence these proteins may have a significant role in desiccation tolerance [68]. The variation in Pkinases reflects their diverse cellular functions and is consistent with previous reports on other species [86,87].
GO annotation is a useful tool to classify genes based on their functions in cells including BP, MF, and CF [88]. The biological process, molecular function and cellular function are basic characteristics, which allow a basic understanding of the diverse molecular role of genes. According to GO annotations, the 75 genes of upland cotton (G. hirsutum) were classified into biological process and molecular function. In biological processes, various genes have direct correlation to stress factors such as protein phosphorylation (GO:0006468), intracellular signal transduction (GO:0035556) and abscisic acid activated signaling pathway (GO:0009738). In higher organisms, protein kinases are important elements playing key roles in signal transduction in response to metabolic changes and during biotic and abiotic stress regimes [89]. In molecular functions, the functions include protein kinase activity (GO:0004672), ATP binding (GO:0005524), polysaccharide binding (GO:0030247), protein binding (GO:0005515) and carbohydrate binding (GO:0030246) (Figure 5). The molecular functions identified encompass various molecular strategies adopted by the plants in order to survive and tolerate various stress factors. The majority of the molecular functions are important components of the signaling pathways; for instance, protein tyrosine kinase has been reported to be involved in the abscisic acid signaling pathway [90]. Protein kinases have been described to regulate responses of plants to salt and osmotic stresses by modulating the calcium signaling pathway. For instance, following perception of salt stress on the plasma membrane, Ca2+ signals are generated, which are perceived by SOS3 kinase, the binding of calcium and myristoylation of SOS3 activates its function and then, SOS3 activates the SOS2 kinase; the subsequently activated SOS2 kinase phosphorylates the SOS1 Na+/H+ antiporter, which pumps Na+ out of the cytosol [23].
In carrying out a detailed study of the dominant domain of Pkinase genes, obtained from the genetic map of a wild parent, cis-element, miRNA analysis and GO functional annotations revealed the fact that Pkinase genes could have a significant role in stress within plants. Gene promoters, also termed as cis-element or transcription-factors binding sites, play various key roles in the transcriptional regulation of genes controlling several abiotic stress and plant hormone responses. Phytohormones improve plant adaptability to changing environments and adverse conditions like stress. Many abiotic stress-related and plant hormones-related cis-elements, including TCA-elements, W-Box, DRE, MBS and ABRE have been identified previously [60,91]. These stress-responsive elements were relatively abundant in the promoters of the upland cotton Pkinase genes, specifically MYBS, indicating an important functional role of these elements in salt stress tolerance in G. hirsutum. In total, 55 genes were found to be regulated by MYBS. MYBS is well-studied cis-acting promoter element with a key role in the abscisic acid-dependent signaling pathway in response to drought, salt and cold [92]. ABRE is also an important cis-element that plays a key role in abscisic acid signaling in response to abiotic stress [60]. In Arabidopsis, the role of cis-acting regulatory elements (CARE) to enhance tolerance against high salt, drought and cold stress has been reported previously [93].
The small RNAs are a diverse class of non-coding regulatory RNAs with important functions by regulating gene expression through targeting the RNA transcripts of endogenous as well as exogenous genes involved in stress response [94,95]. Growing evidence reveals that miRNA-guided regulation of ROS-related genes at the post-transcriptional level is essential for normal growth and development [96], and adaptation to stress conditions including salinity [97,98]. However, reports on Pkinase gene expression and regulation mediated by miRNAs under salt stress has not been carried out in detail. In our study, we predicted the miRNA-mediated posttranscriptional regulation of pkinases and found some putative targets of cotton miRNAs (Table S9). Various cotton miRNAs such as miR162, miR172, miR396 and miR156, among others, detected in this study, have been found to be associated to some of the top ranked genes related to drought and salinity, for example, NAC, MYB, and MAPK (mitogen-activated protein kinase) [99]. The miRNA miR482, has been known to play a functional role in the regulation of nucleotide binding site–leucine-rich repeat (NBS-LRR) defense genes during fungal pathogen infection [100]. The ghr-miR395a/b is also likely to be involved in sulfur metabolism by regulating sulphate adenylyl transferase in cotton. Thus, these stress-related miRNAs and their targets might also play roles in response to drought and salinity stress [63]. Similarly, a recent study on small RNA sequencing revealed that salinity and drought stress interrupt miR156 expression, indicating a novel role for miR156 in response to salinity and drought stress [63]. Furthermore, the miR399 was involved in regulating phosphate homeostasis in Arabidopsis after exposure to both NaCl and polyethylene glycol (PEG) [101]. This indicates the essential roles for miRNAs in maintaining the target gene expression under stress, which are directly or indirectly involved in salt stress tolerance mechanism in plants.
Expression analysis is an imperative tool that provides functional information about genes. High expression levels for tested genes were observed among different tissues of plant as depicted by the expression pattern in the heat map (Figure 8a,b). Results of RT-qPCR revealed that the 12 key genes have better expression levels in G. darwinii as compared to G. hirsutum as per the log 10 (FPKM) range. Gohir.A02G147600 and Gohir.D03G032800 were highly upregulated in G. darwinii while downregulated in G. hirsutum. The genes exhibited a significant upregulation in the roots as compared to leaf and stem tissues, which indicated the functional conservation of the subfamily. Gohir.A02G147600 and Gohir.D03G032800 belong to leucine-rich repeat receptor-like serine/threonine-protein kinase BAM1. Leucine-rich repeats receptor-like kinases (LRR-RLKs) play important roles in plant growth and development as well as in the signal perception and transduction to abiotic stress responses [102]. It is well known that LRR-RLKs are important regulators of plant response to salt stress [103,104,105]. For instance, the Arabidopsis LRR-II type RLK genes were induced by many environmental stresses, such as cold, osmotic stress, auxin and abscisic acid, suggesting that they may participate in the general abiotic stress response [106]. The expression of rice LRR-RLKs (OsSIK1, OsGIRL1, OsLP2) were regulated by salt, drought, abscisic acid, salicylic acid, jasmonic acid and H2O2 stresses, indicating that rice LRR-RLKs might be involved in multiple signaling pathways regulating developmental and stress processes [77,104,107]. In the Antarctic moss, Pohlia nutans, expression of PnLRR-RLK27 significantly increased the transcript levels of the major transcription factors (ABF3, DREAB2A and MYB2) and the stress-related genes (AtRD22, AtRD29A, AtRD29B, AtKIN1 and AtCOR47) after salt treatment. Similarly, cotton Pkinases GhMKK1, GhMKK3 and GhMKK5 are shown to be involved in drought and salinity stress resistance [108,109]. These results validated that these salt-tolerant genes most likely came from the tolerant parent (G. darwinii). The variation in expression between G. hirsutum and G. darwinii could be broadly based on changes in environmental conditions; G. darwinii exhibits divergence signals that are associated with directionally selected traits and are functionally related to stress responses. These results suggest that stress adaptation in G. darwinii might have involved the evolution of salt-tolerant genes that can be introgressed into elite upland cotton, in order to boost their performance for breeding of salt-resistant cotton varieties in the future.

5. Conclusions

The use of genetic maps has become increasingly significant in understanding marker-assisted selection, gene cloning and breeding, yet intensive analysis of genes within the SSR regions has not been extensively studied thoroughly. In the current study, a genetic map of G. hirsutum/G. darwinii F2 population was used for identification of candidate genes for salt stress tolerance. We analyzed 75, 35 and 41 genes of dominant domain, Pkinase, in G. hirsutum, G. arboreum and G. raimondii, respectively. The Pkinase gene family was categorized into 13 subfamilies based on the phylogenetic tree relationship. Chromosomal mapping and syntenic analysis revealed that genes were dispersed randomly on all chromosomes of the three species, with gene clusters located on the upper or lower arms of the chromosomes indicating that segmental duplication played a major role in expansion of the Pkinase family. The majority of the genes had lower Ka/Ks values indicating that purified selection worked on most of the duplicated gene pairs with only a minimal number of genes going through negative selection. Two genes, Gohir.A02G147600 and Gohir.D03G032800, have higher expression levels in roots of G. darwinii species when exposed to salt stress pointing to the fact that these salt-tolerant genes were most likely derived from G. darwinii. The analysis of these genes provides a strong indication that genes within the Pkinase subfamily might play a significant role in combating salt stress tolerance, based on the expression pattern, miRNA, cis-element analysis and GO functional annotations. This study provides a solid foundation for further in-depth evaluation of these genes in understanding the specific role of these genes in cotton in relation salt stress tolerance and paves the way for breeding elite cotton cultivars with potential resistance to abiotic stresses.

Supplementary Materials

The following are available online at https://www.mdpi.com/2073-4395/9/9/560/s1, Figure S1(a): Gene distribution in tetraploid upland cotton (G. hirsutum) chromosomes; Figure S1(b): Gene distribution in A genome of G. arboreum and D genome of G. raimondii chromosomes; Table S1: PCR primers; Table S2: Markers inconformity between genetic map and the physical map of At and Dt subgenomes of G. hirsutum; Table S3: Protein kinase genes identified in G. hirsutum, G. raimondii and G. arboreum; Table S4: Genomic locations of genes in G. raimondii, G. arboreum and G. hirsutum; Table S5: The structural analysis of Gh Pkinase; Table S6: Subcellular localization of genes; Table S7: Syntenic analysis of homologous genes among G. hirsutum, G. arboreum and G. raimondii; Table S8: Determined Ka, Ks and Ka/Ks values for orthologous Pkinase gene pairs in G. hirsutum, G. arboreum and G. raimondii genomes; Table S9: miRNA targets of genes.

Author Contributions

M.S., F.L. and K.W. planned the experiment. M.S. performed data collection and analyzed results. M.S. and M.K. prepared the manuscript. X.C., Y.X., Y.H., A.D., F.H., F.L., R.P., S.H., M.S. and Z.Z. revised the manuscript. All authors reviewed and approved the manuscript.

Funding

This research work was financed by grants from the National Key Research and Development Plan (2016YFD0100306, 2017YFD0101601) and the National Natural Science Foundation of China (31530053, 31671745).

Acknowledgments

We express gratitude to all of our team and lab fellows who have helped us in our research experiment.

Conflicts of Interest

All authors declare no conflicts of interest.

Abbreviations

ATPAdenosine Triphosphate
BPBiological Process
CDSCoding Sequence
CFCellular Function
CIRCOSCircular Genome Data Visualization
GOGene Ontology
GSDSGene Structure Display Server
MFMolecular Function
MYAMillion Years Ago
NaClSodium Chloride
NCBINational Centre for Biotechnology Information
SSRSimple Sequence Repeat

References

  1. Cepal, N. The Outlook for Agriculture and Rural Development in the Americas: A Perspective on Latin America and the Caribbean 2017–2018; FAO, IICA: San Jose, Costa Rica, 2017. [Google Scholar]
  2. Gallagher, J.P.; Grover, C.E.; Rex, K.; Moran, M.; Wendel, J.F. A new species of cotton from Wake Atoll, Gossypium stephensii (Malvaceae). Syst. Bot. 2017, 42, 115–123. [Google Scholar] [CrossRef]
  3. Wendel, J.F.; Grover, C.E. Taxonomy and evolution of the cotton genus, Gossypium. Cotton 2015, 25–44. [Google Scholar] [CrossRef]
  4. Kunbo, W.; WENDEL, J.F.; Jinping, H. Designations for individual genomes and chromosomes in Gossypium. J. Cotton Res. 2018, 1, 3. [Google Scholar]
  5. Li, F.; Fan, G.; Lu, C.; Xiao, G.; Zou, C.; Kohel, R.J.; Ma, Z.; Shang, H.; Ma, X.; Wu, J. Genome sequence of cultivated Upland cotton (Gossypium hirsutum TM-1) provides insights into genome evolution. Nat. Biotechnol. 2015, 33, 524. [Google Scholar] [CrossRef] [PubMed]
  6. Zhang, T.; Hu, Y.; Jiang, W.; Fang, L.; Guan, X.; Chen, J.; Zhang, J.; Saski, C.A.; Scheffler, B.E.; Stelly, D.M. Sequencing of allotetraploid cotton (Gossypium hirsutum L. acc. TM-1) provides a resource for fiber improvement. Nat. Biotechnol. 2015, 33, 531. [Google Scholar] [CrossRef] [PubMed]
  7. Paterson, A.H.; Wendel, J.F.; Gundlach, H.; Guo, H.; Jenkins, J.; Jin, D.; Llewellyn, D.; Showmaker, K.C.; Shu, S.; Udall, J. Repeated polyploidization of Gossypium genomes and the evolution of spinnable cotton fibres. Nature 2012, 492, 423. [Google Scholar] [CrossRef] [PubMed]
  8. Li, F.; Fan, G.; Wang, K.; Sun, F.; Yuan, Y.; Song, G.; Li, Q.; Ma, Z.; Lu, C.; Zou, C. Genome sequence of the cultivated cotton Gossypium arboreum. Nat. Genet. 2014, 46, 567. [Google Scholar] [CrossRef] [PubMed]
  9. Chen, H.; Khan, M.K.R.; Zhou, Z.; Wang, X.; Cai, X.; Ilyas, M.K.; Wang, C.; Wang, Y.; Li, Y.; Liu, F. A high-density SSR genetic map constructed from a F2 population of Gossypium hirsutum and Gossypium darwinii. Gene 2015, 574, 273–286. [Google Scholar] [CrossRef]
  10. Maxted, N.; Kell, S.; Toledo, Á.; Dulloo, E.; Heywood, V.; Hodgkin, T.; Hunter, D.; Guarino, L.; Jarvis, A.; Ford-Lloyd, B. A global approach to crop wild relative conservation: Securing the gene pool for food and agriculture. Kew Bull. 2010, 65, 561–576. [Google Scholar] [CrossRef]
  11. Atwell, B.J.; Wang, H.; Scafaro, A.P. Could abiotic stress tolerance in wild relatives of rice be used to improve Oryza sativa? Plant Sci. 2014, 215, 48–58. [Google Scholar] [CrossRef]
  12. Roy, S.J.; Negrão, S.; Tester, M. Salt resistant crop plants. Curr. Opin. Biotechnol. 2014, 26, 115–124. [Google Scholar] [CrossRef] [PubMed]
  13. Deinlein, U.; Stephan, A.B.; Horie, T.; Luo, W.; Xu, G.; Schroeder, J.I. Plant salt-tolerance mechanisms. Trends Plant Sci. 2014, 19, 371–379. [Google Scholar] [CrossRef] [PubMed] [Green Version]
  14. Niu, X.; Bressan, R.A.; Hasegawa, P.M.; Pardo, J.M. Ion homeostasis in NaCl stress environments. Plant Physiol. 1995, 109, 735. [Google Scholar] [CrossRef] [PubMed]
  15. Parida, A.K.; Das, A.B. Salt tolerance and salinity effects on plants: A review. Ecotoxicol. Environ. Saf. 2005, 60, 324–349. [Google Scholar] [CrossRef] [PubMed]
  16. Golldack, D.; Li, C.; Mohan, H.; Probst, N. Tolerance to drought and salt stress in plants: Unraveling the signaling networks. Front. Plant Sci. 2014, 5, 151. [Google Scholar] [CrossRef] [Green Version]
  17. Ryu, H.; Cho, Y.-G. Plant hormones in salt stress tolerance. J. Plant Biol. 2015, 58, 147–155. [Google Scholar] [CrossRef]
  18. Nakashima, K.; Yamaguchi-Shinozaki, K. ABA signaling in stress-response and seed development. Plant Cell Rep. 2013, 32, 959–970. [Google Scholar] [CrossRef]
  19. Lu, N.; Roldan, M.; Dixon, R.A. Characterization of two TT2-type MYB transcription factors regulating proanthocyanidin biosynthesis in tetraploid cotton, Gossypium hirsutum. Planta 2017, 246, 323–335. [Google Scholar] [CrossRef]
  20. Hanks, S.K.; Hunter, T. Protein kinases 6. The eukaryotic protein kinase superfamily: Kinase (catalytic) domain structure and classification. FASEB J. 1995, 9, 576–596. [Google Scholar] [CrossRef]
  21. Zhu, J.-K.; Liu, J.; Xiong, L. Genetic analysis of salt tolerance in Arabidopsis: Evidence for a critical role of potassium nutrition. Plant Cell 1998, 10, 1181–1191. [Google Scholar] [CrossRef]
  22. Zhu, J.-K. Salt and drought stress signal transduction in plants. Annu. Rev. Plant Biol. 2002, 53, 247–273. [Google Scholar] [CrossRef] [PubMed]
  23. Qiu, Q.-S.; Guo, Y.; Dietrich, M.A.; Schumaker, K.S.; Zhu, J.-K. Regulation of SOS1, a plasma membrane Na+/H+ exchanger in Arabidopsis thaliana, by SOS2 and SOS3. Proc. Natl. Acad. Sci. USA 2002, 99, 8436–8441. [Google Scholar] [CrossRef] [PubMed]
  24. Zhang, L.; Zhang, G.; Wang, Y.; Zhou, Z.; Meng, Y.; Chen, B. Effect of soil salinity on physiological characteristics of functional leaves of cotton plants. J. Plant Res. 2013, 126, 293–304. [Google Scholar] [CrossRef] [PubMed]
  25. Yan, R.; Liang, C.; Meng, Z.; Malik, W.; Zhu, T.; Zong, X.; Guo, S.; Zhang, R. Progress in genome sequencing will accelerate molecular breeding in cotton (Gossypium spp.). 3 Biotech 2016, 6, 217. [Google Scholar] [CrossRef] [PubMed]
  26. Wei, Y.; Xu, Y.; Lu, P.; Wang, X.; Li, Z.; Cai, X.; Zhou, Z.; Wang, Y.; Zhang, Z.; Lin, Z. Salt stress responsiveness of a wild cotton species (Gossypium klotzschianum) based on transcriptomic analysis. PLoS ONE 2017, 12, e0178313. [Google Scholar] [CrossRef] [PubMed]
  27. Ding, Y.; Cao, J.; Ni, L.; Zhu, Y.; Zhang, A.; Tan, M.; Jiang, M. ZmCPK11 is involved in abscisic acid-induced antioxidant defence and functions upstream of ZmMPK5 in abscisic acid signalling in maize. J. Exp. Bot. 2012, 64, 871–884. [Google Scholar] [CrossRef]
  28. Vivek, P.J.; Tuteja, N.; Soniya, E.V. CDPK1 from ginger promotes salinity and drought stress tolerance without yield penalty by improving growth and photosynthesis in Nicotiana tabacum. PLoS ONE 2013, 8, e76392. [Google Scholar] [CrossRef]
  29. Magwanga, R.; Lu, P.; Kirungu, J.; Diouf, L.; Dong, Q.; Hu, Y.; Cai, X.; Xu, Y.; Hou, Y.; Zhou, Z. GBS mapping and analysis of genes conserved between Gossypium tomentosum and Gossypium hirsutum cotton cultivars that respond to drought stress at the seedling stage of the BC2F2 generation. Int. J. Mol. Sci. 2018, 19, 1614. [Google Scholar] [CrossRef]
  30. Van Ooijen, J.W. JoinMap® 4, Software for the calculation of genetic linkage maps in experimental populations. Kyazma BV Wagening 2006. [Google Scholar]
  31. Zhu, T.; Liang, C.; Meng, Z.; Sun, G.; Meng, Z.; Guo, S.; Zhang, R. CottonFGD: An integrated functional genomics database for cotton. BMC Plant Biol. 2017, 17, 101. [Google Scholar] [CrossRef]
  32. Ditta, A.; Zhou, Z.; Cai, X.; Wang, X.; Okubazghi, K.; Shehzad, M.; Xu, Y.; Hou, Y.; Sajid Iqbal, M.; Khan, M. Assessment of genetic diversity, population structure, and evolutionary relationship of uncharacterized genes in a novel germplasm collection of diploid and allotetraploid Gossypium accessions using EST and genomic SSR markers. Int. J. Mol. Sci. 2018, 19, 2401. [Google Scholar] [CrossRef] [PubMed]
  33. Finn, R.D.; Bateman, A.; Clements, J.; Coggill, P.; Eberhardt, R.Y.; Eddy, S.R.; Heger, A.; Hetherington, K.; Holm, L.; Mistry, J. Pfam: The protein families database. Nucleic Acids Res. 2013, 42, D222–D230. [Google Scholar] [CrossRef] [PubMed]
  34. Schultz, J.; Copley, R.R.; Doerks, T.; Ponting, C.P.; Bork, P. SMART: A web-based tool for the study of genetically mobile domains. Nucleic Acids Res. 2000, 28, 231–234. [Google Scholar] [CrossRef] [PubMed]
  35. Kumar, S.; Nei, M.; Dudley, J.; Tamura, K. MEGA: A biologist-centric software for evolutionary analysis of DNA and protein sequences. Brief. Bioinform. 2008, 9, 299–306. [Google Scholar] [CrossRef] [PubMed] [Green Version]
  36. Horton, P.; Park, K.-J.; Obayashi, T.; Fujita, N.; Harada, H.; Adams-Collier, C.; Nakai, K. WoLF PSORT: Protein localization predictor. Nucleic Acids Res. 2007, 35, W585–W587. [Google Scholar] [CrossRef]
  37. Hu, B.; Jin, J.; Guo, A.-Y.; Zhang, H.; Luo, J.; Gao, G. GSDS 2.0: An upgraded gene feature visualization server. Bioinformatics 2014, 31, 1296–1297. [Google Scholar] [CrossRef]
  38. Voorrips, R. MapChart: Software for the graphical presentation of linkage maps and QTLs. J. Heredity 2002, 93, 77–78. [Google Scholar] [CrossRef]
  39. Krzywinski, M.; Schein, J.; Birol, I.; Connors, J.; Gascoyne, R.; Horsman, D.; Jones, S.J.; Marra, M.A. Circos: An information aesthetic for comparative genomics. Genome Res. 2009, 19, 1639–1645. [Google Scholar] [CrossRef] [Green Version]
  40. Librado, P.; Rozas, J. DnaSP v5: A software for comprehensive analysis of DNA polymorphism data. Bioinformatics 2009, 25, 1451–1452. [Google Scholar] [CrossRef]
  41. Wang, Y.; Tang, H.; DeBarry, J.D.; Tan, X.; Li, J.; Wang, X.; Lee, T.-h.; Jin, H.; Marler, B.; Guo, H. MCScanX: A toolkit for detection and evolutionary analysis of gene synteny and collinearity. Nucleic Acids Res. 2012, 40, e49. [Google Scholar] [CrossRef]
  42. Griffiths-Jones, S.; Grocock, R.J.; Van Dongen, S.; Bateman, A.; Enright, A.J. miRBase: microRNA sequences, targets and gene nomenclature. Nucleic Acids Res. 2006, 34, D140–D144. [Google Scholar] [CrossRef] [PubMed]
  43. Zhang, Z.; Yu, J.; Li, D.; Zhang, Z.; Liu, F.; Zhou, X.; Wang, T.; Ling, Y.; Su, Z. PMRD: Plant microRNA database. Nucleic Acids Res. 2009, 38, D806–D813. [Google Scholar] [CrossRef] [PubMed]
  44. Boguski, M.S.; Lowe, T.M.; Tolstoshev, C.M. dbEST—Database for “expressed sequence tags”. Nat. Genet. 1993, 4, 332. [Google Scholar] [CrossRef] [PubMed]
  45. Dai, X.; Zhao, P.X. psRNATarget: A plant small RNA target analysis server. Nucleic Acids Res. 2011, 39, W155–W159. [Google Scholar] [CrossRef] [PubMed]
  46. Higo, K.; Ugawa, Y.; Iwamoto, M.; Higo, H. PLACE: A database of plant cis-acting regulatory DNA elements. Nucleic Acids Res. 1998, 26, 358–359. [Google Scholar] [CrossRef]
  47. Oluoch, G.; Zheng, J.; Wang, X.; Khan, M.K.R.; Zhou, Z.; Cai, X.; Wang, C.; Wang, Y.; Li, X.; Wang, H. QTL mapping for salt tolerance at seedling stage in the interspecific cross of Gossypium tomentosum with Gossypium hirsutum. Euphytica 2016, 209, 223–235. [Google Scholar] [CrossRef]
  48. Hoagland, D.R.; Arnon, D.I. The water-culture method for growing plants without soil. Circ. Calif. Agric. Exp. Stn. 1950, 347, 32. [Google Scholar]
  49. Gregory, T.R. Understanding evolutionary trees. Evol. Educ. Outreach 2008, 1, 121. [Google Scholar] [CrossRef]
  50. Liu, X.; Zhao, B.; Zheng, H.-J.; Hu, Y.; Lu, G.; Yang, C.-Q.; Chen, J.-D.; Chen, J.-J.; Chen, D.-Y.; Zhang, L. Gossypium barbadense genome sequence provides insight into the evolution of extra-long staple fiber and specialized metabolites. Sci. Rep. 2015, 5, 14139. [Google Scholar] [CrossRef]
  51. Hu, R.; Qi, G.; Kong, Y.; Kong, D.; Gao, Q.; Zhou, G. Comprehensive analysis of NAC domain transcription factor gene family in Populus trichocarpa. BMC Plant Biol. 2010, 10, 145. [Google Scholar] [CrossRef] [PubMed]
  52. Gasteiger, E.; Gattiker, A.; Hoogland, C.; Ivanyi, I.; Appel, R.D.; Bairoch, A. ExPASy: The proteomics server for in-depth protein knowledge and analysis. Nucleic Acids Res. 2003, 31, 3784–3788. [Google Scholar] [CrossRef] [PubMed]
  53. Magwanga, R.O.; Lu, P.; Kirungu, J.N.; Dong, Q.; Hu, Y.; Zhou, Z.; Cai, X.; Wang, X.; Hou, Y.; Wang, K. Cotton late embryogenesis abundant (LEA2) genes promote root growth and confer drought stress tolerance in transgenic Arabidopsis thaliana. Genes Genomes Genet. 2018, 8, 2781–2803. [Google Scholar] [CrossRef] [PubMed]
  54. Wang, G.; Kong, H.; Sun, Y.; Zhang, X.; Zhang, W.; Altman, N.; DePamphilis, C.W.; Ma, H. Genome-wide analysis of the cyclin family in Arabidopsis and comparative phylogenetic analysis of plant cyclin-like proteins. Plant Physiol. 2004, 135, 1084–1099. [Google Scholar] [CrossRef] [PubMed]
  55. Fuxreiter, M.; Simon, I.; Friedrich, P.; Tompa, P. Preformed structural elements feature in partner recognition by intrinsically unstructured proteins. J. Mol. Biol. 2004, 338, 1015–1026. [Google Scholar] [CrossRef] [PubMed]
  56. Xu, G.; Guo, C.; Shan, H.; Kong, H. Divergence of duplicate genes in exon–intron structure. Proc. Natl. Acad. Sci. USA 2012, 109, 1187–1192. [Google Scholar] [CrossRef] [PubMed]
  57. Magwanga, R.O.; Lu, P.; Kirungu, J.N.; Lu, H.; Wang, X.; Cai, X.; Zhou, Z.; Zhang, Z.; Salih, H.; Wang, K. Characterization of the late embryogenesis abundant (LEA) proteins family and their role in drought stress tolerance in upland cotton. BMC Genet. 2018, 19, 6. [Google Scholar] [CrossRef] [PubMed]
  58. Xu, Y.; Magwanga, R.O.; Cai, X.; Zhou, Z.; Wang, X.; Wang, Y.; Zhang, Z.; Jin, D.; Guo, X.; Wei, Y. Deep transcriptome analysis reveals reactive oxygen species (ROS) network evolution, response to abiotic stress, and regulation of fiber development in cotton. Int. J. Mol. Sci. 2019, 20, 1863. [Google Scholar] [CrossRef] [PubMed]
  59. Chang, W.-C.; Lee, T.-Y.; Huang, H.-D.; Huang, H.-Y.; Pan, R.-L. PlantPAN: Plant promoter analysis navigator, for identifying combinatorial cis-regulatory elements with distance constraint in plant gene groups. BMC Genom. 2008, 9, 561. [Google Scholar] [CrossRef]
  60. Yamaguchi-Shinozaki, K.; Shinozaki, K. Organization of cis-acting regulatory elements in osmotic-and cold-stress-responsive promoters. Trends Plant Sci. 2005, 10, 88–94. [Google Scholar] [CrossRef]
  61. Nakashima, K.; Ito, Y.; Yamaguchi-Shinozaki, K. Transcriptional regulatory networks in response to abiotic stresses in Arabidopsis and grasses. Plant Physiol. 2009, 149, 88–95. [Google Scholar] [CrossRef]
  62. Boss, I.W.; Renne, R. Viral miRNAs: Tools for immune evasion. Curr. Opin. Microbiol. 2010, 13, 540–545. [Google Scholar] [CrossRef] [PubMed]
  63. Xie, F.; Wang, Q.; Sun, R.; Zhang, B. Deep sequencing reveals important roles of microRNAs in response to drought and salinity stress in cotton. J. Exp. Bot. 2014, 66, 789–804. [Google Scholar] [CrossRef] [PubMed] [Green Version]
  64. Shehzad, M.; Ditta, A.; Cai, X.; Zhou, Z.; Wang, X.; Xu, Y.; Hou, Y.; Yasir, M.; Khan, M.; Wang, K. Genome wide characterization, evolution and expression analysis of FBA gene family under salt stress in Gossypium species. Biologia 2019, 1–14. [Google Scholar] [CrossRef]
  65. Juturu, V.N.; Mekala, G.K.; Kirti, P. Current status of tissue culture and genetic transformation research in cotton (Gossypium spp.). Plant Cell Tissue Organ Cult. (PCTOC) 2015, 120, 813–839. [Google Scholar] [CrossRef]
  66. Kirungu, J.; Deng, Y.; Cai, X.; Magwanga, R.; Zhou, Z.; Wang, X.; Wang, Y.; Zhang, Z.; Wang, K.; Liu, F. Simple sequence repeat (SSR) genetic linkage map of D genome diploid cotton derived from an interspecific cross between Gossypium davidsonii and Gossypium klotzschianum. Int. J. Mol. Sci. 2018, 19, 204. [Google Scholar] [CrossRef] [PubMed]
  67. Wang, W.; Cheng, Y.; Chen, D.; Liu, D.; Hu, M.; Dong, J.; Zhang, X.; Song, L.; Shen, F. The catalase gene family in cotton: Genome-wide characterization and bioinformatics analysis. Cells 2019, 8, 86. [Google Scholar] [CrossRef]
  68. Hundertmark, M.; Hincha, D.K. LEA (late embryogenesis abundant) proteins and their encoding genes in Arabidopsis thaliana. BMC Genom. 2008, 9, 118. [Google Scholar] [CrossRef] [PubMed]
  69. Magwanga, R.; Lu, P.; Kirungu, J.; Cai, X.; Zhou, Z.; Wang, X.; Diouf, L.; Xu, Y.; Hou, Y.; Hu, Y. Whole genome analysis of cyclin dependent kinase (CDK) gene family in cotton and functional evaluation of the role of CDKF4 Gene in drought and salt stress tolerance in plants. Int. J. Mol. Sci. 2018, 19, 2625. [Google Scholar] [CrossRef] [PubMed]
  70. Zou, C.; Lehti-Shiu, M.D.; Thomashow, M.; Shiu, S.-H. Evolution of stress-regulated gene expression in duplicate genes of Arabidopsis thaliana. PLoS Genet. 2009, 5, e1000581. [Google Scholar] [CrossRef] [PubMed]
  71. Flagel, L.E.; Wendel, J.F. Gene duplication and evolutionary novelty in plants. New Phytol. 2009, 183, 557–564. [Google Scholar] [CrossRef]
  72. Blanc, G.; Hokamp, K.; Wolfe, K.H. A recent polyploidy superimposed on older large-scale duplications in the Arabidopsis genome. Genome Res. 2003, 13, 137–144. [Google Scholar] [CrossRef] [PubMed]
  73. Vandepoele, K.; Raes, J.; De Veylder, L.; Rouzé, P.; Rombauts, S.; Inzé, D. Genome-wide analysis of core cell cycle genes in Arabidopsis. Plant Cell 2002, 14, 903–916. [Google Scholar] [CrossRef] [PubMed]
  74. Dossa, K.; Diouf, D.; Cissé, N. Genome-wide investigation of Hsf genes in sesame reveals their segmental duplication expansion and their active role in drought stress response. Front. Plant Sci. 2016, 7, 1522. [Google Scholar] [CrossRef] [PubMed]
  75. Nekrutenko, A.; Baker, R.J. Subgenome-specific markers in allopolyploid cotton Gossypium hirsutum: Implications for evolutionary analysis of polyploids. Gene 2003, 306, 99–103. [Google Scholar] [CrossRef]
  76. Krasensky, J.; Jonak, C. Drought, salt, and temperature stress-induced metabolic rearrangements and regulatory networks. J. Exp. Bot. 2012, 63, 1593–1608. [Google Scholar] [CrossRef] [PubMed] [Green Version]
  77. Gao, W.; Xu, F.-C.; Guo, D.-D.; Zhao, J.-R.; Liu, J.; Guo, Y.-W.; Singh, P.K.; Ma, X.-N.; Long, L.; Botella, J.R. Calcium-dependent protein kinases in cotton: Insights into early plant responses to salt stress. BMC Plant Biol. 2018, 18, 15. [Google Scholar] [CrossRef]
  78. Grant, D.; Cregan, P.; Shoemaker, R.C. Genome organization in dicots: Genome duplication in Arabidopsis and synteny between soybean and Arabidopsis. Proc. Natl. Acad. Sci. USA 2000, 97, 4168–4173. [Google Scholar] [CrossRef] [PubMed]
  79. Xie, D.; Wang, X.; Fu, L.; Sun, J.; Zheng, W.; Li, Z. Identification of the trehalose-6-phosphate synthase gene family in winter wheat and expression analysis under conditions of freezing stress. J. Genet. 2015, 94, 55–65. [Google Scholar] [CrossRef]
  80. Initiative, A. Analysis of the genome sequence of the flowering plant Arabidopsis thaliana. Nature 2000, 408, 796. [Google Scholar] [CrossRef]
  81. Jain, M.; Nijhawan, A.; Arora, R.; Agarwal, P.; Ray, S.; Sharma, P.; Kapoor, S.; Tyagi, A.K.; Khurana, J.P. F-box proteins in rice. Genome-wide analysis, classification, temporal and spatial gene expression during panicle and seed development, and regulation by light and abiotic stress. Plant Physiol. 2007, 143, 1467–1483. [Google Scholar] [CrossRef]
  82. Jain, M.; Tyagi, A.K.; Khurana, J.P. Genome-wide analysis, evolutionary expansion, and expression of early auxin-responsive SAUR gene family in rice (Oryza sativa). Genomics 2006, 88, 360–371. [Google Scholar] [CrossRef] [PubMed]
  83. Wahl, M.C.; Will, C.L.; Lührmann, R. The spliceosome: Design principles of a dynamic RNP machine. Cell 2009, 136, 701–718. [Google Scholar] [CrossRef] [PubMed]
  84. Lane, N.; Martin, W. The energetics of genome complexity. Nature 2010, 467, 929. [Google Scholar] [CrossRef]
  85. Sakharkar, K.R.; Sakharkar, M.K.; Culiat, C.T.; Chow, V.T.; Pervaiz, S. Functional and evolutionary analyses on expressed intronless genes in the mouse genome. FEBS Lett. 2006, 580, 1472–1478. [Google Scholar] [CrossRef] [PubMed] [Green Version]
  86. Cheng, S.-H.; Willmann, M.R.; Chen, H.-C.; Sheen, J. Calcium signaling through protein kinases. The Arabidopsis calcium-dependent protein kinase gene family. Plant Physiol. 2002, 129, 469–485. [Google Scholar] [CrossRef] [PubMed]
  87. Kong, X.; Lv, W.; Jiang, S.; Zhang, D.; Cai, G.; Pan, J.; Li, D. Genome-wide identification and expression analysis of calcium-dependent protein kinase in maize. BMC Genom. 2013, 14, 433. [Google Scholar] [CrossRef] [PubMed]
  88. Consortium, T.G.O. Gene ontology: Tool for the unification of biology. Nat. Genet. 2000, 25, 25–29. [Google Scholar]
  89. Kulik, A.; Wawer, I.; Krzywińska, E.; Bucholc, M.; Dobrowolska, G. SnRK2 protein kinases—Key regulators of plant response to abiotic stresses. Omics J. Integr. Biol. 2011, 15, 859–872. [Google Scholar] [CrossRef]
  90. Ghelis, T.; Bolbach, G.; Clodic, G.; Habricot, Y.; Miginiac, E.; Sotta, B.; Jeannette, E. Protein tyrosine kinases and protein tyrosine phosphatases are involved in abscisic acid-dependent processes in Arabidopsis seeds and suspension cells. Plant Physiol. 2008, 148, 1668–1680. [Google Scholar] [CrossRef]
  91. Kim, J.-S.; Mizoi, J.; Yoshida, T.; Fujita, Y.; Nakajima, J.; Ohori, T.; Todaka, D.; Nakashima, K.; Hirayama, T.; Shinozaki, K. An ABRE promoter sequence is involved in osmotic stress-responsive expression of the DREB2A gene, which encodes a transcription factor regulating drought-inducible genes in Arabidopsis. Plant Cell Physiol. 2011, 52, 2136–2146. [Google Scholar] [CrossRef]
  92. Li, C.; Ng, C.K.-Y.; Fan, L.-M. MYB transcription factors, active players in abiotic stress signaling. Environ. Exp. Bot. 2015, 114, 80–91. [Google Scholar] [CrossRef]
  93. Nakamichi, N.; Takao, S.; Kudo, T.; Kiba, T.; Wang, Y.; Kinoshita, T.; Sakakibara, H. Improvement of Arabidopsis biomass and cold, drought and salinity stress tolerance by modified circadian clock-associated PSEUDO-RESPONSE REGULATORs. Plant Cell Physiol. 2016, 57, 1085–1097. [Google Scholar] [CrossRef] [PubMed]
  94. Hua, C.; Zhao, J.-H.; Guo, H.-S. Trans-kingdom RNA silencing in plant–fungal pathogen interactions. Mol. Plant 2018, 11, 235–244. [Google Scholar] [CrossRef] [PubMed]
  95. Wang, W.; Liu, D.; Zhang, X.; Chen, D.; Cheng, Y.; Shen, F. Plant microRNAs in cross-kingdom regulation of gene expression. Int. J. Mol. Sci. 2018, 19, 2007. [Google Scholar] [CrossRef] [PubMed]
  96. Ma, C.; Burd, S.; Lers, A. miR408 is involved in abiotic stress responses in Arabidopsis. Plant J. 2015, 84, 169–187. [Google Scholar] [CrossRef] [PubMed]
  97. Jagadeeswaran, G.; Saini, A.; Sunkar, R. Biotic and abiotic stress down-regulate miR398 expression in Arabidopsis. Planta 2009, 229, 1009–1014. [Google Scholar] [CrossRef] [PubMed]
  98. Zhang, Y.; Wang, W.; Chen, J.; Liu, J.; Xia, M.; Shen, F. Identification of miRNAs and their targets in cotton inoculated with Verticillium dahliae by high-throughput sequencing and degradome analysis. Int. J. Mol. Sci. 2015, 16, 14749–14768. [Google Scholar] [CrossRef] [PubMed]
  99. Nuruzzaman, M.; Sharoni, A.M.; Kikuchi, S. Roles of NAC transcription factors in the regulation of biotic and abiotic stress responses in plants. Front. Microbiol. 2013, 4, 248. [Google Scholar] [CrossRef] [Green Version]
  100. Marone, D.; Russo, M.; Laidò, G.; De Leonardis, A.; Mastrangelo, A. Plant nucleotide binding site–leucine-rich repeat (NBS-LRR) genes: Active guardians in host defense responses. Int. J. Mol. Sci. 2013, 14, 7302–7326. [Google Scholar] [CrossRef] [PubMed]
  101. Chiou, T.-J.; Aung, K.; Lin, S.-I.; Wu, C.-C.; Chiang, S.-F.; Su, C.-l. Regulation of phosphate homeostasis by microRNA in Arabidopsis. Plant Cell 2006, 18, 412–421. [Google Scholar] [CrossRef] [PubMed]
  102. Osakabe, Y.; Yamaguchi-Shinozaki, K.; Shinozaki, K.; Tran, L.-S.P. Sensing the environment: Key roles of membrane-localized kinases in plant perception and response to abiotic stress. J. Exp. Bot. 2013, 64, 445–458. [Google Scholar] [CrossRef] [PubMed]
  103. Lorenzo Barrios, L.d.; Merchán Ignacio, F.; Laporte, P.; Thompson, R.D.; Clarke, J.H.; Sousa Martín, C.; Crespi, M.D. A novel plant leucine-rich repeat receptor kinase regulates the response of Medicago truncatula roots to salt stress. Plant Cell 2009, 21, 668–680. [Google Scholar] [CrossRef] [PubMed]
  104. Wu, F.; Sheng, P.; Tan, J.; Chen, X.; Lu, G.; Ma, W.; Heng, Y.; Lin, Q.; Zhu, S.; Wang, J. Plasma membrane receptor-like kinase leaf panicle 2 acts downstream of the drought and salt tolerance transcription factor to regulate drought sensitivity in rice. J. Exp. Bot. 2014, 66, 271–281. [Google Scholar] [CrossRef] [PubMed]
  105. Hwang, S.-G.; Kim, D.S.; Jang, C.S. Comparative analysis of evolutionary dynamics of genes encoding leucine-rich repeat receptor-like kinase between rice and Arabidopsis. Genetica 2011, 139, 1023. [Google Scholar] [CrossRef] [PubMed]
  106. Chae, L.; Sudat, S.; Dudoit, S.; Zhu, T.; Luan, S. Diverse transcriptional programs associated with environmental stress and hormones in the Arabidopsis receptor-like kinase gene family. Mol. Plant 2009, 2, 84–107. [Google Scholar] [CrossRef] [PubMed]
  107. Ouyang, S.Q.; Liu, Y.F.; Liu, P.; Lei, G.; He, S.J.; Ma, B.; Zhang, W.K.; Zhang, J.S.; Chen, S.Y. Receptor-like kinase OsSIK1 improves drought and salt stress tolerance in rice (Oryza sativa) plants. Plant J. 2010, 62, 316–329. [Google Scholar] [CrossRef] [PubMed]
  108. Lu, W.; Chu, X.; Li, Y.; Wang, C.; Guo, X. Cotton GhMKK1 induces the tolerance of salt and drought stress, and mediates defence responses to pathogen infection in transgenic Nicotiana benthamiana. PLoS ONE 2013, 8, e68503. [Google Scholar] [CrossRef]
  109. Zhang, L.; Li, Y.; Lu, W.; Meng, F.; Wu, C.-A.; Guo, X. Cotton GhMKK5 affects disease resistance, induces HR-like cell death, and reduces the tolerance to salt and drought stress in transgenic Nicotiana benthamiana. J. Exp. Bot. 2012, 63, 3935–3951. [Google Scholar] [CrossRef]
Figure 1. Collinearity relationship between genetic and physical map of G. hirsutum. (a) Shows collinearity for chromosomes 1–13 and (b) shows collinearity for chromosomes 14–26 of G. hirsutum.
Agronomy 09 00560 g001
Figure 2. (a) Indicates the total number of Pkinase genes among the three cotton species and (b) indicates the number of genes in individual subfamilies of the Pkinase gene family.
Agronomy 09 00560 g002
Figure 3. Phylogenetic tree relationship of 13 subfamilies of Pkinase genes in G. hirsutum, G. arboreum and G. raimondii constructed by MEGA 6.06. Different color border lines depict different gene subfamilies.
Agronomy 09 00560 g003
Figure 4. (a) Gene structure of G. hirsutum illustrated by GSDS 2.0. Exons are indicated with yellow colored blocks and introns with black linez. (b) Gene localization; X-axis indicates number of genes and Y-axis shows different cellular compartments.
Agronomy 09 00560 g004
Figure 5. Gene ontology (GO) annotation of 75 G. hirsutum genes, depicting the biological processes and molecular functions of the identified genes. Abbreviations: ATP—adenosine triphosphate.
Agronomy 09 00560 g005
Figure 6. (a) Distribution of Ks values for orthologous gene pairs between the A and D genomes and At and Dt subgenomes of G. hirsutum. (b) Distribution of Ka/Ks value between the A and D genomes and At and Dt subgenomes of G. hirsutum. (c) Syntenic relationships among all homologous genes in At and Dt subgenomes (G. hirsutum), D genome (G. raimondii) and A genome (G. arboreum). Each chromosome in the respective subgenome is shown with the same color.
Agronomy 09 00560 g006
Figure 7. Expression patterns of 75 Pkinase genes, C indicates the control and ST indicates the salt stress expression. Red lines show upregulated genes and blue line indicates downregulated genes while white line shows no expression of genes. Abbreviations: FPKM—fragments per kilobase per million reads.
Agronomy 09 00560 g007
Figure 8. RT-qPCR expression results of twelve G. hirsutum genes. Heat map of G. hirsutum (a) and G. darwinii (b). Red blocks show upregulated and blue designate downregulated genes whereas white blocks show no expression.
Agronomy 09 00560 g008
Table 1. Distribution of Pkinase genes among different chromosomes of G. hirsutum, G. raimondii and G. arboreum.
Gossypium genomeChromosome No.Total Number of GenesGossypium genomeChromosome No.Total Number of Genes
(AD) GenomeAt16 A032
At25 A043
At54 A051
At72 A072
At81 A081
At94 A095
At101 A101
At118 A117
At123 A123
Dt141 Scaffolds1
Dt159Total 35
Dt162(D) GenomeD012
Dt173 D0210
Dt182 D034
Dt192 D041
Dt202 D051
Dt217 D066
Dt222 D076
Dt235 D084
Dt241 D092
Dt264 D111
Scaffolds1 D122
Total 75 D132
(A) GenomeA017Total 41
A022
Table 2. Cis-element of genes that responded to salt stress.
Factor NameSignal SequenceFunctionNo. of Genes
Box 4ATTAATInvolved in light responsiveness40
TATC-boxTATCCCAInvolved in gibberellin-responsiveness38
MYCCAATTGRole in cell proliferation50
MYBSCAACTGAbiotic stress tolerance55
CAAT-boxCAATBinding factors60
AT-rich elementATAGAAATCAAAT-rich DNA binding protein (ATBP-1)49
G-BoxCACGTTIn network regulating flag leaf senescence process40
TATA-boxTATACore promoter element55
AREAAACCAEssential for the anaerobic induction41
MBSCAACTGInvolved in drought-inducibility53
ABRECGCACGTGTCInvolved in the abscisic acid responsiveness54
Myb-binding siteCAACAGPlant Myb-binding site50
TGACG-motifTGACGMeJA responsiveness40
HD-Zip 1CAAT(A/T) ATGDifferentiation of palisade mesophyll cell20
TGA-elementAACGACAuxin-responsive element35
CCAAT-boxCAACGGPlant MYBHv1 binding site39
TCA-elementCCATCTTTTTSalicylic acid responsiveness52
P-boxCCTTTTGGibberellin-responsive element28
DREGCCGACStress responsiveness25
3-AF1 binding siteTAAGAGAGGAALight responsive element4
O2-siteGATGATGTGGInvolved in zinc metabolism regulation30
ABRE, ABA-responsive element; 3-AF1, 3-activation factor 1; ARE, antioxidant-response element; DRE, dehydration-responsive element; HD-Zip 1, homeodomain-leucine zipper 1; MYB, myeloblastosis; MBS, MYB binding site; MYC, myelocytoma.

