Stacking Agricultural Management Tactics to Promote Improvements in Soil Structure and Microbial Activities

1
North Central Agricultural Research Laboratory, Agricultural Research Service, U.S. Department of Agriculture, 2923 Medary Ave, Brookings, SD 57006, USA
2
Horticulture, and Plant Science, Department of Agronomy, South Dakota State University, Brookings, SD 57007, USA
*
Author to whom correspondence should be addressed.
Agronomy 2019, 9(9), 539; https://doi.org/10.3390/agronomy9090539
Submission received: 15 July 2019
/
Revised: 29 August 2019
/
Accepted: 3 September 2019
/
Published: 12 September 2019
(This article belongs to the Special Issue Soil Health in Agroecosystems)
Abstract
:Linking agricultural management tactics to quantifiable changes in soil health-related properties is a key objective for increasing adoption of the most favorable management practices. We used two long-term, no-till cropping studies to illustrate the variable patterns of response of soil structure indices and microbial activity to additional management tactics, including crop rotational diversity, residue management and cover cropping. We found that observable effects of management tactics on soil properties were often dependent on the current crop phase sampled, even though the treatments were well-established. In some cases, a single additional management tactic produced a response, two tactics each produced a response and sometimes there were interactions between tactics. However, importantly, we never observed a negative effect for any of the response variables when stacking soil health building practices in no-till cropping systems. The collective results from the two field studies illustrate that soil health improvements with stacking management tactics are not always simply additive and are affected by temporal relationships inherent to the treatments. We conclude that the implementation of multiple positive management tactics increases the likelihood that improvements in soil properties can be documented with one or more of the proxy measures for soil health.
1. Introduction
Agricultural management tactics, such as reduced tillage, that limit erosion and preserve the volume of topsoil supporting global food production systems are widely recognized [1]. More recently, the potential for agricultural management practices to influence soil biological populations and processes, and thereby improve the quality or health of soils has received increased attention [2,3,4]. Soils that possess good structure permit air and water to move freely through connected pore spaces and stimulate microbial activity. Soils that possess relatively high soil C concentrations tend to have good structure and provide substrate for microbial activities. Biologically diverse and active soils reinforce soil structure, increasing erosion resistance and creating efficiencies for water, nutrient and pesticide use [5,6,7,8]. Management practices that produce healthy soils are linked to reductions in input requirements for crop production and negative off-site effects to air and water quality [9,10,11,12]. Agricultural management practices, such as diversified crop rotations, have been shown to increase the resiliency of crop yields to variability due to climate and other external stresses [13,14].
A number of national programs have been established to support research on the biology of agricultural soils, including prominent programs in the EU, U.S., Canada, Brazil, Argentina, Australia and Scandinavian countries, among others. A great deal of research has been conducted to investigate the effect on soil properties of one or two management factors, such as tillage or cover cropping, that are imposed on otherwise conventionally-managed systems [2,3,4]. Crop production is a complex system with multiple interacting factors varying on temporal and spatial scales. Therefore, it is likely that soil health is a set of emergent properties that are evident when multiple management practices have been implemented for a sufficient duration. Emergent properties might include yield stability and resilience, closed nutrient cycles, efficient water use, disease, and weed resistance, and carbon sequestration. These properties are often unpredictable, hard to measure, and require multiple types of measurements over an extended period. Accordingly, proxy measures for soil health are being thoroughly evaluated by groups of researchers and institutions [2,15]. Of these candidate proxy measures, soil structure indices based on aggregation have been proven to be reliable [2,15] and are often linked to biological activity in the soils.
Agricultural management practices that tend to build soil health include reduced or no-till, reduced synthetic fertilizers, crop residue retention, diversity in crop rotation, and cover cropping [4]. Adding more conservation management tactics onto an existing set of base conservation practices is often referred to as “stacking” practices by producers. The results of interactions between multiple management tactics can be additive, synergistic, antagonistic or neutral. In a global meta-analysis of cropping systems, the addition of both cover crops and crop residue retention, mitigated the negative effects of no-till management on crop yield, with the most dramatic results in dry climates [16]. Regarding soil properties, positive effects of long-term no-till and residue retention on carbon mineralization activity and water stable aggregation were found to be additive in a continuous corn cropping system [17]. Stacking of cover crops onto the long-term no-till management of a continuous corn cropping system increased carbon mineralization activities in an additive or possibly synergistic fashion compared to tilled, no-cover crop treatments [18].
Questions frequently arise from farm managers regarding how many (and what) management tactics need to be applied to observe measurable effects on soil health, and whether the effects of multiple tactics will be additive. At our field site, we have established two long-term field studies that already have base conservation tactics in all treatments. In field study 1, there are two base management tactics: no-till and lean N fertility. In field study 2, there is one base management tactic: no-till. In field study 1, one additional management tactic, crop rotational diversity, is stacked onto the two base management tactics. In field study 2, two additional tactics, residue management and cover cropping, are stacked onto to the one base management tactic. In this paper, we use results from these two long-term field experiments as case studies to illustrate that multiple management tactics produce multiple patterns of influence on soil health, as measured by dependable soil structure measures and soil microbial activities.
2. Materials and Methods
2.1. Study Site
The 65 ha Eastern South Dakota Soil and Water Research Farm is located in Brookings, South Dakota (44°19′ N latitude; 96°46′ W longitude) at 500 m elevation in the Big Sioux Basin of the northern glaciated plains, a region with 58 cm mean annual precipitation and a mean annual temperature of 8 °C [19]. This land is classified as Rolling Till Prairie within the Central Feed Grains and Livestock Region [20]. The Mollisol soils are a Barnes sandy clay loam (fine-loamy, mixed, superactive, frigid Calcic Hapludoll) that are moderately drained, with relatively high soil organic carbon (18 g C kg−1 soil, 0–15 cm), and a clay content of about 280 g kg−1 measured in the top five cm [21].
2.2. Experimental Plots, Agricultural Management and Soil Sampling
2.2.1. Field Study 1
A single management tactic was added to existing base management tactics. The base treatment in this study was a no-till, corn–soybean rotation with lean N fertility which was compared to rotations with additional crop diversity. Rainfed, no-till field plots (93 m2) were established in 2000 in a randomized, complete block design with four replications. The study included a two-year (corn–soybean) rotation and four-year (corn–oat–winter wheat–soybean; corn–field pea–winter wheat–soybean; corn–soybean–spring wheat–field pea; corn–soybean–spring wheat–sunflower) rotations, with replicate plots for each crop phase present in every year. Crop agronomic information, including planting and harvest date ranges, planting population, row spacing and depth have been published [12]. Starter fertilizer was applied to all crops at planting, that contained 15.68 kg N ha−1, 17.63 kg P ha−1, and 11.98 kg K ha−1. The bulk of N (about 75% of annual application) was surface broadcast as 34-0-0 ammonium nitrate at the V6 growth stage for corn and tillering for winter wheat to reach a yield goal of 6095 kg ha−1 (155 g kg−1 moisture) for corn and a yield goal of 3763 kg ha−1 (135 g kg−1 moisture) for winter wheat. The amount of applied N for any crop was dependent on annually-measured mean values of residual soil nitrate for that crop across all treatments. On average corn received an additional 57 kg N ha−1, while the winter wheat crop only received an additional 28 kg N ha−1 during the 2011 growing season. Sunflowers, spring wheat and oats averaged 35, 47, and 72 kg N ha−1, respectively, across all years. No additional fertilizer was added to the soybeans or peas. Weeds were controlled with an annually-adjusted regime of 2,4-dichlorophenoxyacetic acid and glyphosate applications that were uniform across the test plots.
Composite soil samples were collected from the plots in May 2013 following three complete rotations for the four-year -rotation crops and six complete rotations for the two-year -rotation crops. We report data for the 0 to 5 cm depth interval which has shown to be responsive to treatment in no-till cropping systems in our region [22,23,24,25].
2.2.2. Field Study 2
The base treatment in field study 2 was a no-till, corn–soybean rotation with standard N fertility, no cover crop and removal of the corn residue. Corn residue removal for bedding and feed is now common practice in our region. This base treatment was stacked with two additional tactics: (1) retention of corn residues, and (2) addition of post-harvest fall cover-crops.
Rainfed, no-till plots (30 × 30 m) were established in Spring of 2000 in a randomized complete block with three replications and planted to a corn–soybean rotation with each crop planted each year. The residue management treatment consisted of corn stover removal by cutting and removing silage at 0.15 m above ground compared to retaining the corn residue. The residue removal treatment resulted in removal of an average of 98% of above ground dry biomass [22]. In the residue retained treatment, only grain was removed by combine, with all stalks, leaves and cobs remaining on the soil surface. In the fall of 2005, the residue removal treatments were split and a cover crop treatment (with or without cover crop) was integrated into the overall design, thus adjusting the experimental design from a randomized complete block design to a split-plot design. Cover crops consisted of winter legumes broadcast into soybeans at the end of R6 and winter grass broadcast into corn at tasseling. Additional site information is available in prior publications [22,23,24,26,27]. Composite soil samples (0 to 5 cm), composed of nine cores (3.2 cm diameter) collected in an “X”-shaped pattern from each plot, were taken in July 2012 after 12 years of residue management treatments and seven years of cover crop treatments.
2.3. Soil Physical and Biological Analyses
The mean weight diameter (MWD) of soil aggregates was measured on dried soil samples with visible plant residue removed. Dry aggregate size distributions were determined for soil samples by rotary sieving [28]. Soils were separated into six aggregate size classes representing (1) <0.42 mm, (2) 0.42–0.84 mm, (3) 0.84–2.0 mm, (4) 2.0–6.4 mm, (5) 6.4–19.2 mm and (6) >19.2 mm. Mean weight diameter was calculated as per published methods [29], and represents an index of the size of soil aggregates. Larger aggregates contribute to maintaining soil structure and provide a means for soil and water movement through the soil.
The erodible fraction (EF) of soil aggregates (as separated above) is defined as the mass fraction of soil aggregates <0.84 mm diameter, the sum of size classes 1 and 2 above, and is related to the soil’s susceptibility to wind erosion [30].
Soil microbial activity was assessed in field study 1 by measuring short-term, potential carbon mineralization by quantifying the flush of carbon dioxide (CO2) following rewetting of dried soil samples [31]. The evolved CO2 from a 30 g soil sample accumulated over a 24 h period following rewetting was measured by gas chromatography using a Shimadzu 2014 gas chromatograph (Shimadzu, Portland, OR, USA) equipped with Hayesep packed columns, a methanizer and a flame ionization detector. Analytical precision estimates (coefficient of variation) among independent replicate CO2 standards were <4%. For field study 2, soil microbial hydrolytic activity was measured by hydrolysis of fluorescein diacetate [32], as modified by Schumacher et al. [33], to use smaller reagent volumes.
2.4. Statistics
The main effects of crop management tactics on soil aggregation indices and soil microbial activities within each of the two crop phases sampled (corn and soybean) were evaluated using analysis of variance procedures with crop management tactic(s) as the fixed factor(s) and block as the random factor (PROC MIXED, SAS version 9.3, SAS Institute Inc. Cary, NC, USA). In recognition of the inherent temporal and spatial variability in soil properties and limited replication of field plots compared to greenhouse or lab studies [34], exact probabilities for main treatments are reported. Pairwise comparisons were performed with treatment groupings identified at α = 0.05 (field study 1, four blocks) or α = 0.10 level (field study 2, three blocks) by Tukey’s test. Statistics were performed on untransformed data for each dependent variable. For the figures, mean values for dependent variables are expressed as percentages of the mean value associated with the default management practice.
3. Results
3.1. Field Study 1
The base management treatment for Field Study 1 was a no-till, corn–soybean rotation with lean N fertility. The mean weight diameter (MWD) of soil aggregates in this base treatment was 6.1 mm in the corn phase and 6.9 mm in the soybean phase. Crop rotation affected the MWD for both corn (p < 0.001) and soybean (p = 0.030) phases. For each rotation, the MWD is expressed as a percentage of the base treatment value for corn and soybean phases (Figure 1).
An elevated MWD means there is a greater proportion of larger aggregates. For either crop phase that was common to all rotations, the MWD was equal or higher in the four-year rotations compared to the base two-year rotation. The highest MWD were observed in the corn phase of four-year rotations containing spring wheat, where it was >50% higher than the corn–soybean rotation.
The erodible fraction (EF) of soil aggregates in the corn–soybean rotation was 314 g kg−1 in the corn phase and 308 g kg−1 in soybean phase. Crop rotation influenced the EF for both corn (p < 0.001) and soybean (p < 0.001) phases. Lower amounts of EF mean there is a reduced probability of erosion. The EF for all four-year rotations was equal or lower than that of the two-year rotation for either crop phase (Figure 2).
Of the four-year rotations, the highest EF values were observed in the soybean phases of the rotations containing spring wheat. Conversely, the lowest EF values were observed in the corn phases of these same rotations, which averaged 50% lower EF than the base two-year rotation.
Short-term C mineralization values in the corn–soybean rotation were 15.2 and 17.3 mg C-CO2 kg−1 in the corn and soybean phases, respectively. Crop rotation affected C mineralization in both corn (p = 0.078) and soybean (p = 0.082) phases of the rotations. Relative to the two-year corn–soybean rotation, all of the four-year rotations had equal or higher values of activity for both crop phases (Figure 3).
For the corn phase, the four-year rotations averaged 40% higher mineralization activity compared to the two-year rotation. For the soybean phase, the four-year rotations with winter wheat preceding the soybean had the highest levels of activity, averaging 30% higher than the two-year rotation.
3.2. Field Study 2
The base management treatment for field study 2 was a no-till, corn–soybean rotation with corn residue removal and no cover crop; the main effects of the treatments are presented in Table 1.
The MWD of soil aggregates in this base treatment was 10.1 mm in the corn phase and 6.2 mm in the soybean phase. In the corn phase, both treatments had little effect on MWD (Figure 4A).
However, in the soybean phase, residue retention resulted in a doubling of the MWD (Figure 4B). Cover crops raised the MWD 75% when residue was removed, but had little effect when residue was retained.
The EF of soil aggregates in the base treatment was 164 g kg−1 in the corn phase and 404 g kg−1 in the soybean phase. For corn, both treatments had little effect on EF (Figure 5A), but for the soybean phase, residue retention lowered the EF by 80% (Figure 5B). Cover crops lowered the EF 60% when residue was removed, but there was no influence of cover crops when residue was retained.
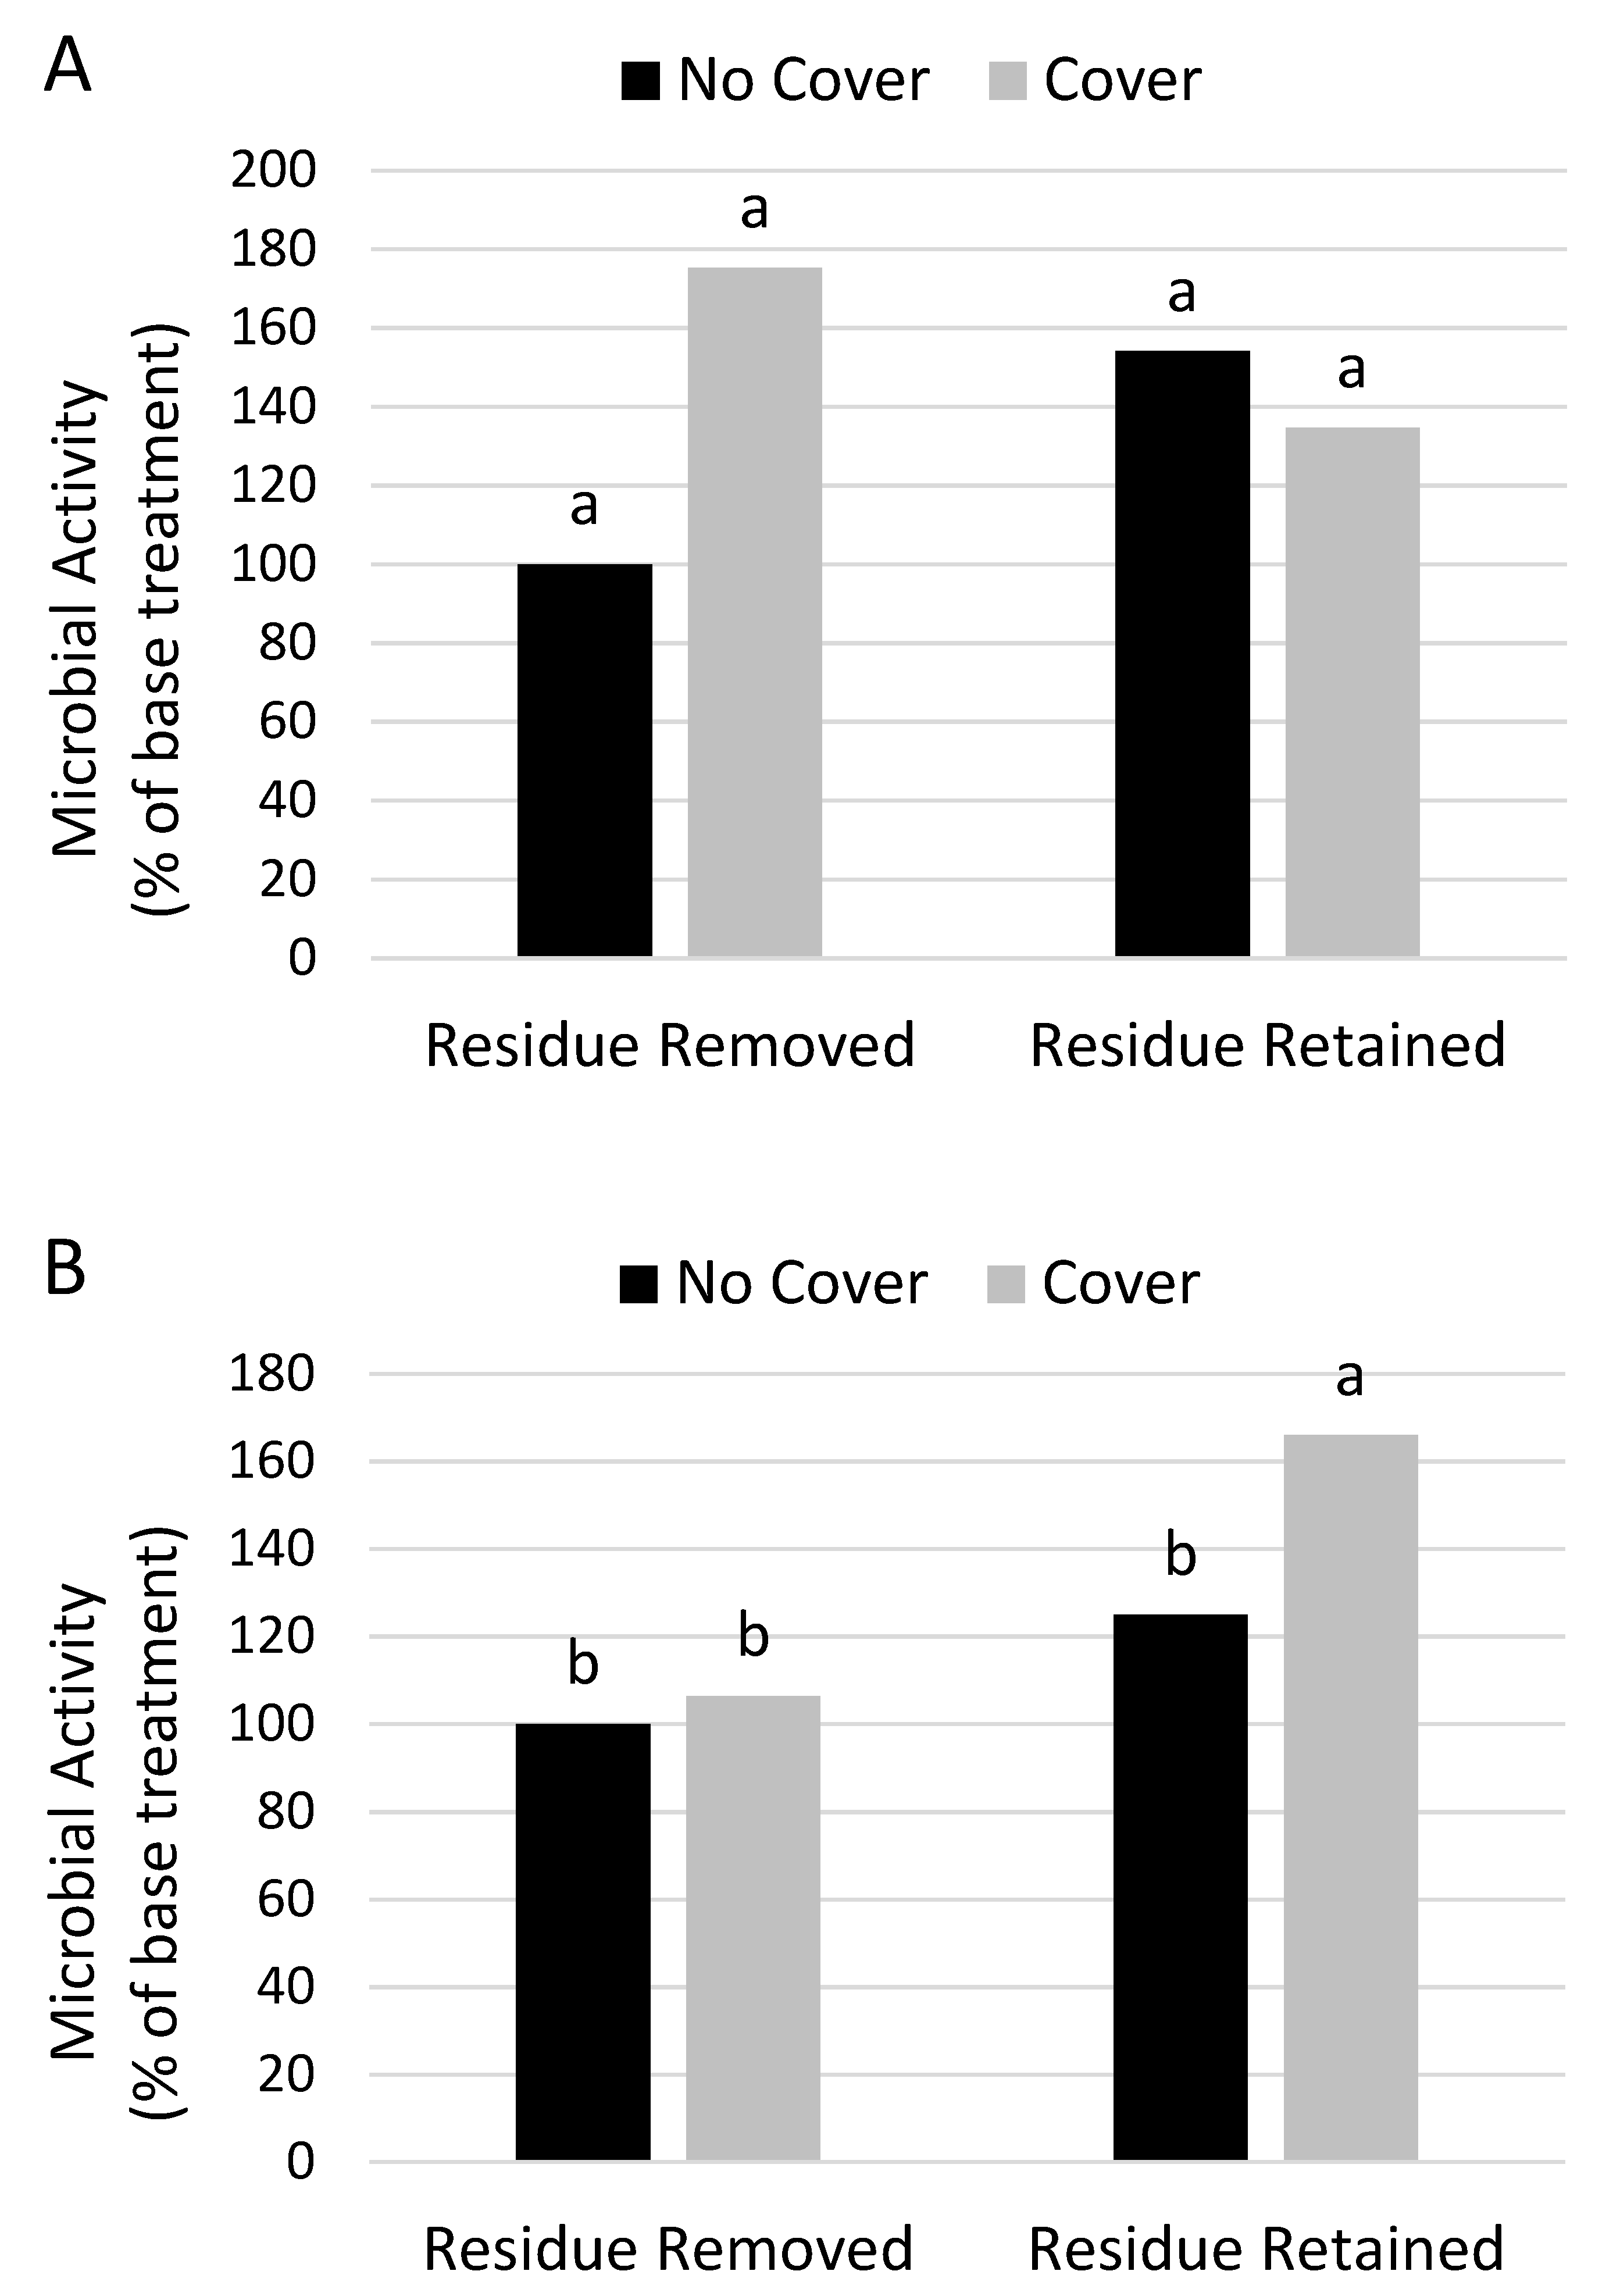
Microbial activity was measured by FDA hydrolysis in field study 2. In the base treatment with residue removed and no cover crop, FDA activity was 10.2 µg g−1 h−1 in the corn phase and 11.8 µg g−1 h−1 in soybean phase. For corn with no cover crops, the average FDA activity when residue was retained was about 50% higher than the base treatment, although this difference was not significant due to variation among plots (Figure 6A). When cover crops were added to mitigate residue removal, activity increased by 75% but the probability of the cover crop effect was >0.1 (p = 0.153). For soybeans, residue retention also increased the average FDA activity 20%, and adding cover crops with retained residue, significantly (p < 0.1) increased activity another 40% (Figure 6B).
4. Discussion
4.1. Field Study 1
The measures of soil structure, MWD and EF, were improved by some crop rotations compared to the base treatment of no-till with lean N fertility. We previously reported that soil C accrues in the base corn–soybean (CS) treatment indicating that no-till and lean N fertility produce improvements in soil health; however, the four-year rotation (CPWwS) accrued soil organic C faster and deeper in the soil profile [12]. In the current study, MWD was not significantly different between CS and CPWwS, but EF varied significantly between these treatments under both crop phases. These findings highlight the uncertainties in the response of soil health measures to agricultural management, even when well-accepted measures such as soil organic C and aggregation are applied to controlled, long-term management treatments. A recent meta-analysis found that crop rotation diversity increases soil organic C and microbial biomass, but no data on soil structure was evaluated [35]. In an earlier literature review, the effects of crop diversity on soil aggregation were reported to be inconsistent, and varied with local management factors [36].
While the effects of rotation on MWD and EF were not identical, both measures responded more strongly to the rotation treatments when measured during the corn phase compared to the soybean phase. These findings indicate that while effects of the long-term rotation treatments were visible, there are also measurable, shorter term effects on soil structure due to the current crop phase. The strongest treatment effects were observed in the corn phase for the two spring-wheat-containing rotations, even though spring wheat was not the crop immediately preceding corn in these rotations. Crop sequencing effects are commonly focused on the immediately preceding crop [37,38,39] which was either field pea or sunflower for the spring-wheat-containing rotations, compared to soybean for other rotations. Field peas produce limited amounts of residue similar to soybeans, but sunflowers produce deeper roots and greater amounts of residue, thus limiting general conclusions regarding the effects of the immediately preceding crop on soil structure. Our observations appear consistent with more enduring effects of crop sequences on soil properties reported in cereal cropping systems [40].
Short-term C mineralization responded to the treatments in nearly an identical manner to EF and similarly to MWD, indicating the improvements in soil structure with crop rotation influenced the soil biota. This measure of potential carbon mineralization has been correlated with labile carbon fractions, microbial biomass C and mineralizable N, that together indicate the capacity of soil to cycle nutrients and support a diverse community of soil organisms [41]. Short-term C mineralization has been previously used to document improved soil health by cover cropping and reduced tillage practices [42], but not by diversified crop rotation. The diversification of a no-till wheat cropping system with the addition of field peas was found to increase microbial biomass and beta-glucosidase activities [43]. We modified field study 1 in 2016 after four complete rotations to include a fall cover crop treatment that will provide a future opportunity to evaluate the effect of stacking an additional management practice on the existing treatments.
4.2. Field Study 2
Residue retention and cover cropping tactics were stacked onto the base no-till CS rotation with residue removal and no cover crop. The two measures of soil structure largely responded to the treatments in the same manner. Most strikingly, there were minimal treatment effects in the corn phase, but EF and MWD responded strongly during the soybean phase. This phase-dependency in responses was similar to field study 1, but the crop phases were switched. This finding again highlights short-term influences on soil properties that occur within the longer-term treatment effects on these same properties. In contrast to our results with a CS rotation, additive effects of no-till and residue retention on improved aggregate stability were reported in a continuous corn cropping system [17]. In the soybean phase of field study 2, the cover crop treatment improved EF and MWD about 60% over the base case with residue removed. In a two-year, no-till cereal crop rotation, other researchers observed an 80% increase in MWD in the 0 to 7.5 cm depth with the addition of cover crop treatments [25]. But, in the residue retained treatment, we observed minor effects of the cover crop and just retaining residue improved the EF and MWD by 80% and 100%, respectively. In our field study, it is expected that since the soybean phase immediately follows the corn residue treatment, the effects of corn residue removal are more observable [24] and possibly mitigate the influence of the cover crops when residue is retained.
FDA hydrolysis is a general indicator of decomposition activity in soils [44] and has been considered a useful indicator of soil health [45]. While FDA hydrolysis largely reflects depolymerization activities, it has been found to strongly correlate with respiration [44]. The addition of winter cover crops to vegetable cropping systems was reported to increase FDA hydrolysis activity [46], and we have reported FDA activities decrease with crop residue removal [23]. Other researchers have found that C mineralization activities decrease with corn residue removal [17,47]. In continuous corn, the addition of cover crops to no-till management increased C mineralization activity in an additive fashion in comparison to the tilled, no cover crop treatment [18]. In the soybean phase, we found that adding cover crops to the base case had no effect on activity, but, the combination of cover crops and residue retention boosted FDA activity about 65% over the base treatment. This was the only potential example of synergistic effects between management tactics on the response variables observed in field study 2 where two management tactics were stacked onto the base system. The possibility of synergistic interactive effects of crop management tactics on soil properties and cash crop performance has been considered in the context of no-till, crop rotation and crop sequencing [39,48]. Synergism among management tactics has been hypothesized to involve changes in soil biological components which are yet to be identified [39,48], but documenting synergistic effects on even simple biological measures, such as C mineralization, is very difficult, as it requires accurately quantifying the variability of the responses to temporal factors in addition to the consistently applied management treatments.
4.3. Summary of Both Case Studies
We found several different patterns of response with stacking soil building management tactics that often varied with the common crop phase being sampled. In field study 1, the addition of crop rotational diversity always produced a response, but responses varied with specific crop sequences of the treatments. In field study 2, sometimes there were only minor effects of tactics on soil properties, or only one management tactic produced a response, or there were interactions between tactics, but importantly, we never observed a negative effect for any of the response variables when stacking soil health building practices. The collective results from the two field studies illustrate that soil health improvements with stacking management practices are not simply additive and are affected by temporal relationships inherent to the treatments. These temporal management factors include the current crop, crop sequences within rotation, establishment of the cover crops and timing of residue management of events.
5. Conclusions
Crop production systems are complex, and the soil properties currently associated with positive management practices and healthy soils may not be consistently visible even under long-term management. However, the implementation of multiple positive management practices increases the likelihood of observing improvements in soil properties that can be documented with one or more of the proxy measures for soil health.
Author Contributions
Conceptualization, R.M.L. and S.L.O.; methodology, R.M.L., S.L.O. and K.M.; formal analysis, R.M.L., S.L.O. and K.M.; writing—original draft preparation, R.M.L.; writing—review and editing, R.M.L. and S.L.O.
Funding
This research received no external funding.
Acknowledgments
Mention of trade names or commercial products in this publication is solely for the purpose of providing specific information and does not imply recommendation or endorsement by the U.S. Department of Agriculture. USDA is an equal opportunity provider and employer.
Conflicts of Interest
The authors declare no conflict of interest.
References
- Pimentel, D.; Harvey, C.; Resosudarmo, P.; Sinclair, K.; Kurz, D.; McNair, M.; Crist, S.; Shpritz, L.; Fitton, L.; Saffouri, R.; et al. Environmental and economic costs of soil erosion and conservation Benefits. Science 1995, 267, 1117–1123. [Google Scholar] [CrossRef] [PubMed]
- Bünemann, E.K.; Bongiorno, G.; Bai, Z.; Creamer, R.E.; De Deyn, G.; de Goede, R.; Fleskens, L.; Geissen, V.; Kuyper, T.W.; Mäder, P. Soil quality—A critical review. Soil Biol. Biochem. 2018, 120, 105–125. [Google Scholar] [CrossRef]
- Wolińska, A.; Kuźniar, A.; Zielenkiewicz, U.; Banach, A.; Błaszczyk, M. Indicators of arable soils fatigue–Bacterial families and genera: A metagenomic approach. Ecol. Indic. 2018, 93, 490–500. [Google Scholar] [CrossRef]
- Lehman, R.M.; Cambardella, C.A.; Stott, D.E.; Acosta-Martinez, V.; Manter, D.K.; Buyer, J.S.; Maul, J.E.; Smith, J.L.; Collins, H.P.; Halvorson, J.J. Understanding and enhancing soil biological health: The solution for reversing soil degradation. Sustainability 2015, 7, 988–1027. [Google Scholar] [CrossRef]
- Bender, S.F.; Heijden, M.G. Soil biota enhance agricultural sustainability by improving crop yield, nutrient uptake and reducing nitrogen leaching losses. J. Appl. Ecol. 2015, 52, 228–239. [Google Scholar] [CrossRef]
- Wagg, C.; Bender, S.F.; Widmer, F.; van der Heijden, M.G.A. Soil biodiversity and soil community composition determine ecosystem multifunctionality. Proc. Natl. Acad. Sci. USA 2014, 111, 5266–5270. [Google Scholar] [CrossRef] [PubMed] [Green Version]
- Köhl, L.; Oehl, F.; van der Heijden, M.G.A. Agricultural practices indirectly influence plant productivity and ecosystem services through effects on soil biota. Ecol. Appl. 2014, 24, 1842–1853. [Google Scholar] [CrossRef]
- Wilson, G.W.; Rice, C.W.; Rillig, M.C.; Springer, A.; Hartnett, D.C. Soil aggregation and carbon sequestration are tightly correlated with the abundance of arbuscular mycorrhizal fungi: Results from long-term field experiments. Ecol. Lett. 2009, 12, 452–461. [Google Scholar] [CrossRef]
- Pretty, J. Intensification for redesigned and sustainable agricultural systems. Science 2018, 362. [Google Scholar] [CrossRef]
- Cassman, K.G. Ecological intensification of cereal production systems: Yield potential, soil quality, and precision agriculture. Proc. Natl. Acad. Sci. USA 1999, 96, 5952–5959. [Google Scholar] [CrossRef] [Green Version]
- Davis, A.S.; Hill, J.D.; Chase, C.A.; Johanns, A.M.; Liebman, M. Increasing cropping system diversity balances productivity, profitability, and environmental health. PLoS ONE 2012, 7, e47149. [Google Scholar] [CrossRef] [PubMed]
- Lehman, R.M.; Osborne, S.L.; Duke, S.E. Diversified no-till crop rotation reduces nitrous oxide emissions, increases soybean yields, and promotes soil carbon accrual. Soil Sci. Soc. Am. J. 2017, 81, 76–83. [Google Scholar] [CrossRef]
- Yamoah, C.F.; Francis, C.A.; Varvel, G.E.; Waltman, W.J. Weather and management impact on crop yield variability in rotations. J. Prod. Agric. 1998, 11, 219–225. [Google Scholar] [CrossRef]
- Gaudin, A.C.M.; Tolhurst, T.N.; Ker, A.P.; Janovicek, K.; Tortora, C.; Martin, R.C.; Deen, W. Increasing crop diversity mitigates weather variations and improves yield stability. PLoS ONE 2015, 10, e0113261. [Google Scholar] [CrossRef] [PubMed]
- NRCS. Recommended Soil Health Indicators and Associated Laboratory Procedures; U.S. Dept. of Agriculture Natural Resources Conservation Service: Washington, DC, USA, 2019.
- Pittelkow, C.M.; Liang, X.; Linquist, B.A.; Van Groenigen, K.J.; Lee, J.; Lundy, M.E.; van Gestel, N.; Six, J.; Venterea, R.T.; van Kessel, C. Productivity limits and potentials of the principles of conservation agriculture. Nature 2015, 517, 365–368. [Google Scholar] [CrossRef] [PubMed]
- Kinoshita, R.; Schindelbeck, R.R.; van Es, H.M. Quantitative soil profile-scale assessment of the sustainability of long-term maize residue and tillage management. Soil Tillage Res. 2017, 174, 34–44. [Google Scholar] [CrossRef]
- Nunes, M.R.; van Es, H.M.; Schindelbeck, R.; Ristow, A.J.; Ryan, M. No-till and cropping system diversification improve soil health and crop yield. Geoderma 2018, 328, 30–43. [Google Scholar] [CrossRef]
- Bryce, S.A.; Omernik, J.M.; Pater, D.E.; Ulmer, M.; Schaar, J.; Freeouf, J.; Johnson, R.; Kuck, P.; Azevedo, S.H. Ecoregions of North Dakota and South Dakota (Map Scale 1:1,500,000); U.S. Geological Survey: Reston, VA, USA, 1996.
- NRCS. Land Resource Regions and Major Land Resource Areas of the United States, the Caribbean, and the Pacific Basin; U.S. Department of Agriculture Handbook 296; U.S. Department of Agriculture: Washington, DC, USA, 2006.
- Pikul, J.L.; Osborne, S.; Ellsbury, M.; Riedell, W. Particulate organic matter and water-stable aggregation of soil under contrasting management. Soil Sci. Soc. Am. J. 2007, 71, 766–776. [Google Scholar] [CrossRef]
- Hammerbeck, A.L.; Stetson, S.J.; Osborne, S.L.; Schumacher, T.E.; Pikul, J.L. Corn residue removal impact on soil aggregates in a no-till corn/soybean rotation. Soil Sci. Soc. Am. J. 2012, 76, 1390–1398. [Google Scholar] [CrossRef]
- Stetson, S.J.; Osborne, S.L.; Schumacher, T.E.; Eynard, A.; Chilom, G.; Rice, J.; Nichols, K.A.; Pikul, J.L. Corn residue removal impact on topsoil organic carbon in a corn–soybean rotation. Soil Sci. Soc. Am. J. 2012, 76, 1399–1406. [Google Scholar] [CrossRef]
- Wegner, B.R.; Osborne, S.L.; Lehman, R.M.; Kumar, S. Seven-year impact of cover crops on soil health when residue is removed. BioEnergy Res. 2018, 11, 239–248. [Google Scholar] [CrossRef]
- Blanco-Canqui, H.; Mikha, M.M.; Presley, D.R.; Claassen, M.M. Addition of cover crops enhances no-till potential for improving soil physical properties. Soil Sci. Soc. Am. J. 2011, 75, 1471–1482. [Google Scholar] [CrossRef]
- Lehman, R.M.; Ducey, T.F.; Jin, V.L.; Acosta-Martinez, V.; Ahlschwede, C.M.; Jeske, E.S.; Drijber, R.A.; Cantrell, K.B.; Frederick, J.R.; Fink, D.M. Soil microbial community response to corn stover harvesting under rain-fed, no-till conditions at multiple US locations. BioEnergy Res. 2014, 7, 540–550. [Google Scholar] [CrossRef]
- Lehman, R.M.; Osborne, S.L. Soil greenhouse gas emissions and carbon dynamics of a no-till, corn-based cellulosic ethanol production system. BioEnergy Res. 2016, 9, 1101–1108. [Google Scholar] [CrossRef]
- Chepil, W.S. Compact rotary sieve and the importance of dry sieving in physical soil analysis. Soil Sci. Soc. Proc. 1962, 26, 4–6. [Google Scholar] [CrossRef]
- Youker, R.; McGuinness, J. A short method of obtaining mean weight-diameter values of aggregate analyses of soils. Soil Sci. 1957, 83, 291–294. [Google Scholar] [CrossRef]
- Merrill, S.D.; Black, A.L.; Fryrear, D.W.; Saleh, A.; Zobeck, T.M.; Halvorson, A.D.; Tanaka, D.L. Soil wind erosion hazard of spring wheat–fallow as affected by long-term climate and tillage. Soil Sci. Soc. Am. J. 1999, 63, 1768–1777. [Google Scholar] [CrossRef]
- Franzluebbers, A.J. Potential C and N mineralization and microbial biomass from intact and increasingly disturbed soils of varying texture. Soil Biol. Biochem. 1999, 31, 1083–1090. [Google Scholar] [CrossRef] [Green Version]
- Adam, G.; Duncan, H. Development of a sensitive and rapid method for the measurement of total microbial activity using fluorescein diacetate (FDA) in a range of soils. Soil Biol. Biochem. 2001, 33, 943–951. [Google Scholar] [CrossRef] [Green Version]
- Schumacher, T.E.; Eynard, A.; Chintala, R. Rapid cost-effective analysis of microbial activity in soils using modified fluorescein diacetate method. Environ. Sci. Pollut. Res. 2015, 22, 4759–4762. [Google Scholar] [CrossRef]
- Moebius-Clune, B.N.; Van Es, H.M.; Idowu, O.J.; Schindelbeck, R.R.; Moebius-Clune, D.J.; Wolfe, D.W.; Abawi, G.S.; Thies, J.E.; Gugino, B.K.; Lucey, R. Long-term effects of harvesting maize stover and tillage on soil quality. Soil Sci. Soc. Am. J. 2008, 72, 960–969. [Google Scholar] [CrossRef]
- McDaniel, M.D.; Tiemann, L.K.; Grandy, A.S. Does agricultural crop diversity enhance soil microbial biomass and organic matter dynamics? A meta-analysis. Ecol. Appl. 2014, 24, 560–570. [Google Scholar] [CrossRef] [PubMed] [Green Version]
- Bullock, D.G. Crop rotation. Crit. Rev. Plant Sci. 1992, 11, 309–326. [Google Scholar] [CrossRef]
- Benitez, M.-S.; Osborne, S.L.; Lehman, R.M. Previous crop and rotation history effects on maize seedling health and associated rhizosphere microbiome. Sci. Rep. 2017, 7, 15709. [Google Scholar] [CrossRef] [PubMed]
- Meisner, M.H.; Rosenheim, J.A. Ecoinformatics reveals effects of crop rotational histories on cotton yield. PLoS ONE 2014, 9, e85710. [Google Scholar] [CrossRef]
- Anderson, R.L. Are some crops synergistic to following crops? Agron. J. 2005, 97, 7–10. [Google Scholar]
- Kirkegaard, J.A.; Ryan, M.H. Magnitude and mechanisms of persistent crop sequence effects on wheat. Field Crop Res. 2014, 164, 154–165. [Google Scholar] [CrossRef]
- Franzluebbers, A.J. Should soil testing services measure soil biological activity? Agric. Environ. Lett. 2016, 1. [Google Scholar] [CrossRef]
- Franzluebbers, A.J.; Stuedemann, J.A. Early response of soil organic fractions to tillage and integrated crop–livestock production. Soil Sci. Soc. Am. J. 2008, 72, 613–625. [Google Scholar] [CrossRef]
- Lupwayi, N.Z.; Lafond, G.P.; May, W.E.; Holzapfel, C.B.; Lemke, R.L. Intensification of field pea production: Impact on soil microbiology. Agron. J. 2012, 104, 1189–1196. [Google Scholar] [CrossRef]
- Schnurer, J.; Rosswall, T. Fluorescein diacetate hydrolysis as a measure of total microbial activity in soil and litter. Appl. Environ. Microbiol. 1982, 43, 1256–1261. [Google Scholar]
- Janvier, C.; Villeneuve, F.; Alabouvette, C.; Edel-Hermann, V.; Mateille, T.; Steinberg, C. Soil health through soil disease suppression: Which strategy from descriptors to indicators? Soil Biol. Biochem. 2007, 39, 1–23. [Google Scholar] [CrossRef]
- Mendes, I.C.; Bandick, A.K.; Dick, R.P.; Bottomley, P.J. Microbial biomass and activities in soil aggregates affected by winter cover crops. Soil Sci. Soc. Am. J. 1999, 63, 873–881. [Google Scholar] [CrossRef]
- Karlen, D.L.; Wollenhaupt, N.C.; Erbach, D.C.; Berry, E.C.; Swan, J.B.; Eash, N.S.; Jordahl, J.L. Crop residue effects on soil quality following 10-years of no-till corn. Soil Tillage Res. 1994, 31, 149–167. [Google Scholar] [CrossRef]
- Watt, M.; Kirkegaard, J.; Passioura, J. Rhizosphere biology and crop productivity—A review. Soil Res. 2006, 44, 299–317. [Google Scholar] [CrossRef]
Figure 1.
Mean weight diameter in the 0–5 cm depth interval; values are means (n = 4) for each crop rotation treatment expressed a percentage of the mean for the default corn–soybean rotation according to crop phase. CS, corn–soybean; COWwS, corn–oat–winter wheat–soybean; CPWwS, corn–field pea–winter wheat–soybean; CSSwP, corn–soybean–spring wheat–field pea; CSSwSf, corn–soybean–spring wheat–sunflower. Values marked with the same letter within the aggregate group are not different at α = 0.05, Tukey’s test.

Figure 2.
Erodible fraction of soil and the mass fraction of soil < 0.84 mm, in the 0–5 cm depth interval; values are means (n = 4) for each crop rotation treatment expressed a percentage of the mean for the default corn–soybean rotation according to crop phase. CS, Corn–soybean; COWwS, corn–oat–winter wheat–soybean; CPWwS, corn–field pea–winter wheat–soybean; CSSwP, corn–soybean–spring wheat–field pea; CSSwSf, corn–soybean–spring wheat–sunflower. Values marked with the same letter within the aggregate group are not different at α = 0.05, Tukey’s test.

Figure 3.
Short-term C mineralization in the 0–5 cm depth interval; values are means (n = 4) for each crop rotation treatment expressed a percentage of the mean for the default corn–soybean rotation according to crop phase. CS, corn–soybean; COWwS, corn–oat–winter wheat–soybean; CPWwS, corn–field pea–winter wheat–soybean; CSSwP, corn–soybean–spring wheat–field pea; CSSwSf, corn–soybean–spring wheat–sunflower. Values marked with the same letter within the aggregate group are not different at α = 0.05, Tukey’s test.

Figure 4.
Mean weight diameter of soil aggregates in the 0–5 cm depth interval; values are means (n = 3) for each treatment expressed a percentage of the mean for the default management treatment with corn residue removal and no cover crop. (A) Corn phase. (B) Soybean phase. Values marked with the same letter within the aggregate group are not different at α = 0.10, Tukey’s test. Values in this graph are calculated from selected data published in [24] and presented with revised statistics for the selected data.
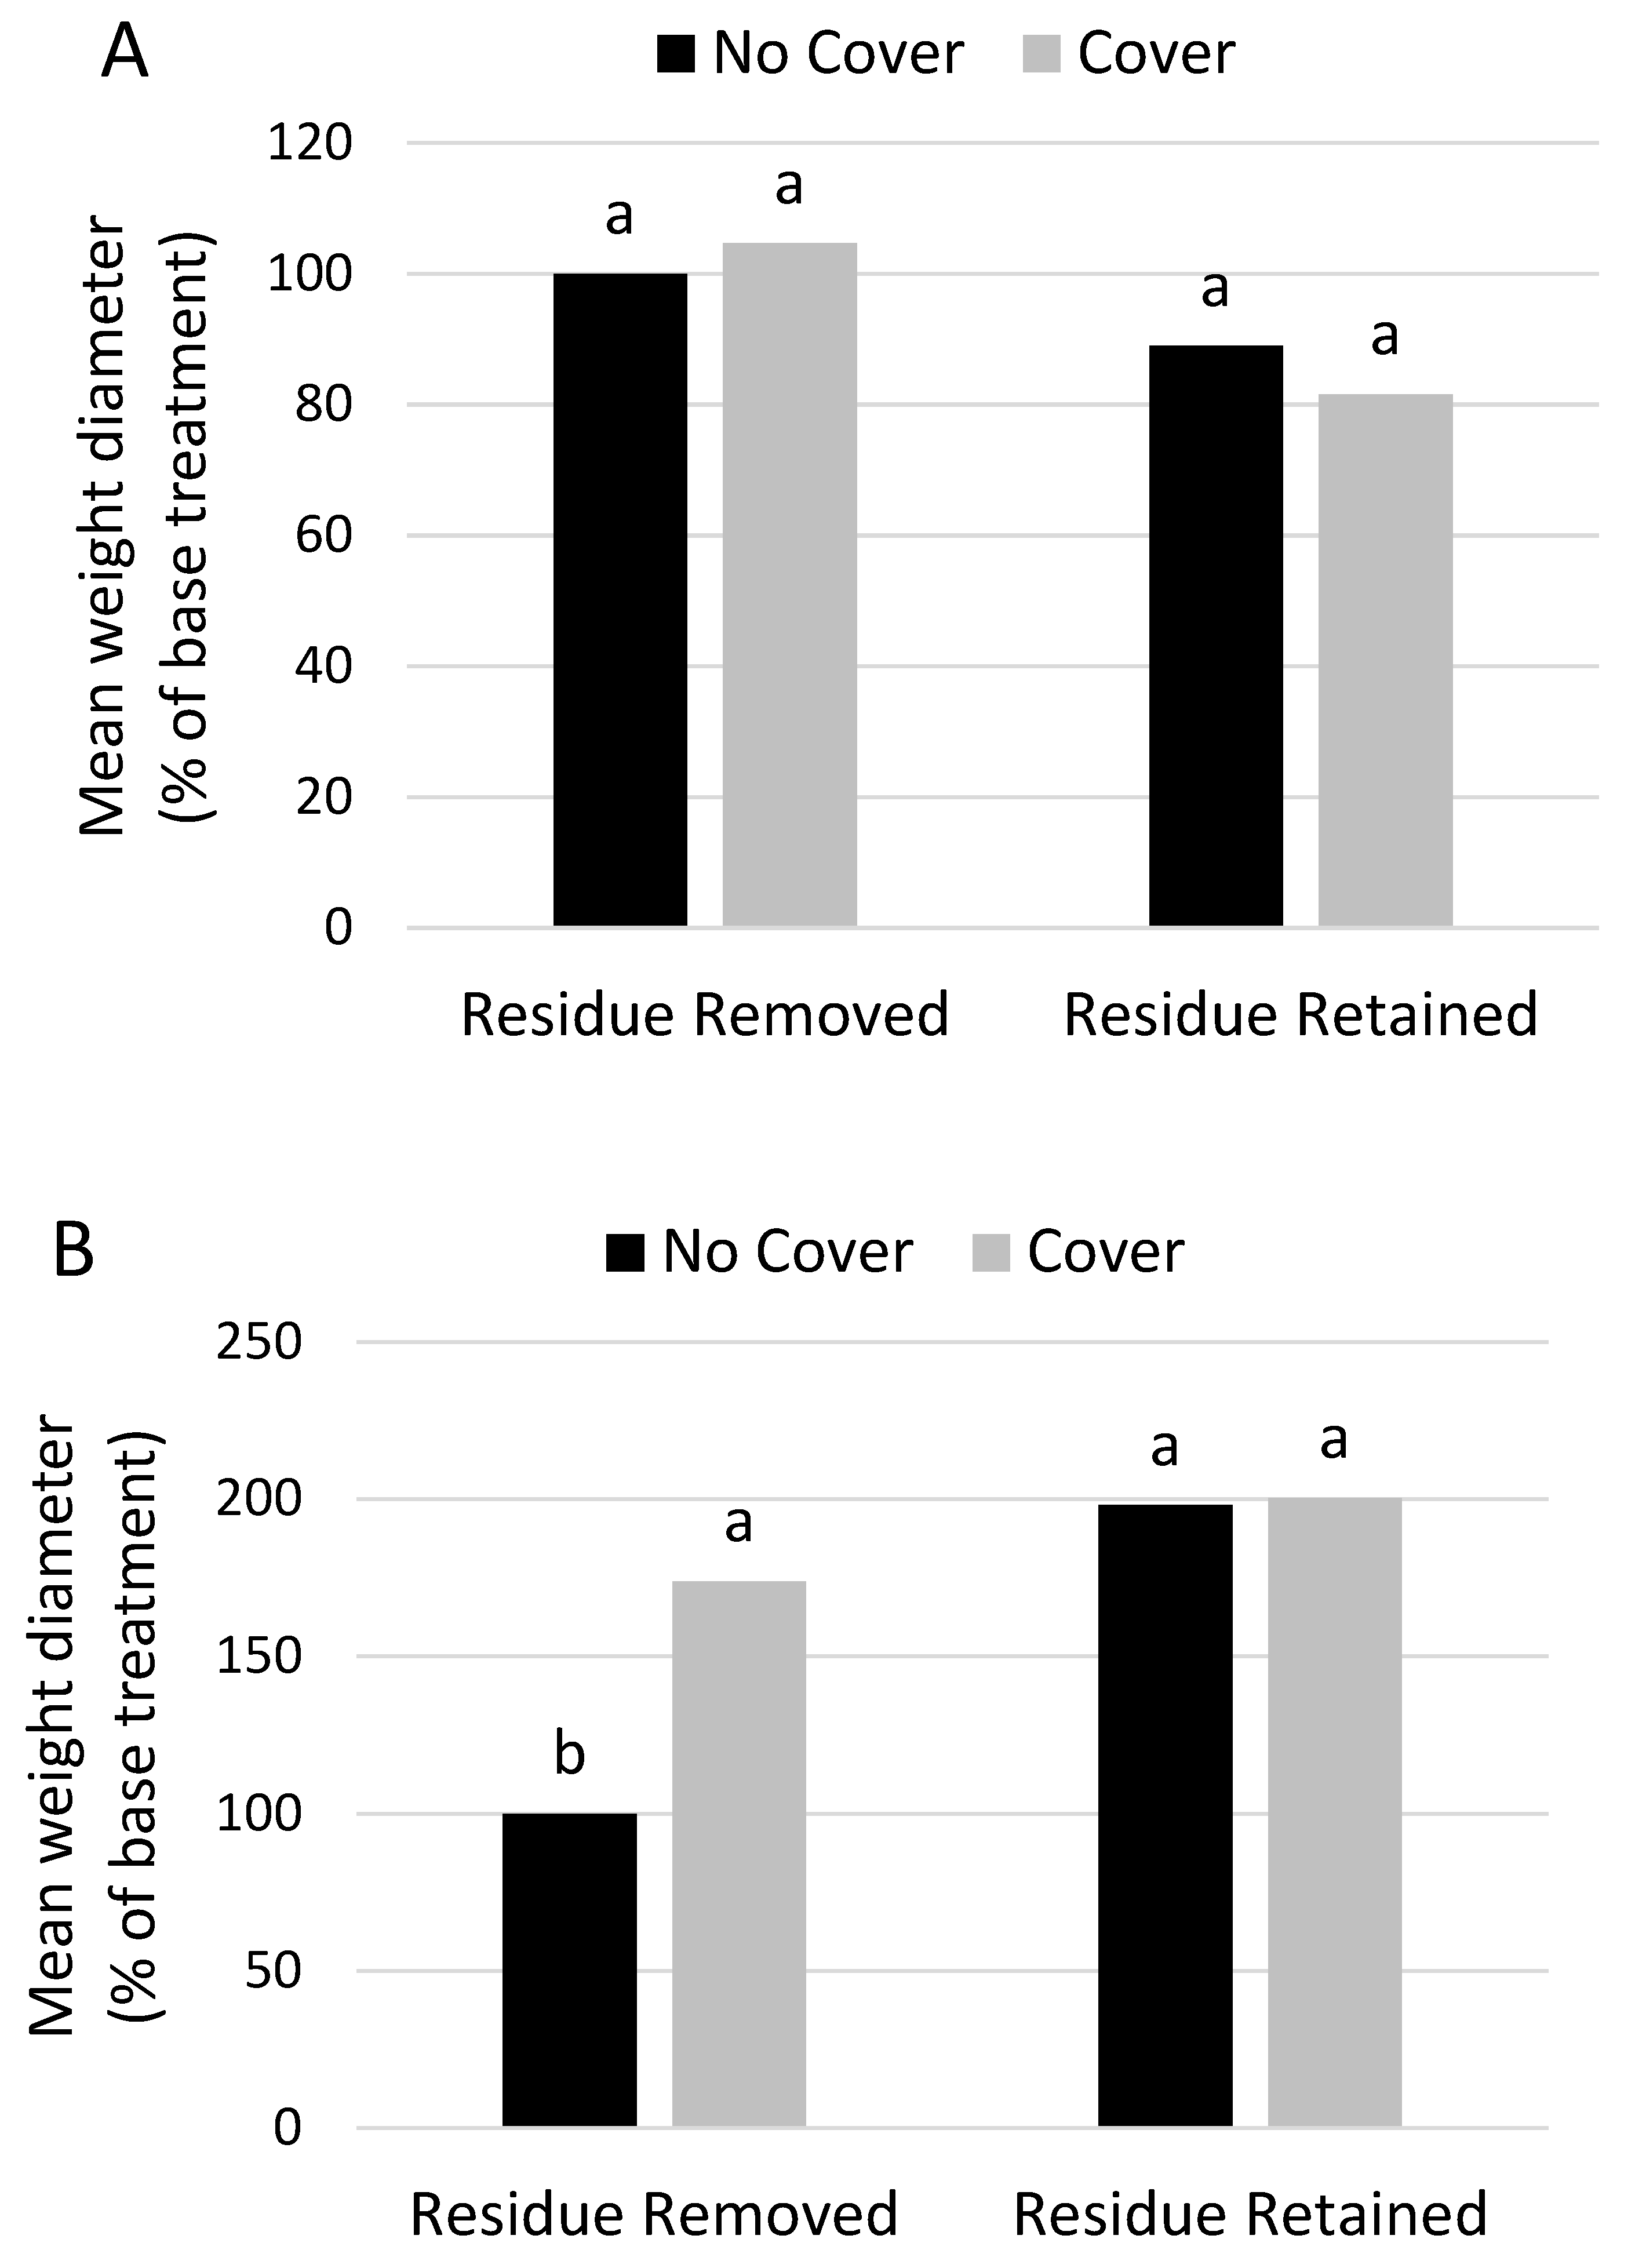
Figure 5.
Erodible fraction of the soil in the 0–5 cm depth interval; values are means (n = 3) for each treatment expressed as percentages of the mean for the default management treatment with corn residue removal and no cover crop. (A) Corn phase. (B) Soybean phase. Values marked with the same letter within the aggregate group are not different at α = 0.10, Tukey’s test. Values in this graph are calculated from selected data published in [24] and presented with revised statistics for the selected data.

Figure 6.
Microbial activity measured by fluorescein diacetate (FDA) hydrolysis in the 0–5 cm depth interval values are means (n = 3) for each treatment expressed as percentages of the mean for the default management treatment with corn residue removal and no cover crop. (A) Corn phase. (B) Soybean phase. Values marked with the same letter within the aggregate group are not different at α = 0.10, Tukey’s test. Values in this graph are calculated from selected data published in [24] and presented with revised statistics for the selected data.

Table 1.
Field study 2; probability (Pr < f) of main effects and interactions of cover and residue management treatments on soil properties.
Table 1.
Field study 2; probability (Pr < f) of main effects and interactions of cover and residue management treatments on soil properties.
| Factor | Aggregate Mean Weight Diameter | Erodible Fraction | FDA a Hydrolysis | |||
|---|---|---|---|---|---|---|
| Corn | Soybean | Corn | Soybean | Corn | Soybean | |
| Cover Crop | 0.784 | 0.084 | 0.117 | 0.032 | 0.153 | 0.028 |
| Residue | 0.167 | 0.034 | 0.715 | 0.006 | 0.821 | 0.024 |
| Cover Crop×Residue | 0.282 | 0.093 | 0.481 | 0.038 | 0.168 | 0.069 |
a FDA is fluorescein diacetate.
© 2019 by the authors. Licensee MDPI, Basel, Switzerland. This article is an open access article distributed under the terms and conditions of the Creative Commons Attribution (CC BY) license (http://creativecommons.org/licenses/by/4.0/).
Share and Cite
MDPI and ACS Style
Lehman, R.M.; Osborne, S.L.; McGraw, K. Stacking Agricultural Management Tactics to Promote Improvements in Soil Structure and Microbial Activities. Agronomy 2019, 9, 539. https://doi.org/10.3390/agronomy9090539
AMA Style
Lehman RM, Osborne SL, McGraw K. Stacking Agricultural Management Tactics to Promote Improvements in Soil Structure and Microbial Activities. Agronomy. 2019; 9(9):539. https://doi.org/10.3390/agronomy9090539
Chicago/Turabian StyleLehman, R. Michael, Shannon L. Osborne, and Kimberly McGraw. 2019. "Stacking Agricultural Management Tactics to Promote Improvements in Soil Structure and Microbial Activities" Agronomy 9, no. 9: 539. https://doi.org/10.3390/agronomy9090539
Note that from the first issue of 2016, this journal uses article numbers instead of page numbers. See further details here.