Article

Response of Microbial Activities in Soil to Various Organic and Mineral Amendments as an Indicator of Soil Quality

1
Department of Agrosystems and Bioclimatology, Faculty of AgriSciences, Mendel University in Brno, Zemědělská 1, 613 00 Brno, Czech Republic
2
Agricultural Research, Ltd., Zahradní 1, 664 41 Troubsko, Czech Republic
3
Department of Microbiology, Faculty of Biotechnology and Food Sciences, Slovak University of Agriculture in Nitra, Tr. A. Hlinku 2, 949 76 Nitra, Slovakia
4
Department of Environmental Studies and Natural Resources, Faculty of Regional Development and International Studies, Mendel University in Brno, Zemědělská 1, 613 00 Brno, Czech Republic
*
Author to whom correspondence should be addressed.
Agronomy 2019, 9(9), 485; https://doi.org/10.3390/agronomy9090485
Submission received: 30 July 2019 / Revised: 19 August 2019 / Accepted: 22 August 2019 / Published: 27 August 2019
(This article belongs to the Special Issue Soil Health in Agroecosystems)

Abstract

:
The presented paper deals with the analysis of potential differences between organic waste compost (CBD), vermicompost (CVER) and mineral fertilizer (MF; 27% of N) applications affecting the quality of arable soil by influencing microbial activity therein. The selected types of compost represent alternatives to conventional organic fertilizers, which are, however, not available to Czech and Slovak farmers in sufficient amounts. Their mutual comparison and the comparison with organic fertilizers aim to provide farmers further information about their influence on arable land and thus to give them the possibility of deciding on the most suitable amendments. To demonstrate the effect of these amendments, six variants were prepared: one without the addition of fertilizers; two variants with the addition of 40 Mg/ha of CVER and CBD; one variant with the addition of double dosed CVER (80 Mg/ha), and the remaining two variants were fertilized only with MF (0.22 Mg/ha) and with the combination of CVER (0.20 Mg/ha) and MF (0.11 Mg/ha). Substrate induced respiration (SIR), basal respiration (BS), microbial carbon (Cmic) and enzymatic activities (hydrolysis of fluorescein diacetate—FDA, dehydrogenase activity—DHA, and phosphatase activity—PA) were used to evaluate the effect of CBD, CVER and MF application on the soil quality. Both organic and mineral amendments affected BS and SIR. The highest BS and SIR rates were found in variants with compost application (CVER and CBD). All variants treated with the mineral fertilizer showed the lowest level of enzyme activities; lower by about 30% in comparison with variants where CVER, CBD and the combination of MF and CVER were applied. We found insignificant differences between the individual types of compost. More importantly, we compared the situation at the beginning of the experiment and after its end. It was found that the application of mineral fertilizers automatically led to the deterioration of all enzymatic parameters, on average by more than 25%, as compared with the situation at the beginning of the experiment. However, when the mineral fertilizer dose was supplemented with organic amendments (CVER), this negative effect was eliminated or significantly reduced. Furthermore, both composts (CVER and CBD) positively affected plant biomass production, which reached a level of production enhanced by the MF. Results clearly showed that the application of both compost types could be used to improve soil quality in agriculture.

Graphical Abstract

1. Introduction

Modern agriculture has to face new phenomena, such as climate change, erosion, loss of nutrients from the soil sorption complex, contamination by pollutants, protection of drinking water sources, or depletion of soil fertility. Arable land represents an unnatural system that is constantly disrupted by human activities [1,2,3]. The main difference between farmland and soil in the natural ecosystem lies in their way of coping with possible external impacts, for example with the climate change. In contrast with agricultural system, the resilience of natural ecosystems is maintained by the fact that all resources of organic matter remain in them. On the other hand, resilience of farmland depends on management methods and on the sufficient supply of organic matter in particular. The most significant aspects include regular application of organic fertilizers such as plant residues, microorganisms, root exudates, etc. [4,5,6] and varied crop rotations [1,2].
Soil organic matter (SOM) and texture are important factors affecting the rate of carbon and nitrogen mineralization in soils under conditions of variable temperature and water content and hence soil fertility – availability of nutrients in the rhizosphere soil [7]. Moreover, SOM quantity and quality is important in relation to soil fertility, soil health and quality, and SOM has therefore a direct effect on the level of farmland resistance to the above-mentioned negative phenomena [8]. Generally, there are several possibilities to improve the content of SOM in the soil, and thus to reduce the risk of soil degradation. One of basic possibilities is the application of organic matter originating as a by-product, i.e., organic municipal waste, crop residues after harvest, organic waste from biogas plants such as digestate, etc. [9]. This category includes, for example, composts [10,11,12]. The above organic substances or fertilizers are very often used in modern agriculture [11,13]. Basic types of compost used to improve soil fertility (such as those used in the European Union, China, etc.) include organic waste compost and vermicompost [14,15,16].
Soil health is a capacity of soil to maintain a vital living system within ecosystems and land-use boundaries, to sustain plant and animal productivity, to maintain or enhance water and air quality, and to promote plant and animal health [17]. The state of soil environment can be monitored using selected indicators. De la Rosa and Sobral [18] claimed that critical limits of soil quality indicators are threshold values, which must be adhered to for the normal functioning of the soil system [19]. Within this critical range, the soil performs its specific functions in natural ecosystems. As reported by Benintende et al. [19], Stone et al. [20] and Mbuthia et al. [21], biological variables can be used as soil quality and health indicators. Soil respiration and enzymatic activities, particularly hydrolase activities, involved in organic matter turnover, hence in nutrient cycles and plant nutrition, are used by soil scientists to investigate the effects of different soil management strategies and agricultural practices including organic amendments on the soil quality and health [22,23,24].
The aim of the presented research was to evaluate the effect of two types of organic fertilizers and one type of mineral fertilizer: organic waste compost, vermicompost and mineral fertilizer (calcium ammonium nitrate N27) as amendments enhancing soil quality. Another goal was to provide information to farmers and public about the potential influence of these composts on arable land not only from the viewpoint of soil fertility but also soil quality. We are convinced that these composts represent a potential alternative to conventional organic fertilizers. Changes in the quality of arable soil were evaluated by using (micro)-biological parameters.

2. Materials and Methods

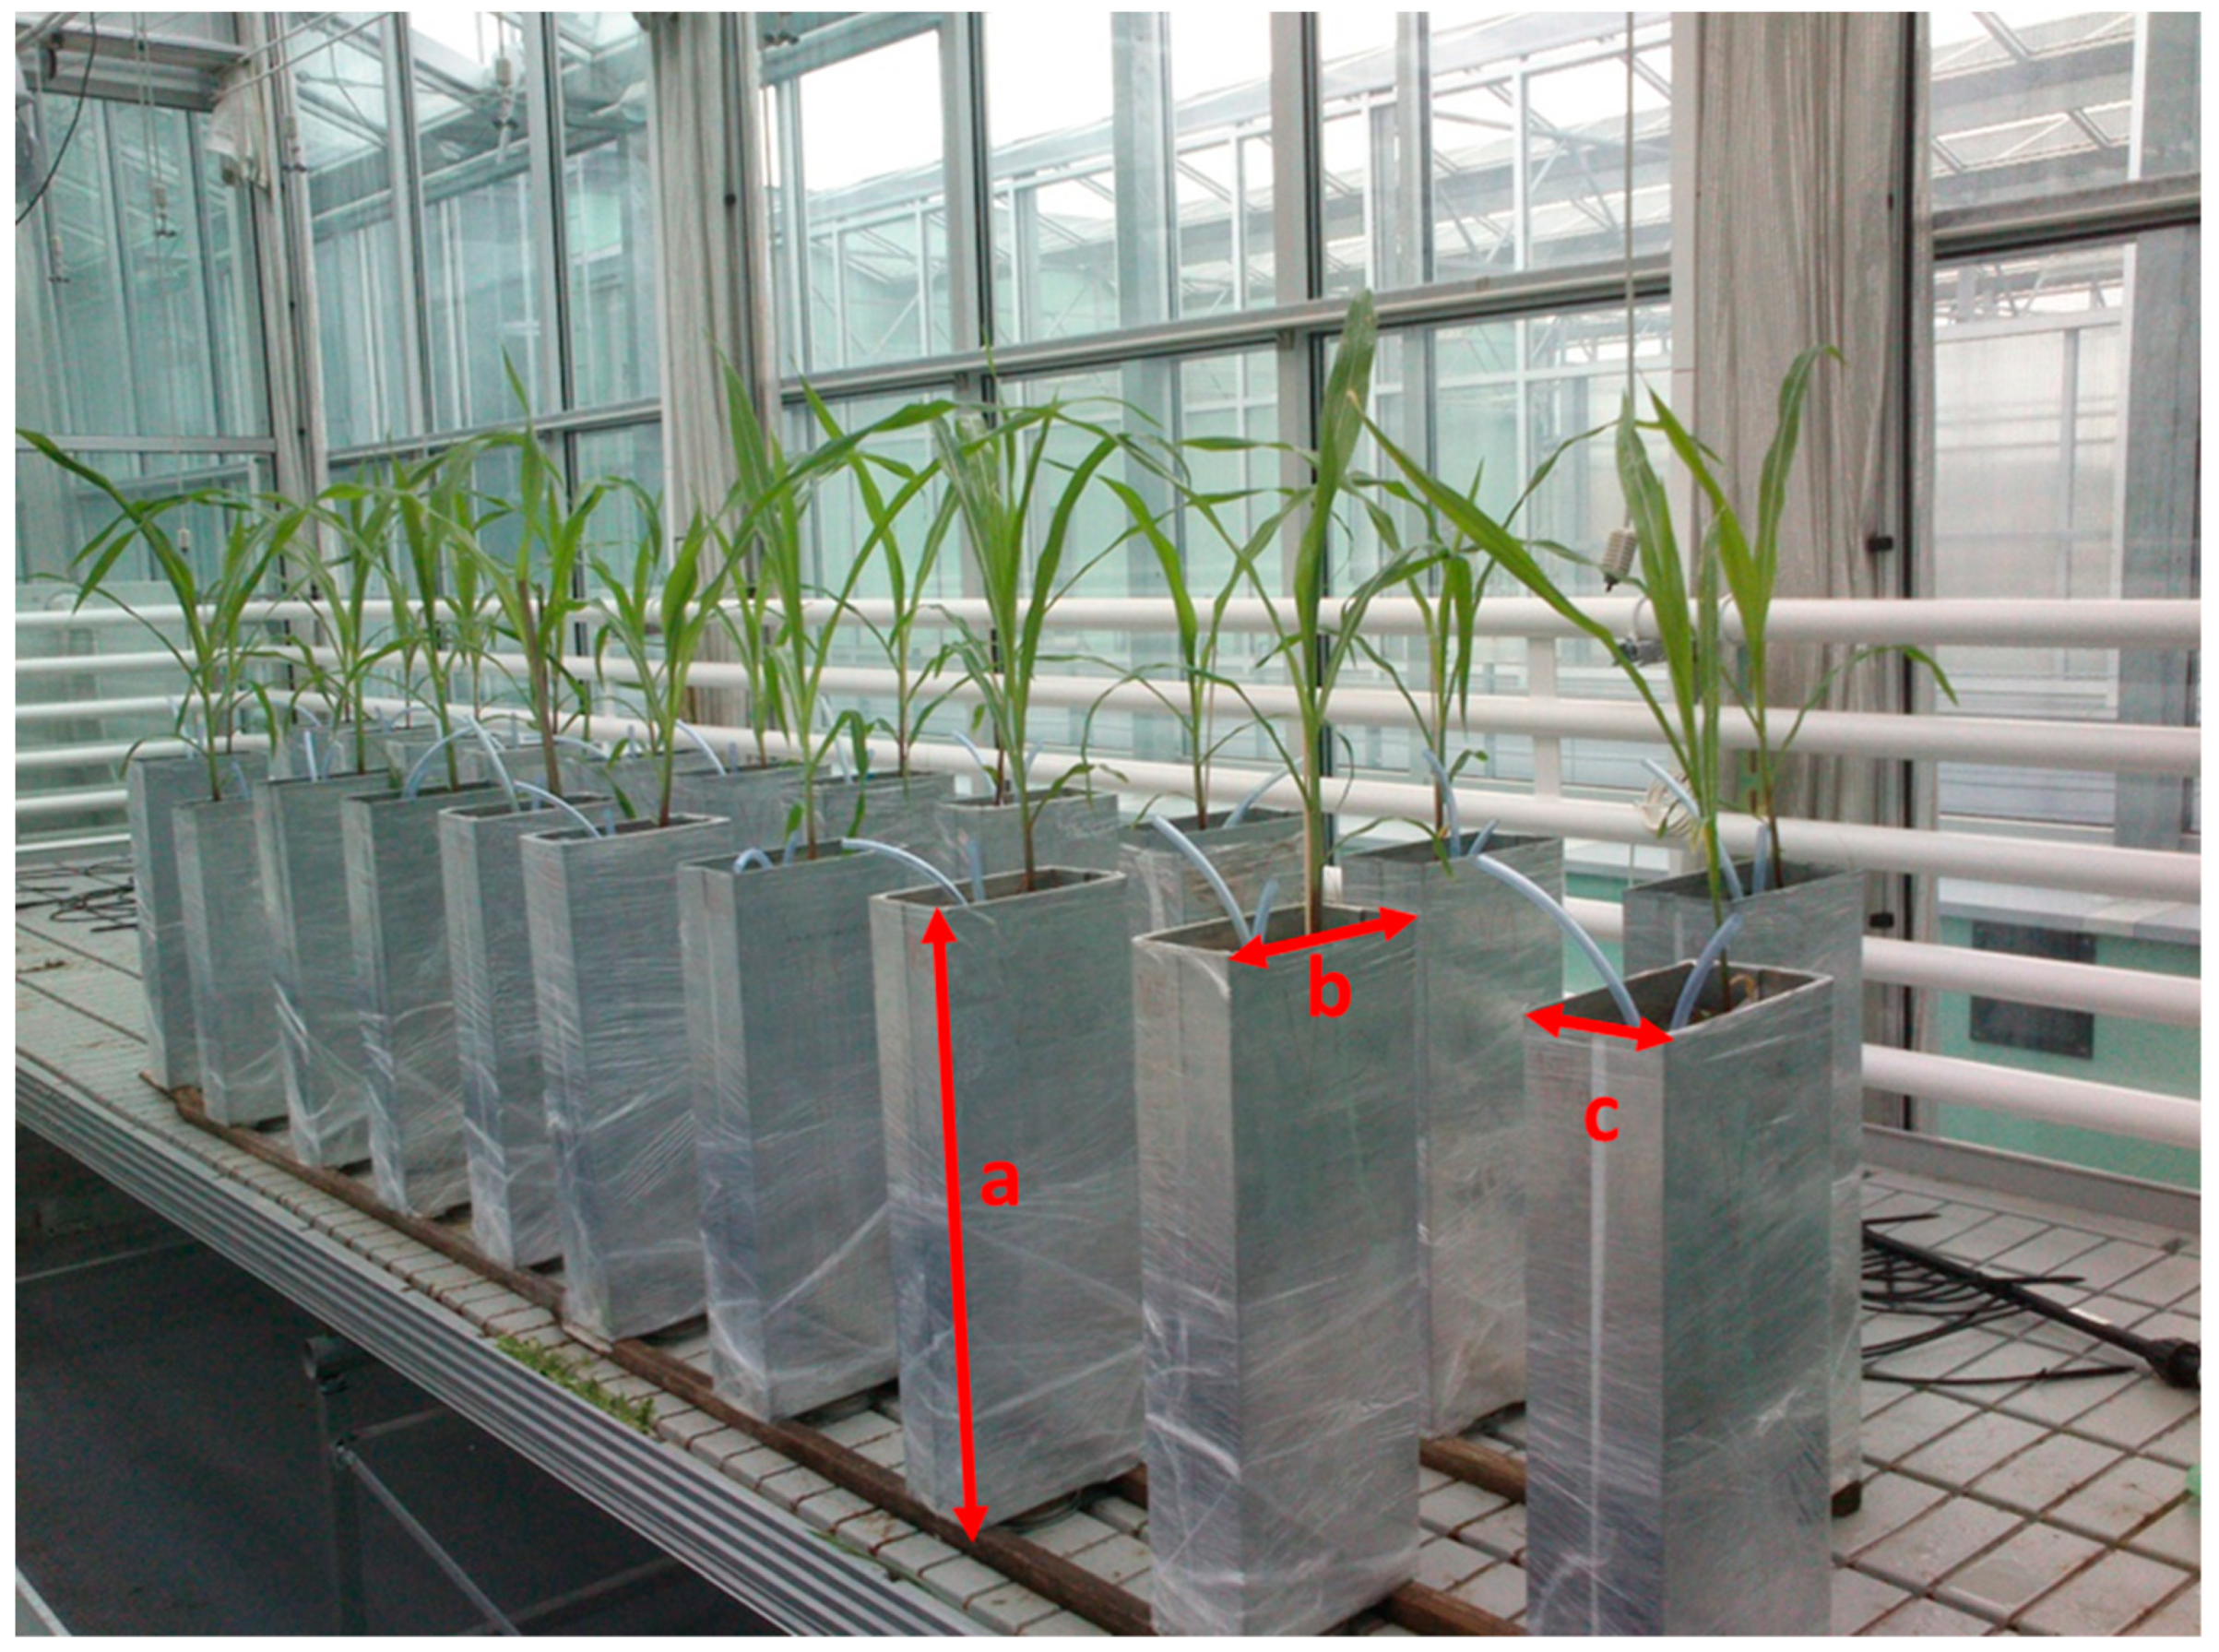
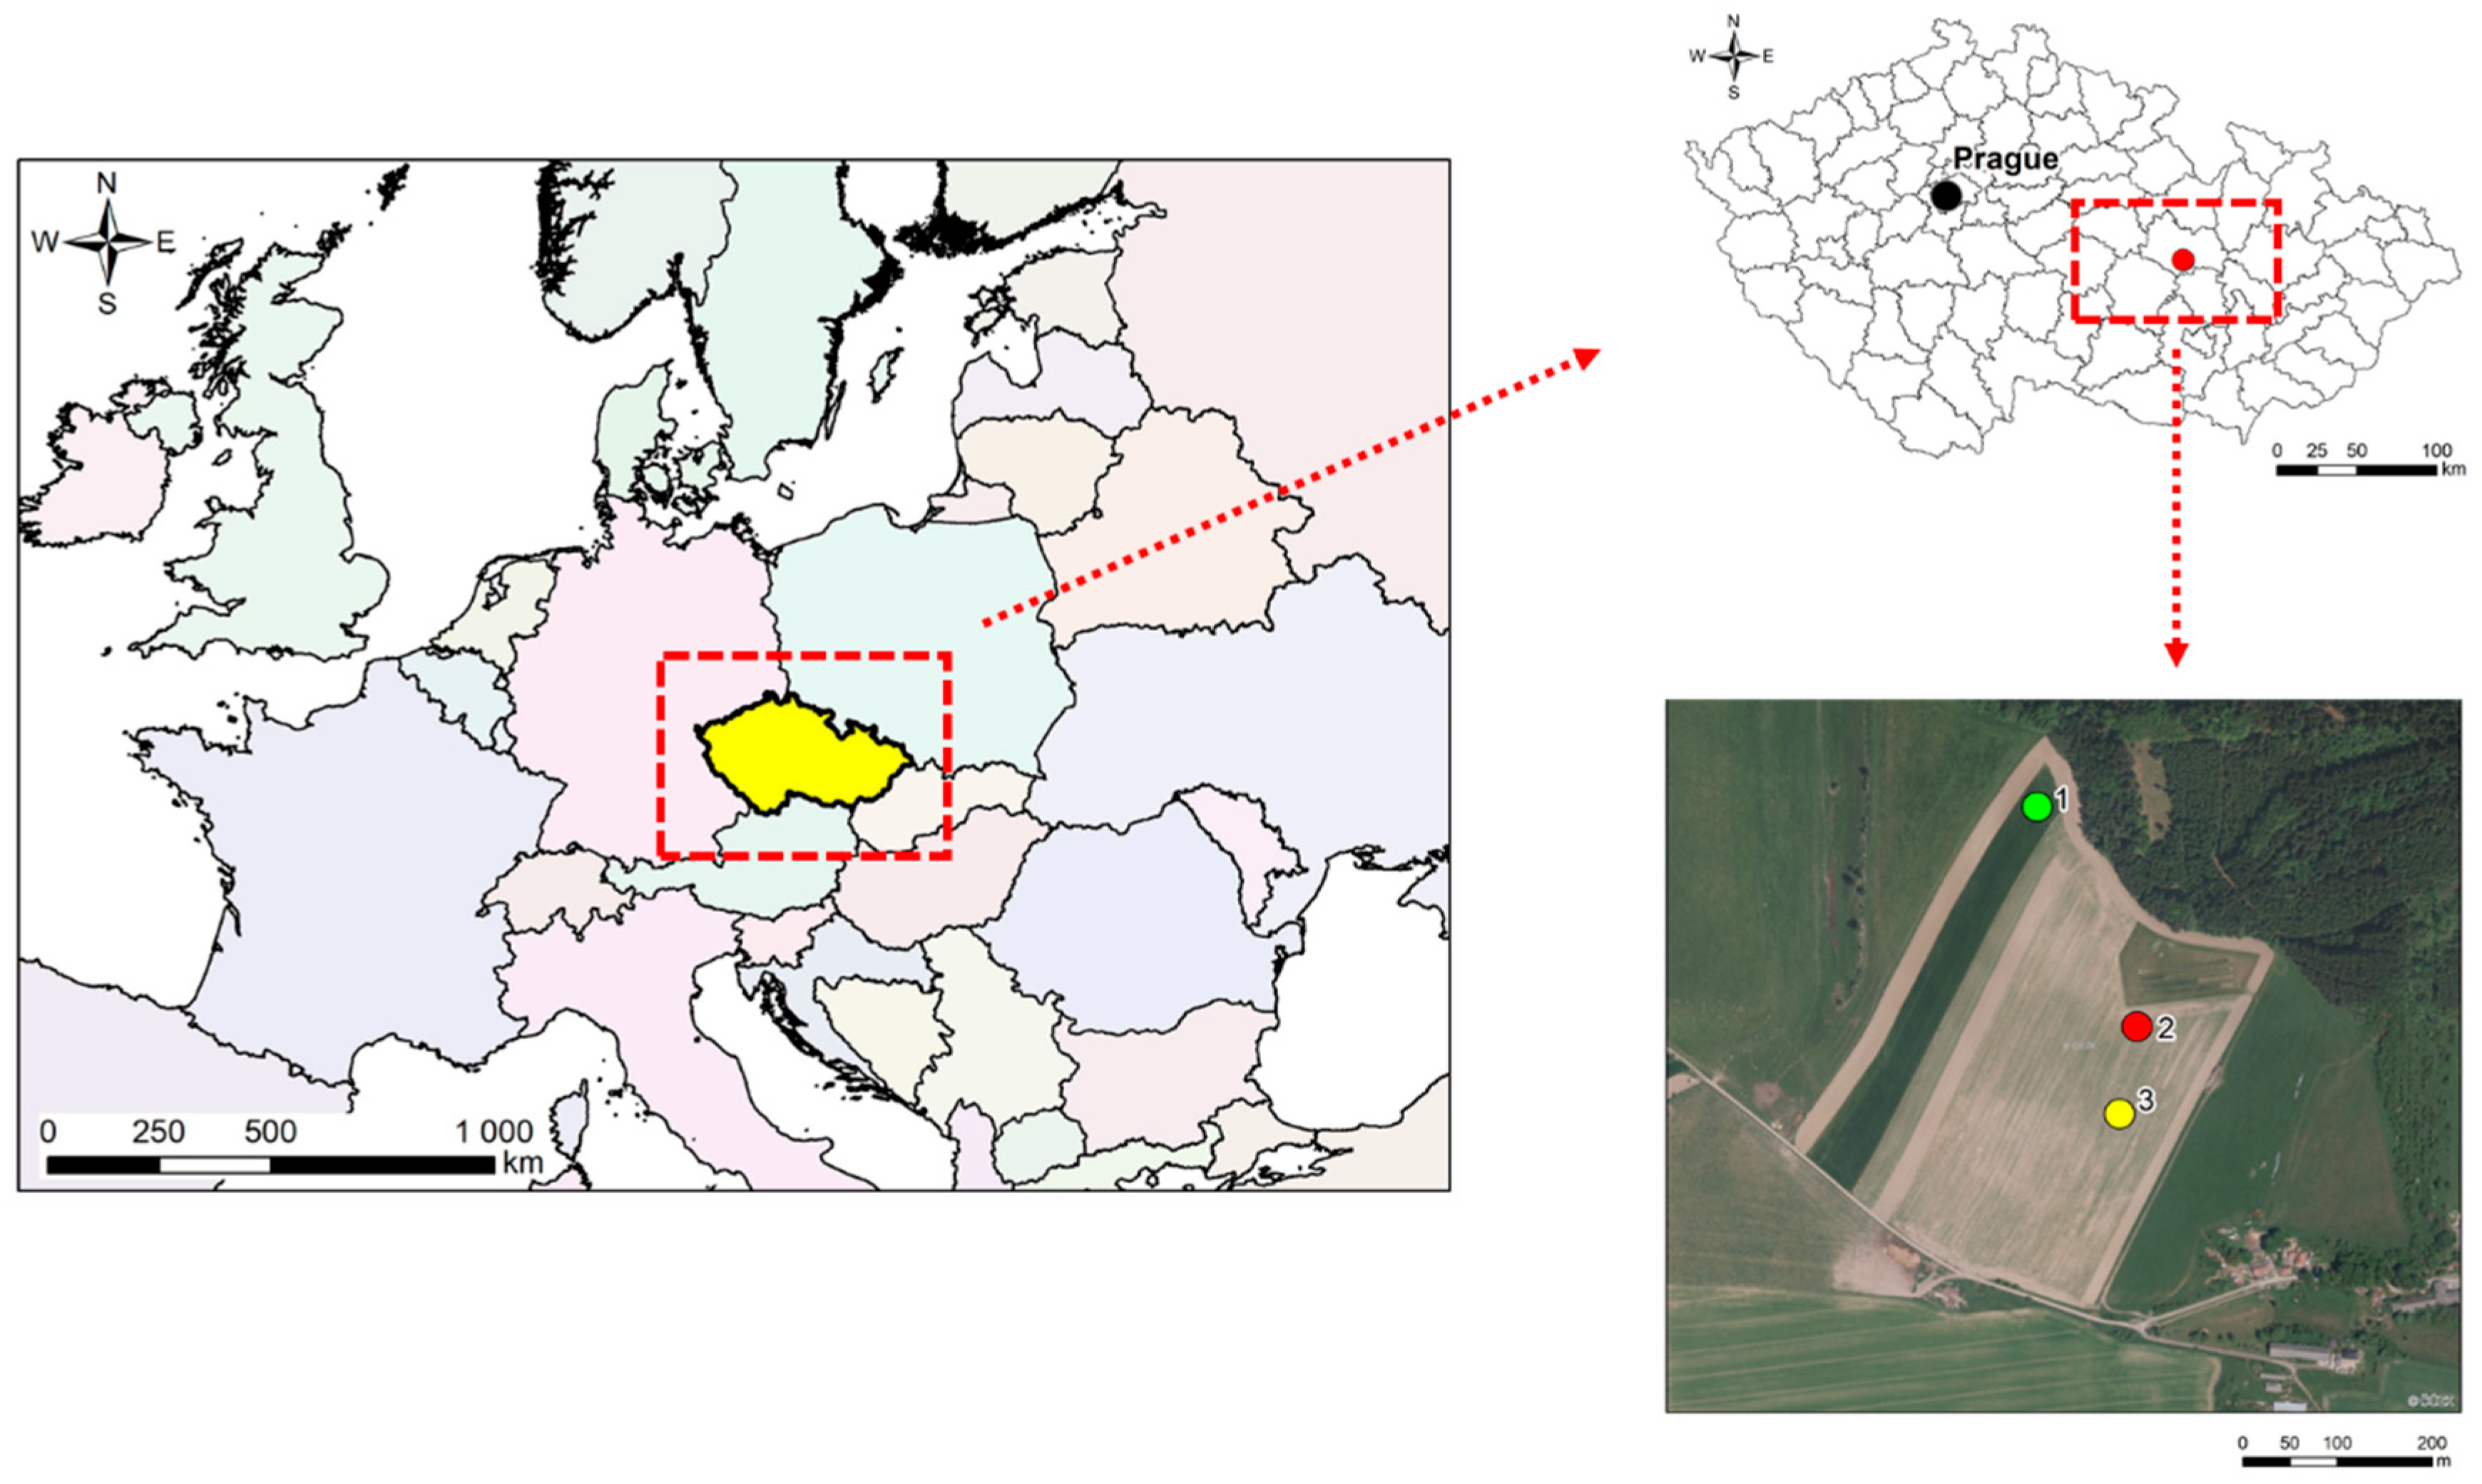
2.1. Experiment Design

The above-described goals of work and hypotheses were tested in a pot experiment lasting 95 days. Eighteen metal blocks were used as experimental containers and placed in a greenhouse. Each experimental container had the same following properties: (a) height = 550 mm; (b) width = 200 mm; (c) thickness = 100 mm (Appendix A). Each container was filled with the same amount of soil, i.e., 14.6 kg. The sampling of used soil was carried out on June 5, 2014 in the protection zone of underground drinking water source in Březová nad Svitavou. Soil sampling was realized according to ČSN ISO 10 381-6 (Czech Technical Standard and International Standards for soil sampling) on three plots (soil type: fluvisol; soil subtype: modal) in the cadastral area of the municipality “Banín” (Figure 1). Soil samples were taken from six soil probes (two per one plot). Each probe was of square ground plan (a = 800 mm) and its depth was approximately 300 mm according to the thickness of the topsoil layer. Soil was sampled only from the top soil layer. Information about the area of our interest: Banín is situated in the protective zone of underground source of drinking water in Březová nad Svitavou (Czech Republic). Annual mean (1962–2012) precipitation amounts are 588.47 mm and mean annual air temperature is 7.9 °C. The location was selected as there is an important source of drinking water for more than 500,000 people. There is also intensive farming using the application of soil amendments of organic origin in order to improve soil properties, which also affects infiltrated water quality. The soil samples were homogenized and sieved (grid size of 10 mm). Experimental containers were assembled after 20 days of soil sample pre-incubation.
The pot experiment was conducted from June 27, 2014 to September 30, 2014 (95 days); all containers were planted with one indicator plant: Zea mays L. The medium late variety of Zea mays L., ASTER CS, FAO 240 was used. This variety is intended for biogas production and is commonly used in the Czech Republic. The experiment was carried out in greenhouses (Appendix A; Figure A1) under the following conditions: (a) 26 °C (day temperature); (b) 20 °C (night temperature); (c) 65% humidity (24h); d) day length 11 h (light intensity 3 000 lx), day period starting at 8:00 a.m. and ending at 7:00 p.m., night period was from 7:00 p.m. to 8:00 a.m. Soil water content was maintained at 70% of soil Water Holding Capacity (WHC) in all variants. WHC was determined for the top soil according to Dykyjová [25] as a capacity of soil samples (100 g) to soak up a certain amount of water for 2 h and then drain for 2 h. After that time, the soil sample was weighed and this value represented the weight of soil sample achieving “100%” WHC. The value of WHC was converted to the amount of topsoil. After having filled and achieved the required values of WHC (70%), the experimental containers were weighed. Subsequently, the measured weight was maintained throughout the experiment by irrigation (distilled water).
Six treatments of the experiment with or without the addition of different fertilizers were prepared (Table 1). The following fertilizers were used for the establishment of the experiment: (a) organic waste compost (CBD), which is registered for agricultural use in the Czech Republic as “Black Dragon”; (b) non-registered vermicompost (CVER); (c) mineral fertilizer LAD 27 (MF; Calcium ammonium nitrate 27 % N). All fertilizers were incorporated into the top soil layer before sowing the indicator crop. In the Czech Republic, the recommended dose of compost is 5 kg/m2 (50 Mg/ha) per 5 years and ha according to ČSN EN 46 5735 – Czech Technical Standard and European Norm for industrial composts. Consequently, the used compost dose of 4 kg per m2 (=40 Mg/ha) is in accordance with ČSN EN 46 5735.
Vermicompost (fermented for one year) was made of compost mixed of cattle manure (30%), sheep manure (25%), straw (10%), mixtures of grass, leaves and lop (25%), and earth (10%). After the fermentation, earthworms (Eisenia foetida) were added to the vermicompost and left there for four months. Mechanical aeration was used to prepare the compost made of organic waste (CBD) using the composting process in outdoor piles. Aerobic composting was provided by the composting plant in Brno – Černovice (Czech Republic; European Union). The maturation of CBD took three months.

2.2. Analysis of Arable Ssoil and Composts

The ion-selective electrode was used to determine the potential pH value after the extraction of samples in 0.01 M CaCl2 complying with ISO 10 390:2005 [26]. The content of Ntot was determined in the soil and compost samples according to Bremner et al. [27] using the LECO CNS 2000 (St. Joseph, MI, USA) automatic analyzer.
The oxidometrical (modified Tjurin’s) method was used for the detection of Cox according to Filcheva and Tsadilas et al. [28]. Moreover, the soil and compost samples were analyzed for mineral N (Ninorg—consists of NH4+-N and NO3-N) contents. Ninorg was extracted with 2 M KCl using the method by Bundy and Meisinger et al. [29] and the concentration of Ninorg in extracts was determined by using the distillation-titration method [30]. Table 2 summarizes the results of chemical properties of the soils and organic compounds used for the establishment of the laboratory experiment.

2.3. Measurement of Basal and Substrate Induced Respiration

After the end of the experiment, soil samples were taken from each variant and placed in sterile plastic bags. Prior to the determination of soil respiration, the samples were pre-incubated for 28 days at 4 °C. Soil respiration was determined according to Šimek et al. [31]: Basal respiration (BS) was assessed in 15 g of field-moist soil sample by using serum bottles secured with butyl rubber stoppers. The bottles were incubated for 24 hours at 25 °C. A 0.5 mL sample of internal atmosphere was analyzed by using gas chromatography (Agilent Technologies 7890A GC System equipped with the thermal conductivity detector) after 3 hours and at the end of the incubation period. BS was determined from CO2 production within 21 hours. The technique of filling water was used to measure the total headspace volume in each bottle. Results were adjusted to gas in liquids and given per gram of dry soil and hour. Substrate induced respiration (SIR) was analyzed by determining the produced CO2 using the procedure of glucose addition and incubation for 4 hours. Five grams of field-moist soil together with 2 mL of glucose solution (4 mg C·g−1 of dry soil) were put into bottles; this was replicated three times. The bottles were secured with stoppers and incubated for 4 hours at 25 °C and the 0.5 cm3 sample of internal atmosphere was analyzed by gas chromatography in the second and fourth hour of incubation. Analysis of enzymatic activities and content of carbon in microbial biomass

2.4. Determination of Enzymatic Activities and Content of Microbial Carbon

Three enzymatic activities (dehydrogenase activity, phosphatase activity and hydrolysis of fluorescein diacetate) in the soil samples were determined at the start (immediately after the addition of fertilizers) and at the end of the experiment after 95 days of experiment duration. The procedure of soil sampling was similar to that used for determining respiration. Dehydrogenase activity (DHA) was determined using the assay by Casida et al. [32] as a reduction of triphenyltetrazolium chloride (TTC) to triphenylformazan (TPF). Three grams of field-moist soil were placed into 16 mL–test tubes, and 1 mL TTC was added followed by 2.5 mL distilled water; the suspension was incubated for 24 hours at 37 °C. Then 50 mL methanol were added for the extraction of TPF reflecting in red coloration. Finally, the suspension was filtrated, and the intensity of reddish color was measured with the spectrophotometer at a wave-length of 485 nm using methanol as a blank. The concentration of TPF was calculated according to the calibration curve and expressed as µg TPF per 1 g dry soil matter.
Total microbial activity in the soils was measured by monitoring the hydrolysis of fluorescein diacetate (FDA), as described by Green et al. [33]. Briefly, 1 g of soil was incubated in a 250 mL–Erlenmayer flask containing 50 mL of 60 mM Na-phosphate solution (buffered at pH 7.6). The reaction was started by adding 0.5 mL of FDA solution (2 mg·mL−1) and incubated for 3 h in the shaker incubator at 37 °C and 200 rpm. After the removal of the soil by centrifugation and filtration, FDA was measured with the spectrophotometer at a wave-length of 490 nm. The samples were analyzed in triplicate. The concentration of released fluorescein was calculated by reference to a standard curve prepared from the fluorescein standards.
Phosphatase activity (PA) was determined using the assay by Tabatabai and Bremner et al. [34]. The field-moist soil (0.5 g) was incubated at 37 °C for 1 h in a 50 mL–Erlenmayer flask containing 0.2 mL of toluene and 1 mL of p-nitrophenyl phosphate (pNPP) solution (buffered at pH 6.0). After incubation, 1 mL of 0.5 M CaCl2 and 4 mL of 0.5 M NaOH were added, and after filtration, p-nitrophenol was measured using the spectrophotometer at a wave-length of 400 nm.
The above analyses were complemented by the determination of microbial carbon content (Cmic) in the individual samples using the fumigation-extraction method for measuring soil microbial biomass in accordance with Vance et al. [35].

2.5. Statistical Analysis

The one-way analysis of variance (ANOVA) combined with Tukey´s HSD (high significant differences) test at a level of significance 0.05 (p < 0.05) was used to test differences in the microbial respiration and enzymatic activities related to fertilization. Potential differences in the selected parameters within the respective variants were analyzed using the paired t-test (p < 0.05). The statistical evaluation and graphical data were processed by using the Statistica 13 software (StatSoft, division of Dell Software, Round Rock, TX, US).

3. Results and discussion

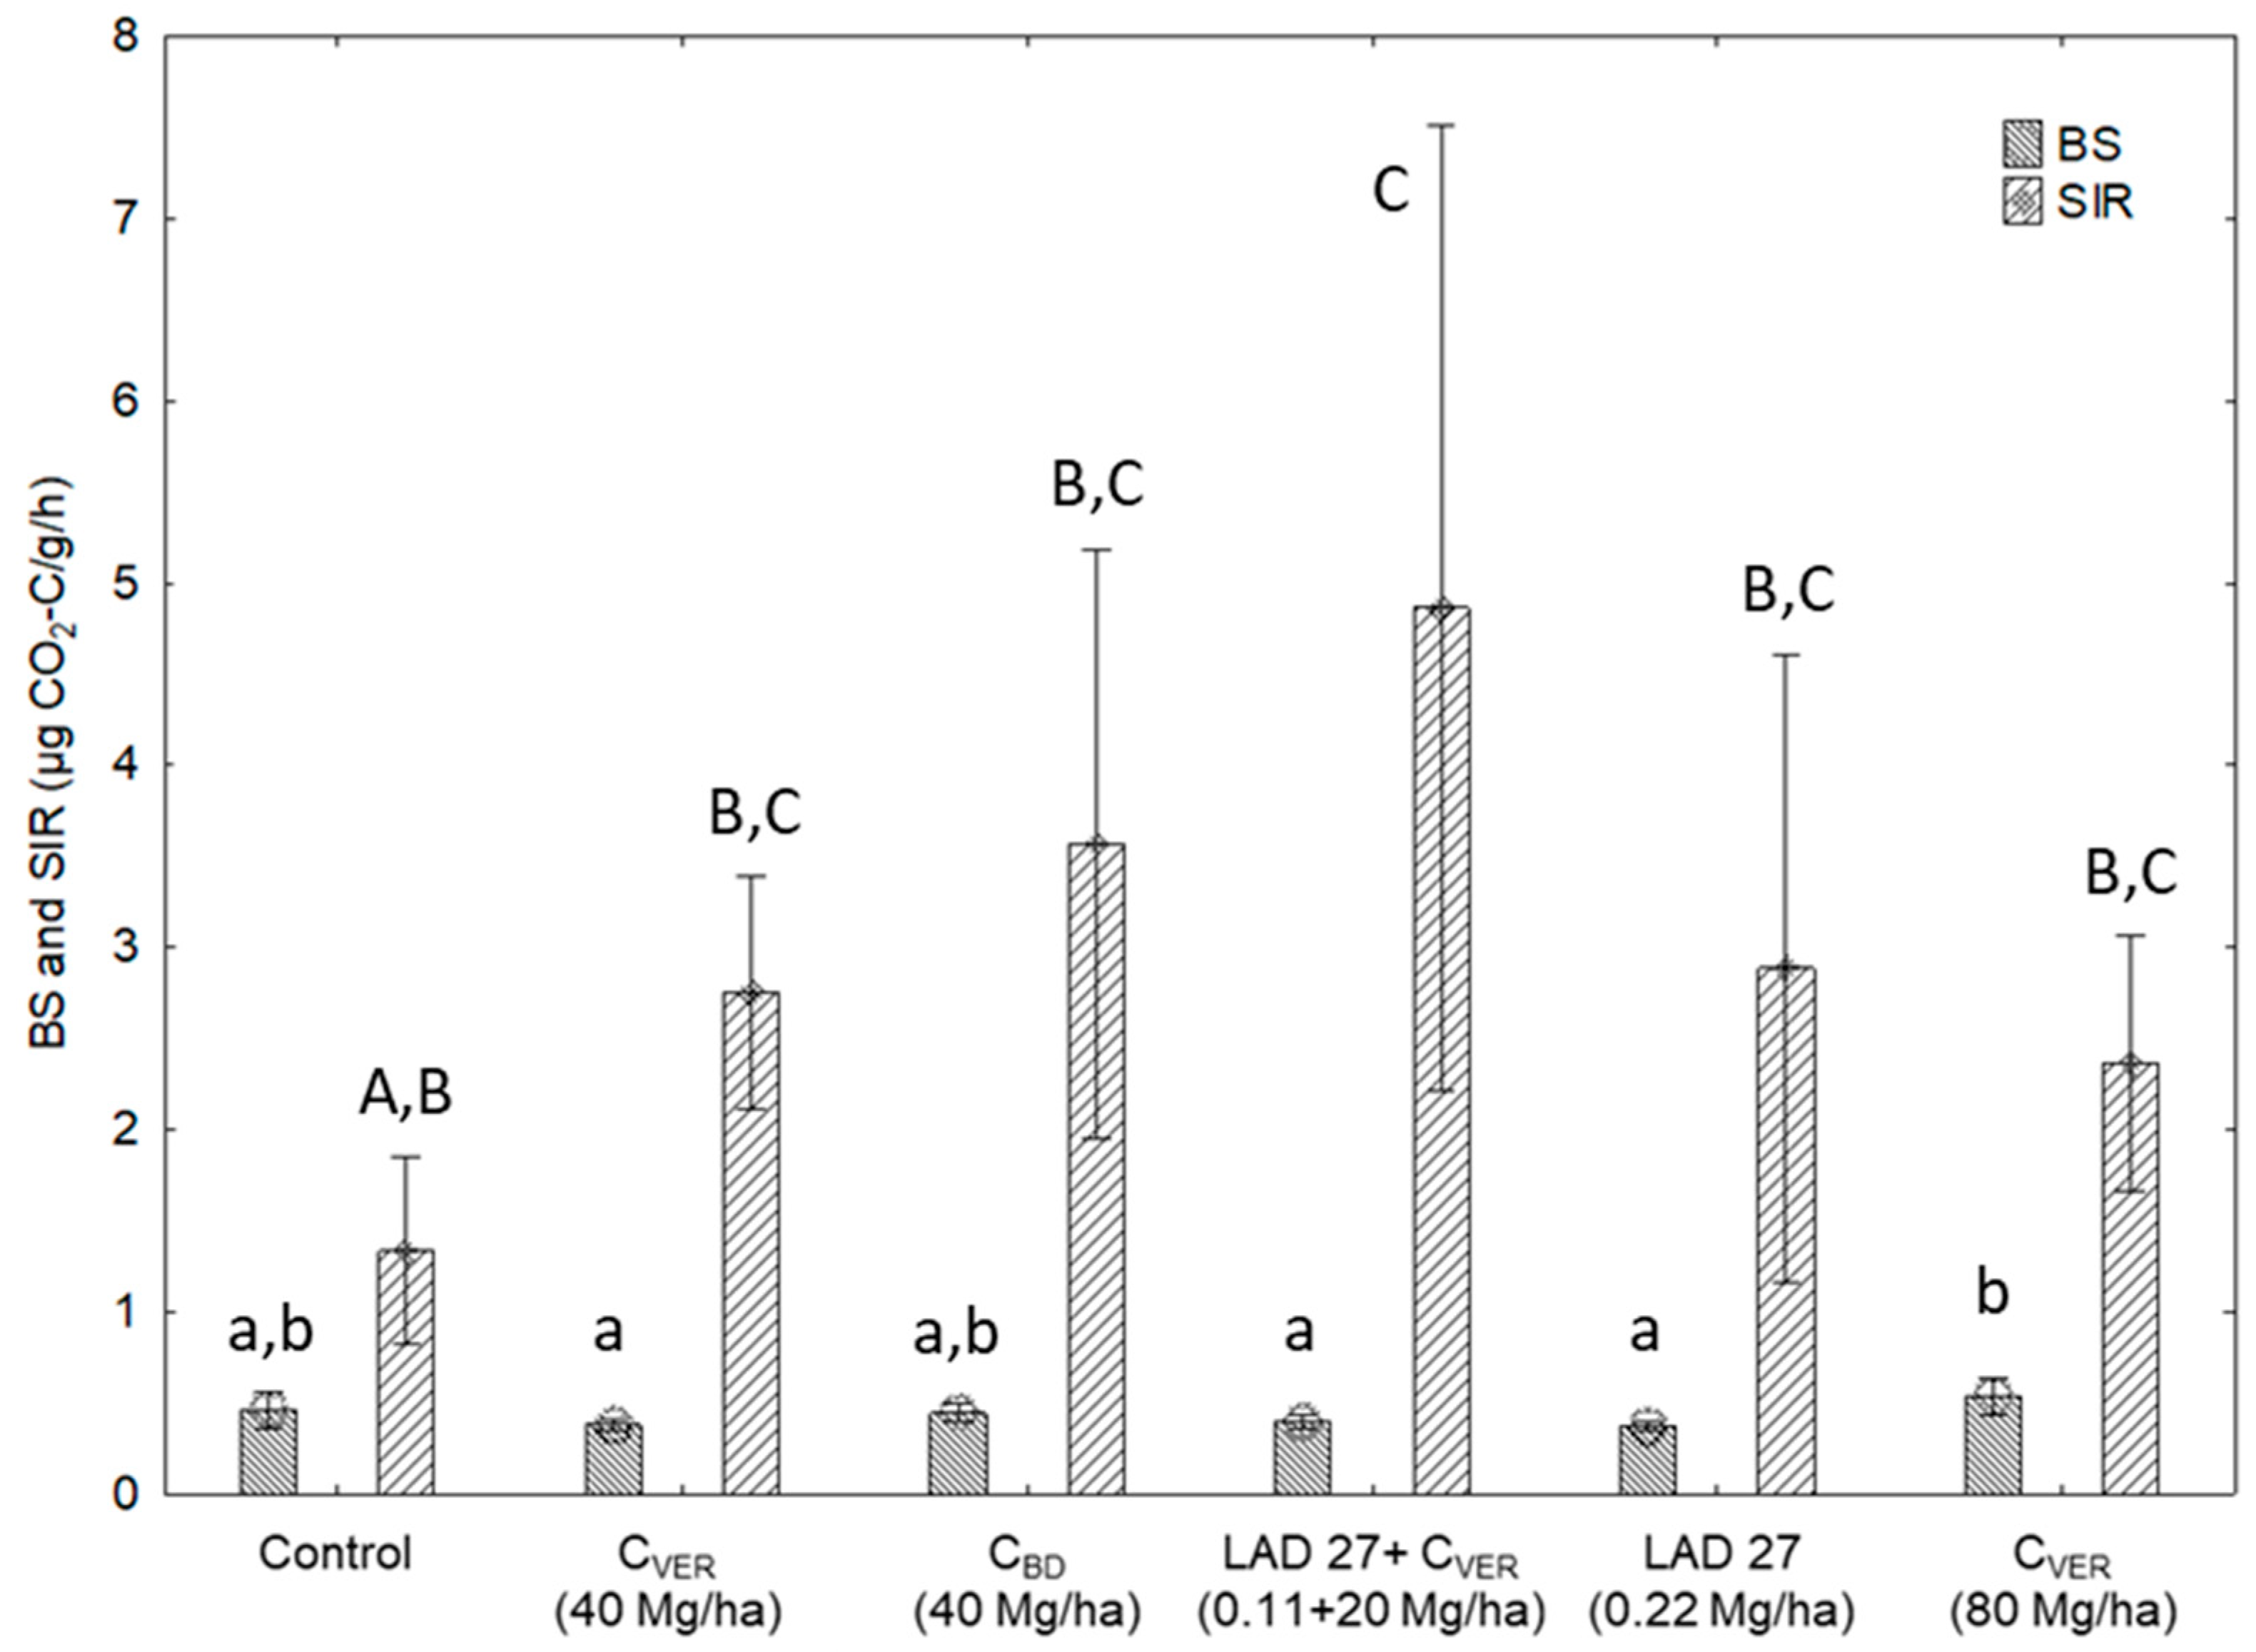
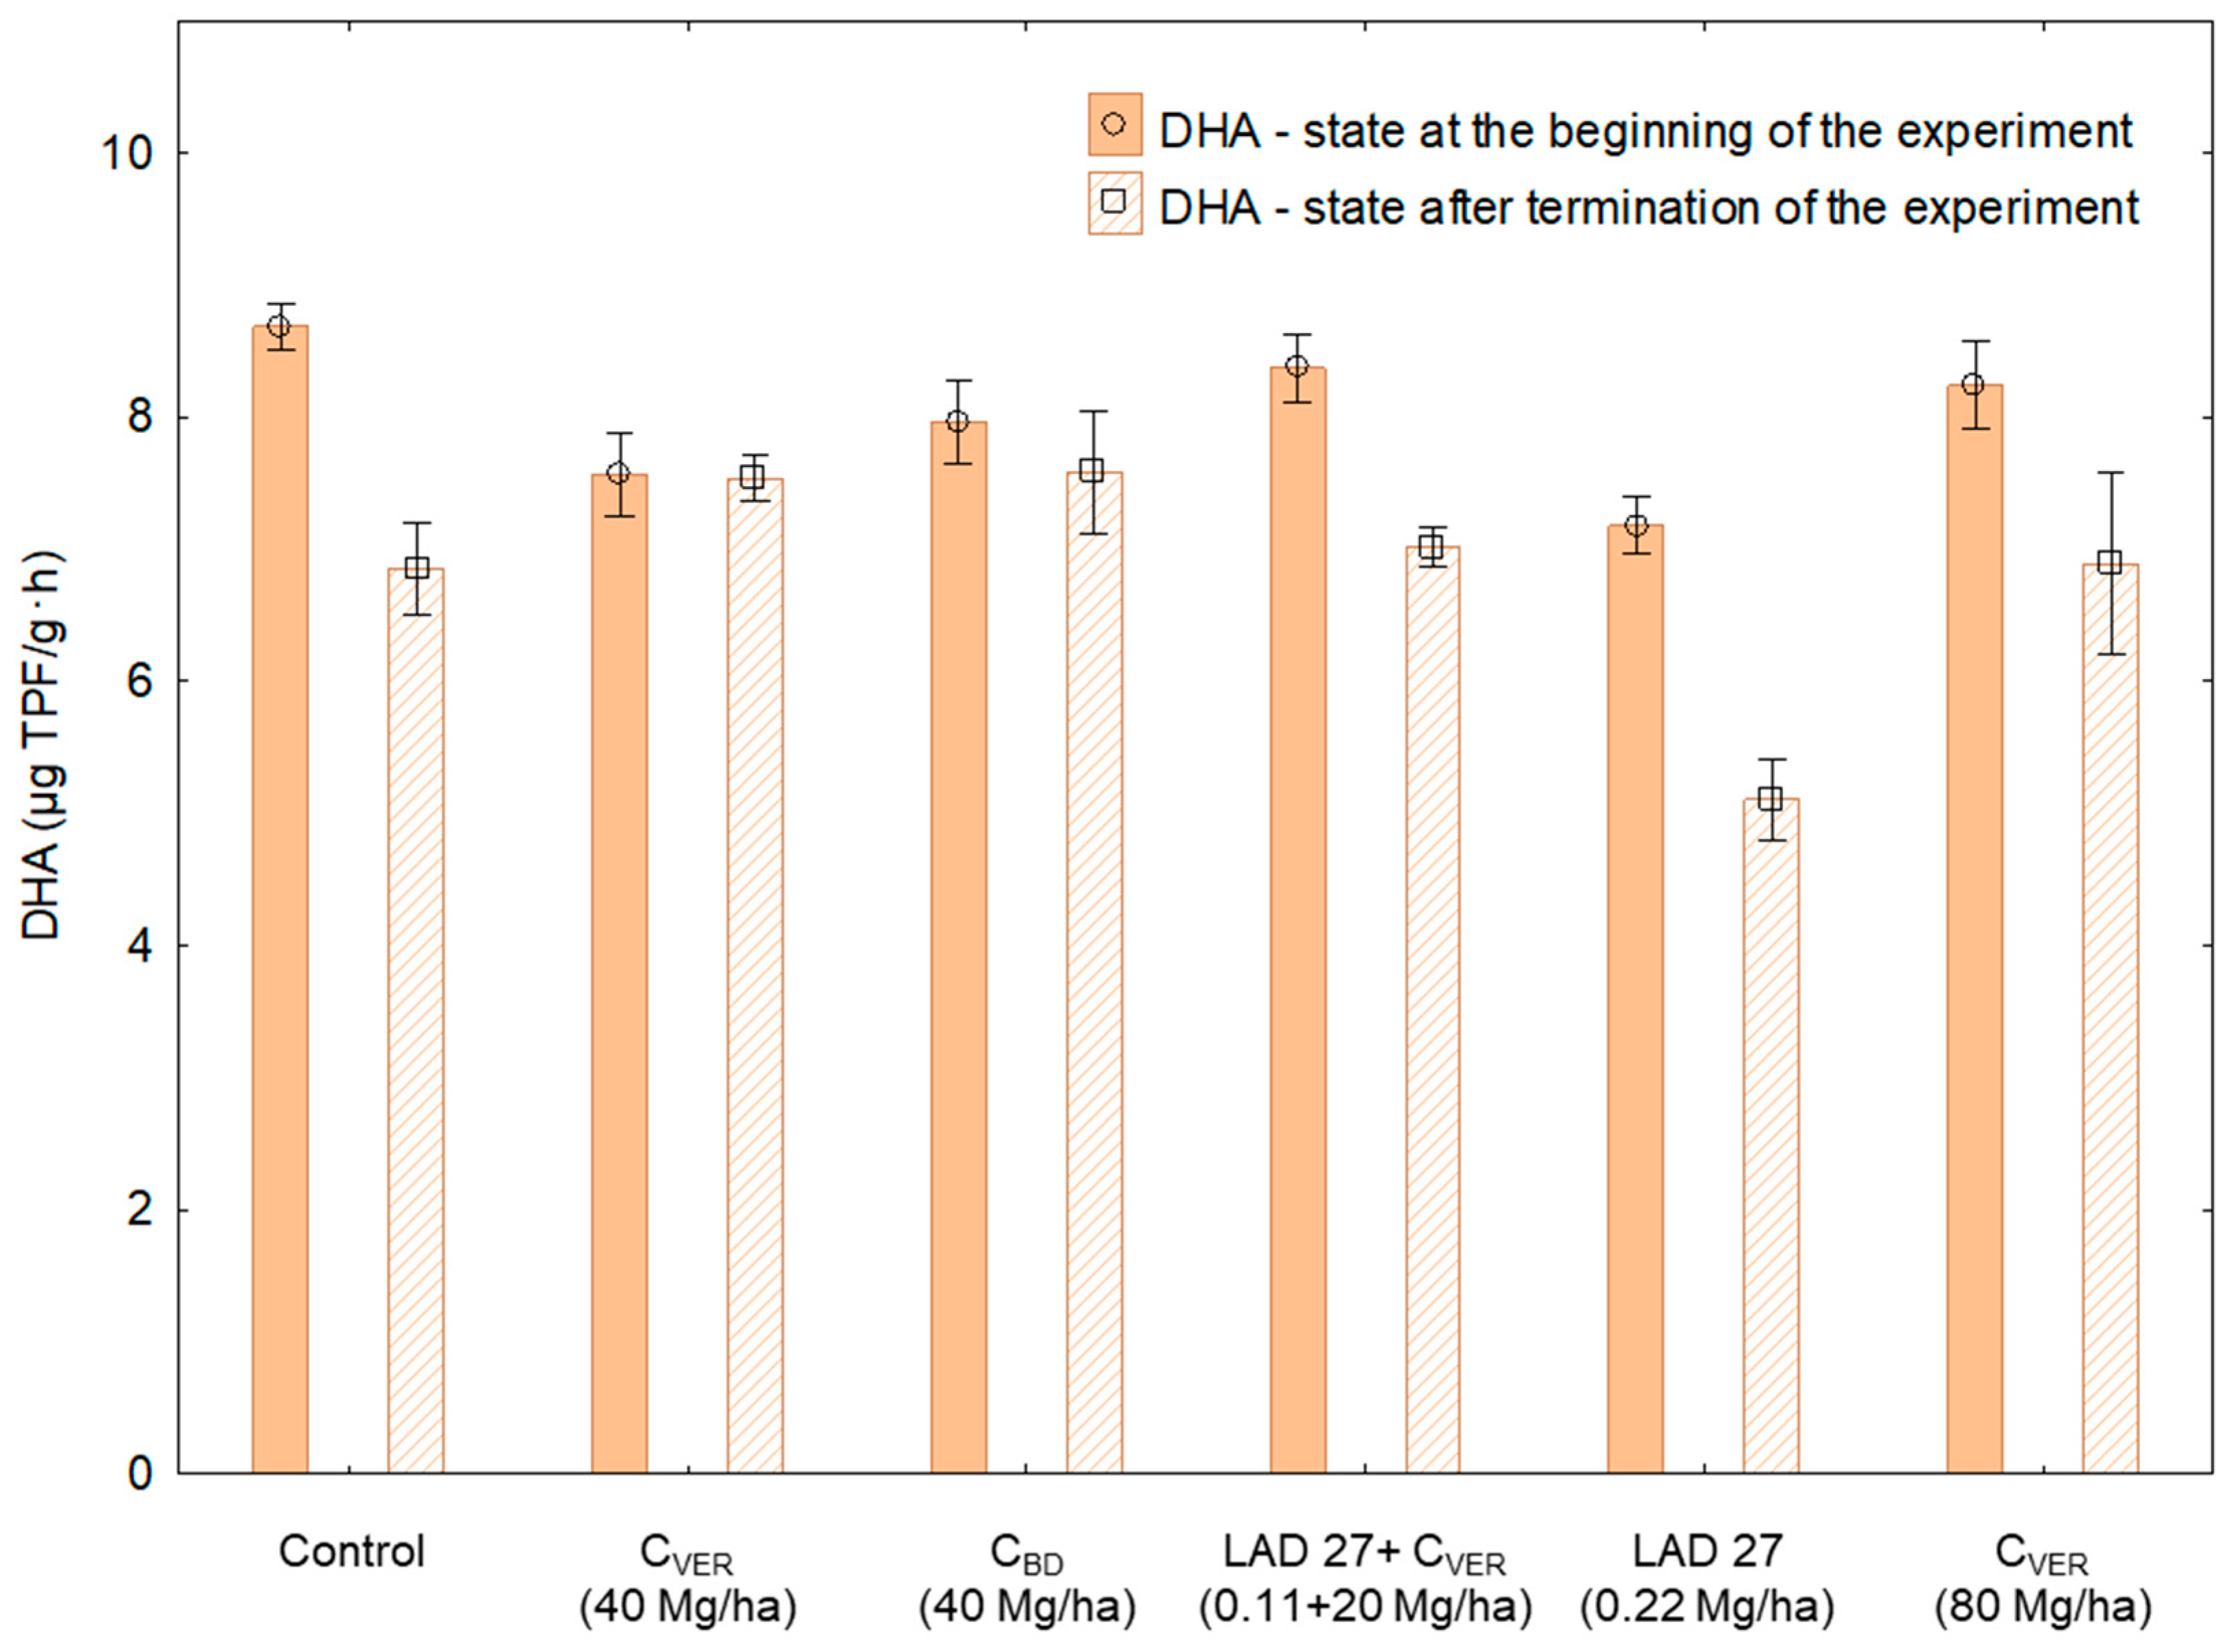
3.1. Respiration Activity

After the end of the experiment, two types of respiration were measured in the soil samples, which were taken from the individual experimental containers: BS and SIR. Both mineral and organic amendment treatments affected microbial respiration in the soils (Figure 2), but this influence was not always significant (p < 0.05). The potential differences in BS and SIR are shown in Figure 2. SIR was higher than BS, which was expected as Bloem et al. [36] state the SIR method is based on the detection of a respiratory response of soil microorganisms to glucose addition. Based on this information, it can be concluded the value of SIR indicates predominantly the microbial biomass. On the other hand, Creamer et al. [37] mention there is a relationship between BS and the current microbial activity in the soil, which originates from the decomposition of available nutrients (SOM). Thus, current respiration without the addition of energy source (Corg) must be lower than Corg induced respiration.
The highest BS rates were found in variants, where organic carbon was applied (CVER and CBD), and in the control variant without the addition of fertilizer. Double dose of CVER showed the highest BS rate of 0.53 µg CO2-C emitted per one hour and gram of soil. This value was significantly higher in comparison with the variant where only MF (0.36 µg CO2-C/g/h) was applied and with variants where lower amounts of CVER (CVER 40 Mg/ha: 0.38 µg CO2-C/g/h) or a combination of CVER and MF (0.39 µg CO2-C/g/h) was applied. As compared with the control, the treatment with 40 Mg/ha of CVER and CBD, which complies to the legislation, affected neither BS nor SIR. The above results of BS show the positive effect only in the application of double dose of CVER (80 Mg/ha) on actual microbial activity in the soil and a possibility of using the combined application of MF and CVER to support microbial activity in the soil. Our results correspond with the observations of other researchers, such as [38,39], who demonstrated a positive effect of CVER application on the actual microbial activity in the soil. Available carbon, which is present in both compost types (Table 2) is a source of energy for microorganisms and hence can improve their respiratory activity [40].
The graph of BS and SIR (Figure 2) indicates that the largest amount of microbial biomass was detected in variants with the addition of CVER and MF showing the highest value of SIR (4.86 µg CO2-C/g/h). The relationship between SIR and microbial biomass was evaluated by [41]. On the other hand, significant differences in SIR were found only between the control variant and the variant where CVER (20 Mg/ha) was applied together with MF (0.11 Mg/ha) In some cases, for example in variants with the addition of CVER and CBD (40 Mg/ha), the recorded value was higher than the value of the control variant but without significant differences. The same results were found in the variant with the addition of MF only. The application of individual substances had a potential to influence the microbial activity in the soil (SIR), which is indicated by all fertilized variants as compared with the control. However, the differences were not significant. Therefore, we can only assume that the above result showed a potential effect of CVER on the development of soil microbial communities in the combined application with MF. The effect of standard dose of 40 Mg/ha of CVER and CBD was not found. The found positive impact of CVER application on SIR together with MF can be explained based on Tejada et al. [14]. The chemical composition of each fertilizer affects favorable or harmful influence of its application in the soil. The application of CVER and MF exhibited a positive influence on SIR probably because of the combined application of the source of C-substances (CVER) and N readily available in the form of MF [14,15].

3.2. Content of Carbon in Microbial Biomass

As in the case of enzymatic parameters (Figure 4, Figure 5, Figure 6), the content of carbon in microbial biomass (Cmic, Figure 3) was determined immediately after adding the fertilizers (Sampling 1) and after the end of the experiment (Sampling 2).
The course of measured values (Figure 3) confirms that the chosen fertilization strategy, i.e., the application of different fertilizers, significantly affected the Cmic content in the soil. Only two significant differences in the Cmic content ranging from 412 to 644 μg Cmic/g were found in Sampling 1, i.e. at the beginning of the experiment. These differences were found between variants with CVER (40 Mg/ha), MF application and all other variants. Furthermore, the highest values were measured at the end of the experiment in each variant, i.e., in Sampling 2 as compared to Sampling 1. The highest value was found with the applied double dose of CVER (80 Mg /ha, 1 165 μg Cmic/g), which was significant compared to all other variants in Sampling 2 (Table 3). Compared with the other variants, the application of increased CVER dose had a great positive effect on the Cmic content, probably due to the composition and higher input of Corg into the soil [13,14,15,16]. The positive effect on the increase of Cmic between Sampling 1 and Sampling 2 was observed even in variants without the application of organic fertilizers (control +52%) or only with the application of MF (LAD 27 +113%). This fact is quite interesting and can be explained on the basis of results published by Holz et al. [42] and Wang et al. [43]: the Cmic content in the soil was affected not only by the application of soil amendment substances but probably through the activity of roots and root exudates production into the soil by the cultivated plant. The mentioned differences between Sampling 1 and Sampling 2 are presented in Table 3 indicating the presence or absence of statistically significant differences between the respective variants in Sampling 1 and Sampling 2. Based on the mentioned differences, it can be assumed that a significant increase in Cmic was detected in all experimental variants.

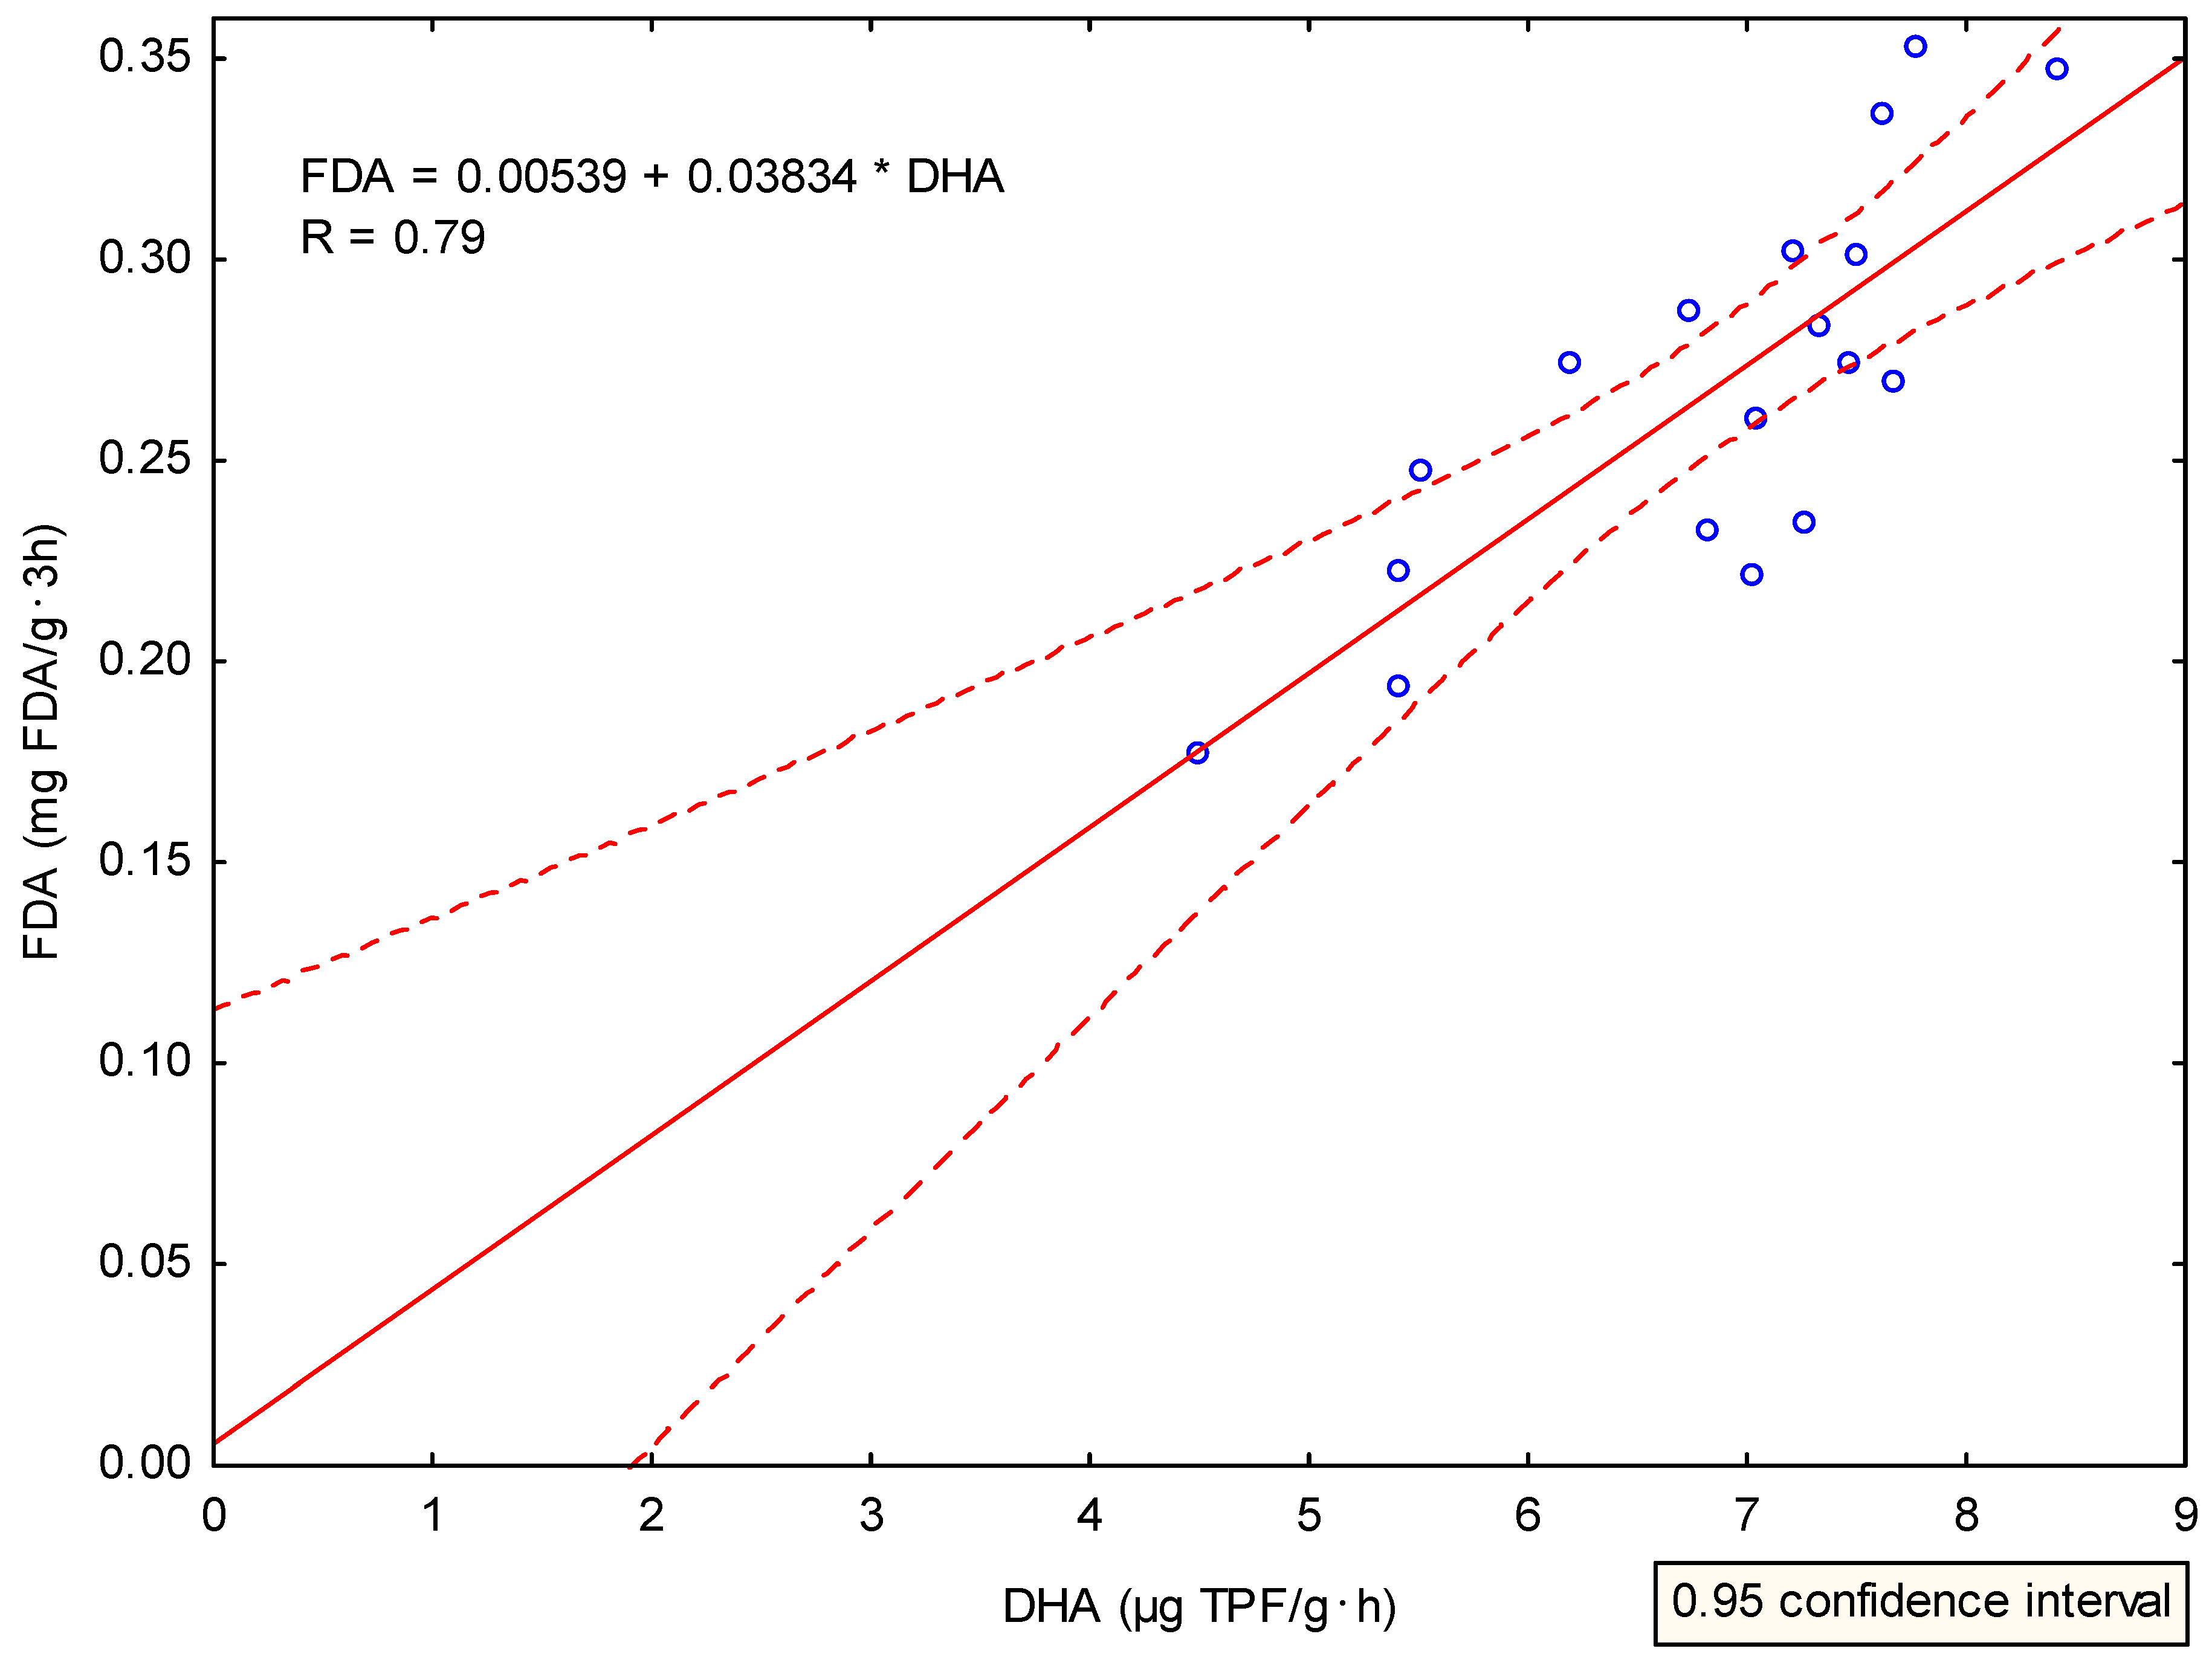
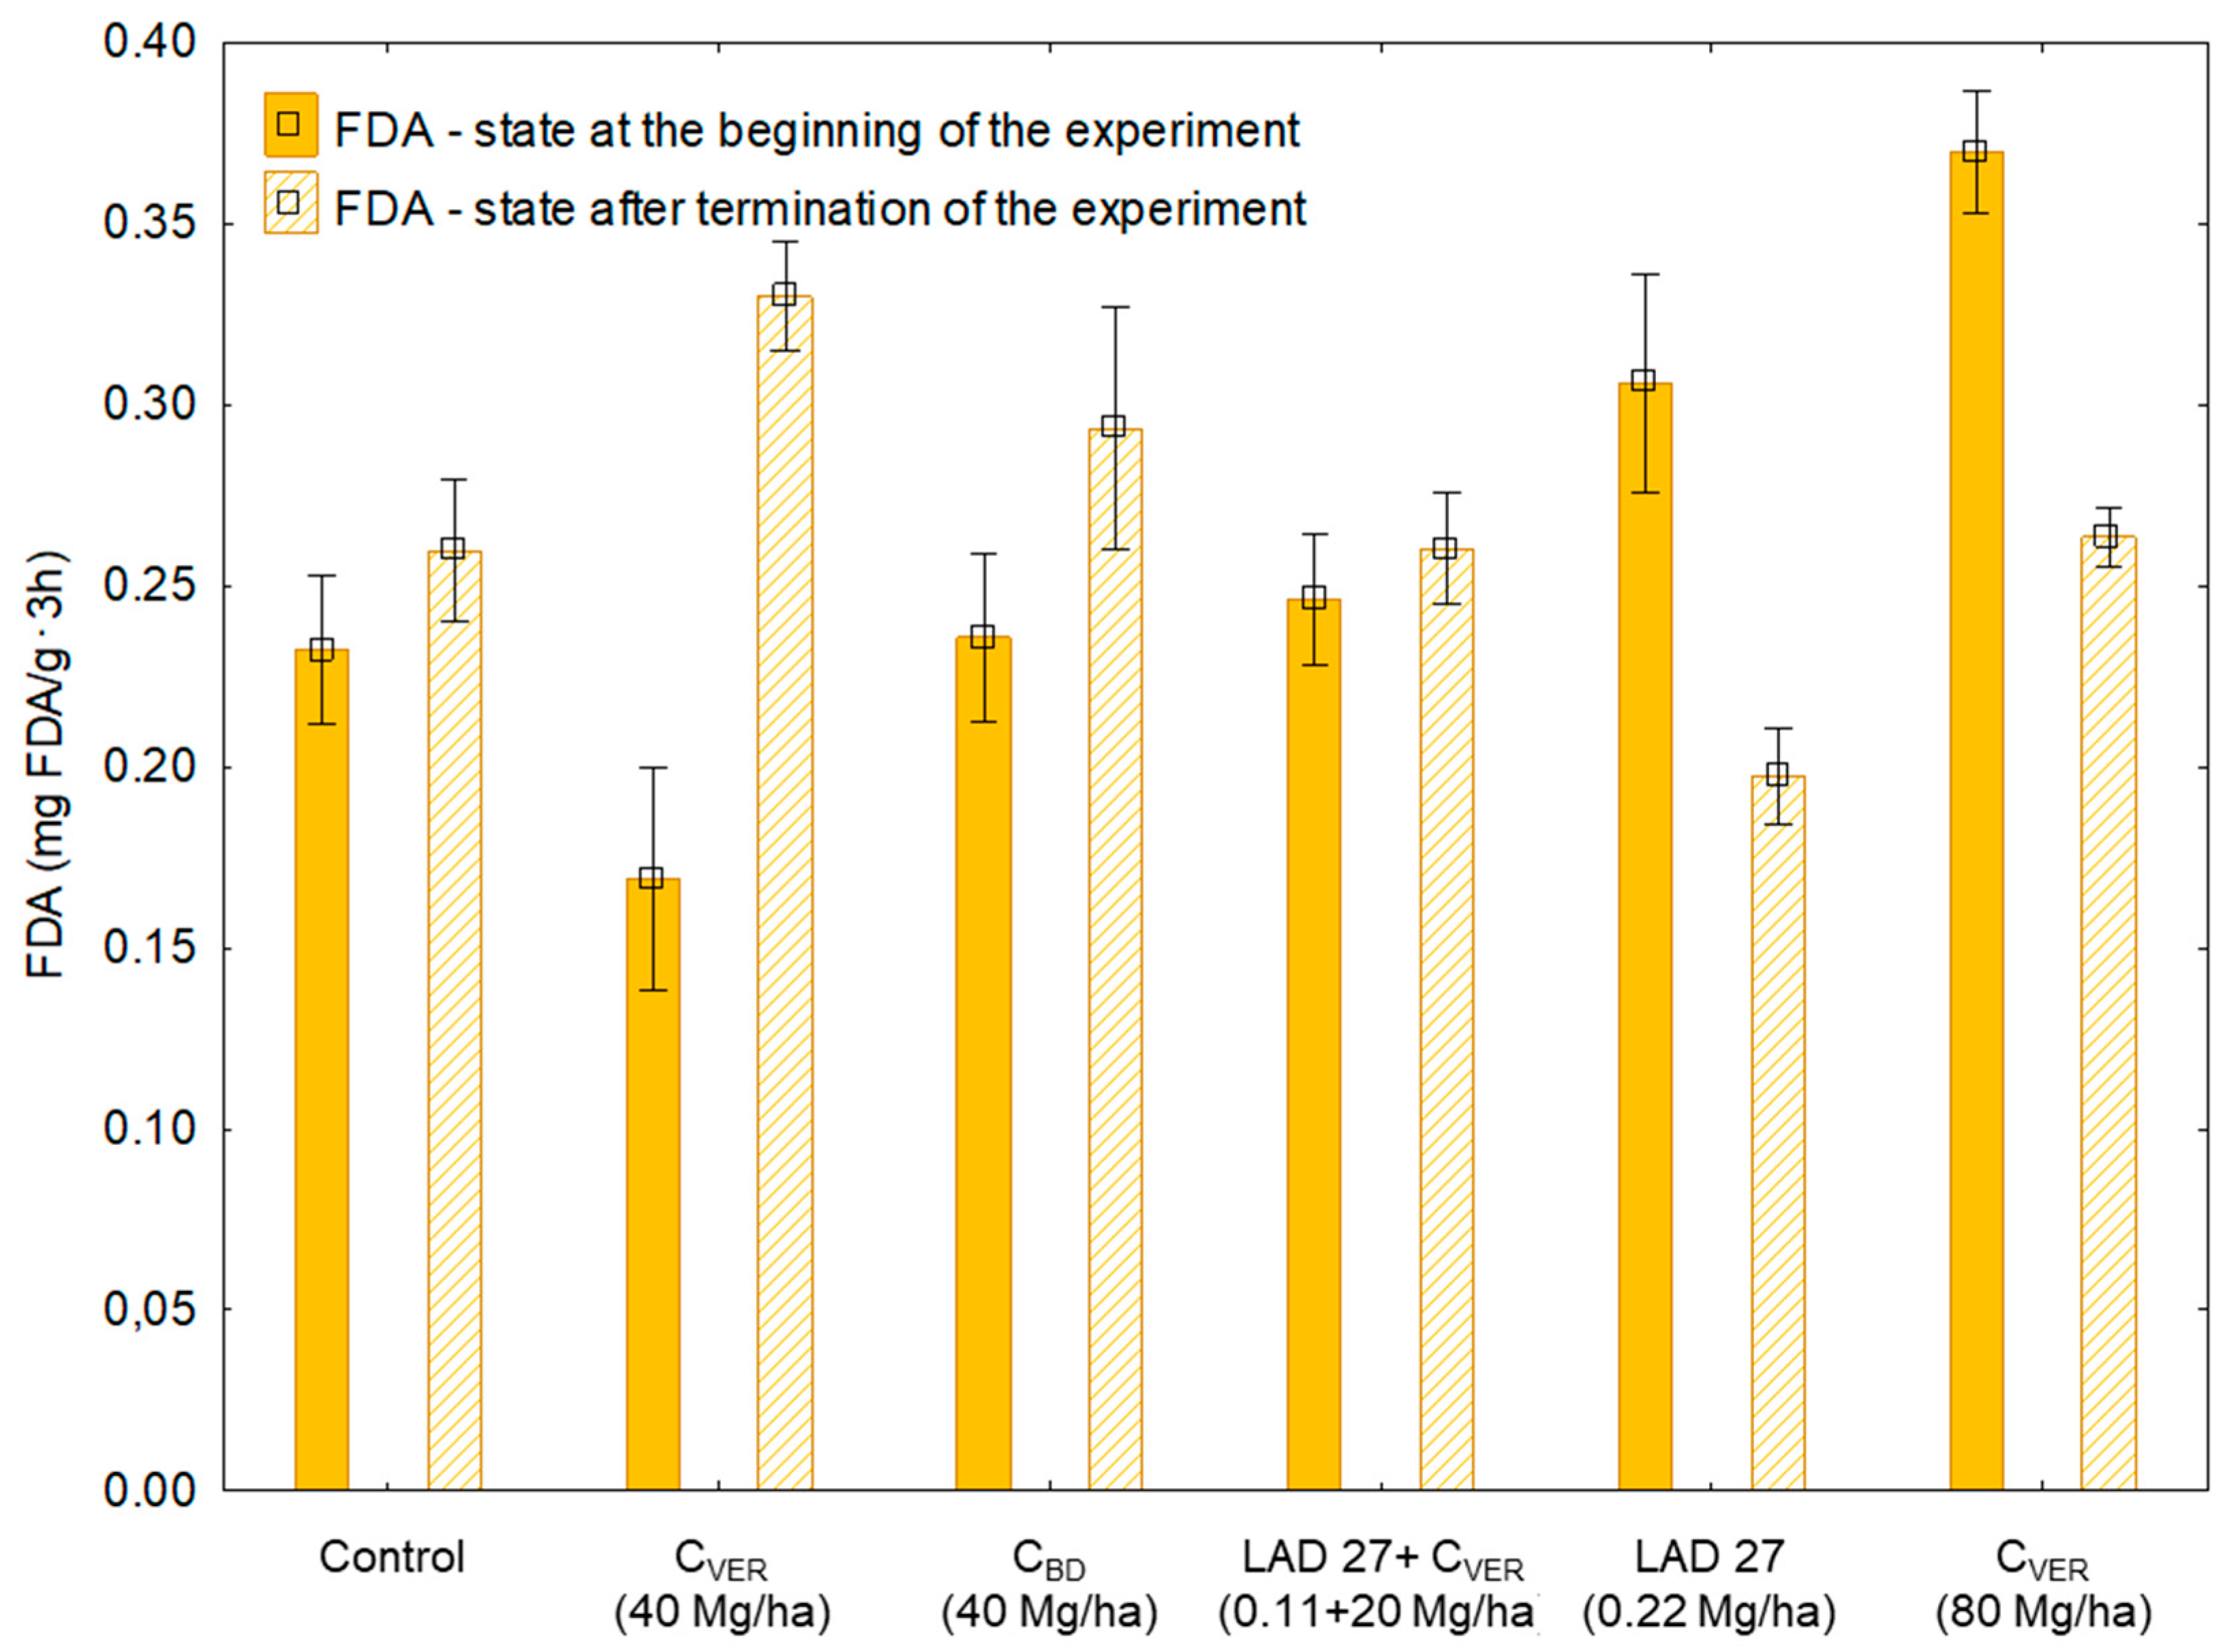
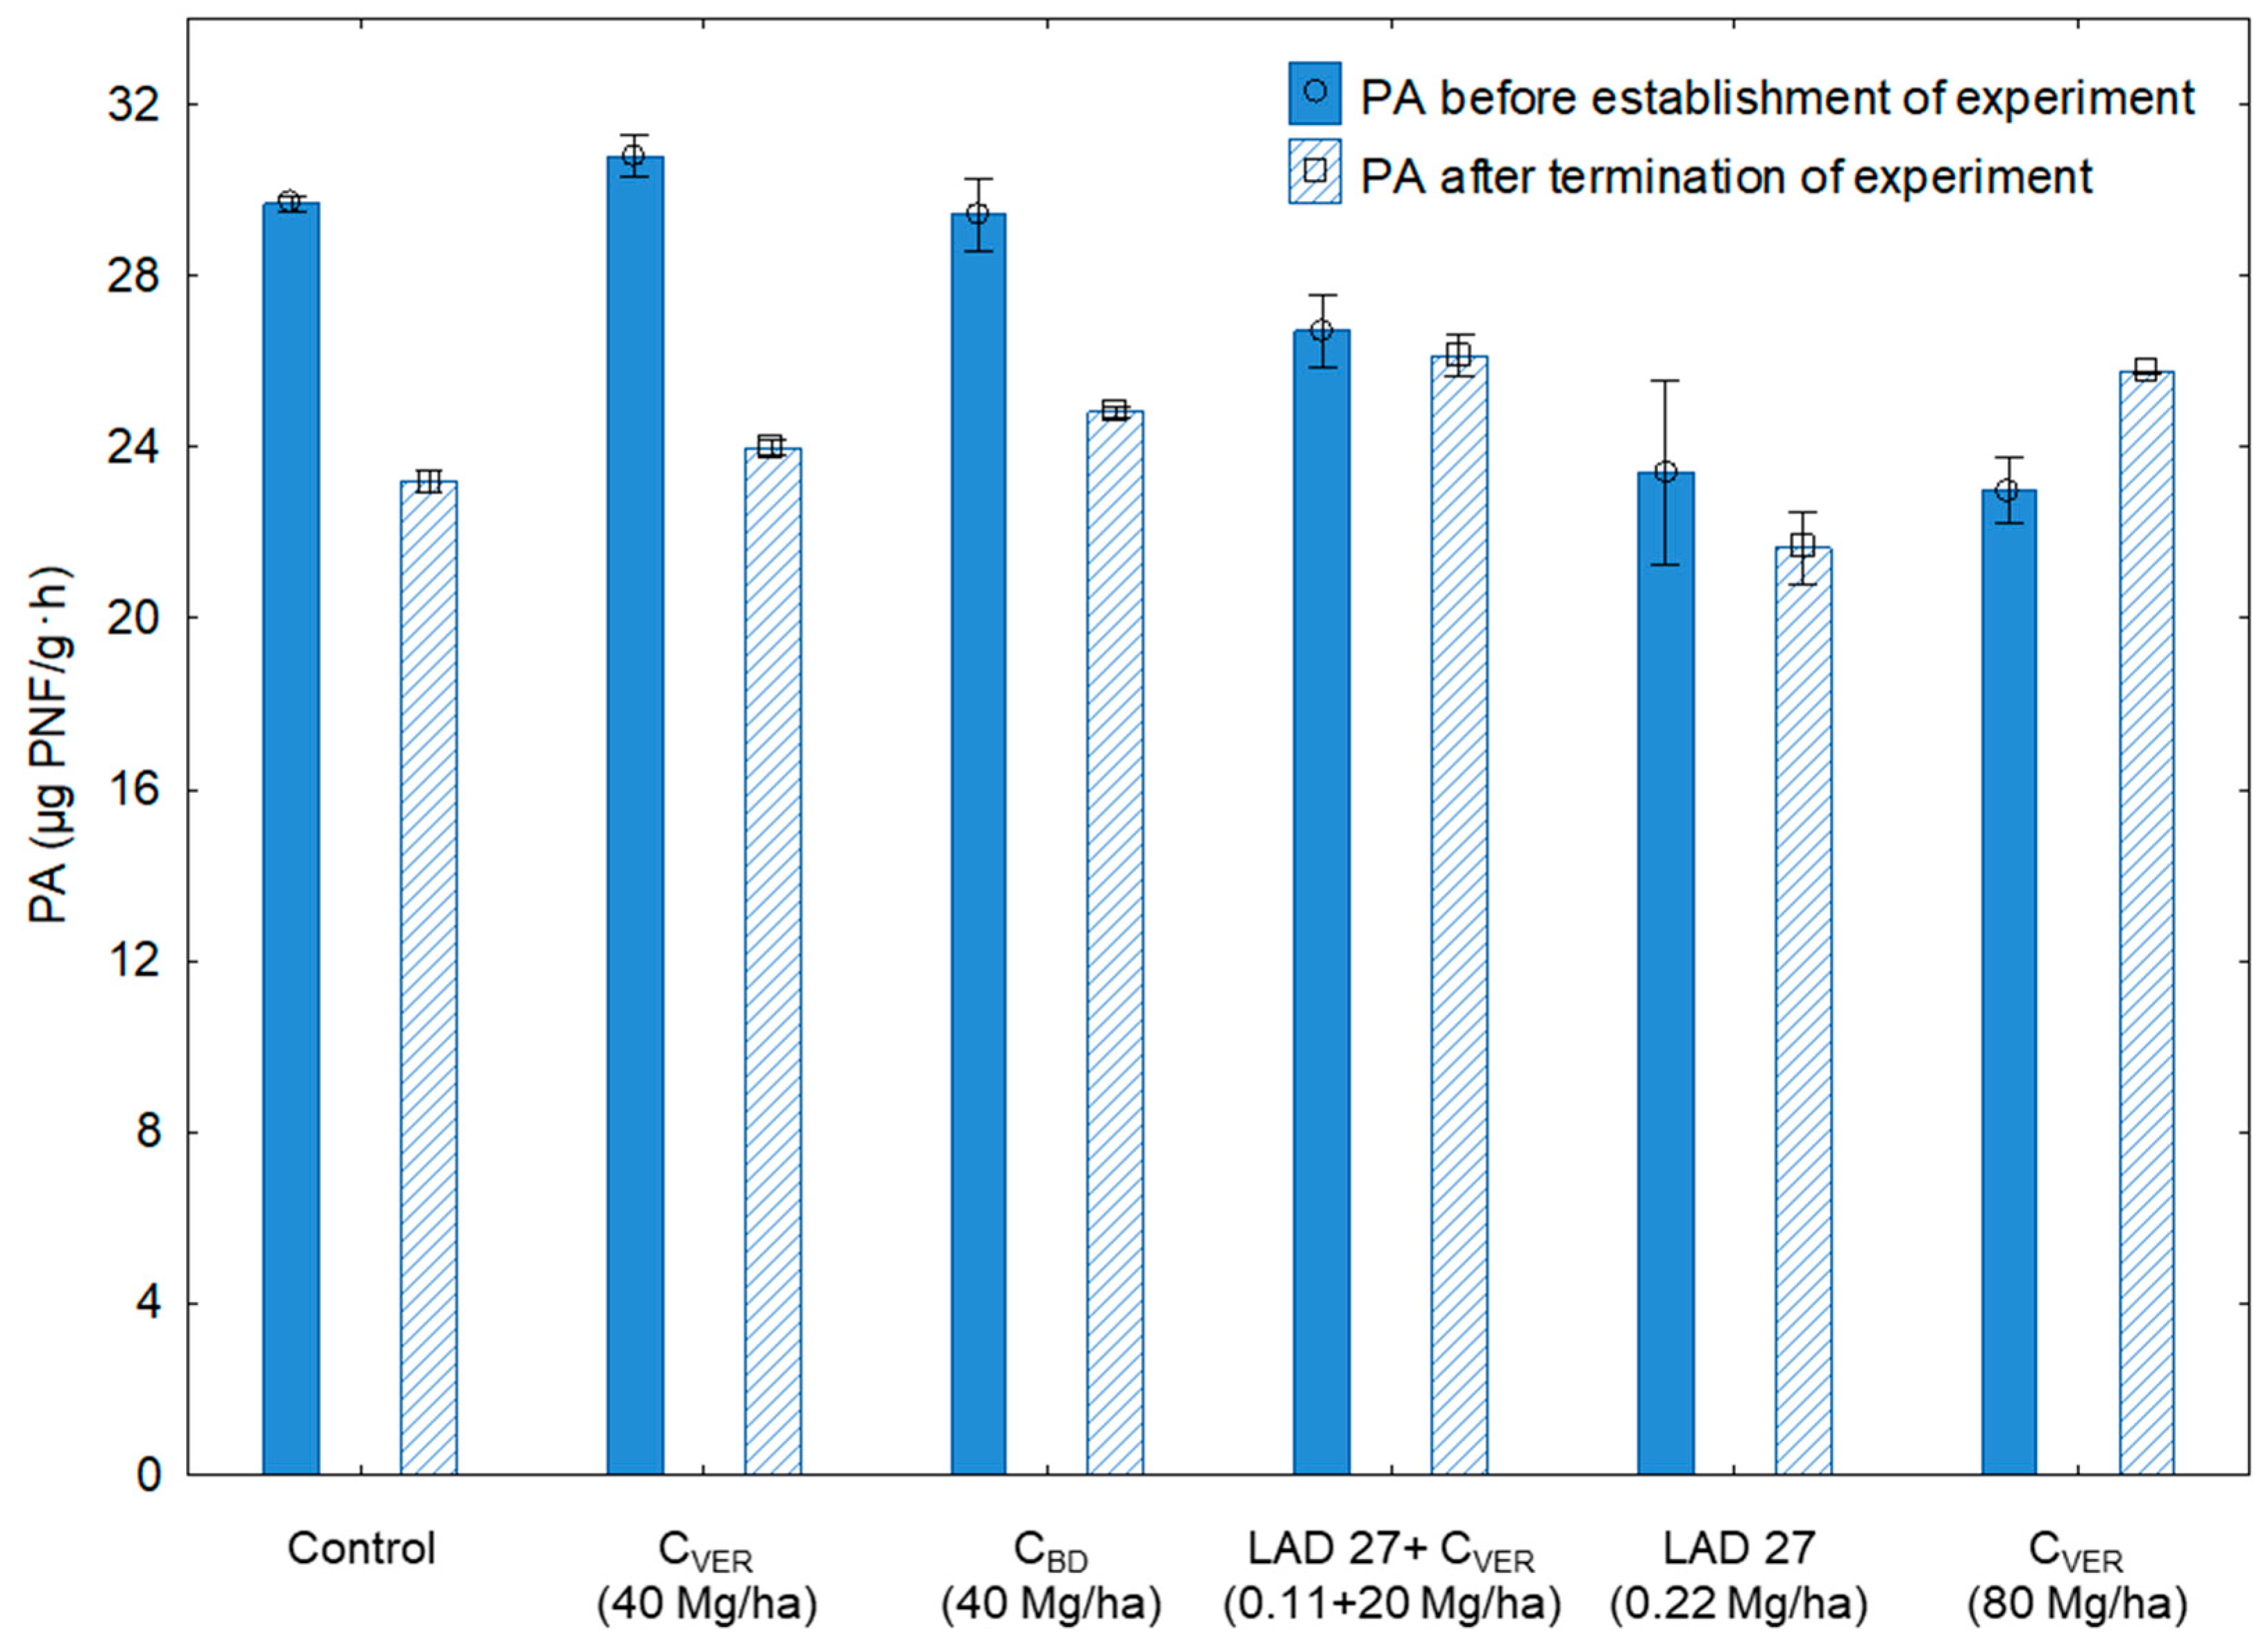
3.3. Soil Enzyme Activities

Soil enzymes were used as sensitive indicators of soil fertility, soil quality, and productivity. Furthermore, their activities can indicate microbial activity, decay rates, and availability of substrates for microbial or plant uptake [44].
The highest values of dehydrogenase activity (DHA; Figure 4) were detected before the start of the experiment (Sampling 1). Based on the course of Sampling 1 values, it can be suggested that soil used for the experiment was useable from the microbiological activity point of view since a significant difference in DHA was recorded only between the soil used in the control variant and variants with the application of CVER (40 Mg/ha) and MF Contrarily, in Sampling 2, the dynamics of DHA values (Figure 4) showed significant (p < 0.05) differences between the respective variants and the influence of the studied fertilizers on DHA. It was shown (Table 4) that the application of CVER and CBD amendments positively affected the soil microbial activity in comparison with the application of only MF in Sampling 2. This difference could have been caused by the MF application; however, there is also a possibility that the soil used for establishing the experiment had been stressed (reduced microbial activity) after having been taken from the field and the problem was compensated by pre-incubation only partly. On the other hand, the detected values show that the addition of CVER (in our case represented organic matter) can reduce the potential negative impact of MF (LAD 27) on the DHA value. This was confirmed by the significant difference between the variant where LAD 27 fertilizer was applied together with CVER and the variant, in which only MF was applied.
As compared with the results from Sampling 2, the DHA values measured in Sampling 1 were higher and declined after the end of the experiment. The observed differences between Sampling 1 and Sampling 2 (Table 4), were negative (p < 0.05) in the following variants: control, LAD + CVER (0.11+20 Mg/ha) and LAD (0.22 Mg/ha). The highest drop (−28%), hence the lowest DHA (5.10 μg TPF/g·h), was found in the variant with the MF application. The second highest decrease was found in the control variant (−21%) and in the variant with the combined application of MF and CVER (−16%). Very important is namely the fact that a significant difference was found between the variants where MF was applied together with CVER and the variant where only MF was applied. Therefore, if a part of the MF dose is supplemented with the organic form of nutrients, a positive effect on DHA values can be expected. As the DHA value is an indicator of total microbial activity in the soil or compost [45,46], it can be assumed that the total microbial activity in the soil was decreasing within the experiment. The phenomenon showed most in variants with the absence or reduced dose of organic nutrients. The application of organic nutrients (e.g., in the form of organic waste products or organic fertilizers) is necessary to maintain and to support the development of microbial communities in the soil [47].
The measured hydrolysis of fluorescein diacetate (FDA) values (Figure 5) can be compared from two aspects: the first one (a) is the state at the beginning of the experiment, and the second one (b) the influence of soil amendments during the experiment. FDA values were variable (minimum = 0.17 mg FDA/g·3h; maximum = 0.39 mg FDA/g·3h) at the beginning of the experiment. Since the highest FDA values in Sampling 2 were found in variants with its lowest initial value, it can be assumed that the initial state probably did not affect the results of the experiment. Additionally, the comparison of Sampling 1 and Sampling 2 shows that significant differences (Table 5) can be found only in variants with the application of 40 Mg CVER/ha (+95%), MF (−35%) and a double dose of CVER (−28%). These findings show that the dose 40 Mg CVER and had a positive effect on FDA increase while the application of the second type of compost (CBD) did not have any significant adverse effect on FDA (+24%).
The highest FDA hydrolysis activity of Sampling 2 was measured in variants with the application of 40 Mg CVER/ha (V2 = 0.33 mg FDA/g/3h). This FDA value was significantly the highest in comparison to other variants except for the variant with the application of 40 Mg CBD/ha (0.29 mg FDA/g/3h). Principally, the application of CBD had the same effect (p < 0.05) on FDA as the combined application of CVER and MF. The measured value of FDA in the variant with CBD was at the same level as in the variant where 80 Mg CVER was applied. As stated above, the average FDA value in this variant at the end of the experiment was significantly (by 28%) lower than the baseline. Huang et al. [45] state that the process of vermicomposting caused a decrease in the amount of microbial biomass in the end products of “vermicompost”, but increased microbial diversity. There might have been a situation where certain types of bacteria began to predominate after the CVER application. The species could have had a negative effect on the overall microbial activity in the soil.
Hydrolysis of fluorescein diacetate (FDA) is performed by a variety of enzymes including esterase, proteases, and lipases [46]. Moreover, according to [48], FDA hydrolysis can be used as an indicator of microbial activity in relation to the state of the soil environment. When we consider the characteristics of FDA and the results of Sampling 2, we can state the above results illustrated a positive effect of organic fertilizers application and a potential negative effect of MF application on the overall microbial activity. Tian et al. [38] reported that FDA is widely accepted as an accurate and simple method for determining total soil microbial activity. Additionally, these authors observed a direct effect of organic matter application in the form of compost on the increasing microbial activity in the soil. Thus, FDA as well as DHA can be considered indicators of microbial activity in the soil. If we compare the values in Sampling 2, we will find a positive correlation (R = 0.79, F = 27.01, P < 0.0001, Appendix B, Figure A2). The results of regression analysis confirm that both soil parameters were equally influenced in the course of the experiment by the type of soil amendments applied, respectively positively by the application of organic matter, no matter whether it was CVER or CBD.
Compare to Sampling 2 (measured after the end of the experiment), a higher phosphatase activity (PA) was detected in Sampling 1 (Figure 6). Phosphorus (P) represents an important nutrient in the soil, which is necessary to maintain plant growth and to sustain crop yields. Essential soil P sources are SOM and mineral compounds, which must be decomposed and immobilized through enzymatic reactions [42,49]. The plants are motivated to get P from the soil and to use it as nutrition during their growth. This would explain the decrease of soil PA in some variants. The decrease of PA was significant (Table 6) in the following variants: control, CVER and CBD (both 40 Mg/ha). As compared with the initial condition of soil used in the experiment (Appendix A; Table A1), the control variant exhibited a lower content of plant available P after the end of the experiment. This variant was not fertilized and microorganisms did not have enough organic matter for decomposition due to PA [42,50,51]. A different situation was observed in the variant where composts (CVER and CBD) were applied at more than 565 mg P/kg of CBD and 800 mg of P in one kg of CVER (Appendix A; Table A1). Even so, PA did not increase after the application of CVER and CBD.
Matured composts represent important source of plant available P [52]. Thus, the composts applied at a dose of 40 Mg/ha could have theoretically contributed to plant nutrition but had no positive effect on the PA level because they probably did not increase the content of mineralizable P in the soil [53]. To confirm the possible relation, an analysis of the relationship between the available P content (mg/kg) in the soil at the end of the experiment and the PA values was made after the experiment resulting in a weak positive correlation (R = 0.58, F = 4.79, P = 0.043, Appendix B, Figure A2). This result confirms that variants with the lower availability of P content showed lower PA levels. An exception was the variant with the double dose of CVER where a significant increase in PA by 11.95 % was found. The organic fertilizer, CVER, was applied at a dose of 80 Mg/ha. According to Saha et al. [49] and Horta et al. [54], the application of CVER leads to the increased content and availability of basic nutrients in the soil through the mineralization of SOM. The double dose of CVER had a significant positive effect on plant available phosphorus content in the soil (Table 7). Focusing on the composition of CVER and CBD (Appendix A; Table A1), it is obvious that it has a positive effect on the soil P content (Table 7). Compared to the initial condition of arable soil (146 mg/kg; see Appendix A; Table A1), the increased soil P content could have also resulted from the increased availability of nutrients (P, N etc.) to plants and soil microorganisms that could release it from SOM.
In general, the significantly higher value of phosphatase enzyme activity (PA) in Sampling 2, i.e., after the end of the experiment, was found in the variants where CVER was applied: (a) LAD+CVER (0.11+0.20 Mg/ha); (b) CVER (80 Mg/ha). These values indicate that only the increased dose of CVER resulted in PA support. Conversely the standard dose of composts (CVER and CBD; 40 Mg/ha) which is in accordance with the Czech and Slovak regulations, did not positively affect PA. Lemanowicz et al. [49] reported that the application of organic compost in the soil through vermicompost seems better for P mineralization and related biological activities. The measured values demonstrated that earthworms cast a significantly increased P microbial biomass as well as available P in the soil. Data presented in Figure 6 show the variation of PA due to the application of CBD, CVER and MF. The mineral fertilizer treated variant showed the lowest level of enzyme activities (see Figure 4—DHA, and Figure 5—FDA). The result of enzymatic activities (DHA, FDA, PA) after the end of the experiment in the variant with MF application indicated a potential negative effect of MF application on the microbial activity and on the soil quality. On the other hand, the results also show that the negative effect of mineral fertilization can be reduced by the application of composts (conventional organic waste or vermicompost), as confirmed by [49,55].

3.4. Plant Biomass Production

Biomass plant production was measured after the end of the experiment. Results are presented in Mg of dry matter per hectare. Plant biomass was sampled at a stage of milk ripeness. All values including HSD are shown in Table 8.
The highest yield of plant biomass was found in the variant with 40 Mg CVER per ha. The lowest yield was recorded in the control variant without the application of fertilizers. Maize biomass yield ranged from 10 Mg/ha (CVER 40 Mg/ha) to 7.9 Mg/ha (control). Differences between the respective variants were only partly significant. The highest yield in the variant with the application of CVER (40 Mg/ha) was significant compared to the control variant and to the variant with the applied CVER with mineral fertilizer. In the results (Table 8), the application of CVER and CBD contributed to biomass increase as compared with the unfertilized variant and the variant with the application of MF and CVER. Moreover, the yield from the variants with the application of only CVER and CBD reached the same level or was higher as in the variant with only mineral fertilizer. The second highest yield was detected in the variant with the double amount of CVER (80 Mg/ha). Nevertheless, the result was significant only as compared with the control variant.
When we focus on the explanation of results, it is necessary to note that the primary goal of the experiment was not to monitor biomass yield parameters, but rather the effect of selected fertilizers on soil health and quality. On the other hand, the production of plant biomass is an indicator of soil fertility or soil phytotoxicity [9]. As to soil fertility, it can be stated that the application of CVER and CBD at a dose of 40 Mg/ha positively affected plant biomass production as compared with the control variant. Namely the application of increased CVER dose had a positive effect on plant biomass production in comparison with the control variant. The beneficial effect of CVER was likely to be caused by the vermicompost, which is produced by the fragmentation of organic waste by earthworms. Thus, it creates substances (stable complex of humic substances), which may positively influence the cycle of carbon in the soil and the extracellular activity of microorganisms [56,57]. It was proved [14,56] that the CVER application affects plant growth due to the increase of humic acid in the soil and other essential substances, which are bio-stimulants for plants and soil microorganisms.
From the long-term perspective, an increased dose of CVER (80 Mg/ha) may by significant compared to mineral nutrition (application of LAD 27; MF). The reason is that N substances (the main condition for plant growth) are present in both types of composts (CVER and CBD) especially in organic bonds, i.e., fixed in organic matter. Compared with the typical organic waste compost (CBD)., the used CVER in the presented experiment exhibited a lower C:N ratio. Therefore, the highest yield was found in the variant with the lower dose of CVER (10 Mg of corn biomass/ha) and with the double dose of CVER (9.5 Mg of corn biomass/ha); however, the values were not statistically significant as compared with the MF variant. For the use of N from composts, mineralization must occur in order to release N substances. It extends the time when the plants have a lower capacity to withdraw mineral forms of N [58]. Nevertheless, the process has an essential advantage of promoting long-term soil fertility with nutrients being released gradually from the compost [4,58]. The pot experiment took 95 days. It is probable that during the time, mineral N forms might be lost from the variant fertilized with LAD 27 by leaching [4]. Variants with the application of CVER and CBD (without the addition of N mineral forms) were probably releasing N substances gradually, thus providing gradual maize nutrition until the end of the experiment, which is common when using compost [16,55,58]. Furthermore, the decreased plant biomass yield in the variant, with the combined application of LAD 27 and CVER, can be explained by the composition of the respective fertilizers [4]. The decreased CVER dose could not have probably sufficiently affected the plant biomass yield because of the lower content of Nmin and the potential long-term process of its release from compost organic bonds [58].

4. Conclusions

The presented results of this paper showed a potential positive effect of organic fertilizers application on soil health and quality while sustaining production functions of the soil. The application of organic fertilizers, such as vermicompost in combination with mineral N improved microbial activity in the soil through their composition: high content of available nutrients, C and N in accessible form. We did not find significant differences between the applications of conventional compost and vermicompost in the indicators of soil quality and we can state that the 40 Mg/ha dose of both compost types had a similar positive effect on the soil Cmic content, soil respiration and some enzymatic activities. The higher dose of vermicompost (80 Mg/ha) had a positive effect on the above parameters except for FDA enzymatic activity, which was lower in comparison to the dose 40 Mg of vermicompost per ha. Thus, the increased dose could probably be used in practice without negative effects on soil fertility. On the other hand, there is a question of transport and application costs, which will be higher. Furthermore, the results point to the possibility of using the combined application of mineral fertilizer and vermicompost, thus eliminating the negative effect of sole mineral fertilizer application on soil health and quality. In addition to the selected indicators, plant biomass yield was monitored. Although significant differences in soil fertility were not found in the variants with composts, vermicompost may become an interesting alternative supporting plant biomass production. Moreover, both organic fertilizers positively affected plant biomass production, reaching the production enhanced by the mineral fertilizer. Further studies will examine the influence of different types of compost on the loss of nutrients from the soil in relation to the effect on soil health and quality.

Author Contributions

J.E., J.M.(Jana Maková), S.J. and A.K. were responsible for organizing and managing the experiment. J.E., V.L. performed the statistical analysis and graphical data processing. J.M.(Juraj Medo) and T.L. reviewed the manuscript.

Funding

The research was funded by the Ministry of Agriculture of the Czech Republic, institutional support MZE-RO1719.

Conflicts of Interest

The authors declare no conflicts of interest.

Appendix A

Experimental containers, their placement in the greenhouse and chemical composition of the compost applied.
Figure A1. Experimental containers and their placement in the greenhouse. The size of the experimental container: a—height (550 mm); b—width (200 mm); c—depth (100 mm). Each container was filled with 14.6 kg of soil.
Agronomy 09 00485 g0a1
Table A1. Plant available nutrient composition in soil samples used for the establishment of the experiment (soil type: fluvisol; soil subtype: modal; textural class: sandy loam) and in organic fertilizers.
SamplePlant Available Nutrient Content (mg/kg)K:Mg
PKCaMg
Arable soil14637037031871.9
Arable soil + CBD565642211,23512555.1
Arable soil + CVER8553475610024073.9
LAD 270004-
Comment: Contents of individual plant available nutrients were determined according to Mehlich et al. (1984) [59] and Zbíral et al. (2016) [60] except for LAD 27. Information about the fertilizer composition was provided by producer.

Appendix B

Illustration of the dependence (correlation) between the selected parameters
Figure A2. Scatter plot of correlation analysis results. Strong positive correlation (R = 0.79) between dehydrogenase activity and hydrolysis of fluorescein diacetate.
Agronomy 09 00485 g0a2
Figure A3. Scatter plot of correlation analysis results. Weak positive correlation (R = 0.58) between phosphatase activity and plant available phosphorus content in the soil.
Agronomy 09 00485 g0a3

References

  1. Bender, S.F.; Wagg, C.; van der Heijden, M.G. An underground revolution: Biodiversity and soil ecological engineering for agricultural sustainability. Trends Ecol. Evol. 2016, 31, 440–452. [Google Scholar] [CrossRef] [PubMed]
  2. Durigan, M.R.; Cherubin, M.R.; Camargo, P.B.; Ferreira, J.N.; Berenguer, E.; Gardner, T.A.; Barlow, J.; Dias, C.T.S.; Signor, D.; Oliveira, R.S., Jr.; et al. Soil organic matter responses to anthropogenic forest disturbance and land use change in the Eastern Brazilian Amazon. Sustainability 2017, 9, 379. [Google Scholar] [CrossRef]
  3. Pretty, J. Agricultural sustainability: Concepts, principles and evidence. Philos. Trans. R. Soc. B. Biol. Sci. 2008, 363, 447–465. [Google Scholar] [CrossRef] [PubMed]
  4. Sutton, M.A. The European Nitrogen Assessment: Sources, Effects and Policy Perspectives; Cambridge University Press: New York, NY, USA, 2011. [Google Scholar]
  5. Tisdall, J.M.; Oades, J.M. Organic matter and water-stable aggregates in soils. J. Soil Sci. 1982, 33, 141–163. [Google Scholar] [CrossRef]
  6. White, R.E. Principles and Practice of Soil Science: The Soil as a Natural Resource; John Wiley & Sons Ltd.: Bognor Regis, UK, 2013; p. 384. [Google Scholar]
  7. Harrison-Kirk, T.; Beare, M.H.; Meenken, E.D.; Condron, L.M. Soil organic matter and texture affect responses to dry/wet cycles: Changes in soil organic matter fractions and relationships with C and N mineralization. Soil Biol. Biochem. 2014, 74, 50–60. [Google Scholar] [CrossRef]
  8. Johnston, A.E.; Poulton, P.R.; Coleman, K. Soil Organic Matter: Its importance in sustainable agriculture and carbon dioxide fluxes. Adv. Agron. 2009, 101, 1–57. [Google Scholar]
  9. Maková, J. The Influence of Fertilization on Selected Indicators of Soil Quality and Health; Slovak University of Agriculture: Nitra, Slovakia, 2015. [Google Scholar]
  10. Tan, K.M. Humic Matter in Soil and the Environment: Principles and Controversies, 2rd ed.; CRC Press: Boca Raton, FL, USA, 2014. [Google Scholar]
  11. Adamcová, D.; Vaverková, M. Does composting of biodegrable municipal solid waste on the landfill body make sense? J. Ecol. Eng. 2016, 17, 30–37. [Google Scholar] [CrossRef]
  12. Paul, E.A. Soil Microbiology, Ecology and Biochemistry, 4rd ed.; Academic Press: Waltham, MA, USA, 2015. [Google Scholar]
  13. Hussain, K.; Arif, M.; Anwar-ul-Haq, M.; Hussain, T.; Nasim, M. Compost for growing plants by applying em-biofertilizer. Pak. J. Agric. Sci. 2007, 44, 434–442. [Google Scholar]
  14. Tejada, M.; García-Martínez, A.M.; Parrado, J. Effects of a vermicompost composted with beet vinasse on soil properties, soil losses and soil restoration. Catena 2009, 77, 238–247. [Google Scholar] [CrossRef]
  15. Mendoza-Hernández, D.; Fornes, F.; Belda, R.M. Compost and vermicompost of horticultural waste as substrates for cutting rooting and growth of rosemary. Sci. Hortic. 2014, 178, 192–202. [Google Scholar] [CrossRef]
  16. Yang, L.; Zhao, F.; Chang, Q.; Li, T.; Li, F. Effects of vermicomposts on tomato yield and quality and soil fertility in greenhouse under different soil water regimes. Agric. Water Manag. 2015, 160, 98–105. [Google Scholar] [CrossRef]
  17. Doran, J.W.; Zeiss, M.R. Soil health and sustainability: Managing the biotic component of soil quality. Appl. Soil Ecol. 2000, 15, 3–11. [Google Scholar] [CrossRef]
  18. De la Rosa, D.; Sobral, R. Soil quality and methods for its assessment. In Land Use and Soil Resources, 1st ed.; Braimoh, A.K., Vlek, P.L.G., Eds.; Springer: Dordrecht, The Netherlands, 2008; pp. 167–200. [Google Scholar]
  19. Benintende, S.; Benintende, M.; Sterren, M.; Saluzzio, M.; Barbagelata, P. Biological variables as soil quality indicators: Effect of sampling time and ability to classify soils by their suitability. Ecol. Indic. 2015, 52, 147–152. [Google Scholar] [CrossRef]
  20. Stone, D.; Ritz, K.; Griffiths, B.G.; Orgiazzi, A.; Creamer, R.E. Selection of biological indicators appropriate for European soil monitoring. Appl. Soil Ecol. 2015, 97, 12–22. [Google Scholar] [CrossRef]
  21. Mbuthia, L.W.; Acosta-Martinez, V.; Debryun, J.; Schaeffer, S.M.; Tyler, D.; Odoi, E.; Mpheshea, M.; Walker, F.; Eash, N. Long term tillage, cover crop, and fertilization effects on microbial community structure, activity: Implications for soil quality. Soil Biol. Biochem. 2015, 89, 24–34. [Google Scholar] [CrossRef]
  22. Dick, R.P. Soil enzyme activities as integrative indicators of soil health. In Biological Indicators of Soil Health, 1st ed.; Pankhurst, C.E., Doube, B.M., Gupta, V.S., Eds.; CAB International: Wallingford, UK, 1997; pp. 121–156. [Google Scholar]
  23. Sparling, G.P. Soil microbial biomass, activity and nutrient cycling as indicators of soil health. In Biological Indicators of Soil Health, 1st ed.; Pankhurst, C.E., Doube, B.M., Gupta, V.S., Eds.; CAB International: Wallingford, UK, 1997; pp. 97–119. [Google Scholar]
  24. Iovieno, P.; Morra, L.; Leone, A.; Pagano, L.; Alfani, A. Effect of organic and mineral fertilizers on soil respiration and enzyme activities of two Mediterranean horticultural soils. Biol. Fertil. Soils 2009, 45, 555–561. [Google Scholar] [CrossRef]
  25. Dykyjova, D. Methods for Studying Grassland Ecosystem (Metody Studia Travinných Ekosystémů); Nakladatelství Československé Akademie Věd: Praha, Czech Republic, 1989. (In Czech) [Google Scholar]
  26. International Organization for Standardization. Soil Quality—Determination of pH; ISO 10 390:2005; ISO: Geneva, Switzerland, 2005. [Google Scholar]
  27. Bremner, J.M. Nitrogen total. In Methods of Soil Analysis, Part 3: Chemical Methods, 1st ed.; Sparks, D.L., Ed.; Soil Science Society of America: Madison, WI, USA, 1996; pp. 1085–1121. [Google Scholar]
  28. Filcheva, E.C.; Tsadilas, C. Influence of cliniptilolite and compost on soil properties. Commun. Soil Sci. Plant Anal. 2002, 33, 595–607. [Google Scholar] [CrossRef]
  29. Bundy, L.G.; Meisinger, J.J. Nitrogen availability indices. In Methods of Soil Analysis, Part 2: Biochemical and Microbiological Properties, 1st ed.; Weaver, R.W., Ed.; Soil Science Society of America: Madison, WI, USA, 1994; pp. 981–984. [Google Scholar]
  30. Muñoz-Huerta, R.F.; Guevara-Gonzalez, R.G.; Contreras-Medina, L.M.; Torres-Pacheco, I.; Prado-Olivarez, J.; Ocampo-Velazquez, R.V. A Review of methods for sensing the nitrogen status in plants: Advantages, disadvantages and recent advances. Sensor 2013, 13, 10823–10843. [Google Scholar] [CrossRef]
  31. Šimek, M.; Virtanen, S.; Krištůfek, V.; Simojoki, A.; Yli-Halla, M. Evidence of rich microbial communities in the subsoil of a boreal acid sulphate soil conducive to greenhouse gas emissions. Agric. Ecosyst. Environ. 2011, 140, 113–122. [Google Scholar] [CrossRef]
  32. Casida, L.E.; Klein, D.A.; Santoro, T. Soil dehydrogenase activity. Soil Sci. 1964, 98, 371–376. [Google Scholar] [CrossRef]
  33. Green, V.S.; Stott, D.E.; Diack, M. Assay for fluorescein diacetate hydrolytic activity: Optimalization for soil samples. Soil Biol. Biochem. 2006, 38, 693–701. [Google Scholar] [CrossRef]
  34. Tabatabai, M.A.; Bremner, J.M. Use of p-nitrophenylphosphate for assay of soil phosphatase activity. Soil Biol. Biochem. 1969, 1, 301–307. [Google Scholar] [CrossRef]
  35. Vance, E.D.; Brookes, P.C.; Jenkinson, D.C. An extraction method for measuring soil microbial biomass. Soil Biol. Biochem. 1987, 19, 703–707. [Google Scholar] [CrossRef]
  36. Bloem, J.; Schouten, A.J.; Sørensen, S.J.; Rutgers, M.; Van der Werf, A.; Breure, A.M. Microbiological methods for assessing soil quality. In Monitoring and Evaluating Soil Quality; Bloem, J., Benedetti, A., Hopkins, D.W., Eds.; CAB International: Wallingford, UK, 2006; pp. 23–49. [Google Scholar]
  37. Creamer, R.E.; Schulte, R.P.O.; Stone, D.; Gal, A.; Krogh, P.H.; Lo Pap, G.; Murray, P.J.; Péres, G.; Foerster, B.; Rutgers, M.; et al. Measuring basal soil respiration across Europe: Do incubation temperature and incubation period matter? Ecol. Indic. 2014, 36, 409–418. [Google Scholar] [CrossRef]
  38. Tian, W.; Wang, L.; Li, Y.; Zhuang, K.; Li, G.; Zhang, J.; Xiao, X.; Yungan, X. Responses of microbial activity, abundance, and community in wheat soil after three years of heavy fertilization with manure-based compost and inorganic nitrogen. Agric. Ecosyst. Environ. 2015, 213, 219–227. [Google Scholar] [CrossRef]
  39. Abujabhah, I.S.; Bound, A.S.; Doyle, R.; Bowamn, J.P. Effects of biochar and compost amendments on soil physico-chemical properties and the total community within a temperate agricultural soil. Appl. Soil Ecol. 2016, 98, 243–253. [Google Scholar] [CrossRef]
  40. Geisseler, D.; Horwath, W.R.; Joergensen, R.G.; Ludwig, B. Pathways of nitrogen use by soil microorganisms—A review. Soil Biol. Biochem. 2010, 42, 2058–2067. [Google Scholar] [CrossRef]
  41. Aira, M.; Domíngues, J. Substrate-induced respiration as a measure of microbial biomass in vermicomposting studies. Bioresour. Technol. 2010, 101, 7173–7176. [Google Scholar] [CrossRef] [PubMed]
  42. Holz, M.; Zarebanadkouki, M.; Kaestner, A.; Kuzyakov, Y.; Carminati, A. Rhizodeposition under drought is controlled by root growth rate and rhizosphere water content. Plant Soil 2018, 423, 429–442. [Google Scholar] [CrossRef]
  43. Wang, X.; Tang, C.; Severi, J.; Butterly, C.R.; Baldock, J.A. Rhizosphere priming effect on soil organic carbon decomposition under plant species differing in soil acidification and root exudation. New Phytol. 2016, 211, 864–873. [Google Scholar] [CrossRef]
  44. Zhang, X.; Dong, W.; Dai, X.; Schaeffer, S.; Yang, F.; Radosevich, M.; Xu, L.; Liu, X.; Sun, X. Responses of absolute and specific soil enzyme activities to long term additions of organic and mineral fertilizer. Sci. Total Environ. 2015, 536, 59–67. [Google Scholar] [CrossRef] [PubMed]
  45. Huang, K.; Li, F.; Wei, Y.; Chen, X.; Fu, X. Changes of bacterial and fungal community compositions during vermicomposting of vegetable wastes by Eisenia foetida. Bioresour. Technol. 2013, 150, 241–253. [Google Scholar] [CrossRef] [PubMed]
  46. Nikaeen, M.; Nafez, A.H.; Bina, B.; Nabavi, B.F.; Hassanzadeh, A. Respiration and enzymatic activities as indicators of stabilization of sewage sludge composting. Waste Manag. 2015, 39, 104–110. [Google Scholar] [CrossRef] [PubMed]
  47. Sadet-Bourgeteau, S.; Houot, S.; Dequiedt, S.; Nowak, V.; Tardy, V.; Terrat, S.; Montenach, D.; Mercier, V.; Karimi, B.; Prévost-Bouréa, N.C.; et al. Lasting effect of repeated application of organic waste products on microbial communities in arable soils. Appl. Soil Ecol. 2018, 125, 278–287. [Google Scholar] [CrossRef]
  48. Komilis, D.; Kontou, I.; Ntougias, S. A modified static respiration assay and its relationship with an enzymatic test to assess compost stability and maturity. Bioresour. Technol. 2011, 102, 5863–5872. [Google Scholar] [CrossRef] [PubMed]
  49. Saha, S.; Mina, B.L.; Gopinath, K.A.; Kundu, S.; Gupta, H.S. Relative changes in phosphatase activities as influenced by source and application rate of organic composts in field crops. Bioresour. Technol. 2008, 99, 1750–1757. [Google Scholar] [CrossRef] [PubMed]
  50. Piotrowska-Długosz, A.; Wilczewski, E. Soil phosphatase activity and phosphorus content as influenced by catch crops cultivated as green manure. Pol. J. Environ. Stud. 2014, 23, 157–165. [Google Scholar]
  51. Lemanowicz, J.; Bartkowiak, A.; Breza-Boruta, B. Changes in phosphorus content, phosphatase activity and some physicochemical and microbiological parameters of soil within the range of impact of illegal dumping sites in Bydgoszcz (Poland). Environ. Earth Sci. 2016, 75, 510. [Google Scholar] [CrossRef]
  52. Jakubus, M. Estimation of phosphorus bioavailability from composted organic wastes. Chem. Speciat. Bioavailab. 2016, 28, 189–198. [Google Scholar] [CrossRef] [Green Version]
  53. Garg, S.; Bahl, G.S. Phosphorus availability to maize as influenced by organic manures and fertilizer P associated phosphatase activity in soils. Bioresour. Technol. 2008, 99, 5773–5777. [Google Scholar] [CrossRef]
  54. Horta, C.; Roboredo, M.; Carneiro, J.P.; Duarte, A.C.; Torrent, J.; Sharpley, A. Organic amendments as a source of phosphorus: Agronomic and environmental impact of different animal manures applied to an acid soil. Arch. Agron. Soil Sci. 2018, 64, 257–271. [Google Scholar] [CrossRef]
  55. Bedada, W.; Lemenih, M.; Karltun, E. Soil nutrient build-up, input interaction effects and plot level N and P balances under long-term addition of compost and NP fertilizer. Agric. Ecosyst. Environ. 2016, 218, 220–231. [Google Scholar] [CrossRef]
  56. Atiyeha, R.M.; Sublera, S.; Edwards, C.A.; Bachman, G.; Metzger, J.D.; Shustera, W. Effects of vermicomposts and composts on plant growth in horticultural container media and soil. Pedobiologia 2000, 44, 579–590. [Google Scholar] [CrossRef] [Green Version]
  57. Moreno, B.; Vivas, A.; Nogales, R.; Macci, C.; Masciandaro, G.; Benitez, E. Restoring biochemical activity and bacterial diversity in a trichloroethylene-contaminated soil: The reclamation effect of vermicomposted olive wastes. Environ. Sci. Pollut. Res. 2009, 16, 253–264. [Google Scholar] [CrossRef]
  58. Diaz, L.F.; Bertoldi, M.; Bidlingmaier, W. Compost Science and Technology; Elsevier: Boston, NL, USA, 2007; p. 380. [Google Scholar]
  59. Mehlich, A. Mehlich III soil test extractant. Commun. Soil Sci. Plant Anal. 1984, 15, 1409–1416. [Google Scholar] [CrossRef]
  60. Zbíral, J.; Honsa, I.; Malý, S.; Váňa, M. Unified Techniques—Analysis of Soils I, 4th ed.; Central Institute for Supervising and Testing in Agriculture: Brno, Czech Republic, 2016; pp. 68–74. [Google Scholar]
Figure 1. Location of sampling points (1—green; 2—red; 3—yellow) in the Czech Republic.
Agronomy 09 00485 g001
Figure 2. Basal respiration (BS) and substrate induced respiration (SIR). Error bars indicate standard deviation, n = 3 (ANOVA; p < 0.05). Different lower case letters indicate HSD in BS and different upper case letters indicate HSD in SIR between individuals variants.
Agronomy 09 00485 g002
Figure 3. Content of microbial carbon (Cmic) in the soil samples before and after the experiment. Error bars indicate standard deviation, n = 3 (ANOVA; p < 0.05).
Agronomy 09 00485 g003
Figure 4. Dehydrogenase activity in the soil samples before the establishment and after the end of the experiment. Error bars indicate standard deviation, n = 3 (ANOVA; p < 0.05).
Agronomy 09 00485 g004
Figure 5. Hydrolysis of fluorescein diacetate (FDA) in the soil samples before and after the experiment. Error bars indicate standard deviation, n = 3 (ANOVA; p < 0.05).
Agronomy 09 00485 g005
Figure 6. Phosphatase activity (PA) in the soil samples before and after the experiment. Error bars indicate standard deviation, n = 3.
Agronomy 09 00485 g006
Table 1. Overview of the laboratory experiment.
Treatment No.CharacteristicsDose of Fertilizers (Mg/ha)
1Control without fertilizers0
2CVER40
3CBD40
4Combination of LAD 27 and CVER0.11 + 20
5LAD 270.22
6Double dose of CVER80
Table 2. Selected chemical and physical properties: pH, Cox and Ntot content in soil samples (soil type: fluvisol; soil subtype: modal; textural class: sandy loam) and in organic fertilizers used for the establishment of the experiment.
SamplepH (CaCl2)Cox
[mg·kg−1]
Ntot
[mg·kg−1]
Ninorg
[mg·kg−1]
C/N
Soil5.6210.301.4116.107.3
CBD8.06158.3115.0033.6710.6
CVER7.91132.5614.8637.958.9
LAD--270270-
Table 3. Statistical analysis of determined microbial carbon (Cmic) in the soil samples
Treatment No.Dose of FertilizerHSD (p < 0.05)
Sampling 1Sampling 2S1 vs S2
10 – controlbb*
2CVER 40 Mg/haab*
3CBD 40 Mg/habb-*
4LAD + CVER (0.11 + 20 Mg/ha)ba-
5LAD 0.22 Mg/haaa*
6CVER 80 Mg/habc*
Comment: Different low case letters indicate significant differences (Tukey´s post-hoc HSD test at p < 0.05) in the content of Cmic between the respective variants in Sampling 1 and Sampling 2. Differences (paired t-test at p < 0.05) in Cmic between the sampling dates in the respective variants are marked with an asterisk *.
Table 4. Statistical analysis of determined dehydrogenase activity (DHA) in the soil samples.
Treatment No.Dose of FertilizerHSD (p < 0.05)
Sampling 1Sampling 2S1 vs S2
10 – controlbb*
2CVER 40 Mg/haac-
3CBD 40 Mg/haa,bb,c-
4LAD + CVER (0.11 + 20 Mg/ha)a,bb*
5LAD 0.22 Mg/haaa*
6CVER 80 Mg/haa,bb,c
Comment: Different lower case letters indicate significant differences (Tukey´s post-hoc HSD test at p < 0.05) in DHA between the respective variants within Sampling 1 and Sampling 2. Differences (paired t-test at p < 0.05) in DHA between sampling dates in the respective variants are marked with asterisk *.
Table 5. Statistical analysis of determined hydrolysis of fluorescein diacetate (FDA) in the soil samples.
Treatment No.Dose of FertilizerHSD (p < 0.05)
Sampling 1Sampling 2S1 vs S2
10 – controla,bb-
2CVER 40 Mg/haac*
3CBD 40 Mg/haa,bb,c-
4LAD + CVER (0.11 + 20 Mg/ha)a,bb-
5LAD 0.22 Mg/hab,ca*
6CVER 80 Mg/hacb*
Comment: Different lower case letters indicate significant differences (Tukey´s post-hoc HSD test at p < 0.05) in FDA between the respective variants in Sampling 1 and Sampling 2. Differences (paired t-test at p < 0.05) in FDA between the sampling dates in the respective variants are marked with asterisk *.
Table 6. Statistical analysis of determined phosphatase activity (PA) in the soil samples.
Treatment No.Dose of FertilizerHSD (p < 0.05)
Sampling 1Sampling 2S1 vs S2
10 – controlcb,c*
2CVER 40 Mg/hacc*
3CBD 40 Mg/hab,cc*
4LAD + CVER (0.11 + 20 Mg/ha)bd-
5LAD 0.22 Mg/haaa-
6CVER 80 Mg/haad*
Comment: Different lower case letters indicate significant differences (Tukey´s post-hoc HSD test at p < 0.05) in PA. Significant differences (paired t-test at p < 0.05) in PA between the sampling dates in the respective variants are marked with asterisk *.
Table 7. Content of soil phosphorus available to plants after the end of the experiment.
Treatment No.Dose of FertilizerP
mg/kg±SDHSD
(p < 0.05)
10 – control1443.47a
2CVER 40 Mg/ha1694.66b,c
3CBD 40 Mg/ha1601.87b
4LAD + CVER (0.11 + 20 Mg/ha)1582.69a,b
5LAD 0.22 Mg/ha1533.85a,b
6CVER 80 Mg/ha1791.87c
Comment: Different low case letters indicate significant differences (Tukey´s post-hoc HSD test at p < 0.05) in the content of phosphorus available to plants.
Table 8. Production of aboveground plant biomass.
Treatment No.Dose of FertilizerPlant Biomass
Mg/ha±SDHSD
(p < 0.05)
10 – control7.980.45c
2CVER 40 Mg/ha10.010.72a,b
3CBD 40 Mg/ha8.820.77b
4LAD + CVER (0.11 + 20 Mg/ha)8.090.31c
5LAD 0.22 Mg/ha8.440.61b
6CVER 80 Mg/ha9.540.98b
Comment: Different low case letters indicate significant differences (Tukey´s post-hoc HSD test at p < 0.05) in the plant biomass production.

