Article

Developing and Implementation of Decision Support System (DSS) for the Control of Olive Fruit Fly, Bactrocera Oleae, in Mediterranean Olive Orchards

1
Applied Zoology and Animal Conservation Research Group, University of the Balearic Islands, INAGEA-UIB, 07122 Palma, Spain
2
Grupo de Sistemas Electrónicos, Departamento de Física, University of the Balearic Islands, 07122 Palma, Spain
3
Servicio de Sistemas de Información Geográfica y Teledetección, University of the Balearic Islands, 07122 Palma, Spain
4
Department of Entomology, Institute of Plant Protection, ARO, Rishon Letzion 7528809, Israel
5
Laboratory of Entomology and Agricultural Zoology, Department of Agriculture Crop Production and Rural Environment, University of Thessaly, Fytokou st., 38446 N. Ionia (Volos), Greece
6
Department of Agriculture, Environmental and Food Sciences, University of Molise, via De Sanctis – 86100 Campobasso, Italy
*
Author to whom correspondence should be addressed.
Agronomy 2019, 9(10), 620; https://doi.org/10.3390/agronomy9100620
Submission received: 30 August 2019 / Revised: 30 September 2019 / Accepted: 5 October 2019 / Published: 9 October 2019
(This article belongs to the Special Issue Information Technologies for Precision Plant and Crop Protection)

Abstract

:
Modern agriculture requires technology to give precise measures about relevant parameters such as pest control. Here, we developed a decision support system (DSS) based on semi-automatic pest monitoring for managing the olive fruit fly Bactrocera oleae (Rossi), in Mallorca (Balearic Islands, Spain). The DSS was based on an algorithm that took into account spatial and temporal patterns of olive fruit fly population in an orchard where all trees were georeferenced, thus precise treatments against the pest were conducted through a location aware system (LAS). The olive fruit fly adult population was monitored by using ad hoc off-the-grid autonomous electronic traps.The results were compared with those obtained with conventional methods. For a pilot trial, we selected an olive-producing orchard, where from June to October 2015, three plots using LAS management and three plots under conventional control (NO-LAS plots) were compared. Spray threshold considered both adult population and fruit damage. An additional non-sprayed plot was selected for assessing biological control due to the parasitoid, Psyttalia concolor (Szépligeti). Results showed that the use of DSS reduced by 36.84% the volume of insecticide used in LAS compared to NO-LAS plots. Accordingly, time and distance needed for spraying were also reduced. Adult olive fruit fly population was lower in the LAS plots when compared with the NO-LAS plots; conversely, fruit infestation was higher in LAS compared with NO-LAS. The implementation of LAS and DSS at field level allowed real-time monitoring of adult olive flies, thereby increasing the accuracy and precision of sprays in time and space and decreasing impact on natural enemies.

1. Introduction

Precision agriculture (PA) is defined as the use of technology at field level that allows to obtain more precise and accurate parameters when compared with conventional methods. The use of sensors and automated real-time computer processing for decisions are considered key issues for the implementation of successful PA [1]. Plant pest control is still one of the cornerstones of modern agriculture, as it is included in the integrated pest management concept first introduced by Stern et al. in 1959 [2]. The general use of insecticides at field level is still the most common practice for plant pest control, and in many cases, for fruit flies [3]. However, its use is being restricted year by year by official authorities due to its impact on the environment, human health, and the development of resistance in targeted pest. The use of PA for pest control has been applied to improve the control and/or detection of several pests. For example, spatially sensitive maps are used to drive a spatially variable insecticide application for the control cotton insect pests [4], hyperspectral imaging is used for detecting fruit fly infestation of mangos [5], and GIS technologies are applied to models to develop more accurate decisions about medfly insecticide treatments in Israel [6]. In addition, monitoring of a pest by using automatic monitoring of the pest (e.g., electronic traps) leads to more accurate information about the abundance of the targeted pest, and when geolocated, to a better understanding of the spatial and temporal distribution of the pest. In fact, quick access to time-sensitive information for pest control is a key issue in relation to pest and disease management [7]. Electronic systems are nowadays being developed for different plant pest species. Electronic traps (e-traps) can significantly reduce labor cost for monitoring, in particular for key pest species such as the Asian citrus psyllid, a key pest acting as vector of huanglongbing disease [8] or time-consuming identification species such as moths [9]. In the case of fruit flies (Tephritidae), several electronic traps used in PA management systems have been developed. For example, there are several trap prototypes available for Ceratitis iliates (Weidmann) [10,11], Rhagoletis cerasi L., and Dacus iliates Loew [11], as well as Bactrocera dorsalis (Hendel) [12] and B. oleae [13].
The parameters obtained from e-traps can also be integrated in a decision support system (DSS). The DSS consists of a computer-assisted algorithm that integrates different parameters to support farmers on taking a decision based on information obtained either by conventional or precision agriculture methods [6,14,15].
In the framework of the ENPI project (ENPI CBC Mediterranean Sea Basin Programme FruitFlyNet Project), a DSS based on the location aware system (LAS) developed by Pontikakos et al. (2010) in Greece [14], was applied for managing the olive fruit fly Bactrocera oleae (Rossi), one of the most harmful pests in olive orchards. The olive fly is a monophagous endemic species of the Mediterranean basin with origin in Africa; it develops in wild and cultivated olives (Olea europaea L.) and has invaded other areas were olive crops are present such as the USA, Central America, and South America [16]. Three Mediterranean countries are still the main world producers of olives: Spain (61.6%), Italy (21.1%), and Greece (13.5%) [17]. The main damage caused by the olive fly is produced at the fruit level, when females usually lay a single egg that hatches within 2–4 days and the larva develops feeding on the mesocarp of the olive during 10–14 days [18]. This leads to a total depreciation of the price of table olives, due to premature fruit dropping and damage of the skin of fruits due to olive fly oviposition. In addition, piercing of fruits by the ovipositor favors infections due to bacteria and fungi that cause acidification of the olive oil, diminishing its qualitative properties and market price [18,19]. If not controlled, fruit damage due to the olive fly can reach up to 90–100% [20].
Current control methods for the olive fly are based on monitoring adult flies by different sorts of traps (e.g., McPhail, yellow sticky traps, and others) as well as assessing fruit infestation for decision making on spraying against the pest [3,21]. Other methods such as mass trapping using low-cost traps (i.e., Olipe) are also frequent in countries with large olive-producing orchards (e.g., Spain) [22,23]. Attractants for adult olive fly are based on the female sex pheromone (i.e., Spiroketal) for attracting males and ammonia-based solid or liquid lures (e.g., hydrolyzed proteins) for females [23,24,25,26]. In Spain, a national monitoring program was developed in the 1980s (Red Dacus), where extensive monitoring was conducted using conventional traps (e.g., McPhail glass trap and yellow sticky panels) and attractants [17,27] that, with the passage of time, were incorporating GIS technologies. Other initiatives that included monitoring of olive fly by using a georeferenced database are those found in Italy [28,29] and in Israel [30].
Both conventional adult and fruit infestation monitoring require frequent field visits for trap counting and fruit collection, respectively. In addition, insecticide treatments against adults are usually applied to the whole orchard in the form of localized bait sprays (i.e., hydrolyzed protein plus insecticide), not taking into consideration the spatial and temporal distribution of olive fly population in the plot and therefore, lack precision. Insecticides also have deleterious effects on non-target species that are biological controllers of the olive fly [31,32,33], such as Psyttalia concolor (Szépligeti) (Hymenoptera; Braconidae), a parasitoid introduced in Europe in the early 20th century and nowadays widely established in the Mediterranean basin.
Here, a DSS for managing the olive fruit was developed in the framework of a pilot field study. We tested the effectiveness of the DSS in terms of olive fly monitoring (comparing traditional vs. electronic traps), fruit infestation, and reduction of insecticide treatments against conventional management of the pest. The DSS was used to aid in decision making for spraying. The DSS integrated data on adult spatial and temporal abundance recorded from electronic traps as well as data on geolocation and fruit load of trees, fruit infestation, and environmental parameters such as temperature and relative humidity. All parameters allowed to implement the location aware system at field level to precisely locate when and where insecticide treatments were needed in the pilot area in comparison to conventional treatments.

2. Material and Methods
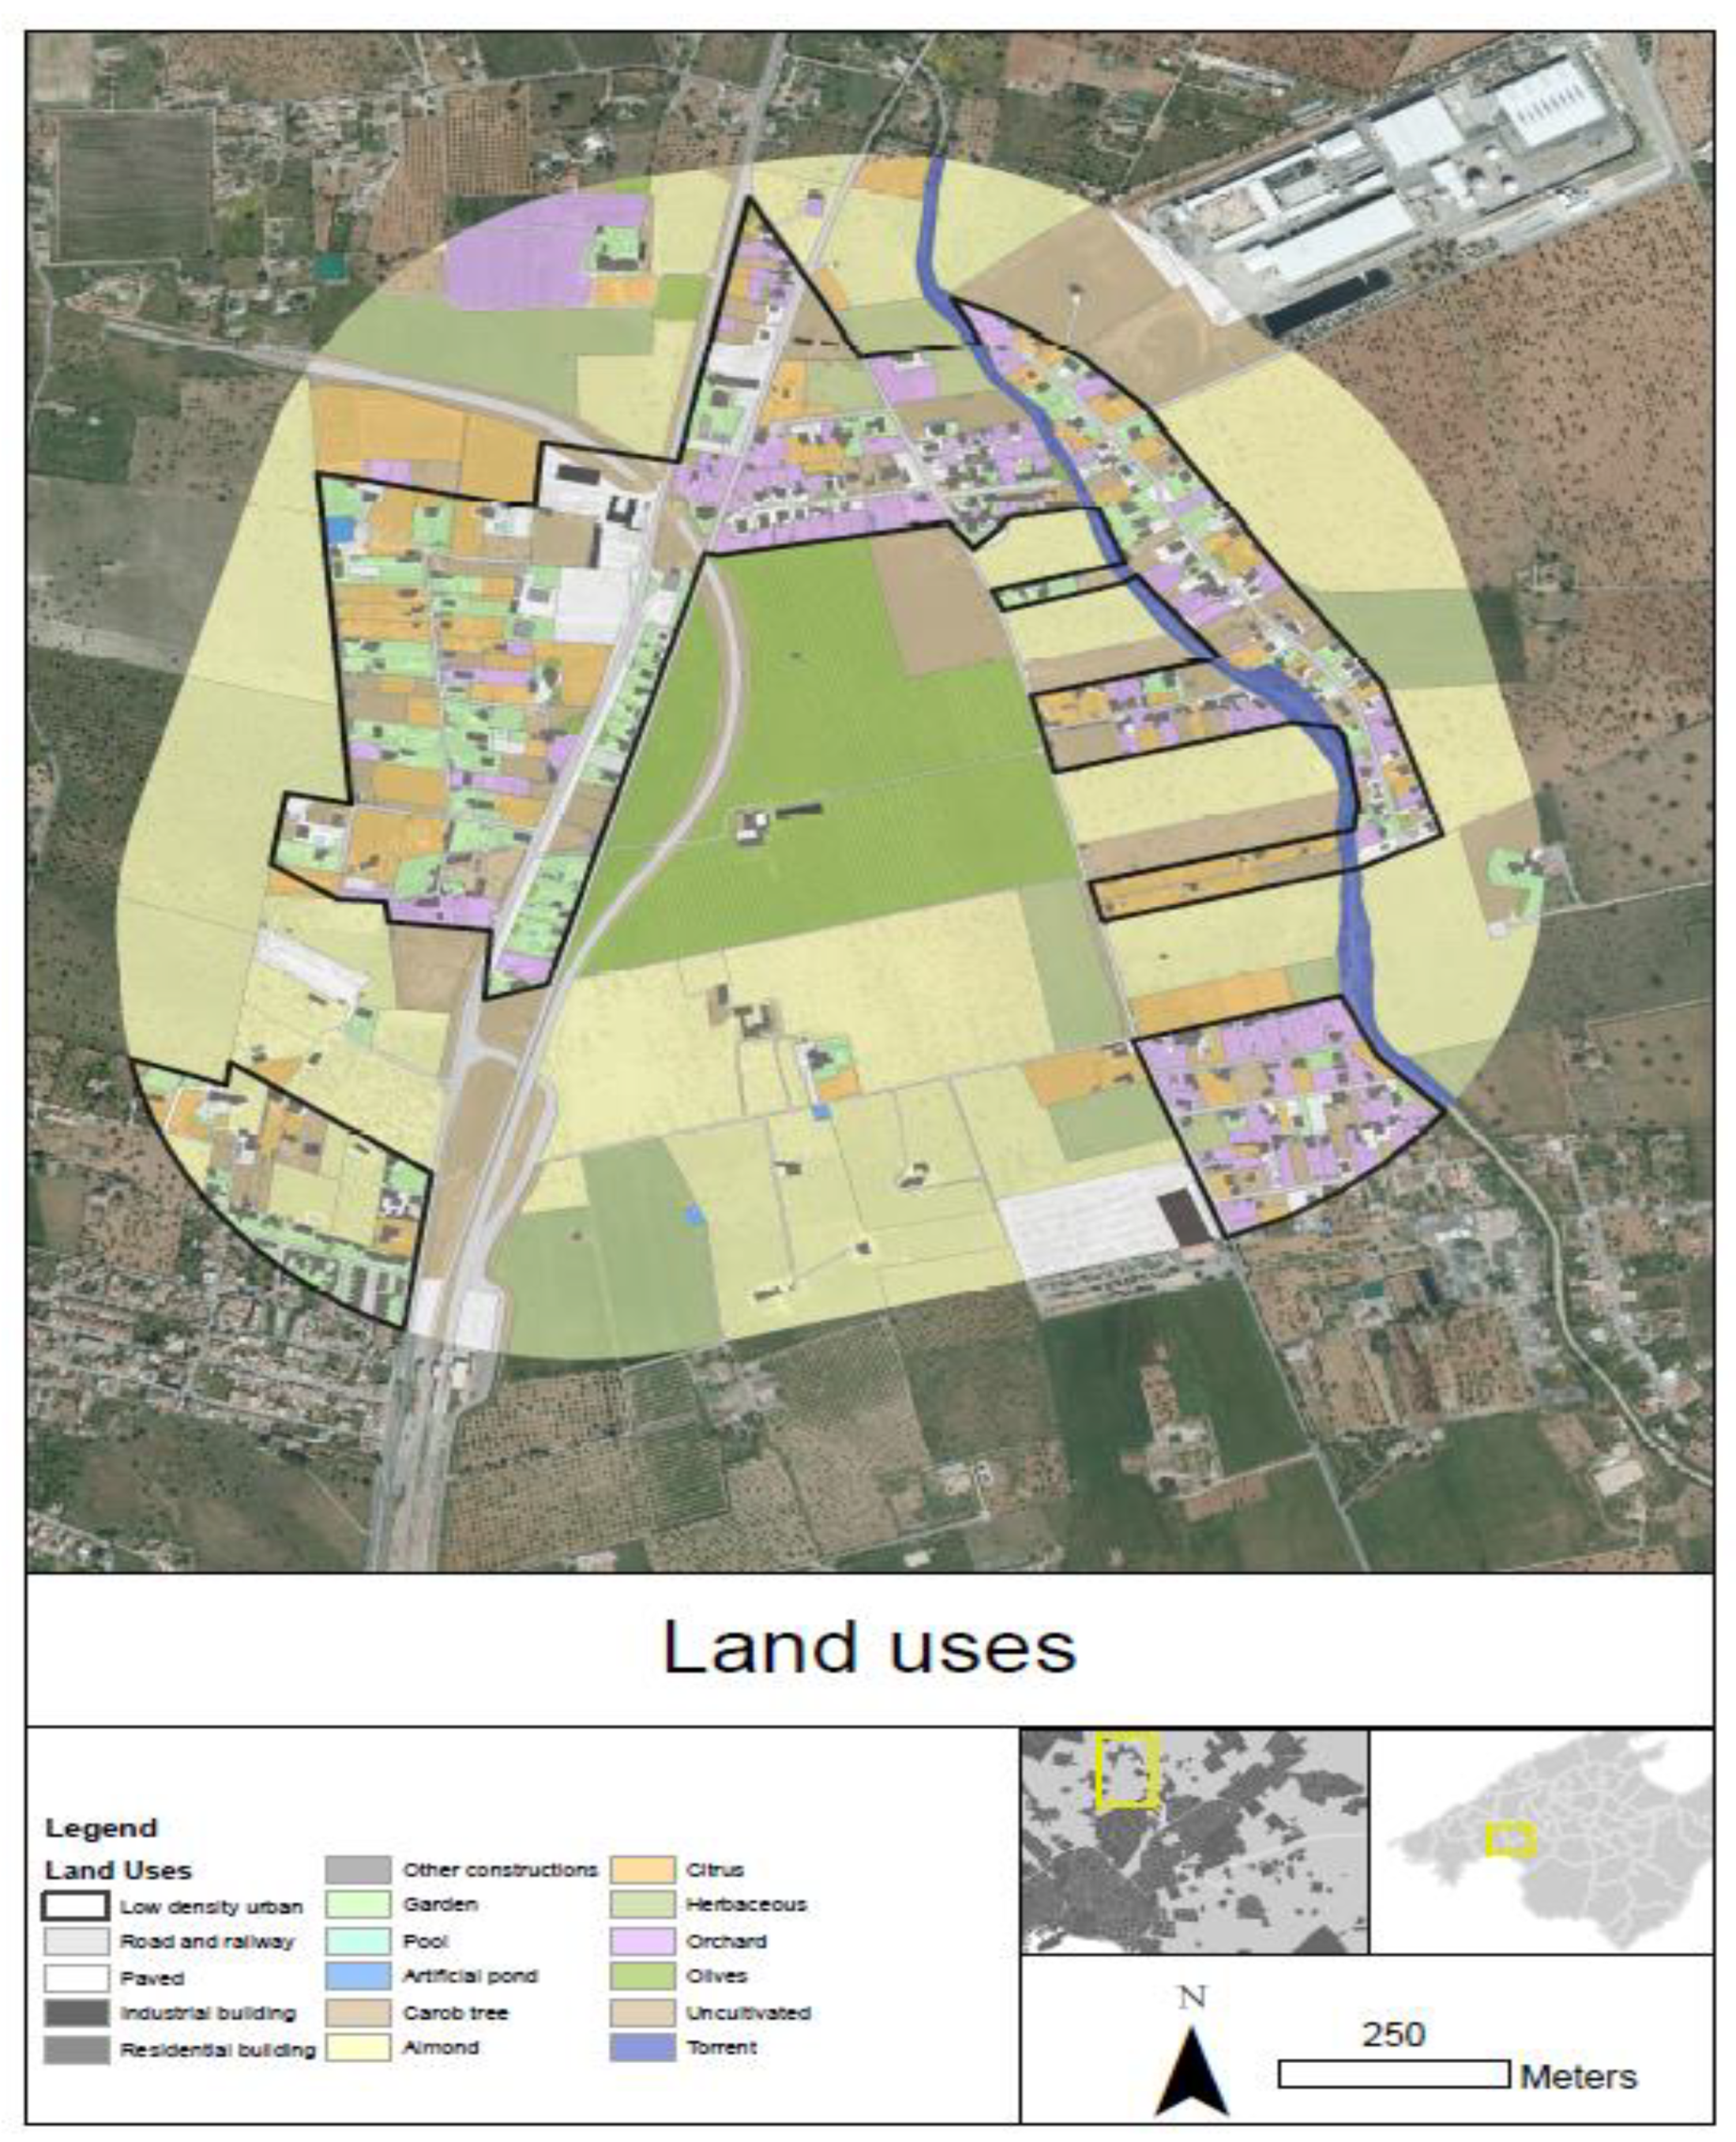
Study Site

We selected a 17.6 ha commercial olive-producing orchard named Son Llompart located in the municipality of Palma de Mallorca (Balearic Islands, Spain) (Figure 1). Trees are separated 7 × 7 m from each other and the most common varieties for olive oil production in the Balearics were present in different proportions, that is 60% of ‘Picual’, 39% of ‘Empeltre’, and <1% of ‘Arbequina’. The plantation is 14 years old and the land usage around the selected orchard is shown in Figure 2. The olive orchard is surrounded by some olive and citrus trees scattered in the area mainly associated with the backyard gardens. Almond crops are the most common in the area, while few spots of Olea europaea var. silvestris are found in the surroundings as well. These spots may have importance as a reservoir of olive fly after the commercial olive harvest; however, larvae are also heavily infested by parasitoids (i.e., Psyttalia concolor) and therefore, olive fly populations are usually less abundant than in commercial orchards [34].
In order to compare the control of the olive fly using the DSS and conventional system, we selected three plots of 1 ha each within the orchard where LAS was implemented. Varieties of olives found in each LAS plot are shown in Figure 1: LAS 1 and 3 comprised of ‘Picual’ and LAS 2 comprised of ‘Empeltre’ variety. Additionally, conventional control of the olive fly was conducted in three plots of 1 ha each selected within the orchard and named NO-LAS plots. Varieties of olives found in each NO-LAS plot are shown in Figure 1. NO-LAS 1 and 3 comprised of ‘Picual’ and NO-LAS 2 comprised of ‘Empeltre’ variety. Additionally, in order to assess the level of fruit damage by B. oleae and the level of biological control by the parasitoid P. concolor in the absence of insecticide sprays, we selected a control plot (Figure 1). Due to concerns of the owner about leaving larger areas of the orchard untreated, the control plot consisted only of 24 untreated trees (0.1 ha) where a conventional monitoring of adults was conducted.
The LAS areas were monitored by means of automatic electronic traps. Each trap equipped with a radio-frequency (RF) transceiver, which formed an ad hoc wireless sensor network (WSN). The WSN is based on Zigbee protocol which transfers the information via a low-rate, low-consumption communication channel. The topology in use by the WSN is of star type, i.e., all nodes transmit information to the coordinator node only. The coordinator node is responsible for automatically sent the collected information (temperature, humidity, and image-9 to the database server of the University of the Balearic Islands (UIB-RestFul web service). Then, an XML is sent automatically (SOAP WebService Fruitfly) updating the information at the main database of the FruitFlyNet project. The information collected by the WSN is sent following the structure shown in Figure 3. This structure constitutes a real-time insect counting system (ReTICS);
Each e-trap comprises of the following parts: A 15 W solar panel and a 12 V battery, a ZigBee RF (xBee S2B) transceiver able to have coordinator or end device role within the WSN [11,34], a Raspberry pi model B+ Linux-based platform controller (Raspberry Pi foundation, Cambridge, UK ), a camera (5 Mpx CMOS sensor Omnivision 5647; OmniVision technologies, Santa Clara, California, CA, USA ), 32 GB memory SD card, and a DHT22 temperature and humidity sensor (Adafruit industries, New York, NY, USA manufacturer, city, state abbreviation(USA), country). The diverse parts of the e-trap can be seen in Figure 4 [35]. The system was programmed to measure the temperature and humidity values each minute. All readings were reported to the UIB server, but only the maximum, minimum, and average values were transmitted on an hourly basis.
As a trapping system, the camera took one picture per day at noon (12:00 p.m.) of a Rimi® yellow sticky trap baited with 10 g of ammonium bicarbonate (Panreac®, Barcelona, Spain) packed in slow- releasing polyethylene sleeves and one vial of 20 mg of B. oleae sex pheromone (DACUSNEX®, Siscar - Santomera, Murcia, Spain) [11]. The Rimi® trap is regularly used in Israel to monitor olive flies [36]. All electronic components were installed in a watertight enclosure, while the camera and Rimi® trap were mounted in a metal frame. All these components were mounted to a 3 m metal pole attached firmly to the trunk. Position of the Rimi® trap and camera varied between 1.6 and 1.9 m height and were oriented to the southwest part of the trees.
In order to manage the LAS plots, a web application named OliveFlyNet was developed. In this application, the users were able to visualize all the data that was sent by e-traps or collected at field level (i.e., fruit load and damage) [37]. Information related to each tree as well as images of Rimi® traps sent by e-traps were accessible through the same application (Figure 5, Figure 6 and Figure 7).
Conventional monitoring of adults was performed by using McPhail traps (ECONEX®, Siscar - Santomera, Murcia, Spain) baited with 4% biammonium phosphate (Panreac®, Barcelona, Spain) that was replaced biweekly, and Rimi® yellow sticky traps baited with the same attractants as in the LAS plots. Two McPhail and two Rimi® traps were placed in each of the NO-LAS plots. Traps were placed in the southwest side of trees, at heights varying from 1.6 to 1.9 m above the ground.
An expert entomologist performed a comparison between field scouting and desktop analysis of the pictures obtained by the ReTIC system (Figure 7). A total of 10 scoutings were performed at the field and compared with the pictures obtained from the same e-traps at the same period. Since males and females could not be always distinguished in some images, the pilot study was conducted considering only the presence of adults (males plus females).
Monitoring of adults started on 2 June 2015 in NO-LAS and control plots by conducting weekly inspection of traps, while monitoring in LAS plots started on 27 August 2015. All monitoring continued until 28 October 2015 when harvesting period started. The position of all trees in the LAS plots were georeferenced. Data of canopy size, height, and fruit load per tree were also collected before the start of the pilot study. Fruit load was calculated on field using a scale of percentage (0, 10, 30, 50, 70, 80, and 90%) of the tree branches with fruits. Phenology of trees was estimated considering the size and color of fruits following the BBCH index according to [38]. To monitor fruit infestation, 25 fruits were weekly collected from five trees from LAS, NO-LAS, and control plots. Fruits were dissected for detecting damage such as oviposition punctures, larvae, pupae, and empty galleries due to larval feeding.
The DSS algorithm was implemented in the C-PLAS software (http://www.cplas.gr/) that estimated the risk according to olive fly abundance as well as other parameters detailed below. It was installed in handheld mobile devices (Trimble Juno® 5, Sunnyvale, USA). The decision to spray was based on the following parameters according to the designed DSS (Figure 8): Optimal temperature and relative humidity (HR) for olive fly development and activity (between 14 and 30 °C and >50% HR) [39]; variety and phenology of the tree (BBCH), mean of B. oleae adults (flies) per trap per day (FTD), non-fertile punctures on fruits, and percent of alive larvae (alive infestation) on fruits. Accordingly, spraying was decided when temperature and HR were optimal, the variety was highly susceptible (i.e., ‘Empeltre’), the phenology was optimal for oviposition (BBCH ≥ 75), B. oleae adults were FTD ≥ 5, and more than 2% of sampled fruits had alive larvae [40]. Data obtained from e-traps was interpolated and daily distribution maps were generated as a result, where temporal and spatial abundance of adult flies in LAS plots were shown. Accordingly, each tree from each LAS plot was assigned a risk value according to the DSS. Treatments were carried out at a node basis (electronic trap). When treatment decision was taken for one single node, all trees in 2500 m2 (0.25 ha) were treated. This was an assumption based on risk maps generated by C-PLAS software showing the abundance distribution of B. oleae by interpolating the information registered by the different nodes. Once decision to spray was taken according to the DSS, then a route for the tractor with sprayer was generated. Similarly, in the NO-LAS plots, spray was conducted when FTD ≥ 1 in case of McPhail traps, FTD ≥ 5 in case of Rimi® traps, and more than 2% of sampled fruits had alive larvae. In this case, cover sprays were conducted.
The selected insecticide against adults of B. oleae was Spintor-Cebo DOW® (Spinosad® 0.024%), and it was applied as 1 m2 bait sprays on the southwest canopy of trees. Spinosad is known to have little effect on non-targeted arthropods at field level [32] and in principle, little residual toxicity. Bait sprays were conducted in all trees in the NO-LAS plots when the treatment threshold was reached (FTD ≥ 1 for McPhail traps, FTD ≥ 5 for Rimi® traps, and >2% of fruits with alive larvae), while in the LAS plots treatments were performed only in the areas where the node-system indicated that spray was needed according to the risk values provided by the DSS (Figure 8). A tractor provided with a 100 L motor pump conducted all the treatments. Sprays procedures followed the standard recommendation for good practices. No automatized, but manual record of variables for spraying (i.e., volume, time start/stop, etc.,) was carried out.
The efficacy of LAS vs. NO-LAS was assessed in terms of reduction of the volume and duration of sprays to control olive fly as well as by comparing adult abundance (FTD) and fruit infestation (% fruit infestation). Statistical analysis was performed using SPSS Statistics 17.0 software (IBM, New York, NY, USA).

3. Results

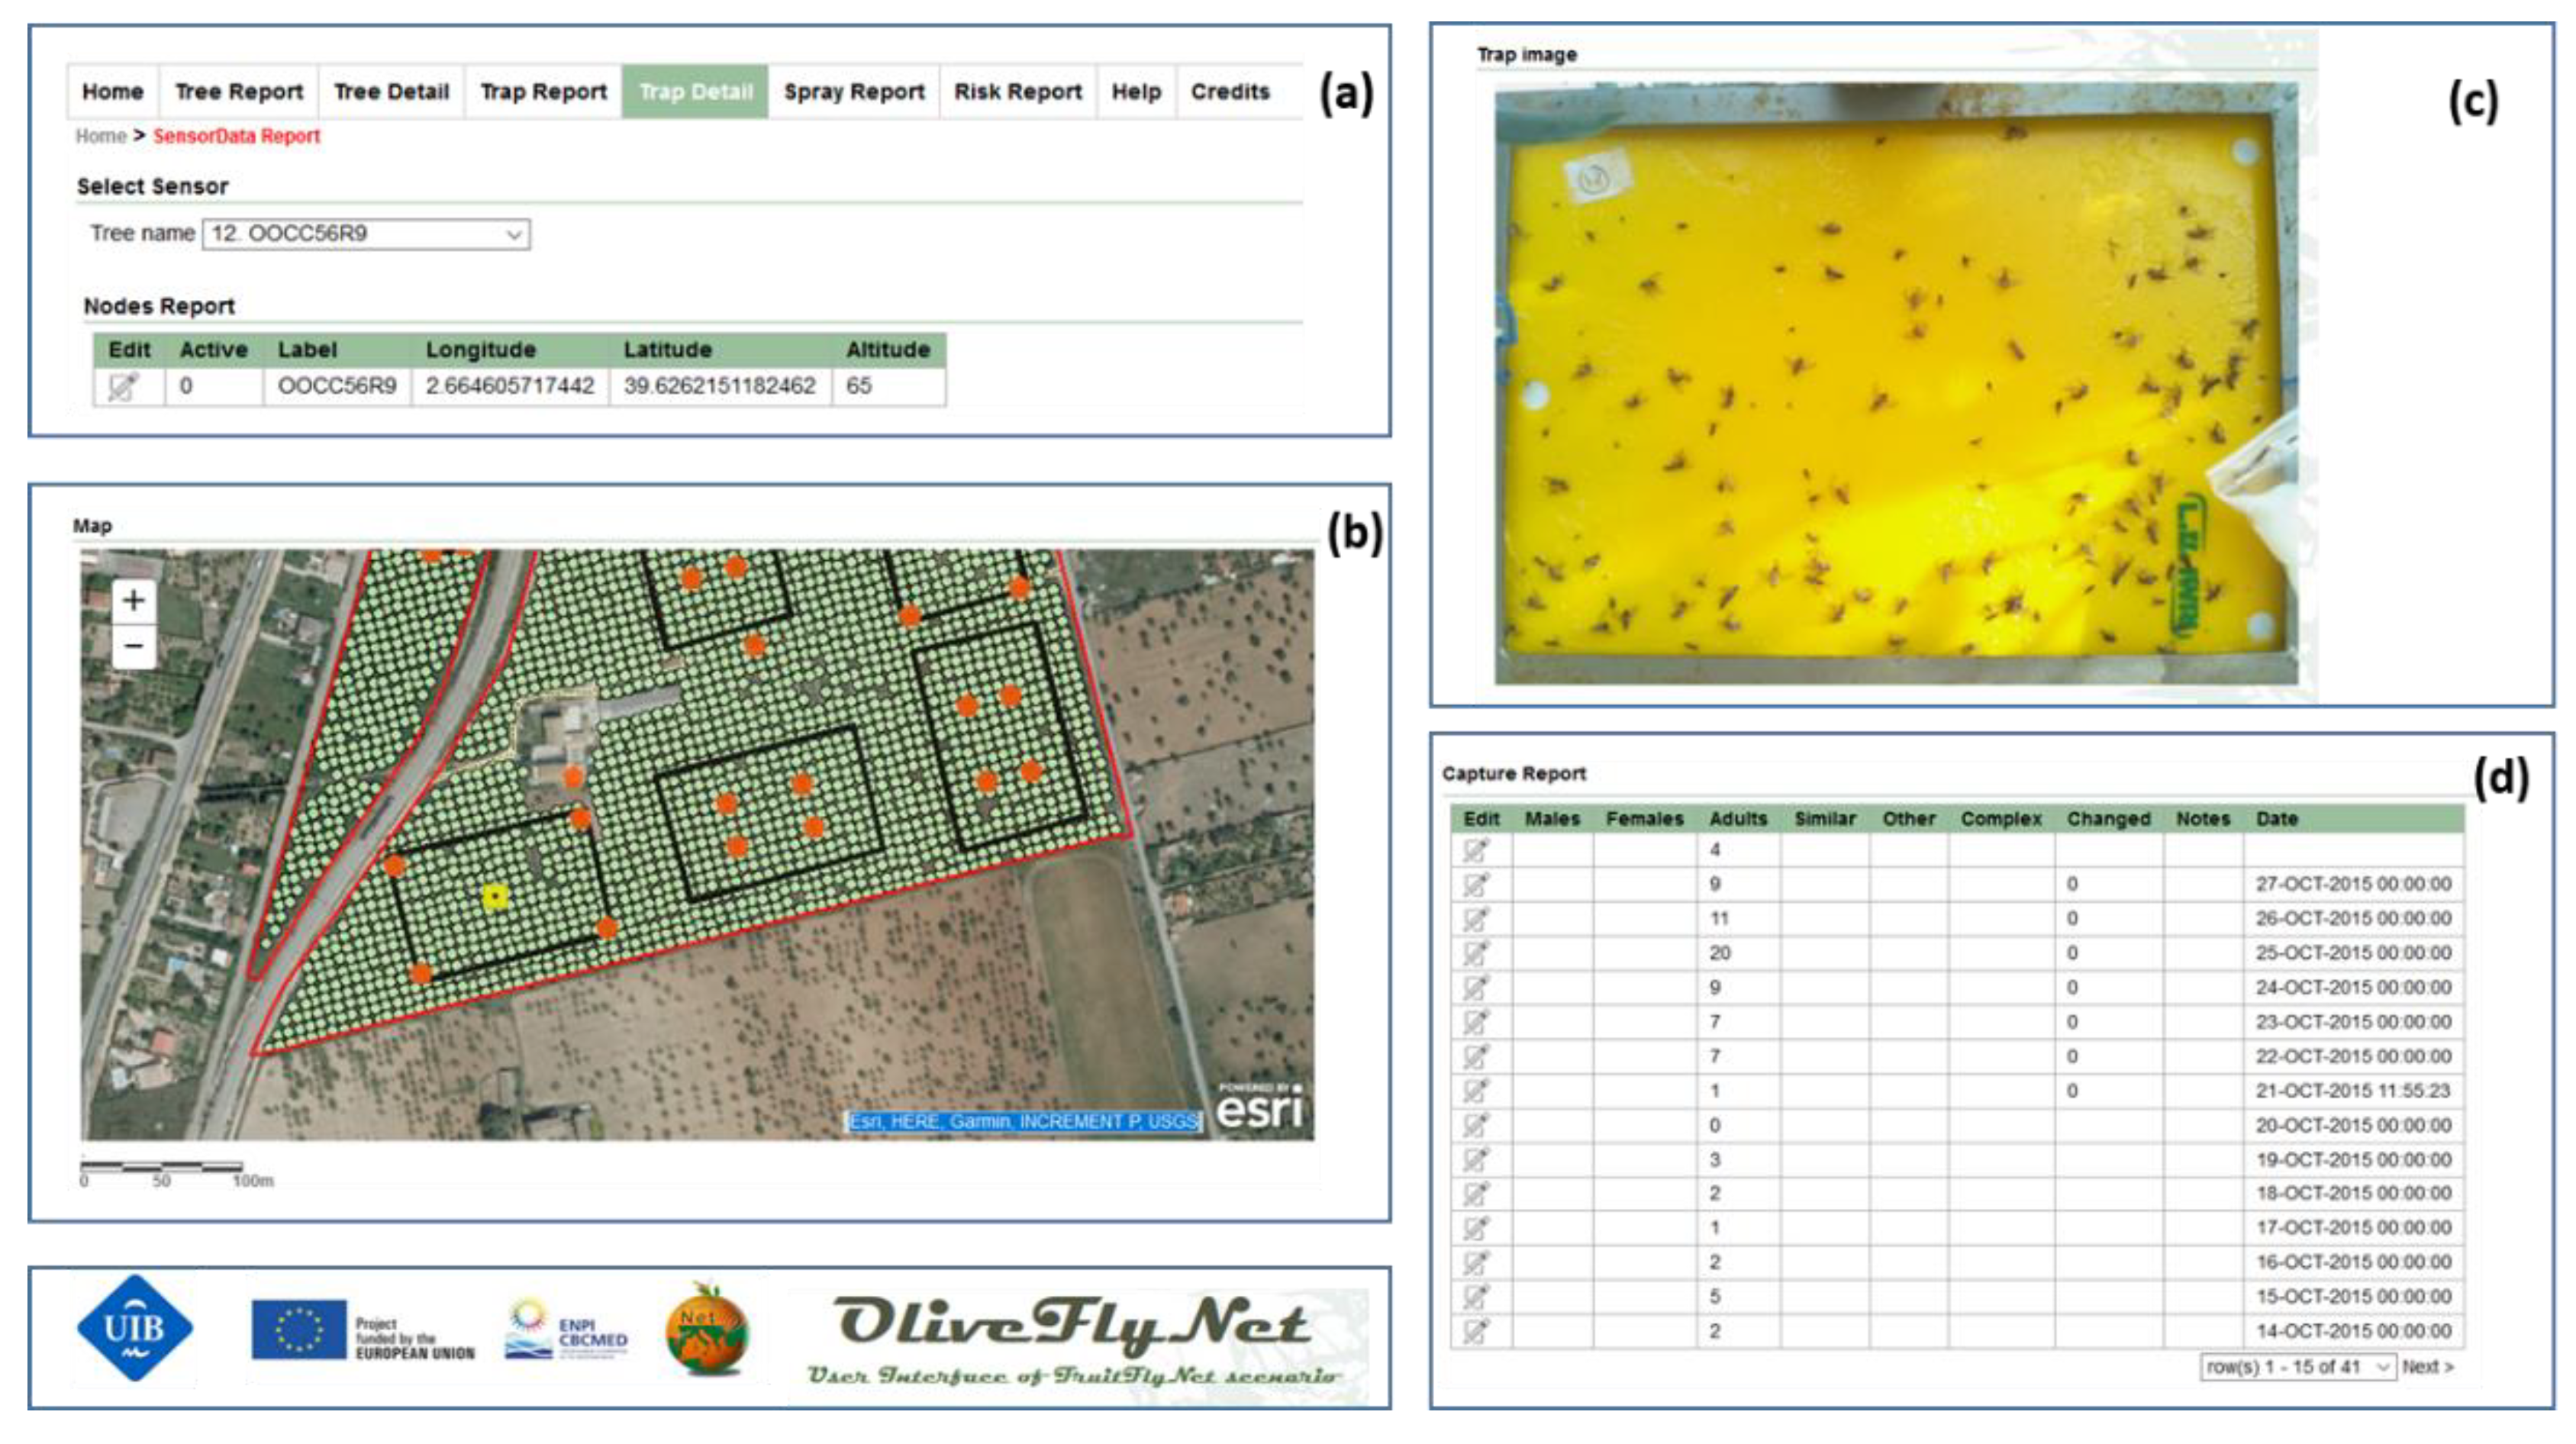
3.1. ReTIC vs. Conventional Monitoring System

In total, 676 images obtained by the ReTIC system were compared to the counting performed at field level. Figure 9 shows an example of pictures of the Rimi® trap obtained by the e-traps camera. As we already reported in Shaked et al. (2016) [11], the percent of concordance between image analysis and field scouts report was 99.5 ± 0.3 in average for pilot plots LAS 1, 2. and 3 and a high correlation (r = 0.98) between e-traps and on-site counting was found.

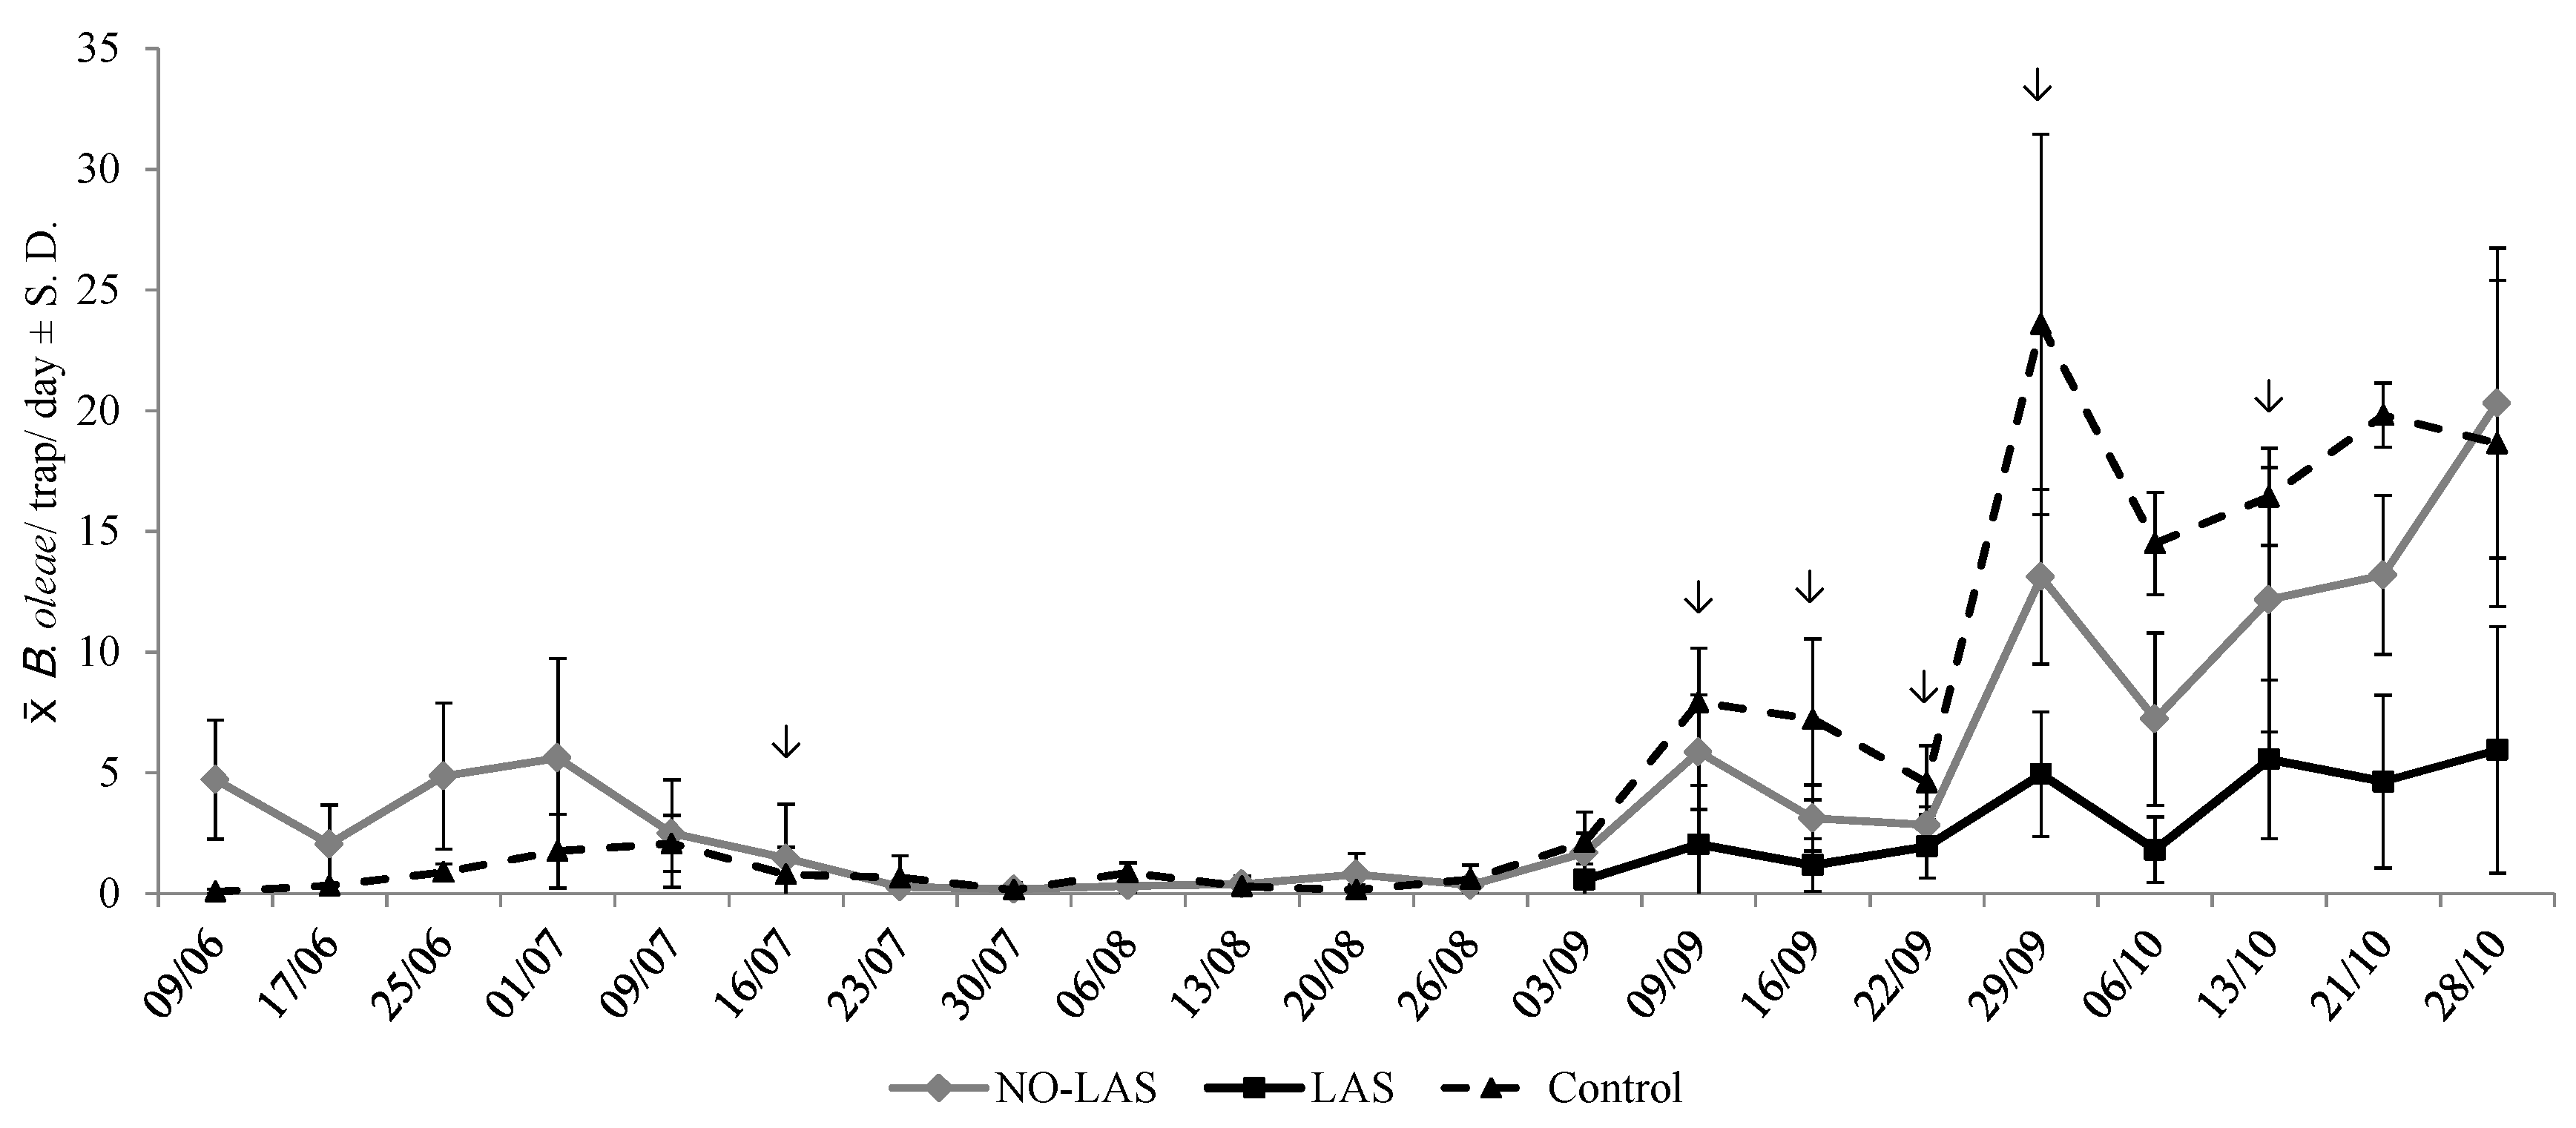
3.2. Adult Abundance in LAS, No-LAS, and Control Plots

Figure 10 and Figure 11 show the results of adult abundance in LAS, NO-LAS, and control plots obtained by Rimi® traps and McPhail traps, respectively. Monitoring in NO-LAS and control plots started in early June and accounted for 21 samples obtained from conventional monitoring, while monitoring in the LAS plots started in late August, according to the schedule of the pilot project, and accounted for 61 samples obtained from the e-traps. Temporal pattern of adult catches from August to the end of October was similar for all the plots where Rimi® traps were used (Figure 10), independently of the number of insecticide treatments conducted. Peak of abundance during the pilot trial was detected in late September for the control plot and late October for the LAS and NO-LAS plots. Adult abundance was higher in control showing significant difference with LAS plots only (Mann-Whitney test, P < 0.05).
In regards to McPhail traps (Figure 11), captures were low (<1 FTD) until September in the control plot and from mid-July to October in the NO-LAS plots. The highest abundance of adults was recorded in early July for McPhail traps located in the NO-LAS plots, meanwhile the peak of abundance for the control plot was detected in late September, similarly to the Rimi® traps in the LAS plots. We did not find significant differences when captures by McPhail traps were compared between the NO-LAS and control (Kolmogorov–Smirnov, P > 0.05). However, when captures by Rimi® trap (Figure 10) in NO-LAS were compared with the McPhail trap captures, we obtained significant differences (Mann-Whitney test, P < 0.05), where the FTD captured by McPhail traps was lower than the one obtained by Rimi® traps.

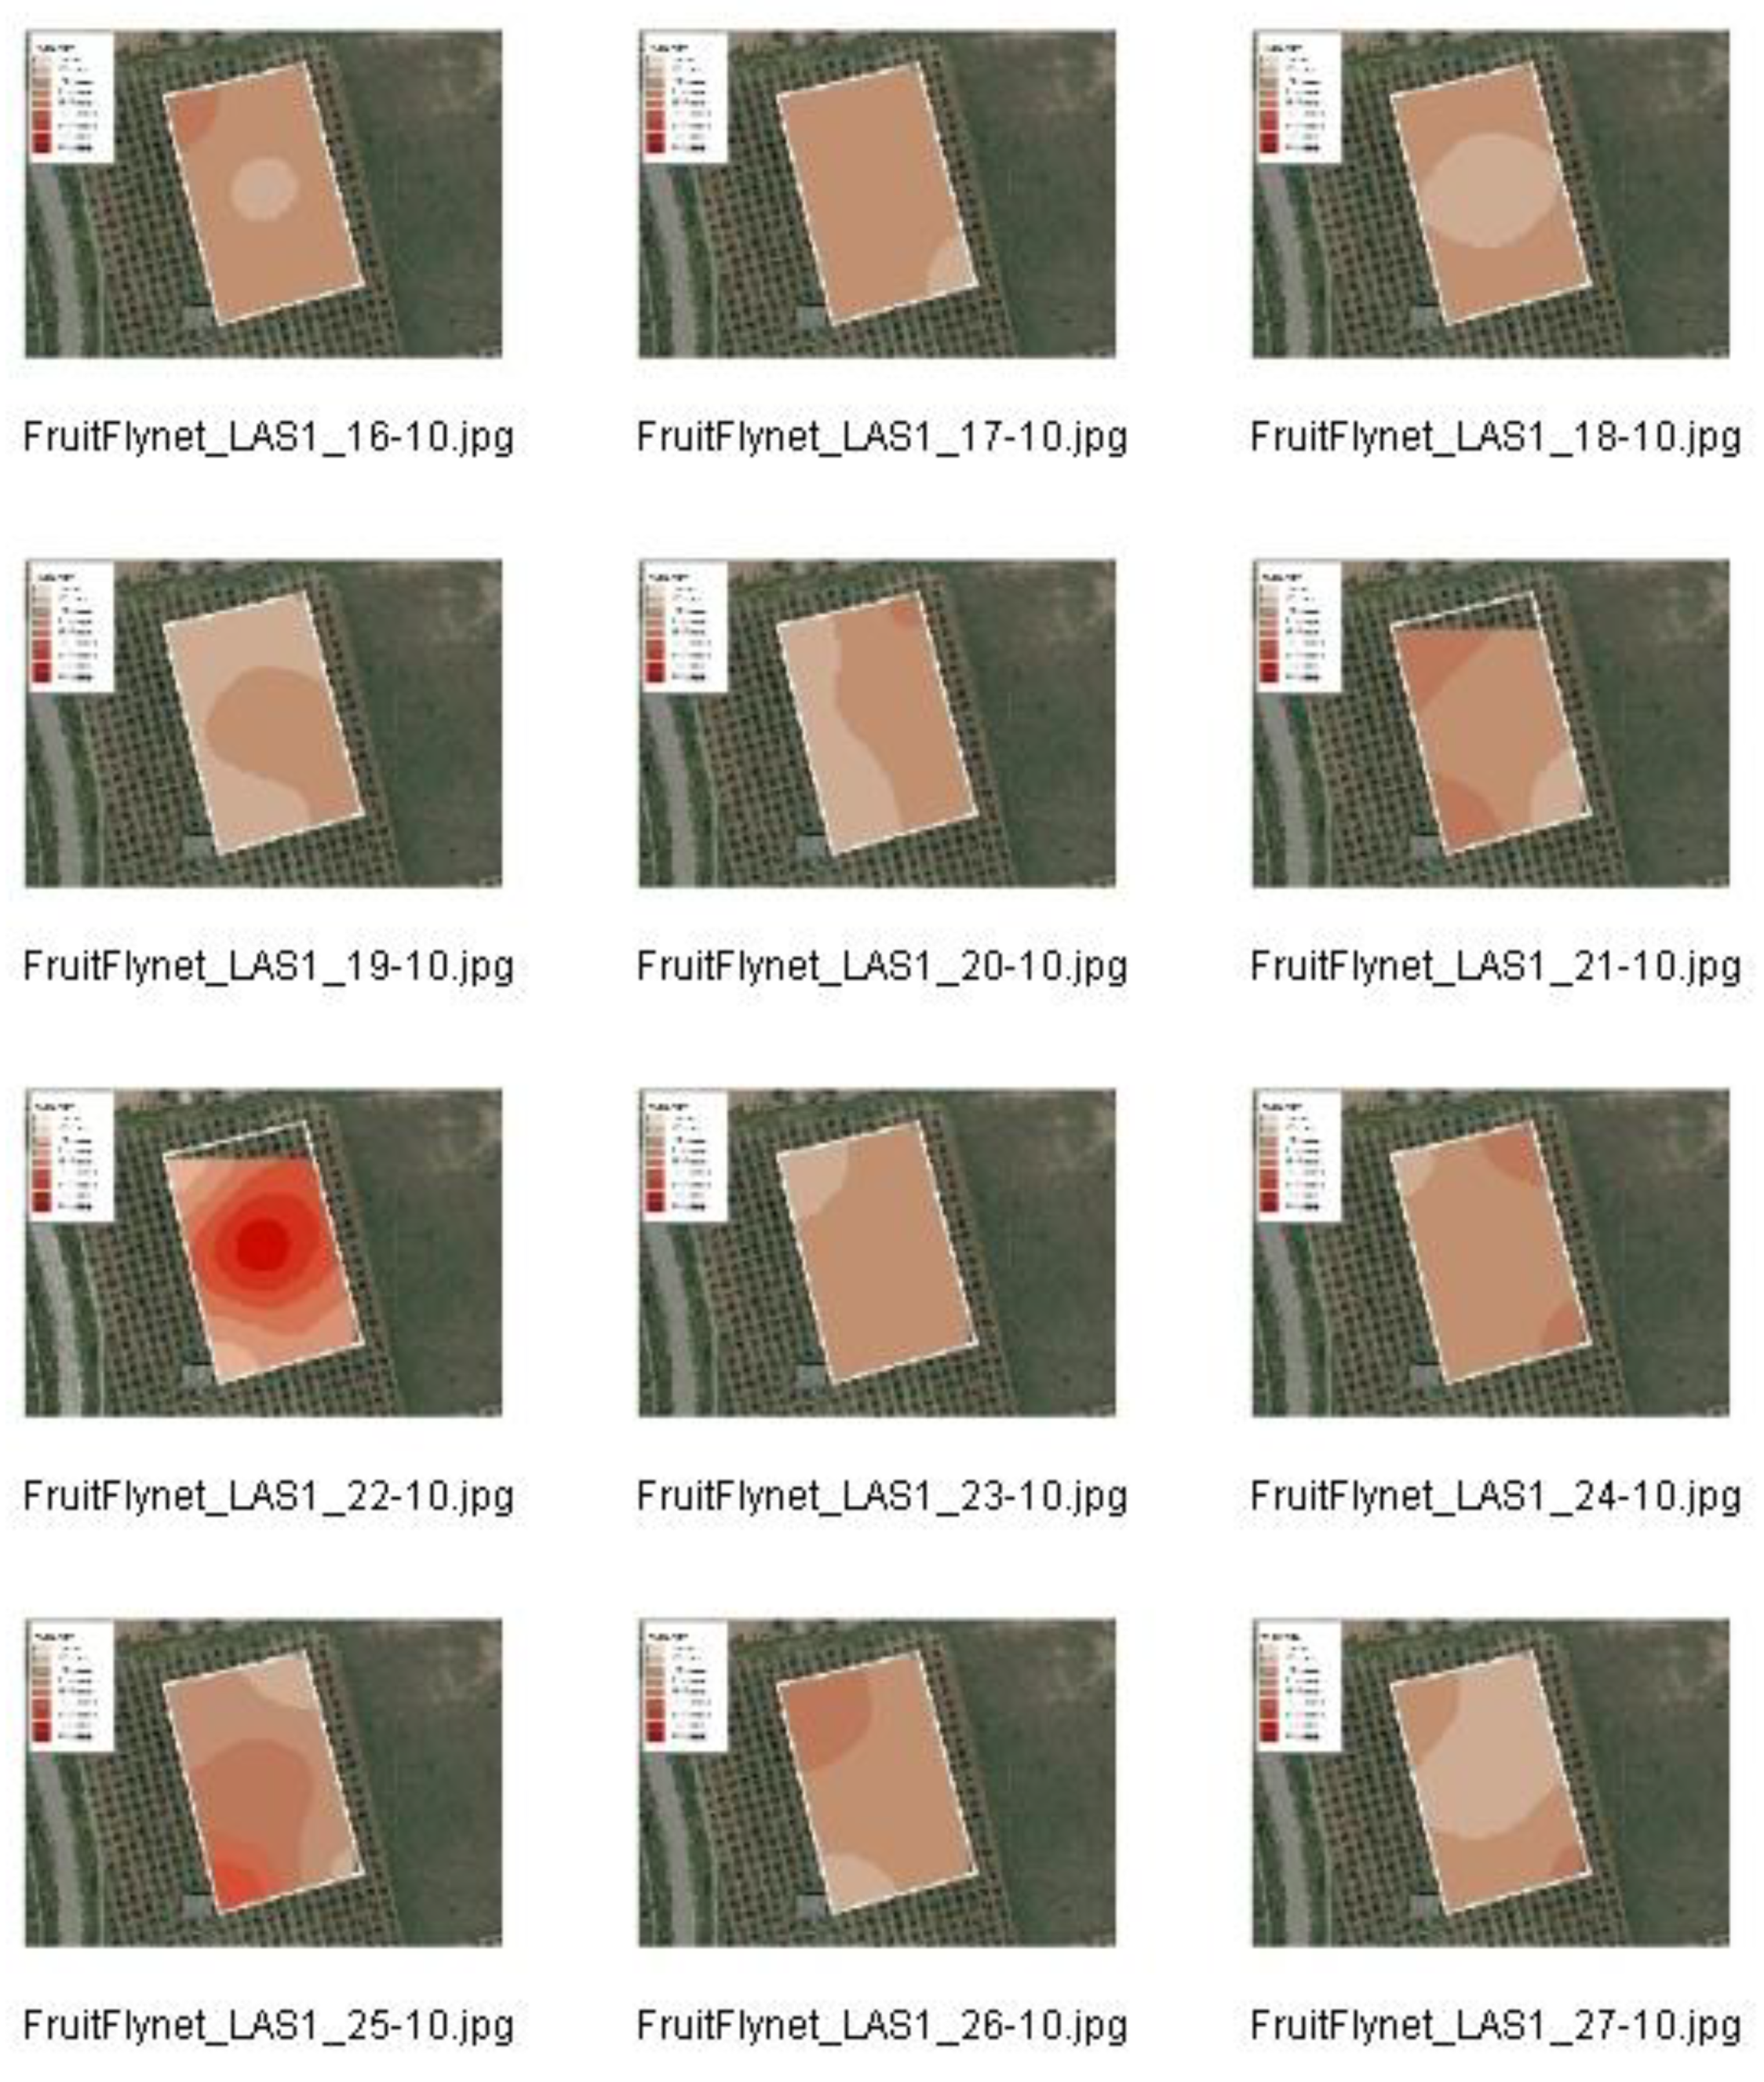
3.3. DSS Based on Spatial and Temporal Distribution of B. oleae Adults

Temperature was recorded on a daily basis by the sensors of e-traps (Figure 12); however, we are only representing average weekly temperatures in Figure 12 for matching NO-LAS and control monitoring. Temperatures recorded during the trial were optimal for the development of B. oleae from July to October, except in August, when temperature was near to 30 °C and humidity decreased to values below 50%.
The e-traps produced 849 images collected on a daily basis from 27 August to 28 October. The information provided by the e-traps in the LAS plots was used to determine the place and time to conduct insecticide treatments by using DSS and the OliveFlyNet application where each tree was assigned to a risk based on the data on olive fly abundance, fruit load, fruit damage, and meteorological parameters provided by sensors of the e-traps. In Figure 13, we show an example of the interpolated maps of FTD produced with the information provided by the e-traps (see also Supplementary Materials Video S1), whereas in Figure 14 we show an example of the risk map analysis produced on 27 October considering olive fly abundance, temperature, and humidity. In addition, Figure 15 shows a screen capture of the DSS (C-PLAS Software) running in the mobile device used by the operator to follow the route for optimal insecticide treatments.
Insecticide treatments were applied six times from July to October in the pilot area (Table 1). The ‘Empeltre’ variety is considered to be more sensitive to B. oleae than other varieties and consequently, in early September, even if the abundance of B. oleae adults did not reach the treatment threshold value, the farmer decided to conduct a preventive treatment in the LAS 2 and NO-LAS 2 plots. The e-traps showed differences in the distribution of adults of B. oleae in the LAS plots that modulated the number and spatial distribution of treatments in surface and plots. For example, LAS 1 plot was treated for only 50% of its surface during the second and third week of September; however, six sprays were conducted in LAS 1 and only two in LAS 3 since LAS 1 showed more positive nodes (>5 FTD) early in the season. From July to early October, LAS plots were less treated in terms of surface compared to NO-LAS ones; however, the last treatment conducted included all plots of LAS and NO-LAS, due to the high abundance of B. oleae adults and full susceptibility of fruits for female oviposition. In addition, during the first week of October, the owner decided to double the volume of broth from 11 L/ha to 22 L/ha due to the high abundance of adults.

3.4. Indicators of the Efficacy of DSS for Controlling B. oleae

The DSS applied in the LAS plots was based on the spatial and temporal distribution of the adults of B. oleae according to the information provided by the e-traps. This allowed us to plot e-trap records using interpolated maps that were used to conduct insecticide treatments according to the needs of each LAS plot, meanwhile in the NO-LAS plots, insecticide was applied to the entire area, regardless of the density of flies in any of the plots.
Table 2 shows the different indicators that estimated the efficacy of DSS in the LAS plots vs. the NO-LAS ones. In all cases, six insecticide treatments were conducted, therefore, there was no difference in the number of treatments between LAS and NO-LAS. We estimated the whole treated area, including the six insecticide treatments in LAS and NO-LAS plots. We obtained a 42.8% of reduction of the insecticide-treated surface in LAS plots compared to NO-LAS, as well as a reduction of 36.8% of the volume of pesticide. Distance and spraying duration were also reduced in LAS plots when compared with NO-LAS to 41.5% and 41.6%, respectively.

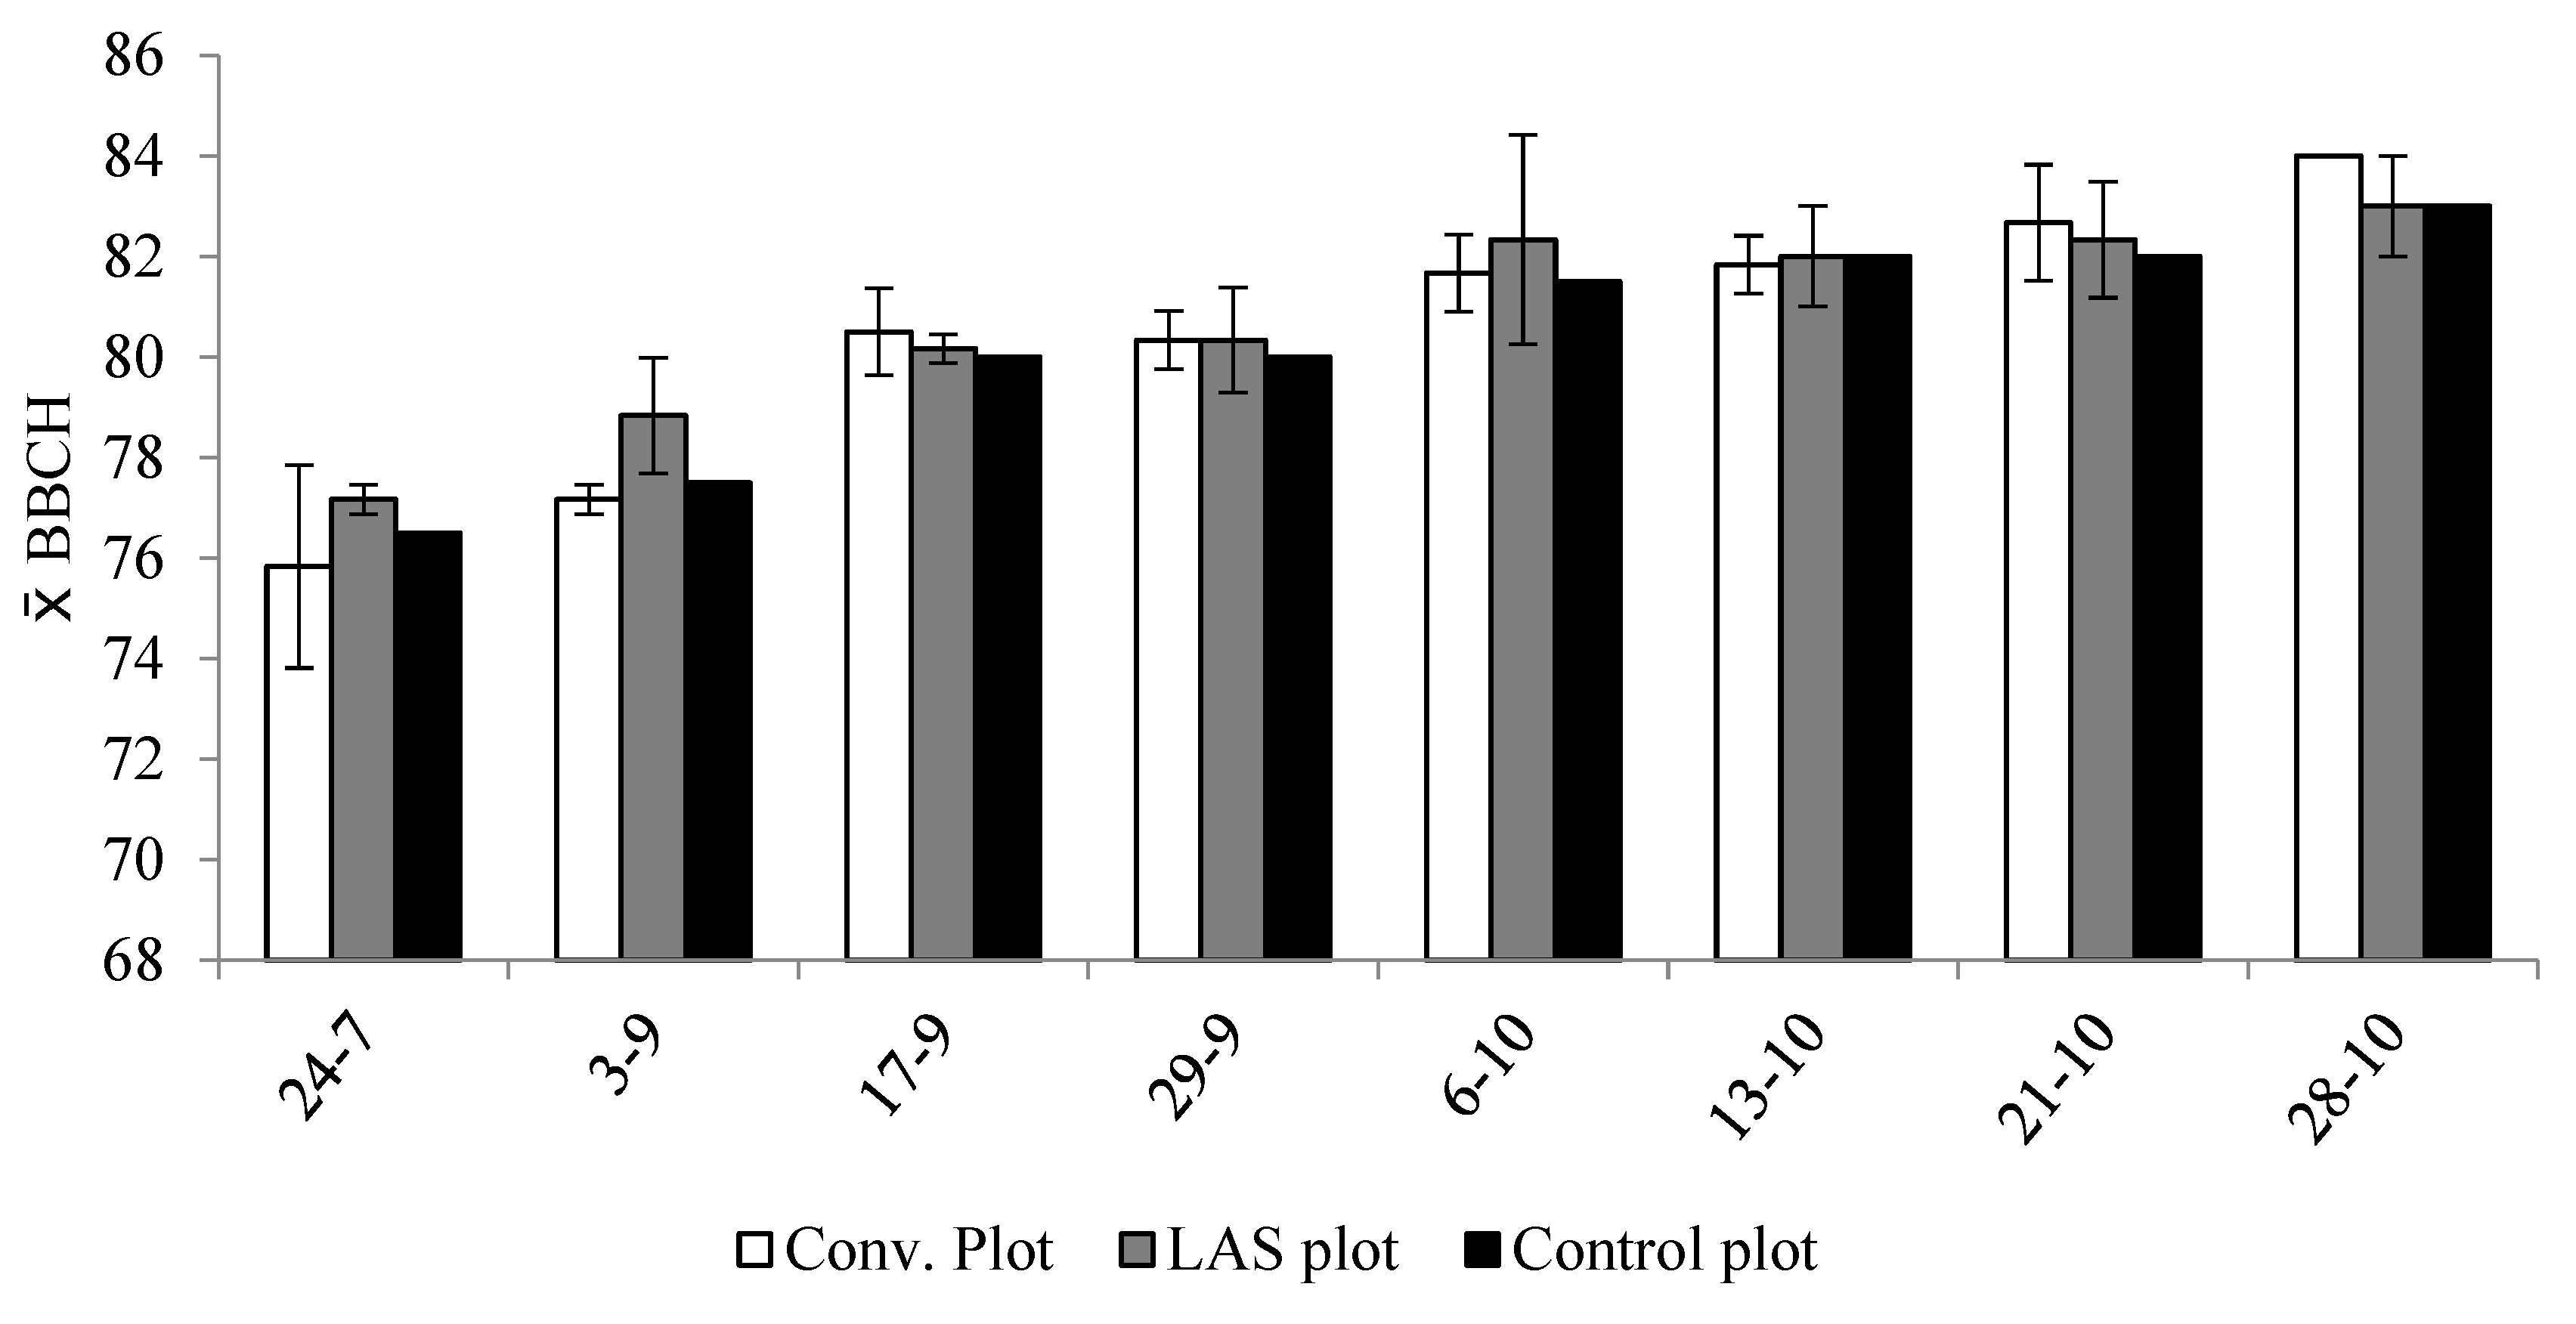
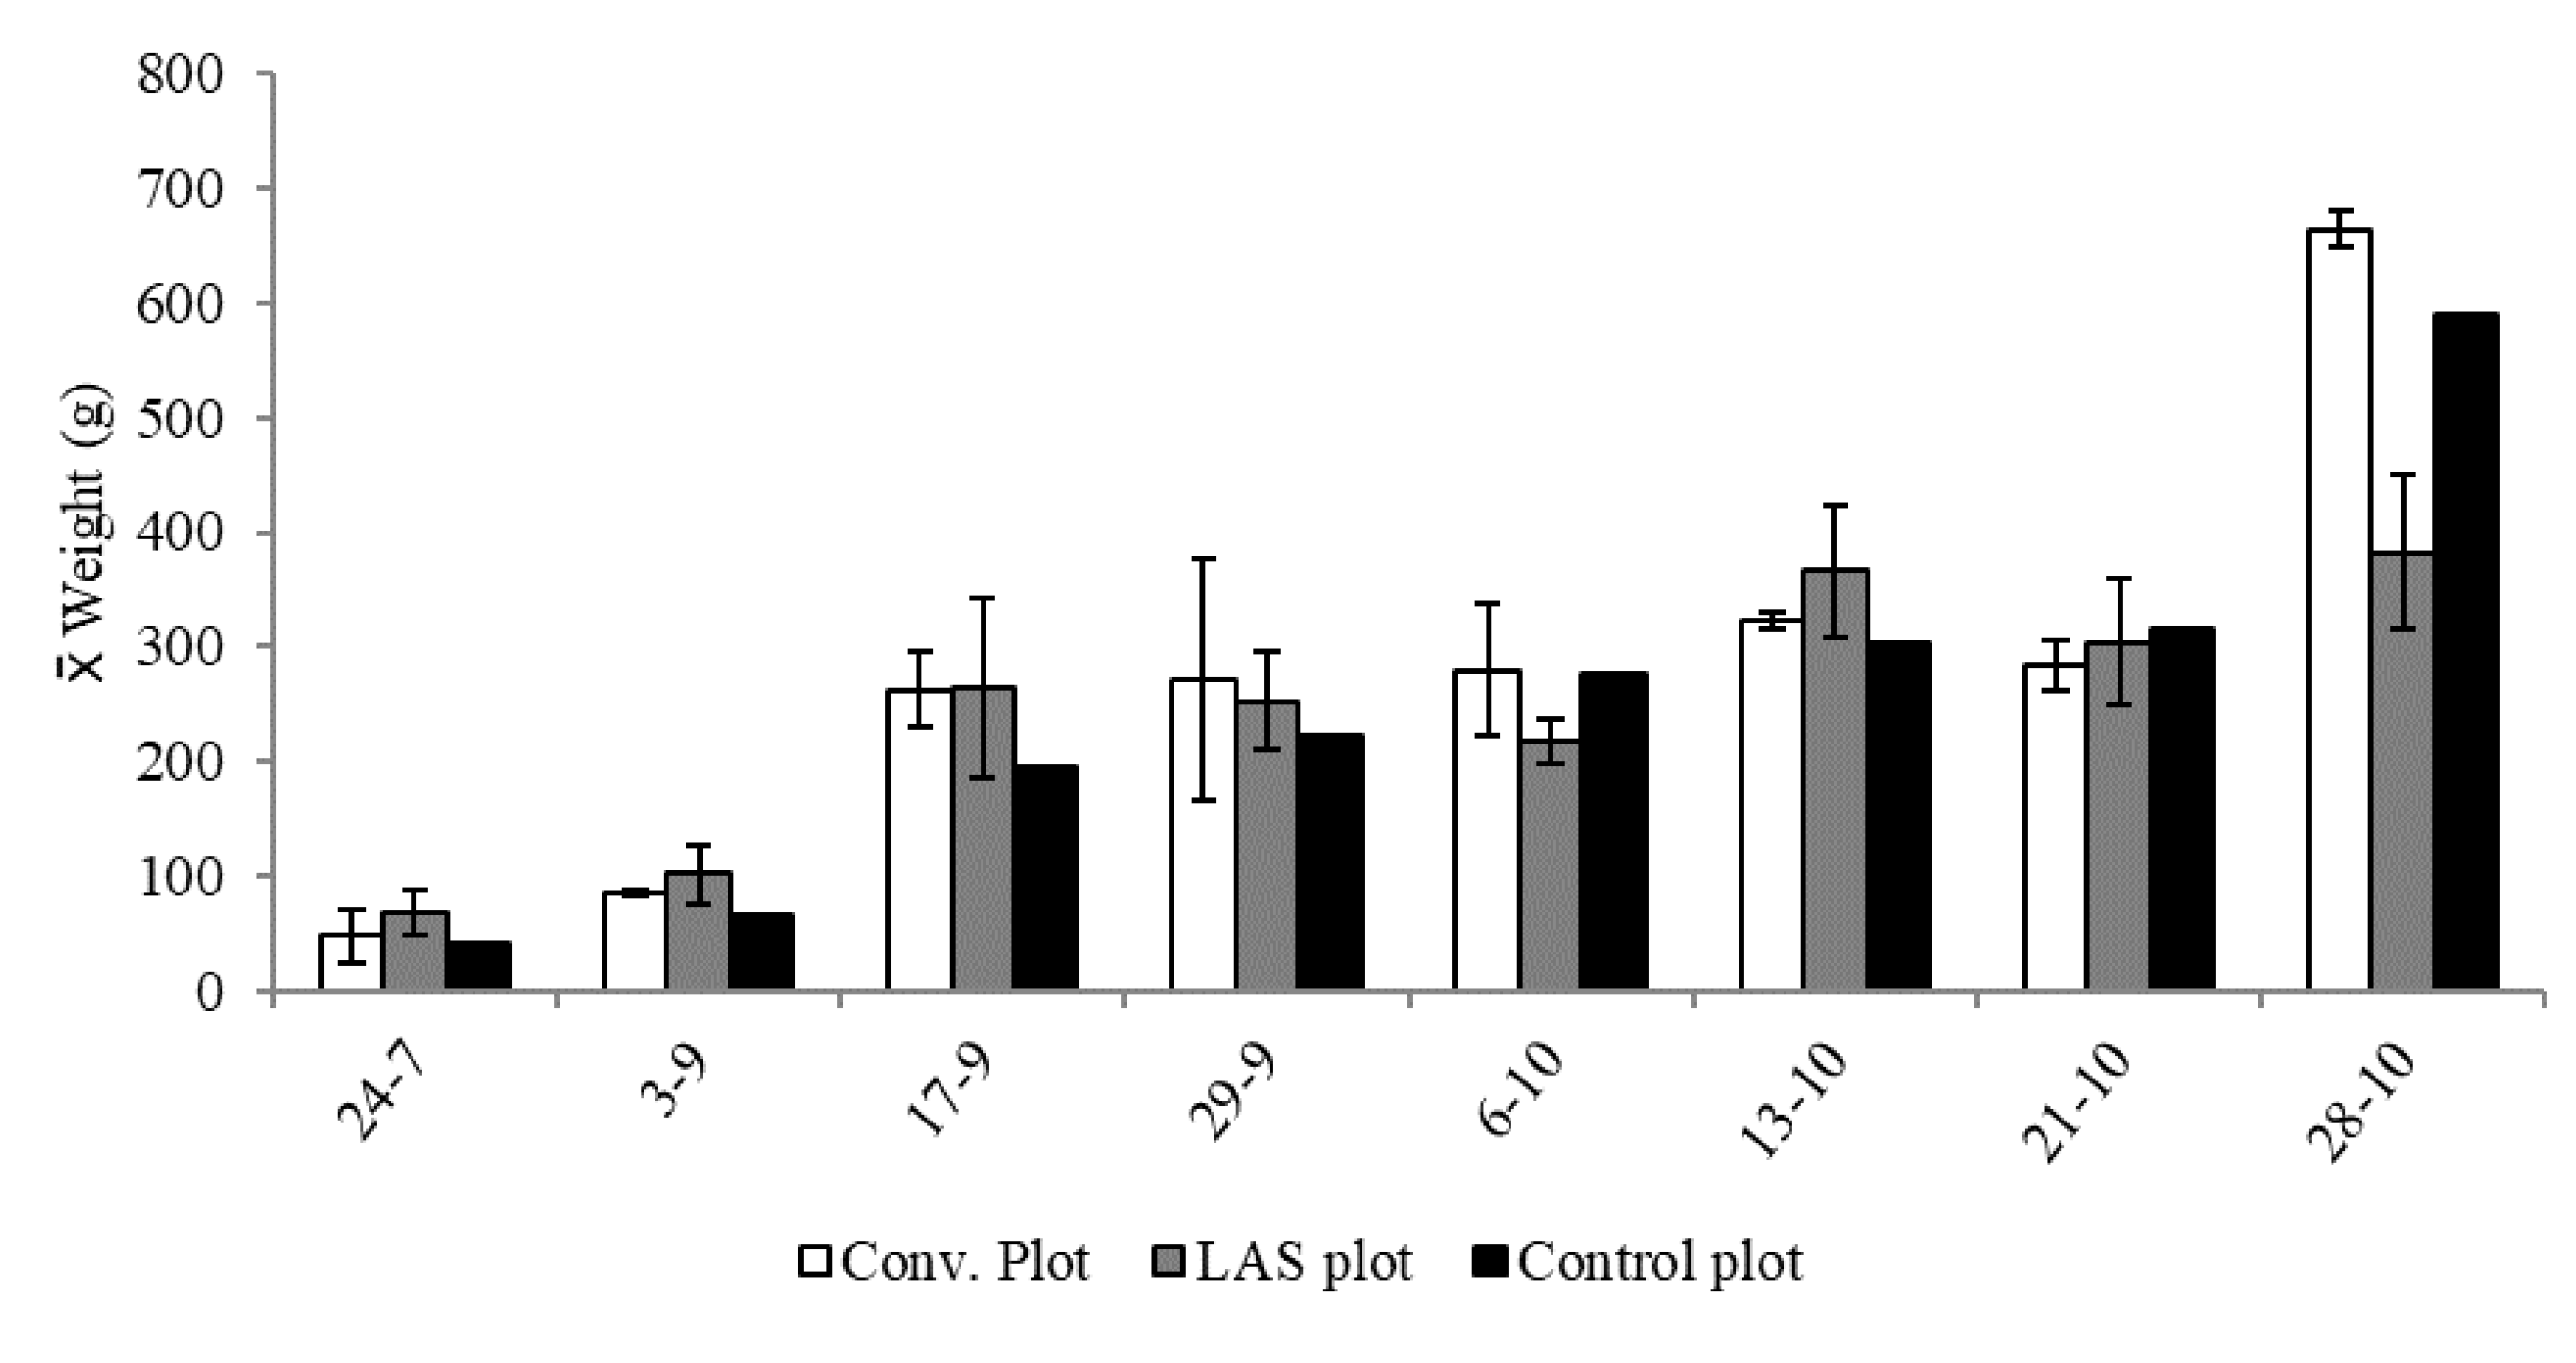
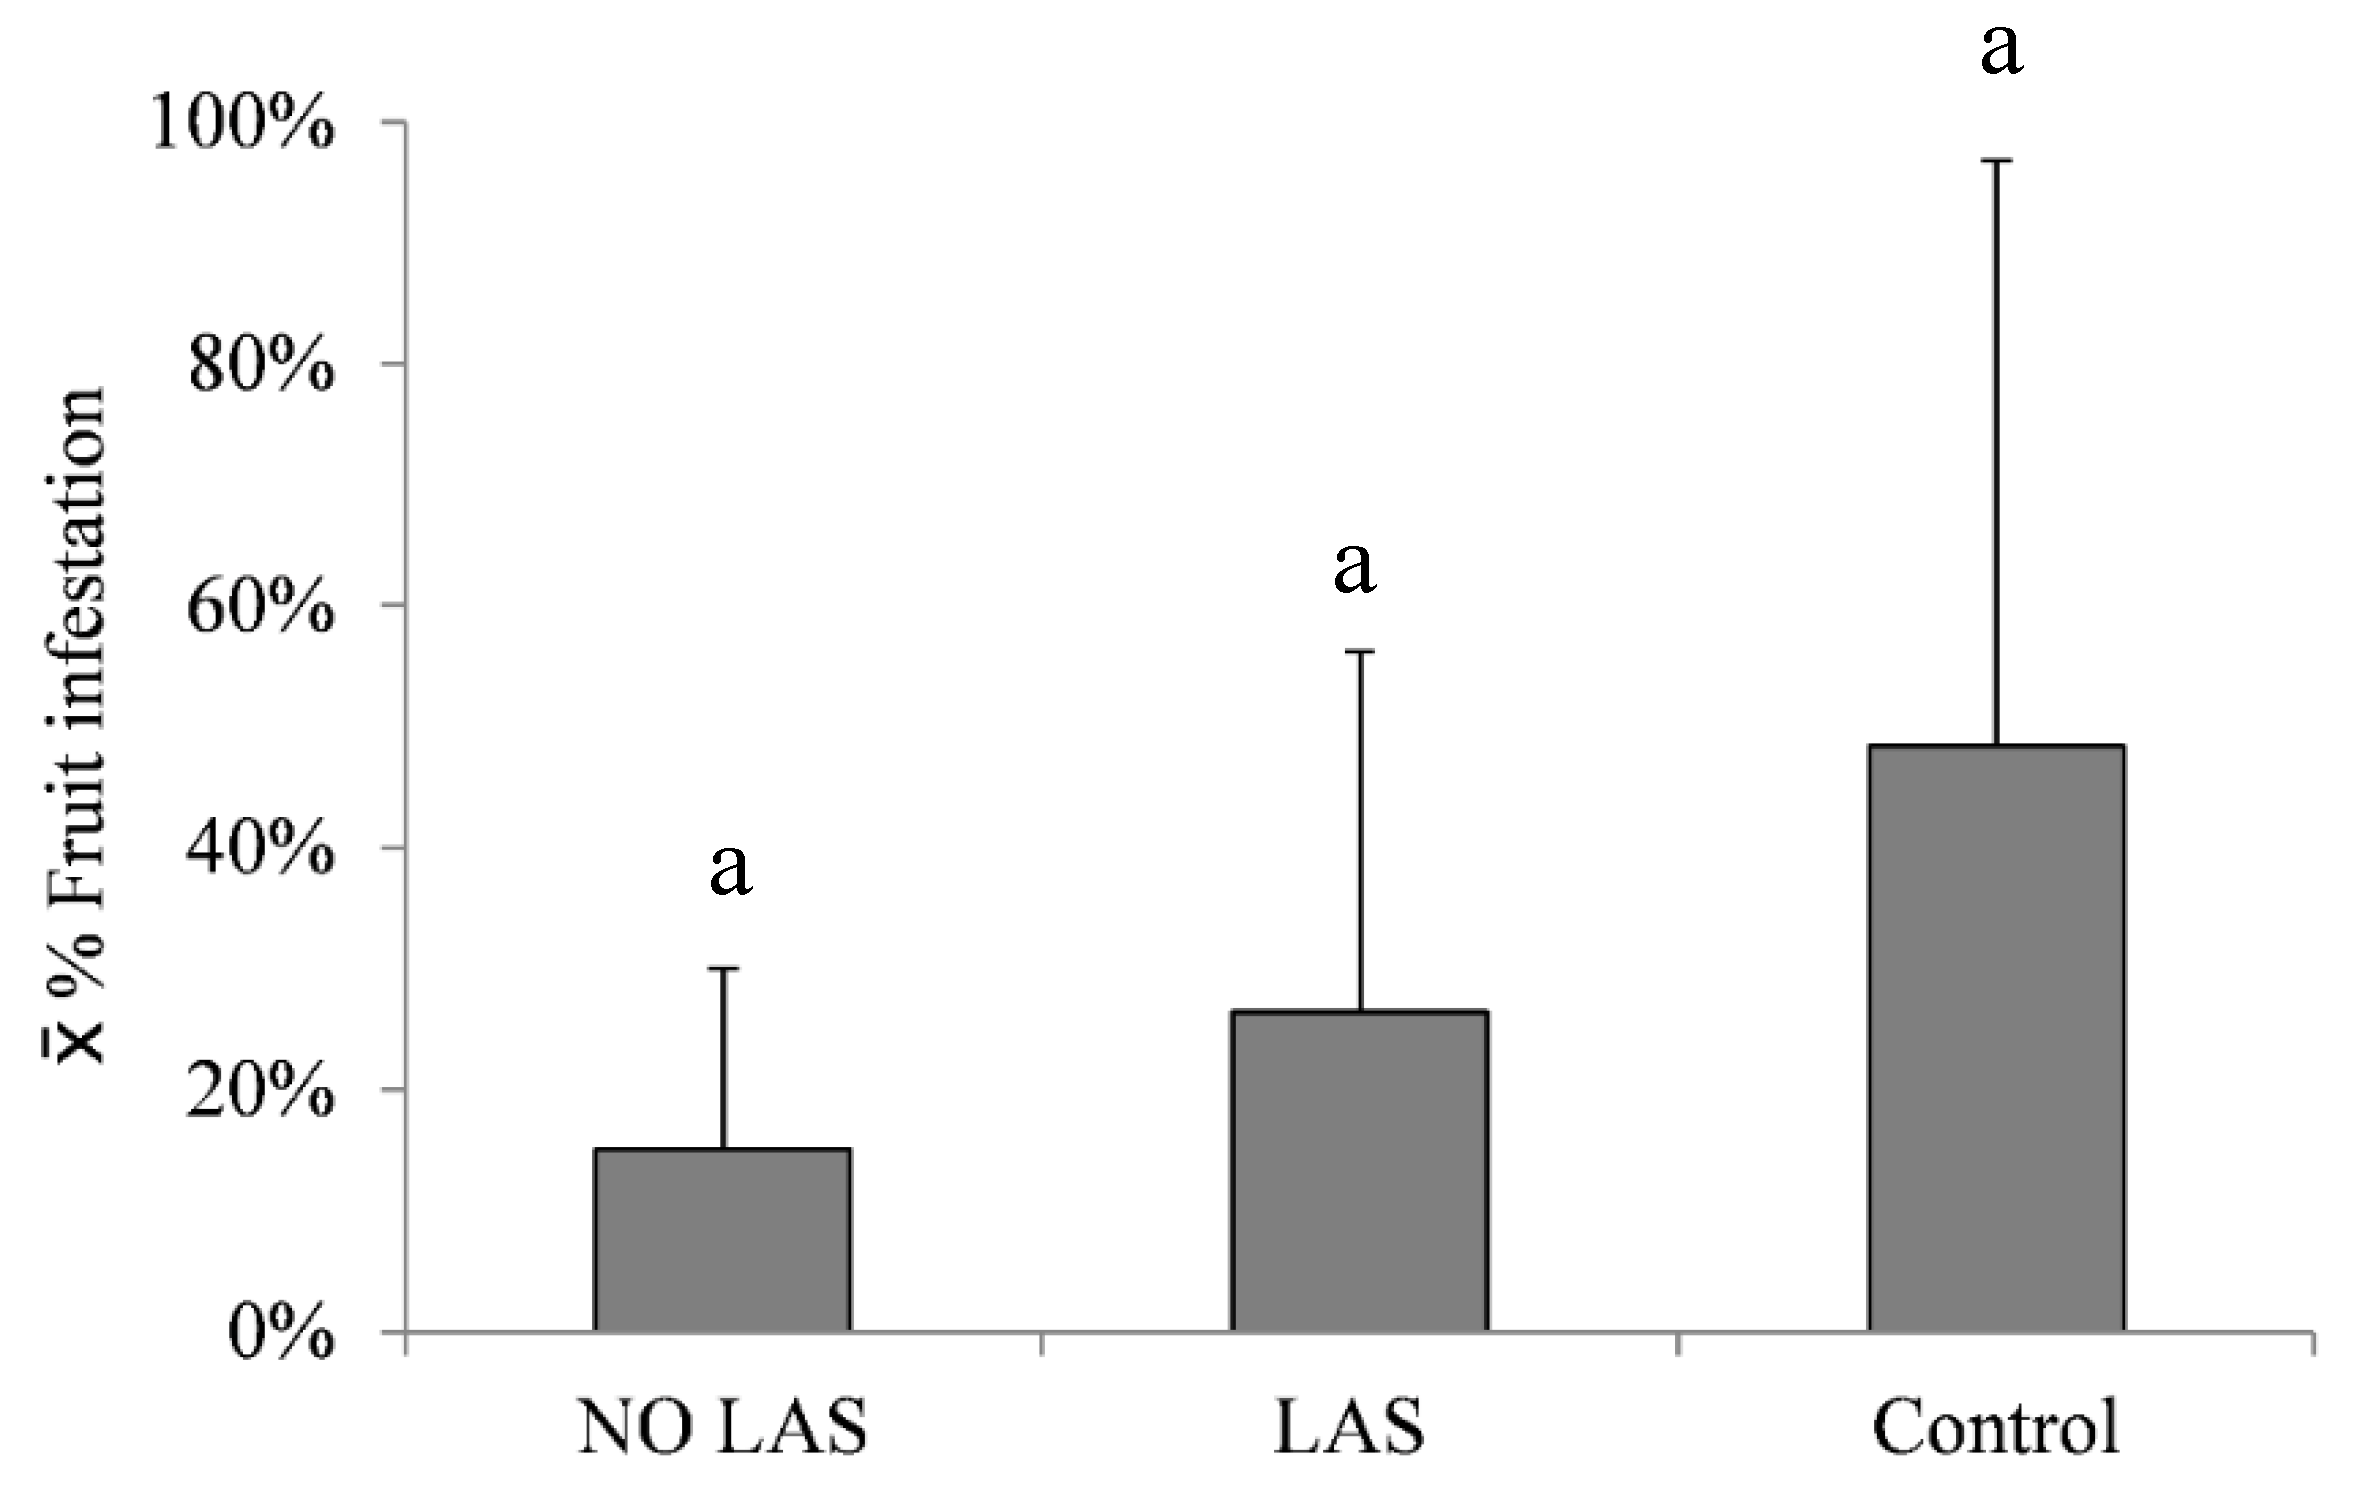
3.5. Fruit Infestation

Plants in all the plots (NO-LAS, LAS, and control) showed similar phenology from July to October according to the average obtained by the BBCH scale (Figure 16). In late July, 60% of fruits reached their specific variety weight (BBH 76) and in late October, all the fruits started to ripen (BBCH 84).
The average percent of fruit load in the LAS plots was 32.7 ± 36.0 (Table 3). The average fruit load was variable in the different plots, showing significant difference among them (Kruskal–Wallis test: p < 0.05), with a minimum of 18% and maximum of 45%. Variability in the fruit load on trees was high in all LAS plots.
In total, 6843 fruits where analyzed, from which 2757, 3117, and 969 were from NO-LAS, LAS, and control plots respectively. Figure 17 shows the average weight of fruits for every type of plot from July to October. There was no significant difference in the weight of fruits collected from the different plots (one-way ANOVA, p > 0.05), however, fruits in NO-LAS and control plots doubled the weight of fruits during the last week of October compared to LAS plots.
The fruits collected weekly from 27 August 2015 to 28 October 2015 were used to assess fruit infestation (presence of galleries, larvae, or pupae). Fruits obtained from the control plot showed the highest average percent of infestation (Figure 18), nearly 50%. The NO-LAS plots showed the lowest value, nearly 15%, while the LAS plots showed nearly 26% fruit infestation. We found no significant differences in fruit infestation between control, NO-LAS, and LAS plots (Kruskall­–Wallis test, p > 0.05).

3.6. Parasitism of Larvae

Parasitism of larvae due to the most common parasitoid in the Mediterranean area, P. concolor was found in all the plots, but in different percentages (Figure 19). Fruits collected from the control plot showed the highest percentage of parasitism (3.5%) followed by the LAS (1.5%) and NO-LAS (1%) plots. Significant differences in the parasitism of larvae were only found between the control and NO-LAS plots.

4. Discussion

We demonstrated that the use of a decision support system for the control of olive fly based on a semi-automatic electronic trap monitoring integrated in a location aware system (LAS) was more efficient in terms of surface, operational distance, and volume of spraying than a conventional system (NO-LAS) for reaching optimal control of adults.
We demonstrated that the olive fly monitoring method based on e-traps was equally functional as conventional monitoring based on field scouting. We published preliminary results in Shaked et al. (2017) [11], where we reported a high level of accuracy (99.5% concordance) in the semi-automated counting of flies. We also obtained similar results for other electronic traps, such as the ones developed for the Medfly in Israel using a Steiner-type trap [10], while the modified McPhail trap developed in Greece for B. oleae reached lower values of accuracy (74.2%) between automatic and manual counting when compared to our prototype [41]. In addition, deep learning methods integrated in the “Dacus Image Recognition Toolkit” (DIRT) [13] would substantially improve the performance of the e-trap prototype presented here since it still requires human intervention for counting.
Electronic traps allowed to record olive fly population in real-time (e.g., one picture per day), thus greatly reducing labor costs for monitoring activities. One limitation we encountered was the possibility to distinguish between male and female olive flies in the pictures due to their position on the sticky board. The WSN was based on Zigbee radio technology. It provided an adequate ratio of energy consumption and functionality, similarly to other studies that used the same technology [42]. However, we encountered some troubles because the topography of some plots (i.e., LAS 2) was not adequate to keep a continuous signal strength. Therefore, some of the nodes were temporally offline from the system’s network (Figure 15).
E-traps used in this study succeeded in giving spatial and temporal information about olive fly abundance in the LAS plots, producing maps for spraying only in those areas of the plots where the abundance of olive fly exceeded the treatment threshold. There were areas of the LAS plots where high abundance of olive fly adults was systematically recorded, in agreement with Dimou et al. [43], that identified the so called “focal points”, areas where microclimate and fruit load may contribute to a heterogeneous distribution of B. oleae adults. This distribution of adults could be due to the invasion of olive fly adults from long-distance olive crops, that could be up to 10 km [18] and/or because of the fragmented landscape that may have reduced or increased the presence of adults in some of the plots [44]. Biased distribution seems not to be related to the crop itself, since all plots included in the pilot study showed similar phenology pattern according to the BBCH scale. Independently of the reasons for the observed distribution, the e-traps were able to record those patterns in real-time as a support for improving insecticide treatments.
The Rimi® traps baited with solid ammonium bicarbonate and olive fly sex pheromones were found to be adequate for monitoring olive fly adults similar to other traps that have been used in olive orchards such as the McPhail, Multilure trap, and Olipe [20,21,22,23]. Ammonium bicarbonate was also found to be an adequate alternative to liquid attractants such as ammonium biphosphate salt [24], which in Spain is usually placed in low-cost traps (i.e., Olipe) [22,23]. Liquid baits are more unstable when releasing the attractant and require labor for maintenance on the field, while solid lures assure a regular rate of diffusion and are less labor-intensive.
We compared the monitoring performance of Rimi® traps (LAS, NO-LAS, and control plots) with conventional McPhail traps baited with ammonium biphosphate (NO-LAS and control plots). Surprisingly, the McPhail traps placed in the NO-LAS plots showed a different pattern of captures when compared with the McPhail traps placed in the control plot, particularly during the first two months of sampling (June and July). There is no clear explanation for this fact, since after July, McPhail traps performed similarly in the NO-LAS and control plots, showing a peak of abundance of olive fly adults from mid-September to mid-August. Long distance movement of adults [18] and different invasion of the orchards due to the surrounding landscape heterogeneity are also a few of the possible explanations [44]. In addition, a difference in the peak of abundance between the control plot and NO-LAS and LAS plots was also detected; in this case, different population abundance at field level, for example due to the non-use of insecticide in the control plot, seems to be the main explanation and not the performance of the monitoring system itself.
In general, high temperatures near 30 °C and low HR below 20% during July and August decreased the activity and abundance of olive fruit flies recorded in both Rimi and McPhail traps. It is known that Mediterranean summer conditions affect female oviposition and activity [45]. The captures increased in September, when temperature reached 25 °C and HR was above 50%. These conditions are recognized as optimal for B. oleae development, in addition to the greater suitability of olive fruits for female oviposition [46].
We managed to improve conventional application of insecticides against B. oleae in olive orchards by applying a decision support system. This system accounted for environmental parameters such as temperature as well as agronomic ones such as tree phenology, fruit load, and spatial and temporal abundance of B. oleae adults recorded by using e-traps. Several indicators demonstrated a reduction in the area sprayed as well as reduction in the volume of insecticide used, operational distance for spraying, and time. In this case, precision agriculture in the form of real-time data on the monitoring of adults of olive fly allowed to reduce insecticide use at field level. Our results were in agreement to those obtained in Greece [15] applying a very similar DSS approach, where the amount of spray solution and the duration of the sprays decreased by 4.85% and 17.34%, respectively. We managed to improve those results by reducing the volume of insecticide by 36.84% and duration by 41.64%. Different monitoring systems (McPhail glass-type vs. Rimi® e-trap) may have influenced the results in Greece, since monitoring was not based on an ReTIC system.
We managed to reduce the volume of insecticide, but not the number of insecticide applications, since six applications were conducted both in LAS and NO-LAS plots. A reduction in both the volume and number of applications will be of great benefit since it reduces the risk of B. oleae developing resistance due to massive use of Spinosad or other insecticides [47,48]. Temporal pattern of adults was similar in the LAS and NO-LAS plots; however, in comparison, higher reduction of abundance was recorded after insecticide treatments in the LAS plots compared to the NO-LAS plots. Insecticide treatments targeted to areas where adults showed higher abundance in the LAS plots may have had a stronger effect on adult abundance compared to non-targeted treatments performed in the NO-LAS plots. In our case, we did not use any automatic control connected to the gun handle for spraying, as done in previous studies in Greece [14]. The use of a fully automatic controlled sprayer system would also allow for a more precise volume of insecticide to be applied, even for inexperienced operators.
Fruit infestation in NO-LAS was lower, but not significant, than in the LAS and control plots. Ideally, targeted insecticide treatments in LAS plots would decrease adult population, and consequently fruit infestation, more efficaciously. In our case, 11% of difference in fruit infestation was found between LAS and NO-LAS, which still stands for an acceptable level of damage, since fruit damage from 5 to 40% is usually accepted in Mediterranean olive orchards when treatments are applied [22]. Further, decreasing insecticide use in LAS plots was found to be efficient in reducing fruit damage when compared to the control plot, where nearly 50% of damage was recorded. As already known from previous studies in Spain [49], fruit damage is also variety dependent. In our case, the variety ‘Empeltre’ showed less damage compared to the ‘Arbequina’ variety in both the LAS and NO-LAS plots, even if the former is considered to be more sensitive to B. oleae oviposition. Preventive treatments in early September decided unilaterally by the farmer may have protected this variety.
Another advantage of DSS was the role of biological control on larvae of B. oleae. We found higher level of parasitism due to the parasitoid P. concolor in the LAS plots compared with the NO-LAS plots. Higher use of insecticide in NO-LAS plots may have an effect on P. concolor populations; even if Spinosad is considered to have a low impact on natural enemies in field treatments [32,33], it has been described to affect parasitoids [31]. This may be also confirmed by the higher level of parasitism found in the control plot, where no insecticide treatments were applied. Our results were in concordance with previous studies conducted in the Balearics, where higher rate of parasitism due to P. concolor (20%) was found in organic farming orchards [34].
Future development of e-traps monitoring system for integration into precision agriculture requires cost-effective technology. We developed a prototype of e-trap that had a high cost for materials (750 euros per trap) and associated software (2100 euros). Large-scale production of e-traps is considered to strongly decrease costs to the level that farmers will accept to adopt this technology, as other technologies have been rapidly adopted by the society (i.e., mobile phones or global navigation satellite systems) [50]. In this particular case of olive production in the Balearics, production plots are medium- or small-sized (2 to 10 h) and mostly lack public or private advisory system for pest control [7]. Growers might be particularly interested in replacing current monitoring system based on labor-intensive field scouting with affordable semi-automated and eventually automated monitoring systems. The challenge of implementing this type of precision agriculture technology at field level will require, as we presented here, multidisciplinary teams integrating biology, agronomy, electronic engineering, social science, and geographic information system specialists.

5. Conclusions

In this pilot study for controlling the olive fruit fly by the use of precision agriculture systems in a commercial olive orchard in Mallorca (Spain), we demonstrated the field implementation of a location aware system (LAS). We successfully developed ad hoc electronic traps for monitoring the spatial and temporal distribution of the olive fruit fly as a base for LAS implementation. The use of electronic traps, georeferenced trees, and the compilation of variables such as temperature, relative humidity, tree phenology, and fruit load as well as fruit infestation allowed the development and field implementation of a decision support system to aid in decision making about spraying for controlling the olive fruit fly. We showed the possibilities of using the DSS for managing the olive fruit fly, since the volume of insecticide and distance for spraying were reduced in comparison with cover conventional sprays. Precision agriculture systems such as electronic traps linked to DSS would substantially improve monitoring of plant pests by reducing time needed for field monitoring using conventional traps. In addition, insecticide spray applications would be improved by reducing applications in time and space, thus decreasing the potential impact on health, environment, and non-targeted arthropods.

Supplementary Materials

The following are available online at https://www.mdpi.com/2073-4395/9/10/620/s1. Video S1. Example of temporal and spatial population patterns of B. oleae in LAS plots.

Author Contributions

M.Á.M., D.N., N.P., A.S., M.R., and B.A. conceived and designed experiments; C.B., F.V., J.F.F., M.Á.M., M.R., and B.A. performed field experiments and analyzed data; M.Á.M. wrote the paper; A.S., B.A., C.B., D.N., F.V., and N.P. revised the manuscript.

Funding

This study was financed by the EU through the two-year project FruitFlyNet/II-B/2.1/0865/ENPI CBC MED/EU/GRAND No 2438/49/30.12.2013 “A Location-aware System for Fruit Fly Monitoring and Pest Management Control”, as part of the ENPI CBC Mediterranean Sea Basin Programme. This cross-border cooperation (CBC) multilateral initiative, funded by the EU under the European Neighbourhood Partnership Instrument (ENPI), gathers 14 countries from both shores of the Mediterranean with a view to address common challenges in fields such as support to economic clusters and SMEs, environmental sustainability, enhancement of cultural heritage, people to people cooperation, and local governance. More information on the Programme is available on its website: www.enpicbcmed.eu.

Acknowledgments

Special thanks to Ricardo del Río, Leonor Almenar, Tona Pou, Agustina Herreros and Mar Leza for their valuable technical support in different moments of the project. Many thanks are also due to Macu Sans for dealing with administrative issues at UIB. We are also very grateful to Toni Mateu for his collaboration in the pilot trial and for allowing us the use of his farm “Son Llompart Nou”. In Memoriam of Toni Mateu’s grandfather, the original owner of the farm and a former collaborator in previous olive fly projects.

Conflicts of Interest

The authors declare no conflicts of interest.

References

  1. Kitchen, N.R. Emerging technologies for real-time and integrated agriculture decisions. Comput. Electron. Agric. 2008, 61, 1–3. [Google Scholar] [CrossRef]
  2. Stern, V.; Smith, R.; van den Bosch, R.; Hagen, K. The integration of chemical and biological control of the spotted alfalfa aphid: The integrated control concept. Hilgardia 1959, 29, 81–101. [Google Scholar] [CrossRef] [Green Version]
  3. Dias, N.P.; Zotti, M.J.; Montoya, P.; Carvalho, I.R.; Nava, D.E. Fruit fly management research: A systematic review of monitoring and control tactics in the world. Crop Prot. 2018, 112, 187–200. [Google Scholar] [CrossRef]
  4. McKinion, J.M.; Jenkins, J.N.; Willers, J.L.; Zumanis, A. Spatially variable insecticide applications for early season control of cotton insect pests. Comput. Electron. Agric. 2009, 67, 71–79. [Google Scholar] [CrossRef]
  5. Haff, R.P.; Saranwong, S.; Thanapase, W.; Janhiran, A.; Kasemsumran, S.; Kawano, S. Automatic image analysis and spot classification for detection of fruit fly infestation in hyperspectral images of mangoes. Postharvest Biol. Technol. 2013, 86, 23–28. [Google Scholar]
  6. Cohen, Y.; Cohen, A.; Hetzroni, A.; Alchanatis, V.; Broday, D.; Gazit, Y.; Timar, D. Spatial decision support system for Medfly control in citrus. Comput. Electron. Agric. 2008, 62, 107–117. [Google Scholar]
  7. Grasswitz, T.R. Integrated Pest Management (IPM) for Small-Scale Farms in Developed Economies: Challenges and Opportunities. Insects 2019, 10, 179. [Google Scholar] [CrossRef] [PubMed]
  8. Partel, V.; Nunes, L.; Stansly, P.; Ampatzidis, Y. Automated vision-based system for monitoring Asian citrus psyllid in orchards utilizing artificial intelligence. Comput. Electron. Agric. 2019, 162, 328–336. [Google Scholar] [CrossRef]
  9. Ding, W.; Taylor, G. Automatic moth detection from trap images for pest management. Comput. Electron. Agric. 2016, 123, 17–28. [Google Scholar] [CrossRef]
  10. Goldshtein, E.; Cohen, Y.; Hetzroni, A.; Gazit, Y.; Timar, D.; Rosenfeld, L.; Grinshpon, Y.; Hoffman, A.; Mizrach, A. Development of an automatic monitoring trap for Mediterranean fruit fly (Ceratitis capitata) to optimize control applications frequency. Comput. Electron. Agric. 2017, 139, 115–125. [Google Scholar]
  11. Shaked, B.; Amore, A.; Ioannou, C.; Valdés, F.; Alorda, B.; Papanastasiou, S.; Goldshtein, E.; Shenderey, C.; Leza, M.; Pontikakos, C.; et al. Electronic traps for detection and population monitoring of adult fruit flies (Diptera: Tephritidae). J. Appl. Entomol. 2017, 142, 1–9. [Google Scholar] [CrossRef]
  12. Jiang, J.A.; Tseng, C.L.; Lu, F.M.; Yang, E.C.; Wu, Z.S.; Chen, C.P.; Lin, S.H.; Lin, K.C.; Liao, C.S. A GSM-based remote wireless automatic monitoring system for field information: A case study for ecological monitoring of the oriental fruit fly, Bactrocera dorsalis (Hendel). Comput. Electron. Agric. 2008, 62, 243–259. [Google Scholar] [CrossRef]
  13. Kalamatianos, R.; Karydis, I.; Doukakis, D.; Avlonitis, M. DIRT: The Dacus Image Recognition Toolkit. J. Imaging 2018, 4, 129. [Google Scholar] [CrossRef]
  14. Pontikakos, C.M.; Tsiligiridis, T.A.; Drougka, M.E. Location-aware system for olive fruit fly spray control. Comput. Electron. Agric. 2010, 70, 355–368. [Google Scholar]
  15. Pontikakos, C.M.; Tsiligiridis, T.A.; Yialouris, C.P.; Kontodimas, D.C. Pest management control of olive fruit fly (Bactrocera oleae) based on a location-aware agro-environmental system. Comput. Electron. Agric. 2012, 87, 39–50. [Google Scholar]
  16. Nardi, F.; Carapelli, A.; Dallai, R.; Roderick, G.K.; Frati, F. Population structure and colonization history of the olive fly, Bactrocera oleae (Diptera, Tephritidae). Mol. Ecol. 2005, 14, 2729–2738. [Google Scholar] [CrossRef] [PubMed]
  17. Nestel, D.; Rempoulakis, P.; Yanovski, L.; Miranda, M.A.; Papadopoulos, N.T. The Evolution of Alternative Control Strategies in a Traditional Crop: Economy and Policy as Drivers of Olive Fly Control. In Advances in Insect Control and Resistance Management; Horowitz, A.R., Ishaaya, I., Eds.; Springer International Publishing: Cham, Switzerland, 2016; pp. 47–76. ISBN 978-3-319-31800-4. [Google Scholar]
  18. Fletcher, B.S. The Biology of Dacine Fruit Flies. Annu. Rev. Entomol. 1987, 32, 115–144. [Google Scholar] [CrossRef]
  19. Neuenschwander, P.; Michelakis, S. The infestation of Dacus oleae (Gmel.) (Diptera, Tephritidae) at harvest time and its influence on yield and quality of olive oil in Crete. Zeitschrift für Angew. Entomol. 1978, 86, 420–433. [Google Scholar] [CrossRef]
  20. Tzanakakis, M.E. Seasonal development and dormancy of insects and mites feeding on olive: A review. Netherlands. J. Zool. 2003, 52, 87–224. [Google Scholar] [CrossRef]
  21. Burrack, H.J.; Connell, J.H.; Zalom, F.G. Comparison of olive fruit fly (Bactrocera oleae (Gmelin)) (Diptera: Tephritidae) captures in several commercial traps in California. Int. J. Pest. Manag. 2008, 54, 227–234. [Google Scholar] [CrossRef]
  22. Alonso Muñoz, A.; García Marí, F. Eficacia del trampeo masivo en el control de la mosca del olivo Bactrocera oleae (Diptera: Tephritidae): Determinación del daño al fruto y de la pérdida económica en cantidad y calidad del aceite. Boletín Sanid. Veg. Plagas 2012, 38, 291–309. [Google Scholar]
  23. Tabic, A.; Yunis, H.; Wali, M.A.; Haddadin, J.; Hijawi, T.; Zchori-Fein, E. The use of OLIPE traps as a part of a regional effort towards olive fly (Bactrocera oleae Gmelin) control. Isr. J. Plant. Sci. 2011, 59, 53–58. [Google Scholar] [CrossRef]
  24. Broumas, T.; Haniotakis, G.E. Comparative Field Studies of Various Traps and Attractants of the Olive Fruit-Fly, Bactroceraoleae. Entomol. Exp. Appl. 1994, 73, 145–150. [Google Scholar] [CrossRef]
  25. Economopoulos AP Use of traps Based on Color and /or Shape. In Fruit Flies Their Biology Natural Enemies and Control, World Crop Pest 3B; Robinson, A.S.; Hooper, G. (Eds.) Elsevier: Amsterdam, the Netherlands, 1989; pp. 315–327. [Google Scholar]
  26. Mazomenos, B.E.; Pantazi-mazomenou, A.; Stefanou, D. Attract and kill of the olive fruit fly Bactrocera olear in Greece as a part of an integrated control system. IOBC wprs Bulletin 2002, 25, 1–11. [Google Scholar]
  27. Moreno Vázquez, R.; Montiel Bueno, A. Metodología utilizada en España para la realización de estudios bio - ecológicos sobre las poblaciones naturales del Dacus oleae (Gmel.). Resultados provisionales obtenidos en dos años de trabajo. Boletín de Sanidad Vegetal. Plagas 1982, 8, 43–53. [Google Scholar]
  28. Petacchi, R.; Guidotti, D.; Rizzi, I. Spatial data analysis in integrated pest management in olive growing. In Proceedings of the Acta Horticulturae, 30 October 2002; Vol. 586, pp. 835–839. [Google Scholar]
  29. Guidotti, D.; Ragaglini, G.; Petacchi, R. Analysis of spatio-temporal Bactrocera oleae (Diptera, Tephritidae) infestation distributions obtained from a large-scale monitoring network and its importance to IPM. Integr. Prot. Olive Crop. IOBC/wprs Bull. 2005, 28, 13–18. [Google Scholar]
  30. Nestel, D.; Carvalho, J.; Nemny-Lavy, E. The Spatial Dimension in the Ecology of Insect Pests and Its Relevance to Pest Management. In Insect Pest Management; Springer Berlin Heidelberg: Berlin, Heidelberg, Germany, 2004; pp. 45–63. [Google Scholar]
  31. Biondi, A.; Mommaerts, V.; Smagghe, G.; Viñuela, E.; Zappalà, L.; Desneux, N. The non-target impact of spinosyns on beneficial arthropods. Pest. Manag. Sci. 2012, 68, 1523–1536. [Google Scholar] [CrossRef] [PubMed]
  32. González-Núñez, M.; Pascual, S.; Seris, E.; Esteban-durán, J.R. Effects of different control measures against the olive fruit fly (Bactrocera oleae (Gmelin )) on beneficial arthropod fauna. Methodology and first results of field assays. Pestic. Benef. Org. IOBC/wprs Bull. 2008, 35, 26–31. [Google Scholar]
  33. Pascual, S.; Cobos, G.; Seris, E.; Sánchez-Ramos, I.; González-Núñez, M. Spinosad bait sprays against the olive fruit fly (Bactrocera oleae (Rossi)): Effect on the canopy non-target arthropod fauna. Int. J. Pest. Manag. 2014, 60, 37–41. [Google Scholar] [CrossRef]
  34. Miranda, M.A.; Miquel, M.; Terrassa, J.; Melis, N.; Monerris, M. Parasitism of Bactrocera oleae (Diptera; Tephritidae) by Psyttalia concolor (Hymenoptera; Braconidae) in the Balearic Islands (Spain). J. Appl. Entomol. 2008, 9–10, 132. [Google Scholar]
  35. Alorda, B.; Valdés, F.; Mas, B.; Leza, M.; Almenar, L.; Feliu, J.; Ruiz, M.; Miranda, M.A. Design of an energy efficient and low cost trap for Olive fly monitoring using a ZigBee based Wireless Sensor Network. In Proceedings of the 10th European Conference on Precision Agriculture, Volcani Center, Israel, 12–16 July 2015. [Google Scholar]
  36. Yasin, S.; Rempoulakis, P.; Nemny-Lavy, E.; Levi-Zada, A.; Tsukada, M.; Papadopoulos, N.T.; Nestel, D. Assessment of lure and kill and mass-trapping methods against the olive fly, Bactrocera oleae (Rossi), in desert-like environments in the Eastern Mediterranean. Crop. Prot. 2014, 57, 63–70. [Google Scholar] [CrossRef]
  37. Francisco, J.; De, F.; Pérez, M.R.; Valdes, F.; Bartomeu, C.; Ladaira, A. Plataforma tecnológica para el control de la plaga de la mosca del olivo. In Proceedings of the Geographic information science and technology conference (TIG), Malaga, Spain, 30 July 2016; pp. 474–483. [Google Scholar]
  38. Sanz-Cortés, F.; Martinez-Calvo, J.; Badenes, M.L.; Bleiholder, H.; Hack, H.; Llacer, G.; Meier, U. Phenological growth stages of olive trees (Olea europaea). Ann. Appl. Biol. 2002, 140, 151–157. [Google Scholar] [CrossRef]
  39. Genç, H.; Nation, J.L. Survival and development of Bactrocera oleae Gmelin (Diptera:Tephritidae) immature stages at four temperatures in the laboratory. African, J. Biotechnol. 2008, 7, 2495–2500. [Google Scholar]
  40. CAIB Resolució del director general d’Agricultura i Desenvolupament Rural de 7 de juliol de 2010 per la qual s’estableix la Norma tècnica per a la producció integrada d’olivar a l’àmbit de la comunitat autònoma de les Illes Balears. Annex VI Control Integrado; BOIB Num. 116 07-08-2010. 2010; 37–41.
  41. Doitsidis, L.; Fouskitakis, G.N.; Varikou, K.N.; Rigakis, I.I.; Chatzichristofis, S.A.; Papafilippaki, A.K.; Birouraki, A.E. Remote monitoring of the Bactrocera oleae (Gmelin) (Diptera: Tephritidae) population using an automated McPhail trap. Comput. Electron. Agric. 2017, 137, 69–78. [Google Scholar] [CrossRef]
  42. Tirelli, P.; Borghese, N.A.; Pedersini, F.; Galassi, G.; Oberti, R. Automatic monitoring of pest insects traps by Zigbee-based wireless networking of image sensors. In Proceedings of the 2011 IEEE International Instrumentation and Measurement Technology Conference (I2MTC); IEEE: New York, NY, USA, 2011; pp. 1192–1196. [Google Scholar]
  43. Dimou, I.; Koutsikopoulos, C.; Economopoulos, A.; Lykakis, J. The distribution of olive fruit fly captures with McPhail traps within an olive orchard. Phytoparasitica 2003, 31, 124–131. [Google Scholar] [CrossRef]
  44. Ortega, M.; Pascual, S.; Rescia, A.J. Spatial structure of olive groves and scrublands affects Bactrocera oleae abundance: A multi-scale analysis. Basic Appl. Ecol. 2016, 17, 696–705. [Google Scholar] [CrossRef]
  45. Wang, X.-G.; Johnson, M.W.; Daane, K.M.; Nadel, H. High Summer Temperatures Affect the Survival and Reproduction of Olive Fruit Fly (Diptera: Tephritidae). Environ. Entomol. 2009, 38, 1496–1504. [Google Scholar] [CrossRef] [PubMed]
  46. Fletcher, B.S.; Pappas, S.; Kapatos, E. Changes in the ovaries of olive flies (Dacus oleae (Gmelin)) during the summer, and their relationship to temperature, humidity and fruit availability. Ecol. Entomol. 1978, 3, 99–107. [Google Scholar] [CrossRef]
  47. Kakani, E.G.; Zygouridis, N.E.; Tsoumani, K.T.; Seraphides, N.; Zalom, F.G.; Mathiopoulos, K.D. Spinosad resistance development in wild olive fruit fly Bactrocera oleae (Diptera: Tephritidae) populations in California. Pest. Manag. Sci. 2010, 66, 447–453. [Google Scholar]
  48. Kampouraki, A.; Stavrakaki, M.; Karataraki, A.; Katsikogiannis, G.; Pitika, E.; Varikou, K.; Vlachaki, A.; Chrysargyris, A.; Malandraki, E.; Sidiropoulos, N.; et al. Recent evolution and operational impact of insecticide resistance in olive fruit fly Bactrocera oleae populations from Greece. J. Pest. Sci. (2004). 2018, 91, 1429–1439. [Google Scholar] [CrossRef]
  49. Barrios, G.; Mateu, J.; Ninot i Cort, A.; Romero, A.; Vichi, S. Sensibilidad varietal del olivo a Bactrocera oleae y su incidencia en la Gestión Integrada de Plagas. Phytoma España La Rev. Prof. Sanid. Veg. 2015, 21. [Google Scholar]
  50. Lowenberg-DeBoer, J.; Erickson, B. Setting the Record Straight on Precision Agriculture Adoption. Agron. J. 2019, 111, 1552. [Google Scholar] [CrossRef]
Figure 1. Area of study in Son Llompart: Location aware system (LAS) plots 1, 2, and 3 (where decision support system (DSS) was applied); NO-LAS Plots 1, 2, and 3 (conventional control) and control plot are represented.
Agronomy 09 00620 g001
Figure 2. Categories of land use in the surroundings of the selected orchard for the pilot trial.
Agronomy 09 00620 g002
Figure 3. Architecture of the data transfer protocol from e-traps at orchard level to the servers at UIB and to the Fruitfly central servers.
Agronomy 09 00620 g003
Figure 4. Electronic components of the e-trap. Left: Battery and electronics. Center: Upper part of the e-trap showing solar panel and Stevenson screens that protected temperature and relative humidity (HR) sensors. Right: Camera placed in front of a Rimi® trap.
Agronomy 09 00620 g004
Figure 5. Output of the OliveFlyNet application interface showing: (a) and (b) Values of temperature, (c) and (d) Values of relative humidity collected by sensors in e-traps.
Agronomy 09 00620 g005
Figure 6. Output of the OliveFlyNet applications interface showing details about information stored in the UIB geodatabase: (a) Tree location and identification, (b) Risk report according to DSS, (c) Tree location map, (d) Spray report as conducted in the tree, and (e) Tree picture.
Agronomy 09 00620 g006
Figure 7. Output of the OliveFlyNet application interface showing details about the real-time insect counting system (ReTIC) system based on analysis of pictures sent by the e-traps. (a) Node report, (b) Node location, (c) Trap image, and (d) Capture report.
Agronomy 09 00620 g007
Figure 8. Decision support system input-output diagram. The relational database compiles information from trees (position, phenology BBCH, and fruit load), captures (e-traps), and meteorological data (HR% and daily average temperature). The different parameters are collected at field level and uploaded to the UIB geodatabase. This database transfers data to the FruitFlyNet geodatabase that feeds the C-PLAS software that estimates levels of risk for the LAS plots according to the parameters considered to make a decision to spray (DSS risk analysis). Once decision is made, C-PLAS estimates a tractor route for the different LAS plots and spraying can be performed.
Agronomy 09 00620 g008
Figure 9. Images sent by the e-traps where B. oleae adults were identified (red circles).
Agronomy 09 00620 g009
Figure 10. Average of FTD captures ± S.D. with Rimi® traps in NO-LAS, LAS, and control plots. Arrows indicate the week of spraying.
Agronomy 09 00620 g010
Figure 11. Average of FTD captures with McPhail ± S.D. traps in NO-LAS and control plot from June to October.
Agronomy 09 00620 g011
Figure 12. Average of temperature (°C) and relative humidity (% HR ± S.D. recorded by the e-traps sensors.
Agronomy 09 00620 g012
Figure 13. Example of interpolated maps of B. oleae FTD of LAS 1 from 16 to 27 October 2015. Node gaps in interpolations mean no image received from that day.
Agronomy 09 00620 g013
Figure 14. Output of the risk analysis of 27 October plotted using the OliveFlyNet application interface where (a) is temperature, (b) relative humidity (c) B. oleae adult captures (FTD)and (d) is a risk map where red color indicates areas where insecticide spraying is needed according with the parameters introduced into the DSS (C-PLAS Software).
Agronomy 09 00620 g014
Figure 15. Screen capture of the DSS output (C-PLAS Software). Left: areas of the LAS plots that reached the threshold for insecticide treatment (red color). Right: assigned risk value per tree according to DSS output.
Agronomy 09 00620 g015
Figure 16. Average of the BBCH scale ± S.D. indicating the phenology of the olive trees within the NO-LAS, LAS, and control plots.
Agronomy 09 00620 g016
Figure 17. Weight of collected fruits from July to October in NO-LAS, LAS, and control plots.
Agronomy 09 00620 g017
Figure 18. Average percentage of fruit infestation in NO-LAS, LAS, and control plots ± S.D. from fruits collected weekly from 27 August 2015 to 28 October 2015. Values followed by the same letter indicate no significant differences among plots (Kruskall–Wallis test, p > 0.05).
Agronomy 09 00620 g018
Figure 19. Percentage of parasitism by P. concolor in larvae obtained from infested fruits of NO-LAS, LAS, and control plots. Values followed by the same letter indicate no significant differences among plots (Kolmogorov–Smirnov test, p < 0.05).
Agronomy 09 00620 g019
Table 1. Date of treatments, NO-LAS and LAS plots treated, surface treated, and volume of broth sprayed for insecticide treatments. (e): ‘Empeltre’ variety; (p): ‘Picual’ variety.
Date#Plot NO-LASSurface (ha)Vol. of Broth (L)Plot LASSurface (ha)Vol. of Broth (L)
16/07/152(e)1112(e)111
11/09/151(p)1111(p)0.55.5
2(e)1112(e)111
3(p)111---
17/09/151(p)1111(p)0.252
2(e)111---
24/09/151(p)1111(p)0.55.5
2(e)111---
1-2/10/151(p)1111(p)0.7511
2(e)1223(p)122
3(p)122---
16/10/151(p)1221(p)122
2(e)1222(e)122
3(p)1223(p)122
Total 14209 8132
Table 2. Indicators of the efficacy of DSS for controlling B. oleae in the LAS plots compared to conventional control in the NO-LAS plots during the pilot trial: Number of pesticide applications, insecticide treated area, volume of pesticide applied, tractor path length, and duration of insecticide treatments.
IndicatorNO-LASLAS% Reduction
Pilot Area3 ha (1 ha/plot)3 ha (1 ha/plot)-
No. of Pesticide Applications660
Insecticide treated area (ha)148−42.85
Volume of Pesticide Applied (L)209132−36.84
Tractor path length (Km)24.1114.10−41.52
Spraying duration (min)317185−41.64
Table 3. Number of trees (N trees) and mean percentage fruit load (FL) of each LAS plot. Values followed by different letters indicate significant differences among LAS plots. (Kruskal–Wallis test: p < 0.05).
LAS 1LAS 2LAS 3Total
N trees197119192508
Average FL (%)18.5 ± 25.8a45.3 ± 39.0b34.0 ± 36.5c32.7 ± 36.0
Max. FL (%)90909090
Min. FL (%)0000

