Article

Defining and Evaluating a Decision Support System (DSS) for the Precise Pest Management of the Mediterranean Fruit Fly, Ceratitis capitata, at the Farm Level

by
Andrea Sciarretta
1,*,
Maria Rosaria Tabilio
2,
Armando Amore
1,2,
Marco Colacci
1,2,
Miguel Á. Miranda
3,
David Nestel
4,
Nikos T. Papadopoulos
5 and
Pasquale Trematerra
1
1
Department of Agriculture, Environmental and Food Sciences, University of Molise 13 via De Sanctis, 86100 Campobasso, Italy
2
CREA, Consiglio per la Ricerca in Agricoltura e L’analisi Dell’economia Agraria, Research Centre for Olive, Citrus and Tree Fruit, via di Fioranello 52, 00134 Rome, Italy
3
Applied Zoology and Animal Conservation Research Group, University of the Balearic Islands, INAGEA-UIB, 07122 Palma, Spain
4
Department of Entomology, Institute of Plant Protection, ARO, Rishon Letzion P.O. Box 15159, Israel
5
Laboratory of Entomology and Agricultural Zoology, Department of Agriculture Crop Production and Rural Environment, University of Thessaly, Fytokou st., 38446 N. Ionia (Volos), Greece
*
Author to whom correspondence should be addressed.
Agronomy 2019, 9(10), 608; https://doi.org/10.3390/agronomy9100608
Submission received: 5 August 2019 / Revised: 26 September 2019 / Accepted: 30 September 2019 / Published: 2 October 2019
(This article belongs to the Special Issue Information Technologies for Precision Plant and Crop Protection)

Abstract

:
A Decision Support System (DSS) was developed and evaluated to control the Mediterranean fruit fly (medfly), Ceratitis capitata (Wiedermann), by incorporating a semi-automatic pest monitoring and a precision targeting approach in multi-varietal orchards. The DSS consists of three algorithms. DSS1, based on the degree days calculation, defines when the traps should be deployed in the field initiating the medfly population monitoring. DSS2 defines the areas to be treated and the type of treatment based on the number of adult medfly captures, harvesting time, and phenological stage of the host cultivar. DSS3 defines the spraying procedure considering the technical registration properties of the selected insecticide (e.g., withholding period and efficacy duration time) and weather conditions. The DSS was tested in commercial orchard conditions near Rome, central Italy, with a randomized complete blocks experimental design, comparing DSS-assisted and conventional management. In the DSS-assisted plots, a semi-automatic adult medfly monitoring system was deployed, composed of real-time, wireless electronic traps. The output of the functioning DSS is a map of spraying recommendation, reporting the areas to be treated and the treatment type (bait or cover insecticide spraying). The farmer was left free to follow, or not, the DSS indications. The first medfly captures were observed on June 30, whereas the DD threshold was reached on July 3 when the DSS started to operate. The field test produced 29 DSS decisions from July 3 to September 1 and confirmed that medfly management using the DSS substantially reduced the number of pesticide applications, the treated area, and the volumes of pesticide utilization. No significant differences in infested fruit were observed between DSS-assisted and conventional management. The level of acceptance of the DSS by the farmer was 78%. This evidence confirmed the requirement of fully involving farmers and pest managers during the evaluation process of DSS.

1. Introduction

As it is known, the Mediterranean fruit fly or medfly, Ceratitis capitata (Wiedermann) (Diptera: Tephritidae), is a highly invasive, extremely polyphagous species that is attacking a wide variety of fruit. The current list of medfly host plants comprises more than 300 fruit species including many cultivated ones, such as citrus, pome, and stone fruits, as well as several tropical and subtropical fruit species of high economic value [1,2,3]. The risk of medfly attack is related to various factors, such as the period of ripening during the season and the physical–chemical characteristics of the fruit [4,5]. Among the host species, peaches (Prunus persica (L.)) are particularly susceptible to medfly infestation, especially as far as late ripening cultivars with smooth peel are concerned. Tools that are used for the control of this pest mainly rely on chemical treatments, using insecticides such as pyrethroids, chitin synthesis inhibitors, spinosad, and organophosphates, although the number of active ingredients belonging to the latter category has been greatly reduced in various parts of the world [6,7,8]. Traditionally, cover-sprays of the entire crop area are still extensively used, with important consequences to the environment, health risks to operators and consumers, and the development of resistant pest populations [9]. The use of bait sprays is more economically and environmentally sound. A bait spray consists of a suitable insecticide mixed with a protein bait. Both male and female medfly are strongly attracted to protein sources releasing ammonia and “consume” the insecticide. Hence, insecticides can be applied to just a few spots in an orchard, assuring low diffusion of the chemicals used. Based on these principles, attractant devices for mass-trapping or lure-and-kill have been developed for medfly and other Tephritidae [10,11,12,13]. Besides these control options, other medfly management tactics and strategies have been implemented, such as the Sterile Insect Technique (SIT), which requires significant economic investments and specialized organizational efforts [14].
During the last decade, Decision Support Systems (DSS) have been developed and tested to manage insect pests and diseases in several places of the world. DSS are computer-assisted tools that are used to improve decision-making processes by including systematic knowledge of the system and by implementing rules to improve and systematize decision-making [15]. Their application for the management of medfly populations can provide major advantages as they can operate to increase the sustainability of the system by reducing the use of pesticides, while maintaining acceptable (very low) fruit damage levels. Despite the major advances that DSS offer, only a few have been developed for the Mediterranean fruit fly and other Tephritidae. One of the first developed and tested DSS for medfly was published approximately 10 years ago by Cohen et al. [16,17]: the “MedCila” spatial DSS (SDSS), which included the spatial dimension to control medfly in citrus orchards in Israel. However, its adoption in Israel has been slowly proceeding, mainly because of structural constraints and the difficulty to transform the developed system into a commercial product. Recently, an Israeli company undertook the development of a SDSS to manage medfly on citrus, which is based on MedCila. The SDSS development is currently highly advanced and an application for smartphones has recently been developed. The system will be tested during the next citrus season in Israel [18].
The purpose of the present study was to develop and validate in commercial prunus orchards a Decision Support System (DSS) that is designed to incorporate elements of “precision agriculture” and “smart farming”. The DSS presented in the current study was specifically developed to target deciduous fruits that are attacked by medfly (whereas MedCila focused on citrus orchards), including sequential ripening cultivars (and or species) which are typical in the European landscape and production system. These types of orchards add additional difficulties in the decision-making process of a DSS due to the differential susceptibility in time and space of planted varieties. The developed and tested DSS also incorporates a precision targeting approach to manage the spatial and temporal variability of pest risk and the novel, recently developed medfly semi-automatic adult monitoring [19], which is not considered by MedCila, which is expected to be fully automated in the near future.

2. Materials and Methods

2.1. Study Area and Production System

The field trials were conducted in Italy during the year 2015 in the farm Azienda Verbesi, located near Rome, in a flat agricultural landscape (41°54′22″ N latitude, 12°44′06″ E longitude, and 47 m a.s.l.). In the region, C. capitata is considered a key pest for many fruit species, in particular peaches, apples, and figs. To limit fruit damages, regular insecticide application is required. In untreated orchards, medfly infestation can lead to the complete loss (100% fruit infestation) of fruit production.
Two neighbouring multi-varietal orchards were used to test the medfly DSS, called Verbesi Old and Verbesi New, with a surface of 28 ha and 15 ha, respectively (Figure 1). They included 25 different cultivars ripening from the end of May until mid-September (Table S1). During the implementation of the testing, the orchards were at full production (>70%); some newly-planted varieties entered production during the year of the DSS execution. The planting system is linear and rows are oriented in the East-West direction in Verbesi Old and South-North in the Verbesi New orchard. Each cultivar is planted in rows, occupying a different surface-size. In Verbesi Old, early cultivars (harvested in June) were located in the central area of orchard; late cultivars expanded from the centre towards the North and Southern edges of the orchards. In Verbesi New, late cultivars were located on the eastern side of the orchard. The surface occupied by each cultivar varied from 0.5 to 2.3 hectares (Table S1). At harvest, all fruits were collected, although a few scattered fruits remained on the trees or on the ground after they fell. Agronomic conditions (e.g., soil type, fertilization, pruning, irrigation) were uniform in the two orchards.
In the surroundings of the two experimental orchards, there were additional peach and kiwi orchards. In the region of the study, all the farms, including the Azienda Verbesi farm, were managed for medfly control on a calendar basis, i.e., with repeated applications of mainly pyrethroids and organophosphates, to ensure continuous protection of the fruits until harvest.

2.2. Decision Flowchart: A Guide for Medfly Control

The DSS structure is divided into three modules:
DSS1: START OF MANAGEMENT ACTION
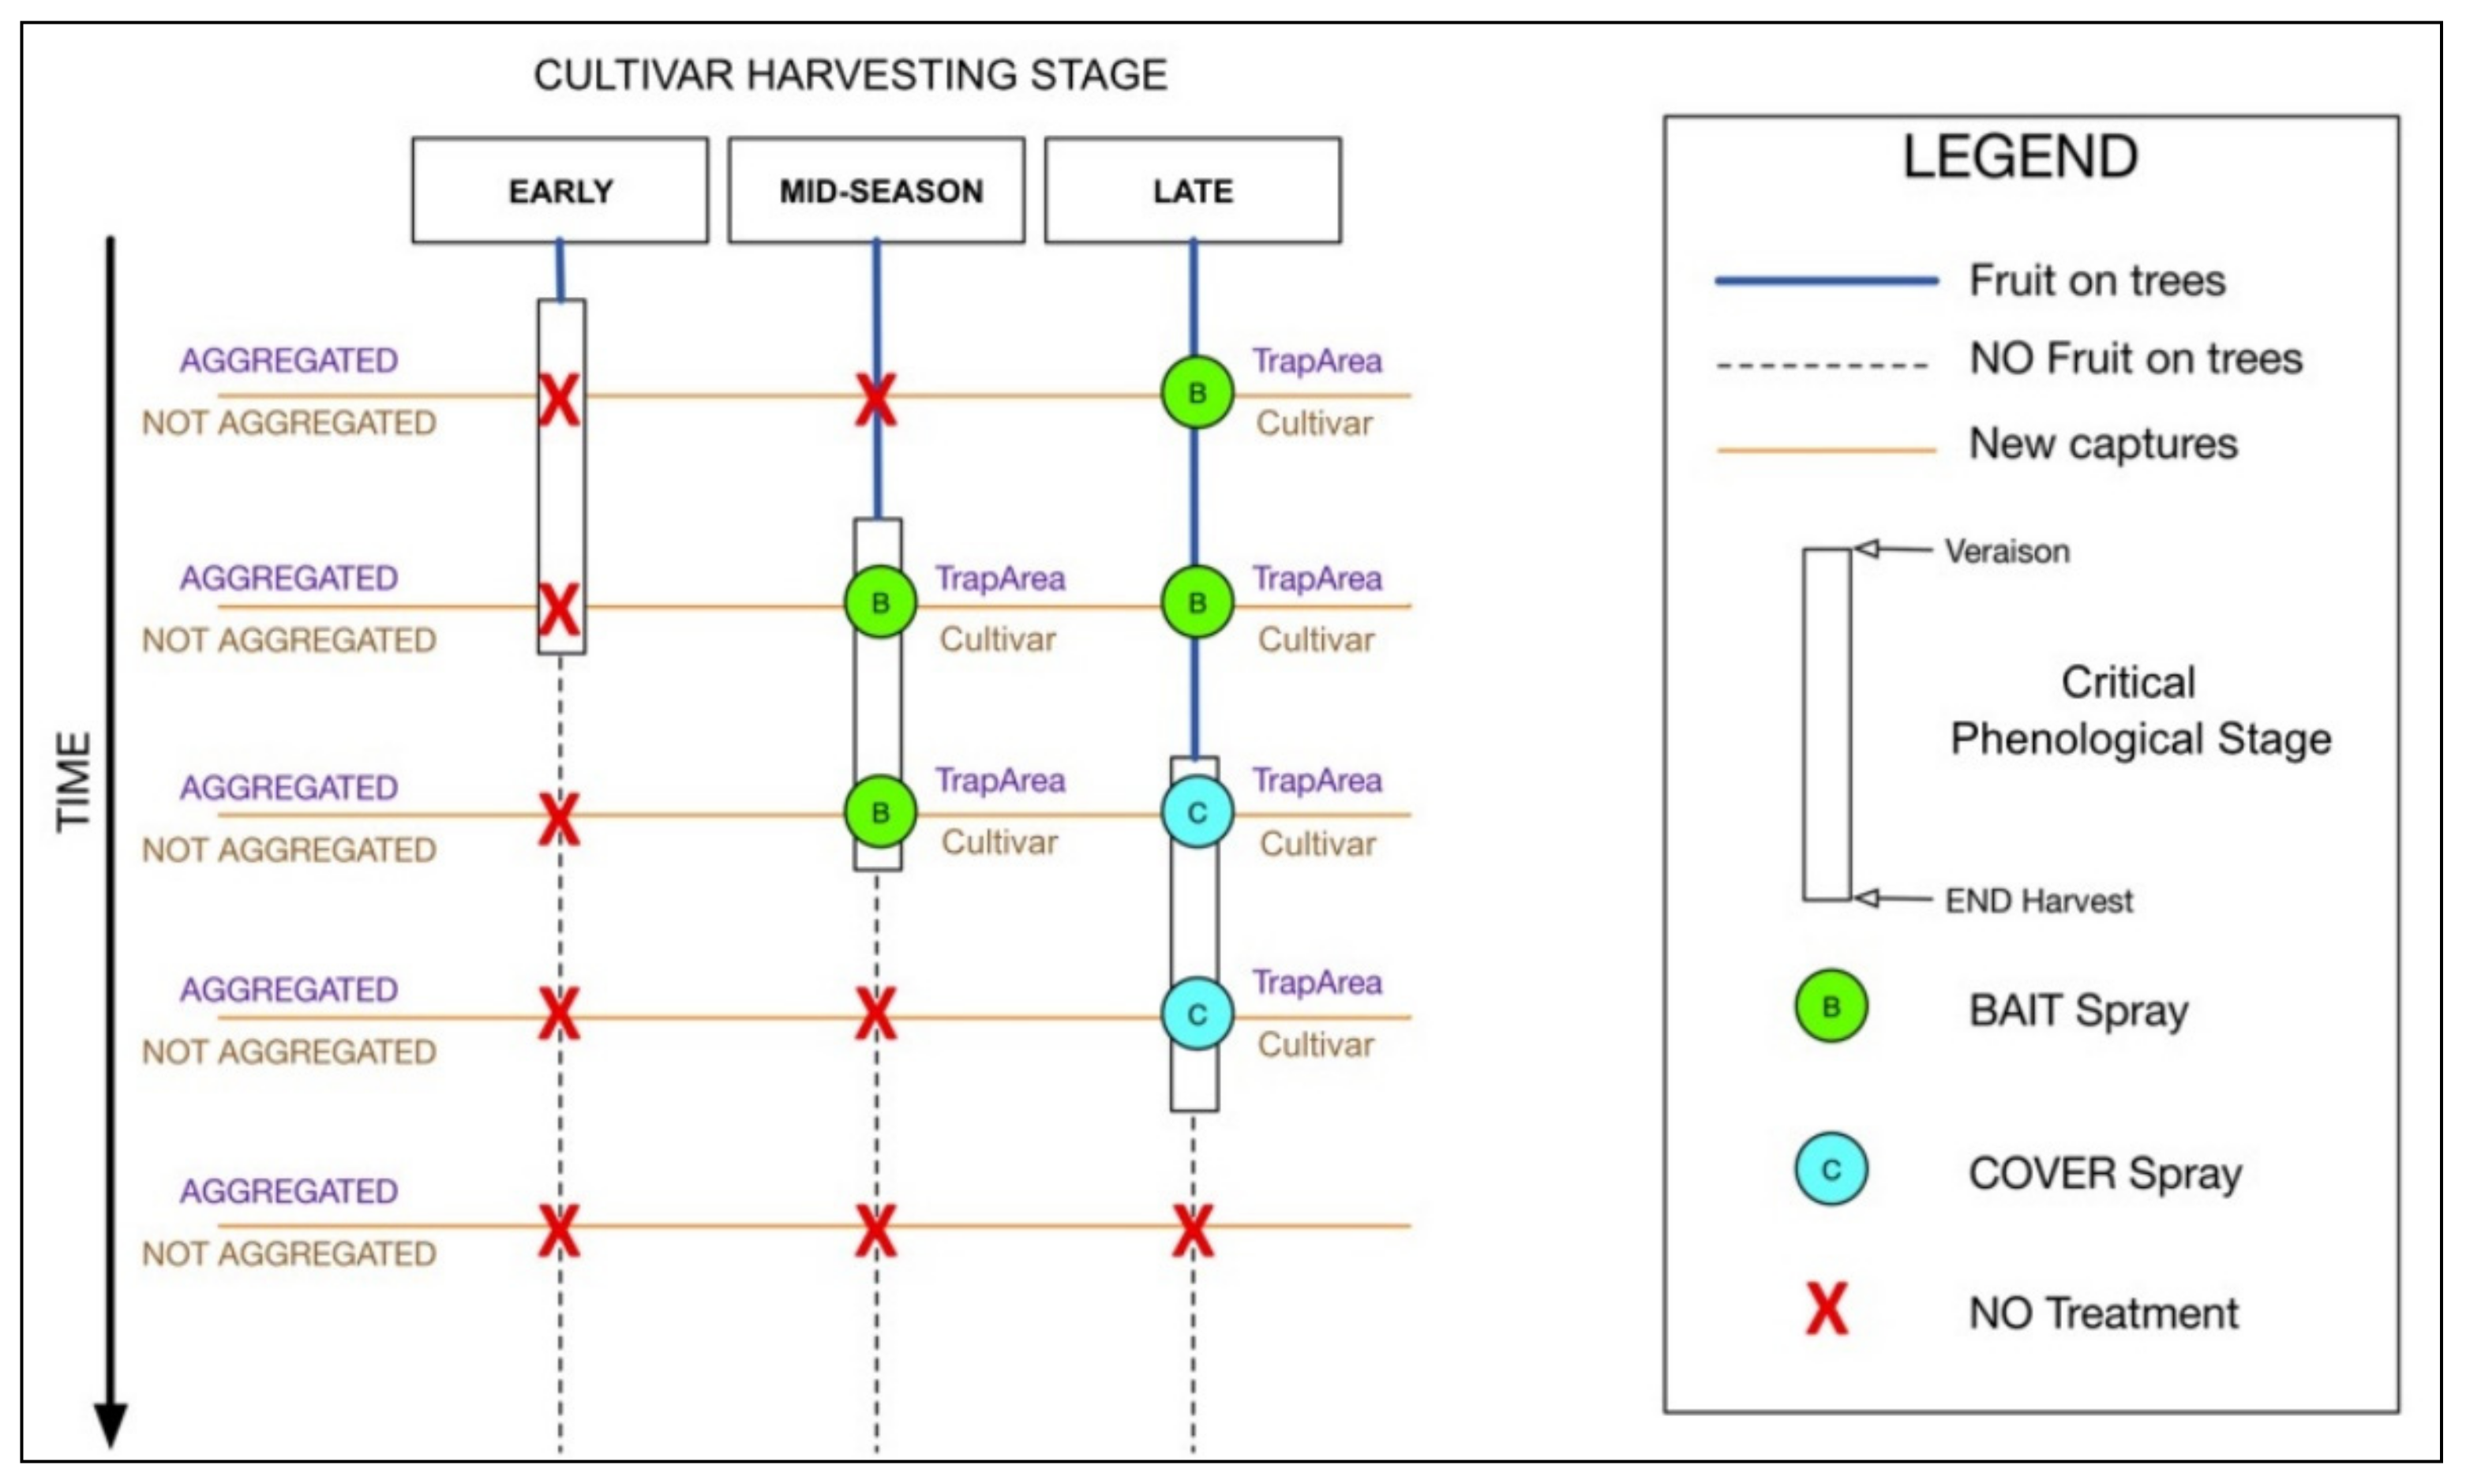
DSS2: WHEN AND WHERE TO SPRAY
DSS3: SPRAYING
The DSS1 algorithm defines when the traps should be deployed in the field to initiate the medfly population monitoring (Figure S1).
The day of trap deployment is based on the Degree Days (DD) calculation, according to [20], where the lower developmental threshold was set at 10 °C. The daily DD accumulation are calculated from a biofix date (1st of January), when DD is set to 0, and the first adults in the field are expected when the DD accumulation reaches 620. Although medfly adults could survive until the cold season, overwintering adults have not been detected in the area during winter [21]. When the accumulated DD reaches the recommended amount for the onset of “adult activity”, DSS1 produces an alert, directing the deployment of traps in the orchards and the establishment of the monitoring grids. At this stage, the algorithm stops and DSS2 enters into action. In the case of this study, we deployed traps before the required time dictated by the DSS1 in order to investigate the reliability of the DSS1 prediction.
The DSS2 algorithm defines the areas to be treated and the type of treatment, based on medfly captures, harvesting time, and phenological stage of cultivars (Figure S2). The decision diagram of DSS2 is explained in Figure 2. For each variety, the “Harvest Period” is defined as follows:
EARLY cultivar: Harvest ends before July 15;
MID-SEASON cultivar: Harvest ends between July 16 and August 15;
LATE cultivar: Harvest ends after August 16.
DSS2 is implemented once there is fruit on the trees. After the fruit veraison, cultivars enter into the “Critical Phenological Stage” (Figure 2). At this stage, the risk for the fruits to be attacked by Medfly adults substantially increases.
According to the phenological stage, the DSS2 defines the treatment type to be used (Figure 2). There are two main kinds of treatments:
BAIT spray, to be executed only on spotted trees evenly on an entire row;
COVER spray, to be executed on all marked trees.
DSS2 also establishes the extension of the area to be treated, evaluating the trapping spatial pattern. If the number of traps with new captures are <1/3 of the total number of traps in the plot, the trapping spatial pattern is defined as “aggregated” and pesticide applications will be conducted only in TrapAreas where the new captures are recorded. The TrapArea is the area around a trap according to the following rule: a tree belongs to the TrapArea(X) if the tree is closer to the trap X than to any other trap (Figure 3). If traps with new captures are >1/3 of the total number of traps in the plot, the trapping spatial pattern is defined as “not aggregated” and the treatment will be carried out in all cultivars that are within the same phenological stage. In this case, the treatment unit is the single cultivar.
The DSS3 algorithm defines the spraying procedure of the individual trees derived from the DSS2 output (Figure S3). The algorithm evaluates if the treatment at that precise time is necessary or if there is active protection from a previous treatment (i.e., the tree is still within the activity range period of the previous application). Withholding period (WP), i.e., the minimum time between the last application and harvest, and efficacy duration time (EDT), i.e., the maximum time of insecticide efficacy, are strictly related to the pesticides to be used or previously used, respectively. If the treatment is necessary, weather conditions (such as wind or rain) are evaluated before treatment to decide the appropriateness of spraying at that time; DSS3 gives some indication based on meteorological conditions. The output of DSS3 highlights on the map the trees to be treated and the spray type to be used.

2.3. DSS Assessment Setting

In 2015, a trial was set up to test the DSS functioning in real orchard conditions and to contrast its performance with the conventional management of calendar cover sprays. Randomized complete blocks were used as the experimental design, with 3 blocks as replicates (A, B, C). Each block had two 3 ha plots, with the same peach cultivars and the same amount of trees. Within each block, the management type (DSS-assisted or conventional) was randomly assigned to one of the two plots (Figure 1). In addition, an abandoned peach orchard (1 ha), with Fairtime cultivar, which was located close to the experimental area, was selected to be used as a reference (control) plot without any medfly management. All the relevant landscape elements and orchard features were digitalized to form a geographical database, including the position and cultivar type of the individual trees.
The inputs that are used to run the DSS were collected as follows: monitoring of medfly adults (both males and females) was carried out with six traps per plot. In the DSS-assisted plots, a semi-automatic monitoring system was also deployed. This system was composed of an electronic trap (e-trap) that was recently developed [19]. The e-traps are based on a modified Jackson trap model, baited with Biolure (ammonium acetate, putrescine, and trimethylamine) to attract both Medfly sexes. Images of the sticky surface at the base of the trap were sent on a daily basis via Wi-Fi and 3G connection to a remote server, where an “office-scout” visually inspected the high resolution images to identify and count the medfly specimens. This operation was carried out once a week and coincided with the survey in the field of the standard Jackson traps (baited with Biolure) in the conventional plots. The traps were cleaned and the attractive lure was changed approximately once a month. The numbers of medflies from the e-traps were entered into the DSS algorithm. The details of the infrastructure of the electronic hardware, the communication systems, and the performance of the modified traps are reported in Shaked et al. [19]. In the conventional plots, adult monitoring (both males and females) was carried out with standard Jackson traps baited with the same attractant that was used in e-traps. The traps were serviced once a week and the lure was changed once a month.
Fruit load and phenological stage were field-inspected at a frequency of once a week and were entered into DSS2. Hourly temperatures, wind, and rain were recorded using sensors that were located in a meteorological station in the orchard and were used as input for DSS3.
The output of the functioning DSS is a map of spraying recommendations, reporting the areas to be treated and the treatment type. For Bait spray treatment, deltamethrin (Decis®, Bayer, Germany, at a concentration of 0.01 mL/hLof the spraying solution) was applied with protein baits (Nu Bait®, Biogard, Italy, at 1.2% of the spraying solution). For cover spraying, etophenprox (Trebon®, Sipcam Italia, Italy, at a concentration of 0.007 mL/hL of the spraying solution) was used. In all cases, the farmer was left free to follow, or not, the DSS recommendations.
In the conventional plots, treatments were done following the standard protocol: for each cultivar, after the veraison, sprayings were conducted on a calendar basis to assure continuous protection of fruits, alternating etophenprox or deltamethrin insecticide at the concentration indicated above in accordance with their withholding period and efficacy duration time.
A tractor, equipped with a GPS mobile, carried out the treatments’ recording for both the DSS-assisted and conventional plots. The recording included the path and the duration of the spraying process.
The DSS algorithms were processed with Microsoft© Excel software and maps were produced using the geographic information system QGIS (QGIS Development Team (2015). QGIS Geographic Information System. Open Source Geospatial Foundation Project. http://qgis.osgeo.org).

2.4. Effectiveness and Farmer’s Acceptance of DSS

The effectiveness of the DSS prototype was validated by comparing the performance of the DSS control management versus the conventional calendar-based management, calculating the following indicators: fruit damage (% of infested fruits), area affected by applications (in hectares), number of insecticide applications per cultivar, and volume of insecticide applied (mL of active ingredient/ha).
In all the plots (DSS-managed, conventional, and reference), fruit damage was assessed from each cultivar at two stages: during ripening and at harvest. Sampling of the fruit consisted of randomly removing 10 fruits/tree dispersed throughout the canopy from 5 consecutive trees with an additional 10 fruits/tree collected from fruits that dropped to the ground. The fruits were then inspected for larvae of medfly by slicing the fruits in the laboratory.
The differences in fruit damage between the DSS and conventional plots were inferred with a two-way ANOVA, with management (DSS-assisted, conventional) and block (A, B, C) as the main effects. Before the analysis, all the sampling data from the same cultivar were combined and the calculated percentages were transformed to the arcsine of the square root to homogenise the variance [22]. Statistical analysis was carried out using SPSS software 13.0 (SPSS Inc., Chicago, IL, USA, 2009).
In the calculation of the area affected by applications and the number of insecticide applications per cultivar, bait and cover spraying were considered equivalent. The volume of insecticide applied was obtained considering both bait and cover treatments and is the result of the combination of different concentrations of p.a., different applications in the field (for baits every even row), and total treated area.
The level of acceptance of the DSS by the farmer was evaluated by comparing the recommendations given by the DSS and the final decision taken by the farmer. As mentioned earlier, farmers made independent decisions on following the DSS recommendations. The following three possibilities were considered in the farmer’s acceptance analysis: (i) the farmer makes insecticide treatments in agreement with DSS; (ii) the farmer does not conduct the treatments when requested by DSS; (iii) the farmer performs the treatments when not requested by DSS.

3. Results

3.1. Medfly Population Monitoring

The first medfly captures were recorded on June 30 in the e-traps (DSS plot) on block A, on July 9 in both plots of block B and in the conventional plot of block A, and on July 14 in both plots of block C. Catches remained very low until August 11, when medfly captures started to substantially increase (Figure 4). The patterns of adult captures in the e-traps (in DSS plots) and standard Jackson traps (in the conventional plots) of blocks A and C were very similar (Figure 4). Small differences, however, were reported in the fly peak intensity, without a clear preference for one or the other trapping device. In all the blocks, the main peak of adult captures was recorded at the beginning of September. A second peak of captures at the end of September varied in intensity and duration in the different blocks, whereas a third peak of captures was observed during mid-October in blocks B and C.

3.2. Management of Medfly Using DSS

In 2015, the DD threshold was reached on July 3, when the DSS prototype started to operate in the three blocks. The e-traps functioned until the end of the fruit harvest: August 9 in block A, September 20 in block B, and September 1 in block C.
During this period, the DSS was executed weekly, providing 6 spraying recommendations in block A, 13 in block B, and 10 in block C.
Two examples of the DSS decision outputs are reported in Figure 5. In the first case (related to the DSS output-map produced on July 14 for block A), the cv Orion in the DSS-plot was marked by DSS and was effectively treated with baits, whereas in the conventional plot, three cultivars were highlighted and recommended to be treated with cover sprays (Figure 6). In the second case (the output-map produced on August 4 for block B), the DSS suggested applying insecticides in three late cultivars, which were effectively treated with bait spraying (Figure 6). In the conventional plot, five cultivars were all treated with cover sprays (Figure 6).
A summary of DSS recommended applications and actually executed applications in each block are reported in Table S2.

3.3. Effectiveness and Farmer’s Acceptance of the DSS

Table 1 summarizes the observations of damaged fruits in the DSS-assisted and conventional plots. In general, no fruit infestation was recorded in the early ripening cultivars. As was expected, late ripening cultivars received most of the infestation. In block A, cultivars DS93-sel.25 and August Flame reported higher damage in the DSS-assisted plot compared to the absence of damage observed in the conventional plot. In block B, damages in the two plots were variably distributed, with cultivar TardiRed showing very high damage levels in both plots. In block C, most cultivars showed no, or low, damages in both types of plots.
No significant differences in infested fruits between DSS-assisted and conventional management were observed (F1,44 = 0.29, p = 0.59). Fruit damage differed between blocks (F2,44 = 5.88, p = 0.006). The interaction between type of management and blocks was not significant (F1,44 = 0.40, p = 0.67).
Fruit infestation in the reference plot was very high, with 90% of fruits infested by medfly, confirming that without chemical control, damage by medfly in the area can be guaranteed.
The difference of indicator values regarding the precision of pesticide application, and sprayed quantities calculated in DSS-assisted and conventional plots were obtained for each block (Table 2). Results showed a marked reduction in DSS-assisted plots compared to conventional management (Table 2). The area affected by applications and the number of treatments were strongly reduced in blocks B and C, where more late cultivars were located (Table 2). The volume of pesticide applied showed a reduction in all blocks.
The level of acceptance of the DSS recommendations are reported in Table 3. The final decision to treat the field was up to the farmer after receiving the DSS recommendations. The levels of agreements were very high, especially for block B. Very few suggested treatments were not executed and very few not requested treatments were carried out. The total agreement for the three blocks was 78%.
On average, treatments were carried out 1.3 days after the DSS output was produced.

4. Discussion

The Decision Support System (DSS) that was developed in the present study was mainly based on qualitative data (i.e., the presence of medfly trapped individuals in a monitoring trap, date of the veraison and harvesting period for each cultivar, and adverse meteorological conditions), combined with a quantitative approach, related to the DSS1 module (degree days calculated from a biofix date). Degree Days are not common in predicting the first generation of multivoltine tropical species, and their use in the present DSS was limited to the establishment of first adults in the field. Some of the incorporated qualitative variables, such as harvesting period and fruit phenological stage, combined with the presence of adult captures in the traps can be considered as key elements in calculating the risk for damage and were the most relevant criteria for establishing and defining the areas of treatment. These same parameters were also used in the spatial “MedCila” DSS that was tested in Israel citrus orchards by Cohen et al. [16], even if the decision rules were developed differently. The fact that the two spatial DSS developed for the same pests are based on similar parameters and their field application resulted in improved medfly management, this provides a basis for the future development of a single DSS that is able to manage this pest and other Tephritidae.
The utilization of e-traps for medfly adult monitoring seems to increase the efficacy of the DSS by providing fast assessment of adult captures, which can be used as input for the DSS on a daily basis. The e-trap functioned very well, except for one plot, where some connection problems caused delays in transmitting images to the server (for details, see Shaked et al. [19]). The introduction of automatic sensors for pest monitoring, such as e-traps, represents a significant improvement in the context of the so-called “smart agriculture” [23]. E-traps are already a mature and reliable technology, with electronic components having increasingly higher performances and lower costs. By using e-traps, the field data are available real time and are currently manually, or in the future, automatically, entered into the DSS. This leads to a reduction of labour and transportation costs since there is no need for field inspectors to go into the field every week. Our system was semiautomatic, meaning that trap images with caught medflies were transmitted daily via the internet to a remote operator, which visually inspected them and counted the insects directly by watching the image in a remote device [19,23]. Ideally, the monitoring system could be fully automated. That is, the e-trap should include an image classifier algorithm. Image analysis of fruit flies and insects can be based on machine learning or deep learning techniques [24,25]. This possibility is currently being investigated by our group and it is expected to be available in the near future. Once this ability is fully operational, trapping data can be directly loaded into the DSS, enhancing the system performance and the decision making process.
During our study, we were not always able to differentiate between male and female medflies in the digital images. Since decisions are usually based on female captures, we required special caution in the derivation of decisions and the extent and area of the application of the control measures. In addition, since no clear association exists between trapping and damage, further caution was required. Also, small differences in peaks were observed in different blocks, which was probably due to changes in aggregation areas between the blocks during the season. Thus, captures in the trap were considered a qualitative input parameter to the DSS. This approach increased the possibility to perform unnecessary treatments, especially when repeated low catches were found in most traps. Due to this extra cautious approach, only 23% of the DSS spraying recommendations reported a capture aggregation, even though it has been reported that medfly in this area and elsewhere tends to significantly aggregate, especially under low population densities [26,27]. Even with these limitations, the application of the DSS algorithm allowed us to differentiate insecticide applications for each cultivar, resulting in precision targeting treatments. The developed DSS allowed us to substitute, in many cases, cover spraying with bait spray applications, which drastically reduces the application of pesticides in the orchard (i.e., every even row). The application of the DSS and this strategy, thus, requires the production of risk maps, which are in fact the main instrument to correctly perform the application of control measures [28].
The current field test produced 29 decisions from July 3 to September 1, and confirmed that medfly management using the DSS significantly reduced the number of pesticide applications, the areas of application, and the volumes of pesticide utilization without increasing fruit damage. Differences among blocks were observed: block C, which is composed mostly of late cultivars, showed the largest positive effects of the DSS management (a reduction of up to 98.1% in the volume of pesticide applied as contrasted to the volume applied with the conventional management). This large difference is mainly due to the longer production period of late varieties and the constant calendar application of pesticides in the conventional management system, which importantly increases the number of applications. The management of late varieties with DSS, thus, could benefit greatly from this approach. Although with a more moderate reduction in pesticide treatments and volumes, early and mid-season varieties (blocks A and B) also showed an important reduction in pesticide use in DSS plots contrasted with conventional calendar-spraying management. It is noteworthy to point out that the reference plot showed very high levels of damage (up to 90%), confirming that, in the absence of any management, the medfly becomes highly destructive, at least on late cultivars.

5. Conclusions

The incorporation of DSS in current pest control practices is still slow. An important aspect they must overcome is their level of acceptance by the end users [29]. This is a paramount aspect to be considered because a DSS, even if technically valuable, may not be considered reliable by end users that aim at reducing risks and unwilling to take risks during performance, stop following DSS recommendations. For the MedCila DSS, the acceptance of its adoption among end users was specifically investigated: the interactive learning process between the DSS and the pest control managers, which contributed to a reduction of pesticide actions on an area-wide project, led to a general acceptance level of the DSS recommendations of up to 88% [17]. In our case, the acceptance level of DSS suggestions was 78%, based on the response of a single farmer. These two evidences further confirm the requirement of fully involving farmers and pest managers during the evaluation process of DSS, and to allow them to freely decide on accepting or not DSS recommendations, which will be based on the risk-taking aversion and heuristic knowledge of their orchards [29]. Nonetheless, it is expected that the acceptance level by farmers and managers could increase substantially if DSS output is developed as a smartphone application, which will facilitate its use, even for end users who are reluctant to interact with modern communication technology.

Supplementary Materials

The following are available online at https://www.mdpi.com/2073-4395/9/10/608/s1. Figure S1: Flowchart of the algorithm developed for the decision support system module DSS1 on pesticide spraying against Medfly in a multivarietal peach orchard in farm Azienda Verbesi (Rome, Italy). DSS1 defines the start of the management action based on the Degree Days (DD) calculation to predict the first Medfly adults in the field, Figure S2: Flowchart of the algorithm developed for the decision support system module DSS2 on pesticide spraying against Medfly in a multivarietal peach orchard in farm Azienda Verbesi (Rome, Italy). DSS2 defines the areas to be treated and the type of treatment based on Medfly captures, harvesting time, and phenological stage of variety, Figure S3: Flowchart of the algorithm developed for the decision support system module DSS3 on pesticide spraying against Medfly in a multivarietal peach orchard in farm Azienda Verbesi (Rome, Italy). DSS3 confirms the spraying procedure of the individual trees selected from DSS2 based on the withholding period (WP), i.e., the minimum time between the last application and harvest, the efficacy duration time (EDT), i.e., the maximum duration of effectiveness of the insecticide, and the weather conditions, Table S1: List of peach cultivars located in the orchards that were used to test DSS. The harvest period is divided as follows: Early cultivar: before 15th of July; Mid-season cultivar: between the 16th of July and the 15th of August; Late cultivar: after the 16th of August, Table S2: Complete scheme of type of treatment and cultivar recommended by the DSS and those that were actually executed in each block.

Author Contributions

A.S., M.R.T., A.A., M.Á.M., D.N., N.T.P., and P.T. conceived and designed the experiments; A.S., M.R.T., A.A., and M.C. performed the field experiments and analysed the data; A.S. and A.A. wrote the paper; M.R.T., M.C., M.Á.M., D.N., N.T.P., and P.T. revised the manuscript.

Funding

This study was financed by the EU through the two-year Project FruitFlyNet/II-B/2.1/0865/ENPI CBC MED/EU/GRAND No 2438/49/30.12.2013 “A Location-aware System for Fruit Fly Monitoring and Pest Management Control”, as part of the ENPI CBC Mediterranean Sea Basin Programme. This cross-border cooperation (CBC) multilateral initiative, funded by the EU under the European Neighbourhood Partnership Instrument (ENPI), gathers 14 countries from both shores of the Mediterranean with a view to address common challenges in fields such as support to economic clusters and SMEs, environmental sustainability, enhancement of cultural heritage, people to people cooperation, and local governance. More information on the programme is available on its website: www.enpicbcmed.eu.

Acknowledgments

We are especially thankful to Ernesto and Guido Verbesi (Rome, Italy) who allowed us to conduct fieldwork in their farm. We would like to thank Claudio Ceccaroli (CREA, Italy) for his help in the fieldwork.

Conflicts of Interest

The authors declare no conflict of interest.

References

  1. Liquido, N.J.; Shinoda, L.A.; Cunningham, R.T. Host plants of the Mediterranean fruit fly: An annotated word review. Misc. Publ. Entomol. Soc. Am. 1991, 77, 1–52. [Google Scholar]
  2. Hancock, D.; Hamacek, E.L.; Lloyd, A.C.; Elson-Harris, M.M. The Distribution and Host Plants of Fruit Flies (Diptera: Tephritidae) in Australia; Department of Primary Industries: Brisbane, Australia, 2000; pp. 1–75. [Google Scholar]
  3. Morales, P.; Cermeli, M.; Godoy, F.; Salas, B. A list of Mediterranean fruit fly Ceratitis capitata Wiedemann (Diptera: Tephritidae) host plants based on the records of INIA-CENIAP Museum of Insects of Agricultural Interest. Entomotropica 2004, 19, 51–54. [Google Scholar]
  4. Hernandez, M.M.; Vargas-Arispuro, I.; Adelantado, I.S.M.; Primo-Yufera, E. Electroantennogram activity and attraction assay of Ceratitis capitata to airborne volatiles from peach at three ripeness stages. Southwest. Entomol. 1999, 24, 133–142. [Google Scholar]
  5. Tabilio, M.R.; Fiorini, D.; Marcantoni, E.; Materazzi, S.; Delfini, M.; De Salvador, F.R.; Musmeci, S. Impact of the Mediterranean fruit fly (Medfly) Ceratitis capitata on different peach cultivars: The possible role of peach volatile compounds. Food Chem. 2013, 140, 375–381. [Google Scholar] [CrossRef] [PubMed]
  6. Australian Pesticides and Veterinary Medicines Authority (APVMA). Use of the Insecticide Dimethoate Suspended on Many Food Crops. 2011. Available online: http://apvma.gov.au/node/11771 (accessed on 7 July 2019).
  7. Australian Pesticides and Veterinary Medicines Authority (APVMA). Final Fenthion Review Decision. 2014. Available online: https://apvma.gov.au/node/12271 (accessed on 7 July 2019).
  8. European Commission (EU). Pesticides Database. 2019. Available online: http://ec.europa.eu/food/plant/pesticides/eu-pesticides-database (accessed on 17 July 2019).
  9. Vontas, J.; Hernández-Crespo, P.; Margaritopoulos, J.T.; Ortego, F.; Feng, H.T.; Mathiopoulos, K.D.; Hsu, J.C. Insecticide resistance in Tephritid flies. Pestic. Biochem. Physiol. 2011, 100, 199–205. [Google Scholar] [CrossRef]
  10. Leza, M.M.; Juan, A.; Capllonch, M.; Alemany, A. Female-biased mass trapping vs. bait application techniques against the Mediterranean fruit fly, Ceratitis capitata (Dipt., Tephritidae). J. Appl. Entomol. 2008, 132, 753–761. [Google Scholar] [CrossRef]
  11. Navarro-Llopis, V.; Domínguez-Ruiz, J.; Zarzo, M.; Alfaro, C.; Primo, J. Mediterranean fruit fly suppression using chemosterilants for area-wide integrated pest management. Pest Manag. Sci. 2010, 66, 511–519. [Google Scholar] [CrossRef] [Green Version]
  12. Piñero, J.C.; Enkerlin, W.; Epsky, N.D. Recent developments and applications of bait stations for Integrated Pest Management of Tephritid fruit flies. In Trapping and the Detection, Control, and Regulation of Tephritid Fruit Flies. Lures, Area-Wide Programs, and Trade Implications; Shelly, T., Epsky, N.D., Jang, E.B., Reyes-Flores, J., Vargas, R., Eds.; Springer: Dordrecht, The Netherlands, 2014; pp. 457–492. [Google Scholar]
  13. Hafsi, A.; Abbes, K.; Harbi, A.; Duyck, P.F.; Chermiti, B. Attract-and-kill systems efficiency against Ceratitis capitata (Diptera: Tephritidae) and effects on non-target insects in peach orchards. J. Appl. Entomol. 2015, 140, 28–36. [Google Scholar] [CrossRef]
  14. Enkerlin, W.; Gutiérrez-Ruelas, J.M.; Villaseñor Cortes, A.; Cotoc Roldan, E.; Midgarden, D.; Lira, E.; Zavala López, J.L.; Hendrichs, J.; Liedo, P.; Trujillo Arriga, F.J. Area freedom in Mexico from Mediterranean fruit fly (Diptera: Tephritidae): A review of over 30 years of a successful containment program using an Integrated Area-Wide SIT approach. Fla. Entomol. 2015, 98, 665–681. [Google Scholar] [CrossRef]
  15. Heinemann, P.H. Decision support systems for food and agriculture. In Interactions: Food, Agriculture and Environment; Lysenko, G., Squires, V., Verheye, W.H., Eds.; Encyclopedia of Life Support Systems (EOLSS) Publications: Oxford, UK, 2010; Volume 2, pp. 164–177. [Google Scholar]
  16. Cohen, Y.; Cohen, A.; Hetzroni, A.; Alchanatis, V.; Broday, D.; Gazit, Y.; Timar, D. Spatial decision support system for Medfly control in citrus. Comput. Electron. Agric. 2008, 62, 107–117. [Google Scholar] [CrossRef]
  17. Cohen, A.; Cohen, Y.; Broday, D.; Timar, D. Performance and acceptance of a knowledge-SDSS for medfly area-wide control. J. Appl. Entomol. 2008, 132, 734–745. [Google Scholar] [CrossRef]
  18. Gefen, G.; (Citrus Marketing Board, Fruit and Vegetables Grower’s Organization of Israel, Rishon Letzion, Israel). Personal communication, 2019.
  19. Shaked, B.; Amore, A.; Ioannou, C.; Valdés, F.; Alorda, B.; Papanastasiou, S.; Goldshtein, E.; Shenderey, C.; Leza, M.; Pontikakos, C.; et al. Electronic traps for detection and population monitoring of adult fruit flies (Diptera: Tephritidae). J. Appl. Entomol. 2018, 142, 43–51. [Google Scholar] [CrossRef]
  20. Allen, J.C. A modified sine wave for calculating degree days. Environ. Entomol. 1976, 5, 388–396. [Google Scholar] [CrossRef]
  21. Sciarretta, A.; Trematerra, P. Spatio-temporal distribution of Ceratitis capitata population in a heterogeneous landscape in Central Italy. J. Appl. Entomol. 2011, 135, 241–251. [Google Scholar] [CrossRef]
  22. Sokal, R.R.; Rohlf, F.J. Biometry: The Principles and Practice of Statistics in Biological Research, 3rd ed.; W.H. Freeman and Co.: New York, NY, USA, 1995; pp. 1–880. [Google Scholar]
  23. Sciarretta, A.; Calabrese, P. Development of automated devices for the monitoring of insect pests. Curr. Agric. Res. 2019, 7, 19–25. [Google Scholar] [CrossRef]
  24. Ding, W.; Taylor, G. Automatic moth detection from trap images for pest management. Comput. Electron. Agric. 2016, 123, 17–28. [Google Scholar] [CrossRef] [Green Version]
  25. Kalamatianos, R.; Karydis, I.; Doukakis, D.; Avlonitis, M. DIRT: The Dacus Image Recognition Toolkit. J. Imaging 2018, 4, 129. [Google Scholar] [CrossRef]
  26. Papadopoulos, N.T.; Katsoyannos, B.I.; Nestel, D. Spatial autocorrelation analysis of a Ceratitis capitata (Diptera: Tephritidae) adult population in a mixed deciduous fruit orchard in northern Greece. Environ. Entomol. 2003, 32, 319–326. [Google Scholar] [CrossRef]
  27. Sciarretta, A.; Tabilio, M.R.; Lampazzi, E.; Ceccaroli, C.; Colacci, M.; Trematerra, P. Analysis of the Mediterranean fruit fly [Ceratitis capitata (Wiedemann)] spatio-temporal distribution in relation to sex and female mating status for precision IPM. PLoS ONE 2018, 13, e0195097. [Google Scholar] [CrossRef]
  28. Sciarretta, A.; Trematerra, P. Geostatistical tools for the study of insect spatial distribution: Practical implications in the integrated management of orchard and vineyard pests. Plant. Protect. Sci. 2014, 50, 97–110. [Google Scholar] [CrossRef]
  29. Nestel, D.; Cohen, Y.; Shaked, B.; Victor, A.; Esther, N.L.; Miranda, M.A.; Sciarretta, A.; Papadopoulos, N.T. An integrated Decision Support System for an environmentally friendly management of the Ethiopian fruit fly in greenhouse crops. Agronomy 2019, 9, 459. [Google Scholar] [CrossRef]
Figure 1. Graphic representation of the multi-varietal orchards Verbesi New (on the left) and Verbesi Old (on the right) in the farm Azienda Verbesi (Rome, Italy), which were used to test the medfly Decision Support System (DSS). The experimental scheme in blocks A, B, and C is shown. The yellow rectangles delimit the plots in each block and the red stars indicate the position of the monitoring traps (e-traps in the DSS-assisted plots; Jackson traps in the conventional plots) in the field. The variously coloured dots identify the position of the trees and the extent of the cultivars (see Table S1 for details).
Agronomy 09 00608 g001
Figure 2. The logic model used in the development of the DSS2 module to define when and where to spray in the Medfly management system. The logic model contemplates three types of fruit based on their harvesting period: early, mid-season, late. DSS2 is initiated once the trees bear fruit. The diagram also schematically provides a period of high sensitivity, marked by the “Critical Phenological Stage”. The type of spray (bait or cover) along the time axis is based on risks, and it depends on “Cultivar Harvesting Stage” and “Critical Phenological Stage”. For example, late cultivars are either treated with cover sprays or baits if the fruit entered the critical phenological stage. The extension of the area to be treated is based on the evaluation of the trapping spatial pattern. If the number of the traps with new captures are <1/3 from the number of the traps of the plot, the trapping spatial pattern is defined as “aggregated” and treatments will be conducted in TrapAreas where new captures occur. If traps with new captures are >1/3, the trapping spatial pattern is defined as “not aggregated” and the treatment will be carried out in all cultivars that are at the same phenological stage.
Agronomy 09 00608 g002
Figure 3. Graphic representation on the map of the TrapAreas in blocks A, B, and C as output when the number of the traps with new captures are <1/3 of the number of the traps of the plot, as defined by DSS2. Red stars identify the position of the monitoring traps in the field. Each colour defines the TrapArea around a trap.
Agronomy 09 00608 g003
Figure 4. Mean medfly trapping levels calculated during the 2015 growing season from six e-traps for DSS-assisted plots and from six Jackson traps for conventional plots in blocks A, B, and C.
Agronomy 09 00608 g004
Figure 5. Example of maps produced as output of DSS for block A on July 14 (on the left) and for block B on August 4 (on the right). Red areas are DSS-assisted plots, blue areas are conventional plots. Cultivars to be treated according to the DSS recommendation are highlighted with coloured, dotted stripes. Background image from Google Earth.
Agronomy 09 00608 g005
Figure 6. Example of maps showing the treatments performed in block A (on the left) and block B (on the right) after the DSS recommendation of July 14 for block A and August 4 for block B (see Figure 5). The coloured rows represent the path of the tractor in the field for both DSS-assisted (red area) and conventional (blue area) plots. Rows with different colours represent various treated cultivars. Background image from Google Earth.
Agronomy 09 00608 g006
Table 1. Percentages of damaged fruits sampled in the conventional plots and DSS-assisted plots, calculated for each block and each cultivar.
BlockCultivarConventionalDSS-Assisted
ARich May0%0%
Big Bang0%0%
Crimson Lady0%0%
DS93-Selezione 250%6.4%
Orion0%0%
August Flame0%1.2%
Sum of all cultivars0%1.4%
BSagittaria0%0%
Royal Summer0%0%
Sweet Dream0.5%0%
California1.8%1.2%
Fairlane4.4%3.7%
Fairtime3.7%1.9%
TardiRed21.8%25.7%
Sum of all cultivars5.3%5.5%
CCrimson Lady0%0%
Flame rouge0%0%
Diamond Bright0%0%
Spring Bright0%1.2%
Rich Lady0%0%
Diamond Ray0%0%
Stark Red Gold0%0%
Venus0%0%
Kewea1.5%1.5%
Sum of all cultivars0.2%0.4%
Table 2. Main indicators calculated to evaluate the effectiveness of the DSS-assisted management compared to the conventional one, with the differences reported in percentages.
Area Affected by Applications (ha)Number and Type of Pesticide Applications per Single CultivarsVolume of Pesticide Applied (mL of a.i./ha)
BlocksABCABCABC
DSS-assisted2.915.280.227 baits10 baits
4 cover
1 bait26.1254.82.1
Conventional2.829.691.33 baits
4 cover
11 baits
17 cover
3 baits
3 cover
256.1963.6108.9
Differences *+3.2%−45.5%−83%0%−67%−95%−89.8%−73.6%−98.1%
* (DSS-assisted/conventional-1) × 100.
Table 3. Indication of the treatments suggested by DSS and those realized in agreement or not for single blocks and total. The total agreement was obtained by considering the treatments that were in agreement with DSS compared to all the executed treatments. N is the number of treatments; % is the percentage.
BlockTreatments Suggested by DSS (N)Treatments in Agreement with DSS (N)Treatments in Agreement with DSS (%)Treatments Not Executed (N)Treatments Executed but Not Requested by DSS (N)Total Agreement (%)
A7686%1175%
B1111100%0192%
C3133%2033%
Total211886%3278%

