Article

Genome-Wide Mining and Characterization of SSR Markers for Gene Mapping and Gene Diversity in Gossypium barbadense L. and Gossypium darwinii G. Watt Accessions

1
State Key Laboratory of Cotton Biology, Institute of Cotton Research, Chinese Academy of Agricultural Sciences, Anyang 455000, China
2
Plant Breeding and Genetics Division, Cotton Group, Nuclear Institute for Agriculture and Biology (NIAB), Jhang Road, Faisalabad 38000, Punjab, Pakistan
3
Hamelmalo Agricultural College, Keren P.O. Box 397, Eritrea
*
Authors to whom correspondence should be addressed.
These authors contributed equally.
Agronomy 2018, 8(9), 181; https://doi.org/10.3390/agronomy8090181
Submission received: 4 August 2018 / Revised: 1 September 2018 / Accepted: 10 September 2018 / Published: 12 September 2018
(This article belongs to the Special Issue Cotton Breeding, Genetics and Genomics)

Abstract

:
The present study aimed to characterize the simple sequence repeat markers in cotton using the cotton expressed sequence tags. A total of 111 EST-SSR polymorphic molecular markers with trinucleotide motifs were used to evaluate the 79 accessions of Gossypium L., (G. darwinii, 59 and G. barbadense, 20) collected from the Galapagos Islands. The allele number ranged from one to seven, with an average value of 2.85 alleles per locus, while polymorphism information content values varied from 0.008 to 0.995, with an average of 0.520. The discrimination power ranks high for the majority of the SSRs, with an average value of 0.98. Among 111 pairs of EST-SSRs and gSSRs, a total of 49 markers, comprising nine DPLs, one each of MonCGR, MUCS0064, and NAU1028, and 37 SWUs (D-genome), were found to be the best matched hits, similar to the 155 genes identified by BLASTx in the reference genome of G. barbadense, G. arboreum L., and G. raimondii Ulbr. Related genes GOBAR_DD21902, GOBAR_DD15579, GOBAR_DD27526, and GOBAR_AA04676 revealed highly significant expression 10, 15, 18, 21, and 28 days post-anthesis of fiber development. The identified EST-SSR and gSSR markers can be effectively used for mapping functional genes of segregating cotton populations, QTL identification, and marker-assisted selection in cotton breeding programs.

1. Introduction

Cotton (Gossypium L.) belongs to an allotetraploidy complex of angiosperms taxonomically related to the Gossypieae tribe; it is a part of the family Malvaceae. It is a major contributor of raw fibers, accounting for 95% of the world’s cotton [1]. Modern cotton cultivars are allotetraploid, G. hirsutum L., and G. barbadense, with chromosome numbers (n = 2x = 26) [2]. These modern cultivars evolved from A-genome diploids (n = x = 13) with an African or Asian origin by subsequent hybridization with the indigenous D-genome diploids of the New World through transoceanic dispersal [2]. G. darwinii is also allotetraploid cotton, having 26 chromosome pairs (2n = 4x = 52; 13 A_ and 13 D_) [3].
Genetic diversity among cultivated plants is of high value in worldwide biodiversity due to their wide range of contributions to the world economy and principal position in the production of world crops. In order to sustain the inherited enhancements of major cultivated species, it is necessary to collect, evaluate, characterize, and conserve, either on-farm or ex situ, their biodiversity. Thus major cotton production and the future of cotton breeding programs are highly reliant on meticulous knowledge and advanced genetic diversity assessment in cotton gene pools [4].
The development of new cotton cultivars through conventional sources is a time-consuming process; it takes as much as 7–9 years to advance from the F1 to the F9 generation—A major bottleneck in cotton breeding programs. Various plant breeding techniques have been employed to reduce the time taken, but Marker-Assisted Selection (MAS) is highly efficient [5,6]. Conventional breeding approaches and techniques are inadequate to explain the complex traits. The choice of molecular markers linked to significant agronomic traits can be an alternative to variety selection in the initial phase of breeding programs; this is called Marker-Assisted Selection and has to do with selecting the superior parents in a cross. So, this process can significantly reduce the time and costs required for developing novel accessions. Simple sequence repeats (SSRs) with small motifs consisting of 1–6 tandem repeat base pairs and edged by well-conserved sequences are most suitable for designing exact primers [7].
The SSRs are designed from expressed sequence tags (ESTs), which are actually a result of expressed genes that promote gene mapping with identified functional pathways [8,9]. These are set in the transcribed portion of the genome [10] and determine a direct association between genes and vital agronomic characteristics. A large number of plant species have been studied by developing ESTs, including cotton [11], willow [12], wheat [13], barley [14], sugarcane [15], and the rubber tree [16]. The CottonFGD (Cotton Functional Genomics database) covers genomic sequences, gene structural and functional annotations, genetic marker data, transcriptome data, and genome resequencing data of populations among the four sequenced Gossypium species [17]. Most of the EST-SSRs and gSSR markers suggest that the genes are linked to important metabolic processes like in carbohydrate metabolism, photosynthesis, sugar transport, and amino acid metabolism, along with biotic and abiotic stress response mechanisms [18].
Fewer molecular analyses have been reported; their main focus was G. barbadense and G. darwinii genetic diversity as compared to G. hirsutum. One of the earliest studies used isozymes to estimate the diversity and region of origin of G. barbadense and G. darwinii accessions [19]. The results depicted geographic clustering and a proposed geographical relationship across the Galapagos Islands.
An estimation of the cotton genetic diversity, as shown in the Wild Cotton Germplasm Nursery of China, is necessary to launch plans for collecting, conserving, and utilizing these germplasm resources in future breeding programs. Considerable effort has gone into describing the diversity of modern cultivated cottons G. barbadense and G. hirsutum, but not wild allotetraploid cotton species, even though it has been recognized that these accessions are useful for grasping the diversity of the germplasm collection. The objectives of the present study were to map the genetic structure of G. barbadense and G. darwinii within the Wild Cotton Germplasm Nursery of China, characterize the EST-SSRs and gSSRs, mine the useful genes related to important agronomic traits, determine whether these accessions can be elucidated by SSR markers and are useful in categorizing the diversity perceived within these accessions, and assess their worth in implementation for measuring collection purity.

2. Materials and Methods

2.1. Plant Material and DNA Extraction

We scrutinized the genetic diversity among 79 tetraploid accessions of Gossypium darwinii and Gossypium barbadense (Table 1). These accessions comprised 20 G. barbadense and 59 G. darwinii. Standard/control in G. barbadense accessions were four, while 16 collected from the Galapagos Islands and G. darwinii (five and 54 accessions, respectively) were compared. In this investigation, standard/control G. darwinii and G. barbadense accessions have been indicated growing to their high throughput selection pressure of cotton breeders while wild types are only those that are truly wild accessions, collected from Isabella, San Cristobal, and Santa Cruz islands of the Galapagos. These accessions were selected for the diversity study because both Gossypium species (G. barbadense and G. darwinii) are genetically very closely related. Genomic DNA was extracted from fresh leaves, collected using the method described by Zhang and Stewart [20] with some modifications.

2.2. PCR Primer Selection and Amplification

In total, 111 pairs of EST-SSRs and gSSRs polymorphic primers were analyzed for characterization of G. barbadense and G. darwinii accessions and functional gene mapping. To identify these markers, we used the CMD database (Cotton Marker Database CMD), Cottongen (http://www.cottongen.org; Cotton marker database), which is the largest database of cotton ESTs and genomic SSRs markers; it contains 12,250 and 24,000 SSR markers, respectively [21]. Particular primers and suitable PCR amplification conditions were employed for each SSR, and their polymorphism information content (PIC) and discrimination power (DP) were calculated. To confirm the validity of EST-SSRs and gSSRs, the genetic diversity in 79 cotton accessions (of two species) was assessed and compared to the results of earlier reports on different SSRs and pedigrees [22,23]. These SSR markers included 47 DPL, six MonCGR, one MUCS, two NAU, and 55 SWU (D-genome) derived from the Cotton Marker Database (CMD; http://www.cottonmarker.org). PCR amplification was done on a TAKARA Bio Inc. TP 600 thermal cycler (Bio Inc., Kusatsu, Japan) and silver staining was performed following the method described by Zhang et al. [24].

2.3. Identification of Genes with GO Functional Classification and Expression Analysis

The complete sequence between physical positions each of 47 DPL, six MonCGR, one MUCS, and two NAU; EST-SSR and gSSRs markers was used for BLAST and full sequences between the two nearest markers on the same chromosome of each 55 SWU (D-genome) EST-SSRs and gSSRs were used to mine the genes [25]. A BLASTx search E ≤ 1 × 10⁻⁵, identity ≥70%, and matched length ≥200 bp was applied to find homologs by sequence similarity in cotton (Gossypium spp.) [26,27]. A functional cotton genome database (https://cottonfgd.org/search) was used to analyze genes extracted from their genetic characteristics, protein features, GO functional classification, and RNA expression, by means of G. raimondii, G. arboreum, and G. barbadense as the reference genome [28]. Analysis of resulting RNA expression data was done to construct a heatmap using R statistical software version 3.4.4 (CSIRO Mathematical and Information Sciences, Cleveland, Australia) [29].

2.4. Statistical Analysis

2.4.1. Polymorphism Analysis

The polymorphism information content (PIC) and discrimination power (DP) were calculated using Excel 2010 (Microsoft Office, http://www.microsoft.com/) and the following formula was employed on the basis of band presence/absence data for individual accessions:
PIC = 1 i = j n P i 2
where Pi stands for the frequency of the allele at locus i and the summation covered n patterns [30].
A PIC value of 1 indicates that the marker can differentiate each line, and 0 indicates a monomorphic marker. DP values for the K-th primer were calculated based on the following formula:
DP k = 1 i = j I p j N p j 1 N 1
where N is the number of individuals and pj is the frequency of the j-th pattern [31].

2.4.2. Genetic Diversity Analysis

The EST-SSR- and gSSR-based pairwise genetic distances between accessions were determined according to Nei et al. [32] as described in DA distance. The gene diversity at each locus was calculated using Powermarker software package version 3.25 (http://www.powermarker.net). The phylogenetic tree was created on the basis of a distance matrix. Cluster analysis was done by the neighbor-joining (NJ) method, as illustrated by Liu et al. [33]. The dendrogram resulting from these calculations was plotted using MEGA6 software (Research Center for Genomics and Bioinformatics, Tokyo Metropolitan University, Hachioji, Tokyo, Japan and Center for Evolutionary Medicine and Informatics, Biodesign Institute, Arizona State University, Tempe, AZ, USA).

3. Results

3.1. Genome-Wide Mining and Characterization of Functional SSR Markers

The cotton genome functional database (http://cottonfgd.org/) was used to characterize the EST-SSRs and gSSR markers against the G. arboreum, G. raimondii, and G. barbadense whole-genome sequences. Among 111 pairs of EST-SSRs and gSSRs, a total of 49 markers including nine DPLs, one each of MonCGR, MUCS0064, and NAU1028, and 37 SWU (D-genome) were found in 155 G. barbadense genes based on BLASTx. Similarly, 42 markers have the best similarity hits with 116 genes by using G. raimondii as the reference genome, while 46 markers were found to be best matched with 135 genes when G. arboreum was used as the reference genome. Genes were distributed among all chromosomes except 10, 11, and 13 because all marker sequences do not match the best similarity in G. barbadense. The highest number of genes (51) was found on chromosome 7and they are associated with two DPL and 12 SWU markers, followed by chromosome 6 with 21 genes, while the minimum was two genes on chromosome 3. The rest of the chromosomes contained genes ranging in number from seven to 15. The physiochemical analysis of genes mined in this study indicated that genes have both hydrophobic and hydrophilic properties as the Grand Average of Hydropathy (GRAVY) values were found to range from −1 to 0.765, with a molecular weight ranging from 10.11 to 288.95 and an isoelectric point (PI) value in the range of −26.5 to 54 (Table S1). The intron‒exon interaction was determined to analyze the gene structure and the results imply that among 155 genes identified, the highest intron disruption was found in the genes GOBAR_DD07974 and GOBAR_DD37421, with 31 introns each. Further analysis of gene features was done to gather descriptive information about mined genes. Various kinds of genes were observed to be related to fiber development and stress response. The genes showing specific responses to stress were Zinc finger protein, E3 ubiquitin protein ligase, NAC domain protein, and plant UBX domain-containing protein. Genes involved in fiber development were also detected, i.e., MLO-like protein, protein CER1, protein ECIFERUM, protein PAT1 homolog, Ninja family protein, indole 3 acetic acid amido synthase, cyclin U4-1, Omega-3 fatty acid desaturase, mediator RNA II polymerase transcription, and L10 interacting MYB domain-containing protein (Table S2).
The used molecular markers are helpful in direct mapping of genes [34,35]. In this study, cotton ESTs derived from CMD was explored to find a group of markers related to various biological/molecular functions in cotton. These EST-SSRs and gSSRs improve the marker‒trait association as these are bonded to the transcribed domain of a genome. These functional molecular markers are valuable for getting data about gene variability that can affect significant breeding traits.

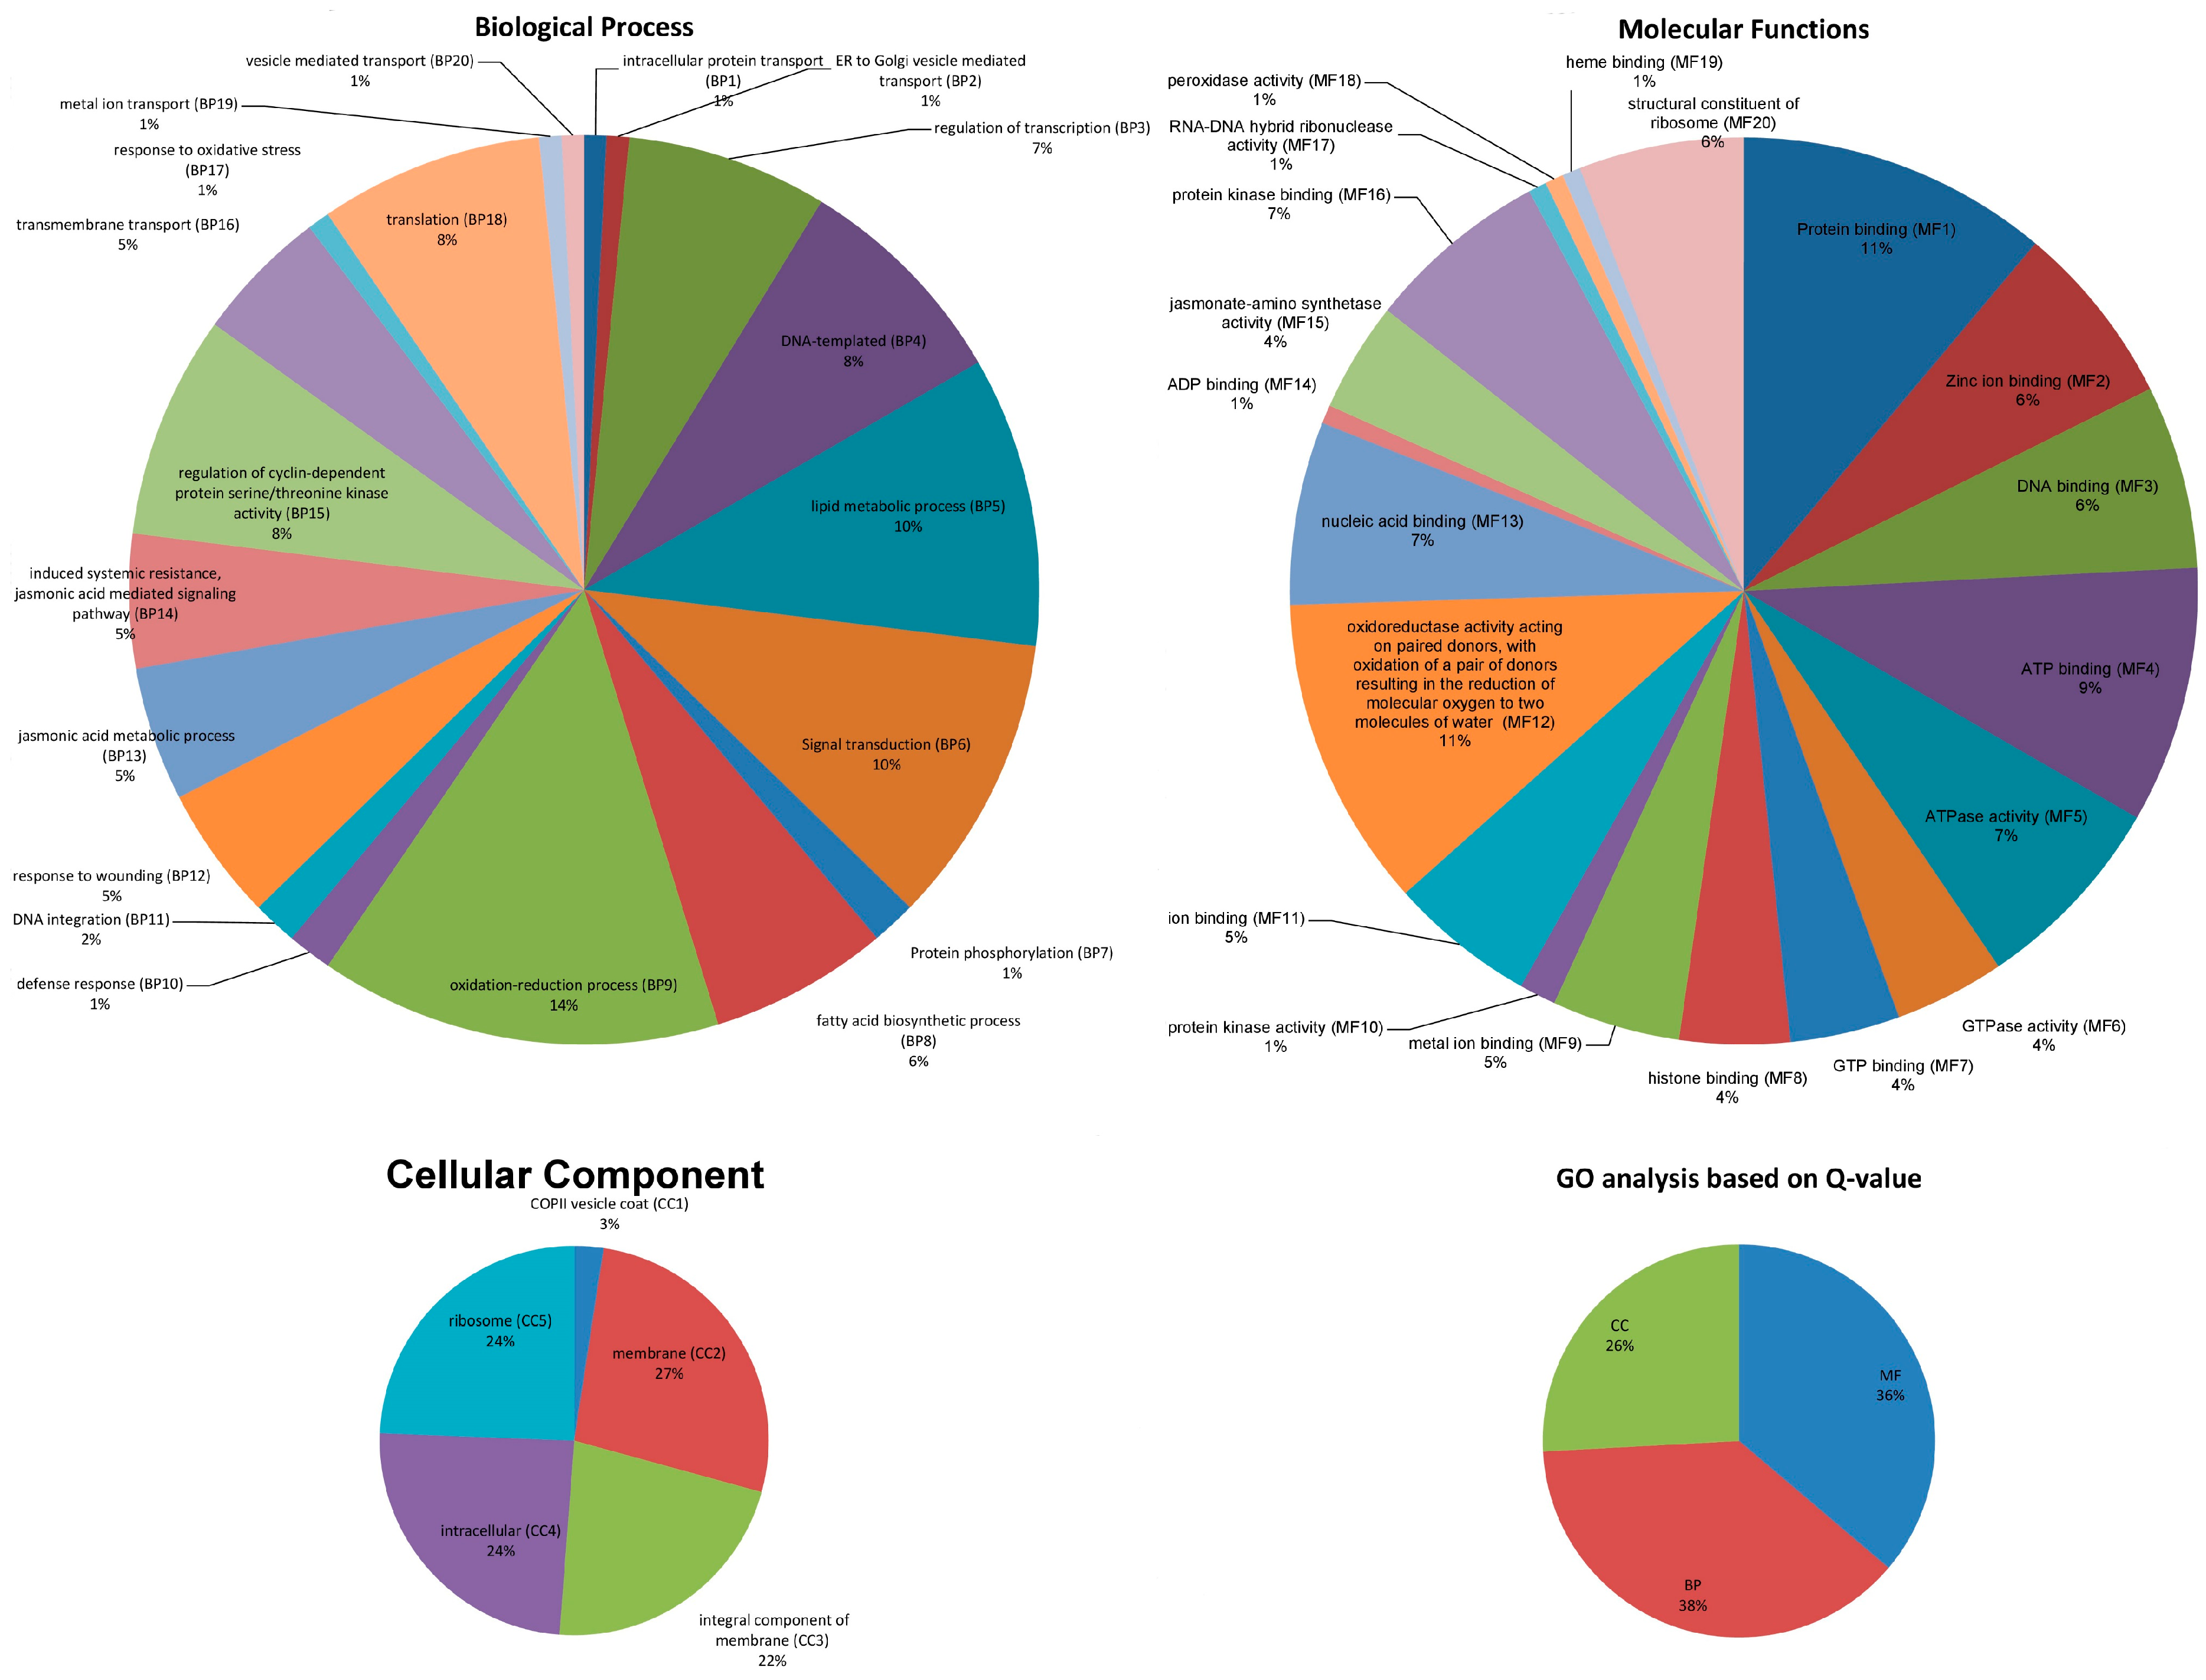
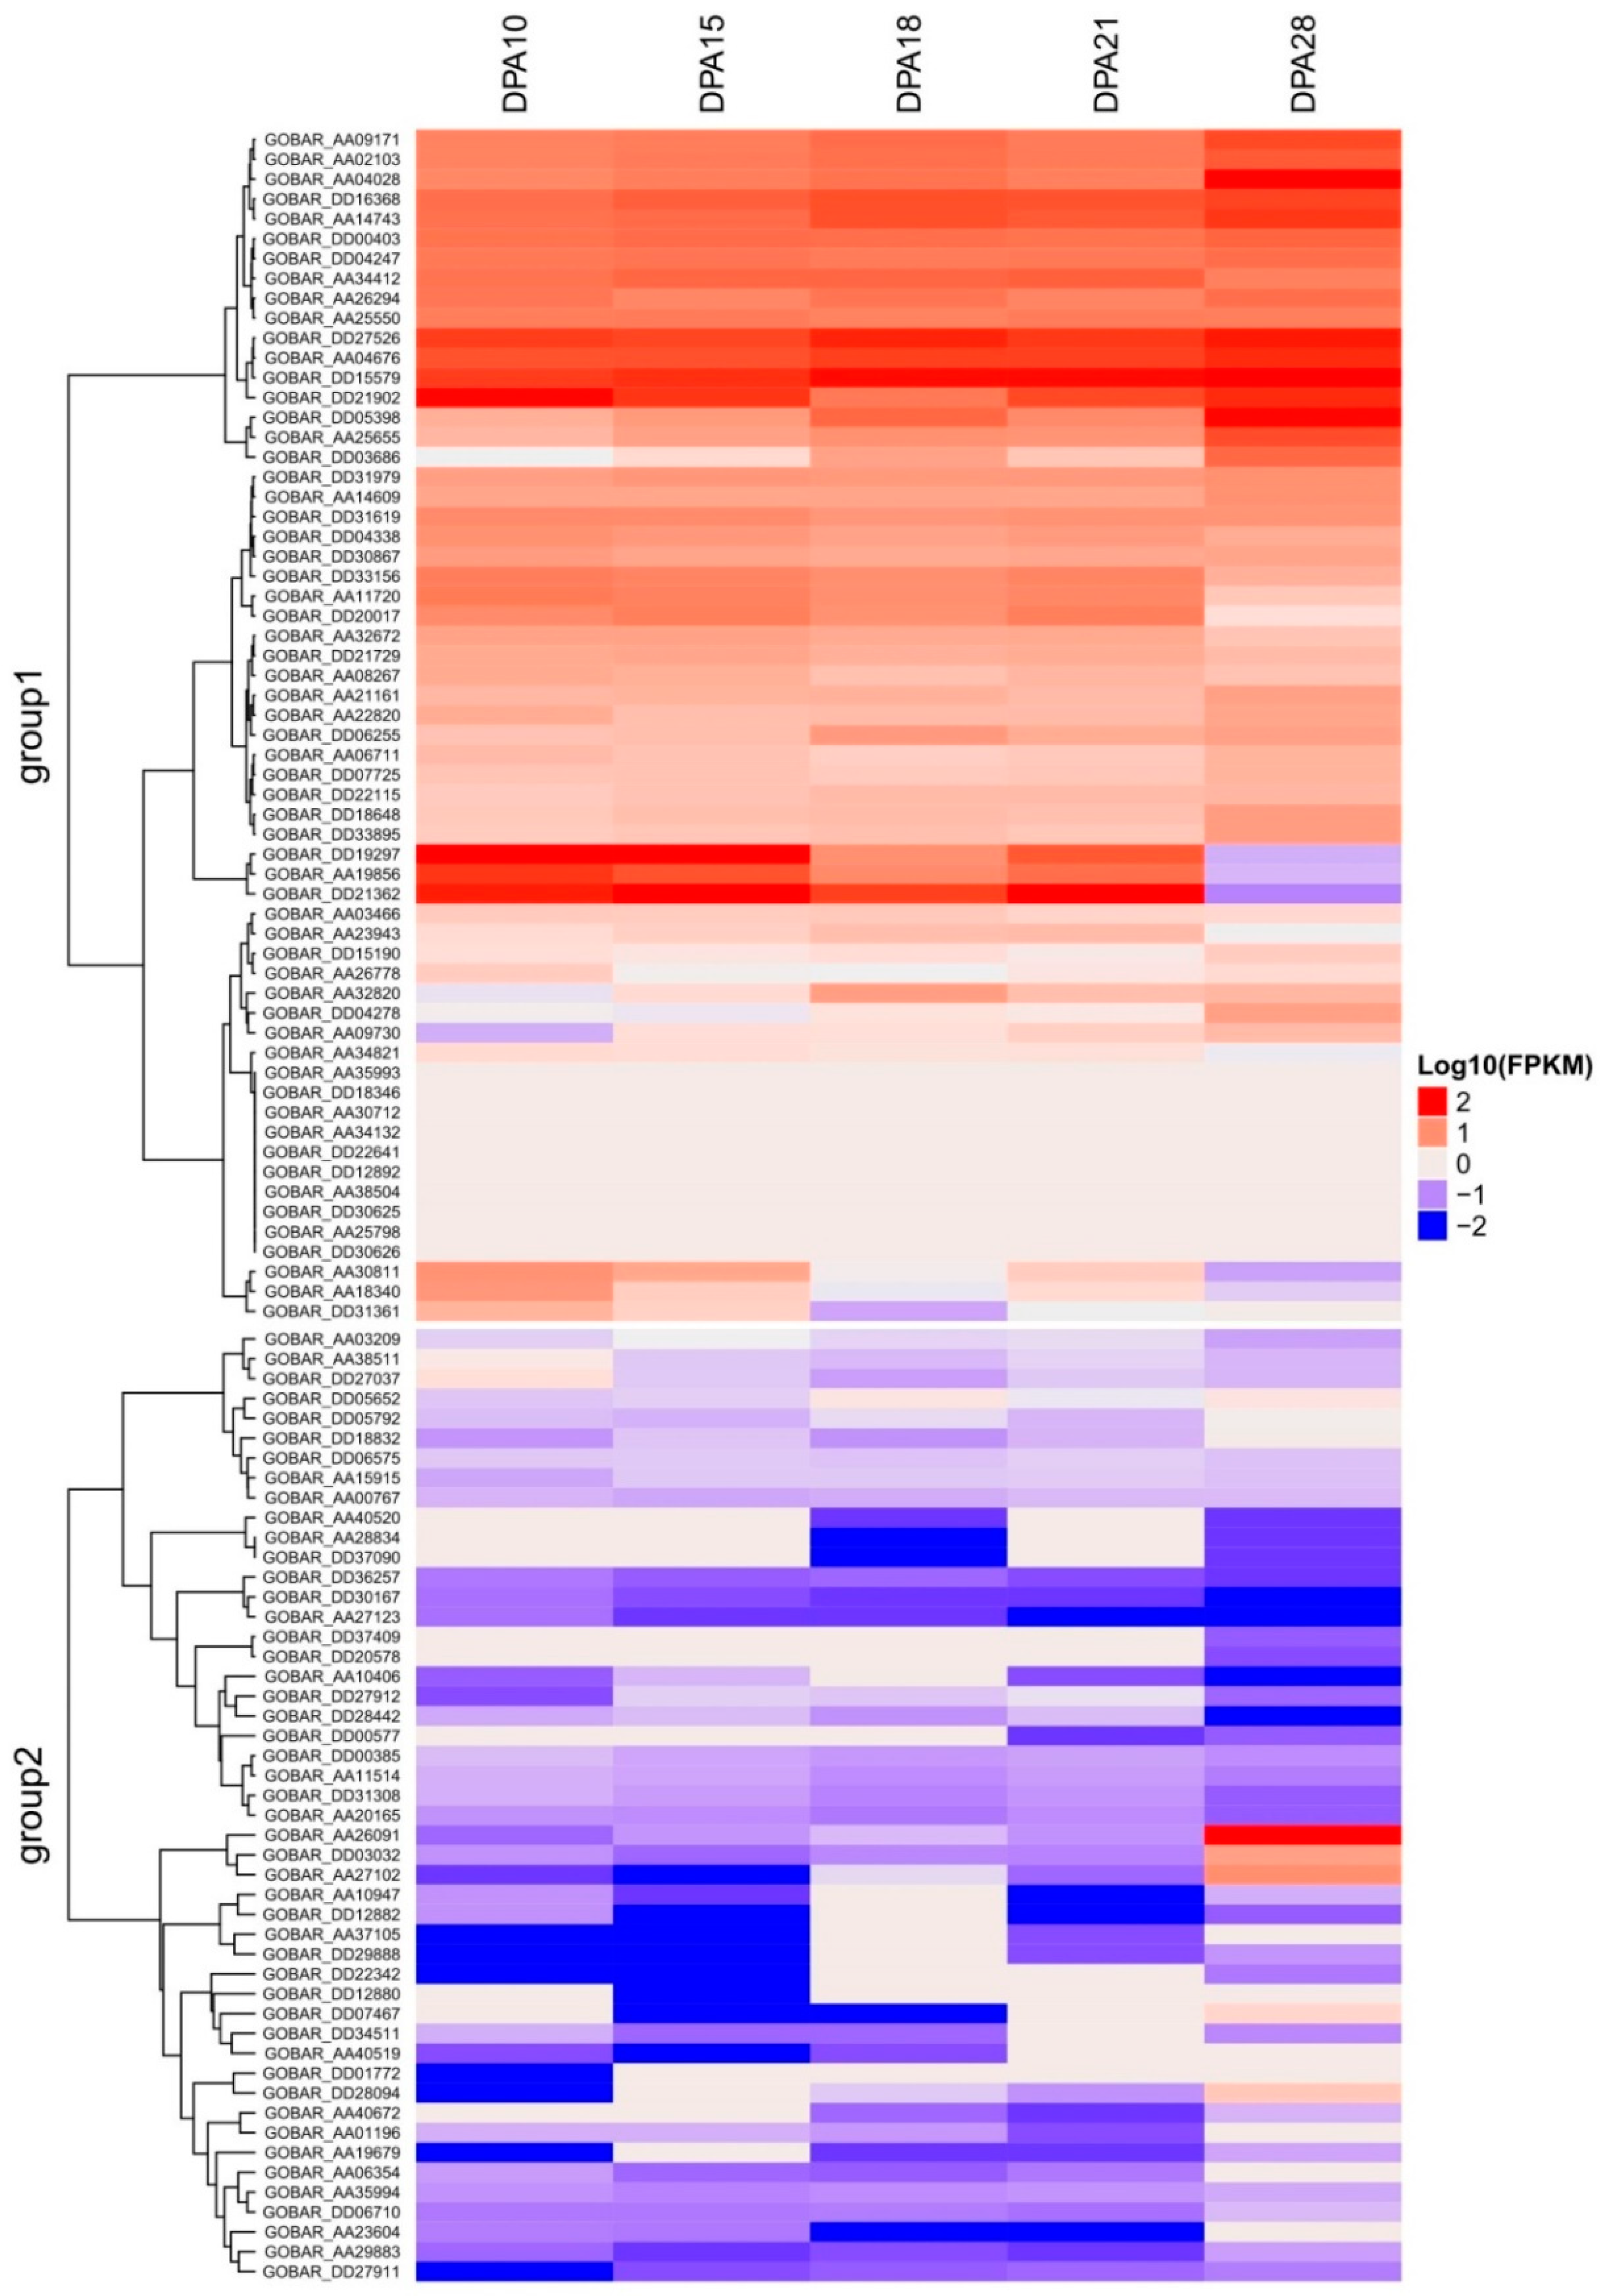
3.2. GO Functional Annotations and Expression Analysis

Gene ontology (GO) annotations of G. raimindii- and G. barbadense-based mined genes were carried out by using the cotton functional genomics database (http://cottonfgd/analyze/) to describe their biological process (BP), molecular functions (MF), and cellular components (CC) [28]. In five cellular components, functions related to ribosomes, intracellular, integral components of the membrane, the membrane, and the vesicle coat were identified. Similarly, 21 molecular functions and 19 biological processes were observed, while a maximum of 155 genes was involved in regulating the biological processes (Figure 1). Ultimately, we implemented RNA sequence expression data analysis to verify the genetic annotation functions through gene ontology. RNA sequences were downloaded from the cotton functional genome database (https://cottonfgd.org/). The genes revealed differential expression: 49 genes were found to be upregulated for fiber developmental stages at 10, 15, 18, 21, and 28 days post-anthesis (DPA) (Table S3). Thus, 108 genes out of 155 were involved in the upregulation of various tissues; a heatmap was constructed that only addresses fiber developmental stages on the basis of their respective expression levels (log10) (Figure 2; Table S4). The heatmap constructed for 108 genes identified on the basis of G. barbadense genome sequence and four genes, GOBAR_DD21902, GOBAR_DD15579, GOBAR_DD27526, and GOBAR_AA04676, showed highly significant expression 10, 15, 18, 21, and 28 days post-anthesis (DPA), while GOBAR_DD21362, GOBAR_DD19297, and GOBAR_AA19856 showed highly significant expression at all points except 28 DPA. There were also certain genes not directly related to fiber development and presented in Table S1 that were found to be significantly involved in biotic and abiotic stress responses under stress conditions, like NAC family, COL3, COL4, UBX2, CRKs, MED33A, MED33B, L1YMB, and ABC transporter family.
The genes were placed into two distinct groups in a heatmap on the basis of their RNA sequence expression data analysis. Group 1 had 60 genes that were significantly expressed, with expression levels between 1 and 2. Among the 60 up regulated genes, CER1 (Protein ECIFERUM1) has four GO functions: iron ion binding (GO: 0005506-MF11), fatty acid biosynthetic process (GO: 0006633-BP8), oxidoreductase activity (GO: 0016491-MF12), and the oxidation‒reduction process (G:0055114-BP9), while two other gene IDs, GOBAR_AA11720 (MLO10), GOBAR_DD33156 (MLO8) (MLO-Like protein 10 & 8), were found to have similar GO functions like defense response (GO: 0006952-BP10) and being an integral component of the membrane (GO: 0016021-CC3), respectively. Similarly, two the genes GOBAR_DD06255 and GOBAR_AA22820 are related to AFP2 (Ninja-family protein AFP2) with one GO function, signal transduction (GO: 0007165-BP6), and CYCU4-1 (Cyclin-U4-1) with two GO functions, regulation of cyclin-dependent protein serine/threonine kinase activity (GO: 0000079-BP16) and protein kinase binding (GO: 0019901-MF16). Two genes ID GOBAR_AA09171 and GOBAR_DD00403 were found to have the same functions as indicated by SPAC5D6.04 (Uncharacterized transporter C5D6.04) with two GO functions, integral component of membrane (GO: 0016021-CC3) and transmembrane transport (GO: 0055085-BP16), while three genes, ID GOBAR_DD19297, GOBAR_AA19856, and GOBAR_DD05398, also have the same GO functions as illustrated in FAD3 (Omega-3 fatty acid desaturase, endoplasmic reticulum) with three GO functions, lipid metabolic process (GO: 0006629-BP5), oxidoreductase activity, acting on paired donors, with oxidation of a pair of donors resulting in the reduction of molecular oxygen to two molecules of water (GO: 00167717-MF12), and the oxidation‒reduction process (GO: 0055114-BP9). The gene FAD7A-1 (Omega-3 fatty acid desaturase, chloroplast) has five GO functions: the lipid metabolic process (GO: 0006629-BP5), being an integral component of the membrane (GO: 0016021-CC3), vesicle-mediated transport (GO: 0016192-BP20), oxidoreductase activity acting on paired donors—with oxidation of a pair of donors resulting in the reduction of molecular oxygen to two molecules of water (GO: 0016717-MF12), and the oxidation‒reduction process (GO: 0055114-BP9). Interestingly, GOBAR-AA34412 and GOBAR_DD20017, whose gene names and descriptions are not available, have four similar GO functions: being a structural constituent of ribosome (GO: 0003735-MF20), intracellular (GO: 0005622-CC4), ribosome (GO: 0005840-CC5), and translation (GO: 0006412-BP18) were identified (Figure 1).
The second group consisted of 48 genes whose expression was downregulated in several stages of fiber development, except for the three genes GOBAR_AA26091 (FAD7A-1), GOBAR_DD03032 (CYCU4-1), and GOBAR_AA2712, which had three, two, and four GO functions, respectively. These genes showed significant expression with upregulation at 28 DPA. FAD7A-1 (omega 3 fatty acid desturase, chloroplastic) was associated with three GO functions, i.e., (GO:0006629-BP5), (GO: 0016717-MF12), and (GO: 0055114-BP9), while CYCU4-1 (Cyclin-U4-1) is involved in two GO functions, i.e., (GO:0000079-BP15) and (GO: 0019901-MF16). The third gene, GOBAR_AA27102, has no gene name but is associated with four GO functions: (GO: 0003735-MF20), (GO: 0005622-CC4), (GO: 0005840-CC5), and (GO: 0006412-BP18). The expression profile is as shown in Table S4 and Figure 2. Cotton is one of the major fiber crops; hence seed evolution is crucial for this extraordinary class of fiber. The RNA sequence data clearly showed that the genes quarried within the SSR marker sequences have a significant impact on both biotic stress and boosted fiber quality.

3.3. Analysis of Genetic Diversity

A total of 111 EST-SSRs and gSSR markers were polymorphic in both G. barbadense and G. darwinii. The number of bands noticed in each SSR marker was used to evaluate the level of gene diversity, polymorphic information content (PIC), and discrimination power (DP) in the germplasm collection being used in this study. An average of 2.85 alleles per marker was detected across all accessions, with a maximum of seven alleles perceived in the DPL0501 locus for both G. barbadense and G. darwinii accessions. Among all markers, a maximum value of PIC (0.995) was observed for marker DPL0064 and a minimum of 0.008 for DPL-0608, with an average of 0.520 for all cotton accessions. The discrimination power was found to range from 0.947 to 1.000, with an average of 0.981. Both PIC and DP values were found to be very high, indicating a high level of genetic diversity in the newly collected germplasm accessions. The maximum value of PIC (0.752) was observed for DPL0489 and a minimum value of PIC (0.000) for DPL0638 among the 49 markers characterized for functional gene mapping. The maximum value for DP (0.991) was found for marker DPL0309, while the minimum DP value (0.959) was found for the markers SWU18262‒SWU18289. The gene diversity value of the 49 markers ranged from 0.026 to 0.478, with an average of 0.317 (Tables S2 and S5).

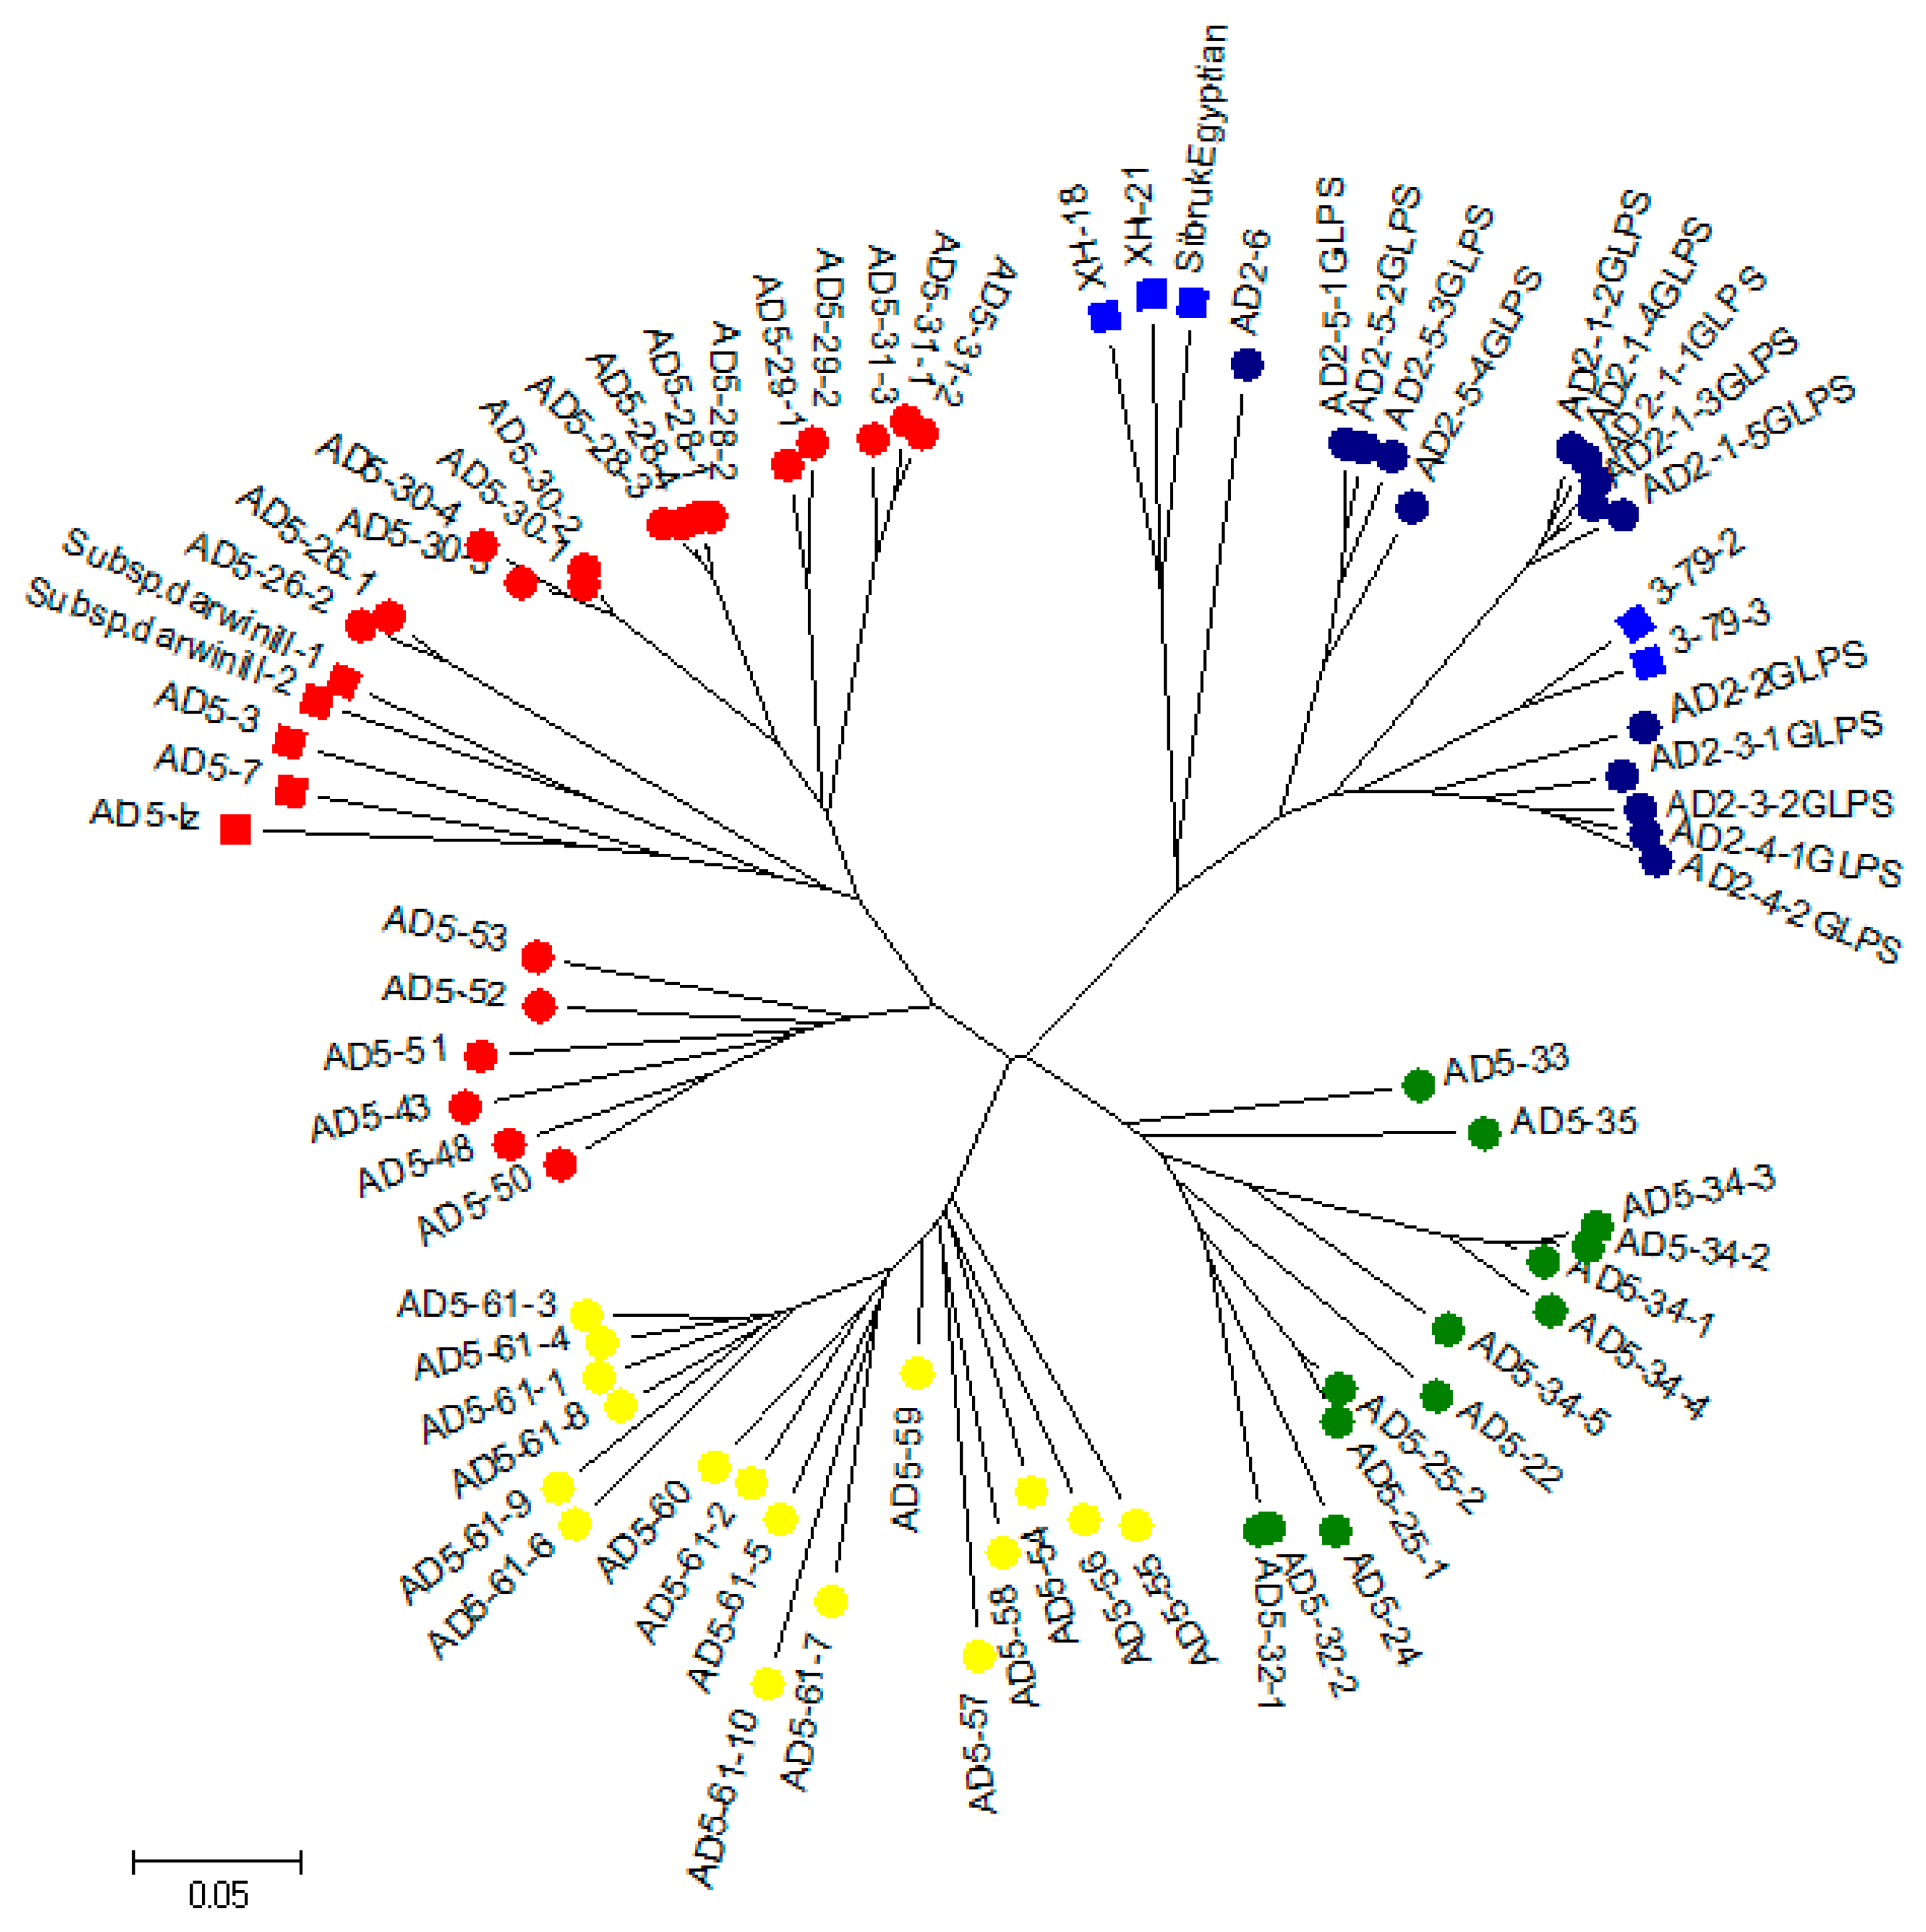
3.4. Phylogenetic Tree Analysis

To test the potential use of EST-gSSRs for assessing the genetic diversity among novel germplasm of G. barbadense and G. darwinii collected from the Galapagos Islands, the allelic data from 111 EST-gSSRs were used to construct a dendrogram (Figure 3 and Figure S1). Genetic distance, based on Nie’s method [34], was calculated by using power marker version 3.25 software (Bioinformatics Research Center, North Carolina State University, Raleigh, NC, USA). The wild accessions of Gossypium were grouped into five distinct clusters using the neighbor-joining (NJ) clustering pattern. The improved varieties of G. barbadense, i.e., 3-79-2 and 3-79-3, were found to lie between the AD2-1-1, AD2-1-2, AD2-1-3, AD2-1-4, AD2-1-5 and AD2-2, AD2-3-1, AD2-3-2, AD2-4-1, AD2-4-2 accessions of G. barbadense. Similarly, the three other improved cultivars, XH-18, XH-21, and Sibruk Egyptian, plus wild type AD2-6, make up Cluster I. AD2-6 was found to be closer to XH-18, XH-21, and Sibruk Egyptian. A total of 17 accessions of G. barbadense (two improved and 15 wild types) collected from Santa Cruz Island constitute Cluster II. Thirteen accessions of G. darwinii collected from Santa Cruz Island exist in Cluster III close to G. barbadense accessions of the same origin, indicating the significant natural introgression of alleles/genes among the two species of Gossypium [36]. Cluster IV was comprised of 17 G. darwinii accessions collected from San Cristobal Island. A total of 25 (five improved and 20 wild types) accessions of G. darwinii were grouped into Cluster V. AD5-26-1 and AD5-26-2 are closely related to improved cultivars AD5-3, AD5-7, Subsp. darwiniiII-1, and Subsp. darwiniiII-1, indicating the fixed alleles found among wild-type accessions of G. darwinii. The PIC value ranged from 0.037 to 0.825 (average: 0.489) for G. darwinii, which was higher than that of G. barbadense (0.091–0.774, average: 0.459).

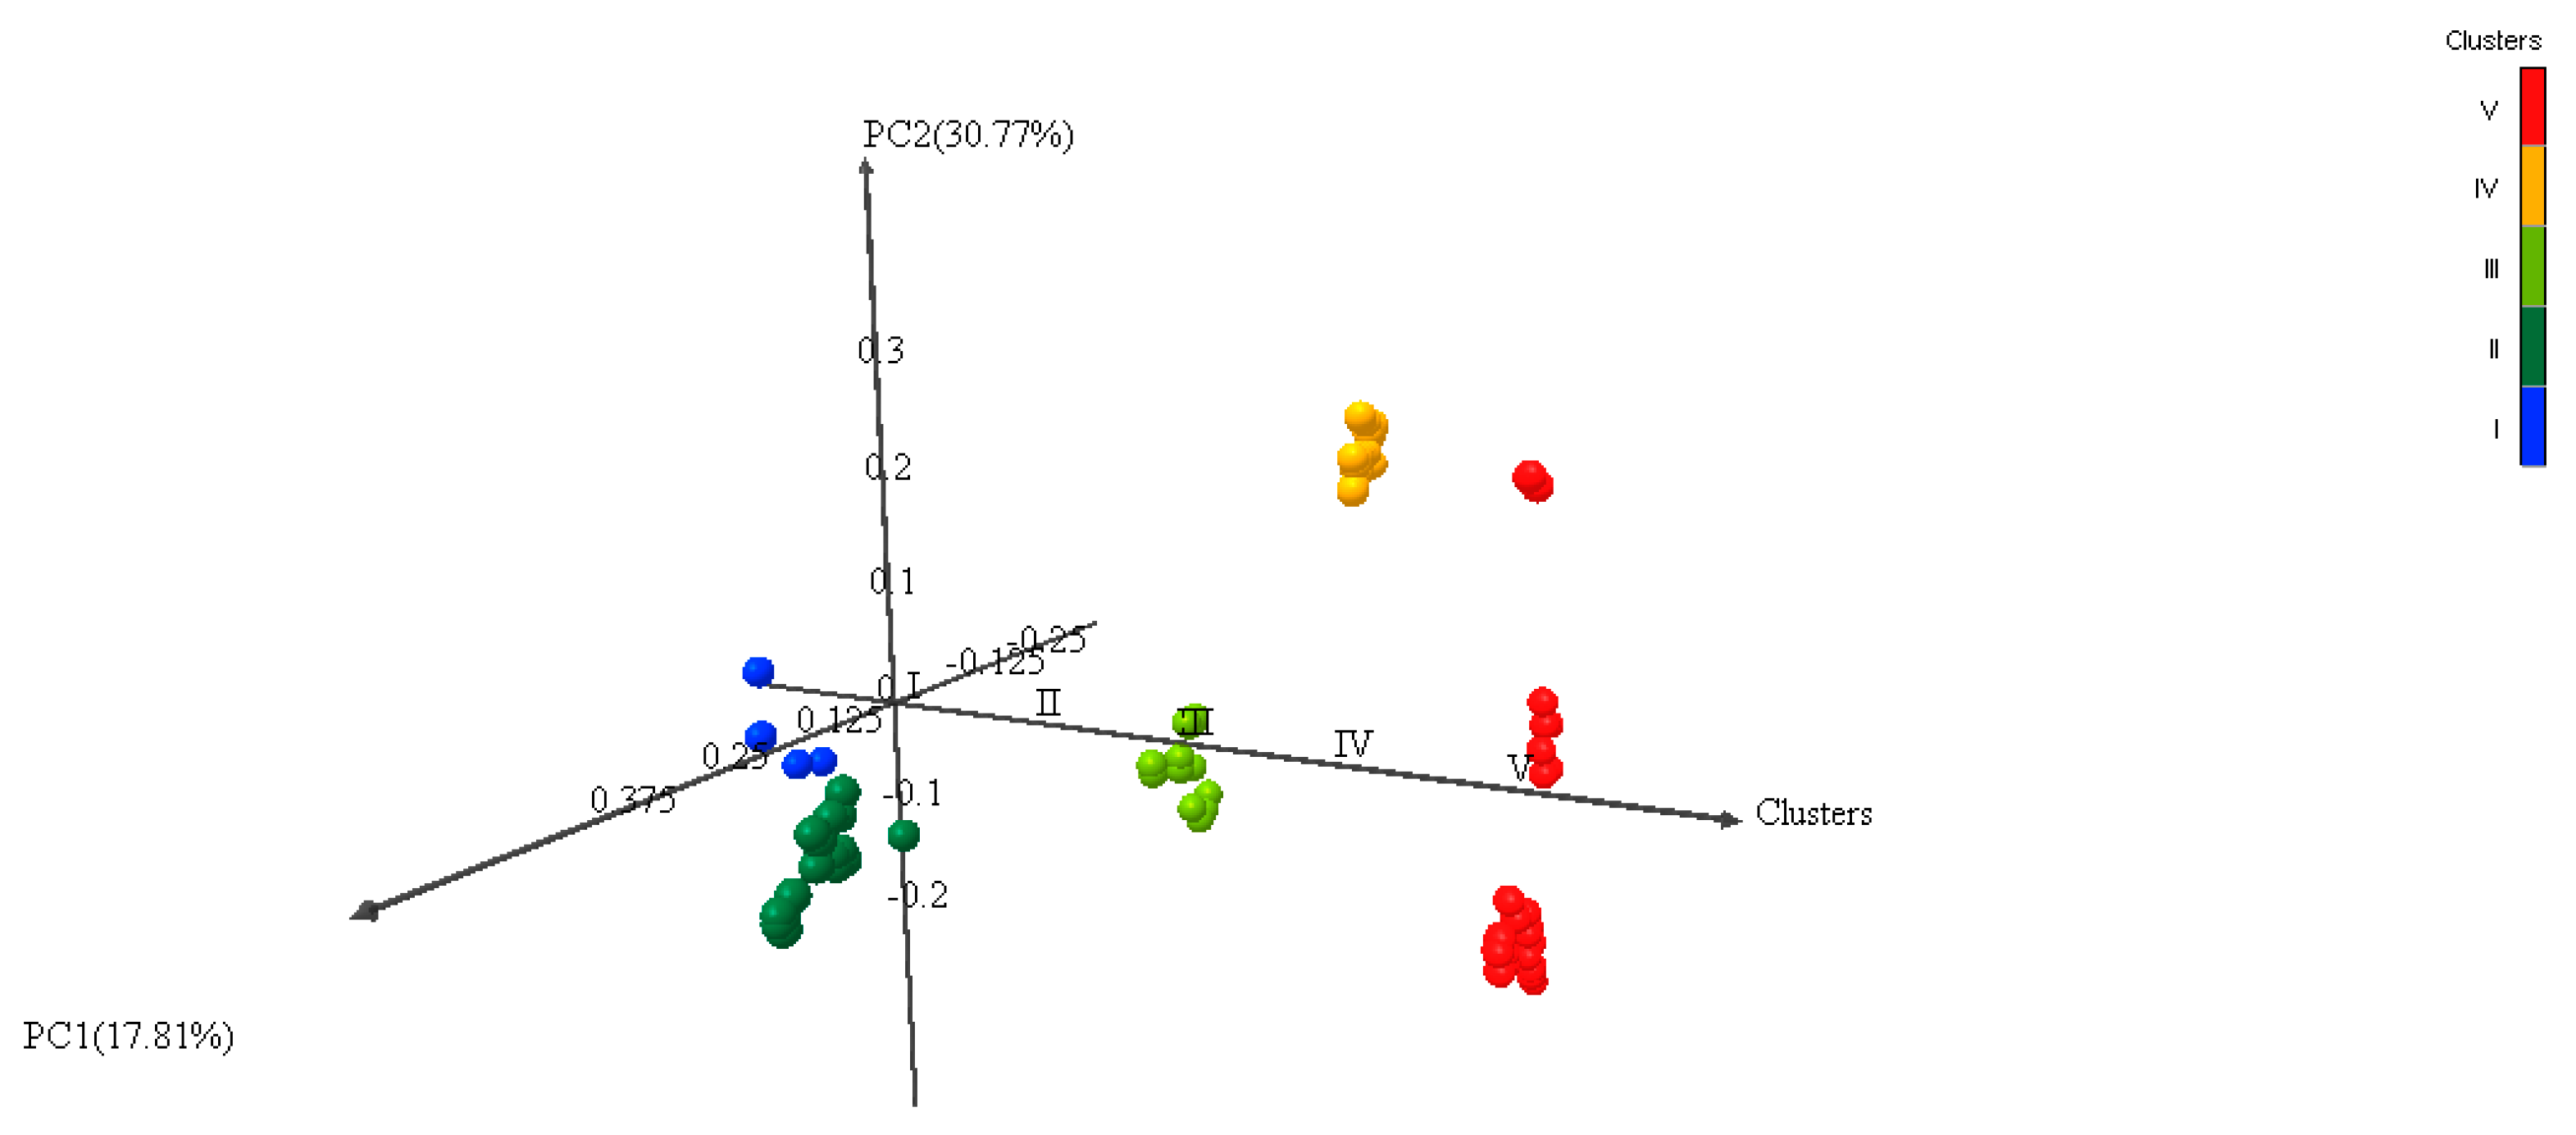
3.5. Multivariate Analysis of Genetic Diversity

The genetic diversity was evaluated by performing principal coordinate analysis (PCoA) on the 79 accessions using EST-SSRs and gSSR markers. The results indicated a diverse pattern of separation between G. barbadense and G. darwinii accessions (Figure 4).
The estimation of the G. barbadense and G. darwinii accessions revealed that the first principal coordinate (PC1) showed variation of 17.81% and separated the accessions into clusters indicating individual’s origin of collection, with some overlap (Figure 4). The second principal coordinate, PC2, indicated 30.77% variation among the different accessions of Gossypium. The cumulative variation was 48.58% along the two principal coordinates, showing high genetic diversity among the newly collected cotton accessions. We observed broad clusters (much broader in G. darwinii) in both species of Gossypium, which reflects the high diversity among these accessions. The analysis of molecular variance (AMOVA) after 999 permutations was done to validate the significance of the differences between G. darwinii and G. barbadense populations. The AMOVA results estimated 38% variation, which is due to five population groups among accessions and 62% genetic variation within the populations of both species (Table 2). Current analysis indicated a significant difference within population groups and between individuals (p = 0.001).

4. Discussion

Cotton fiber production in the form of lint and its quality has been deteriorating because of biotic and abiotic stress, which is exacerbated by the narrow genetic base of best tetraploid cotton [36]. To improve the genetic diversity, the key agronomic traits of wild accessions can be efficiently introgressed into the commercial varieties [26,37]. Therefore, based on the estimated polymorphic EST-SSRs and gSSR markers in this study, a total of 155 genes were quarried with the use of G. barbadense as a reference genome by using the full sequences of these polymorphic DNA markers. The significance of these mined genes has been illustrated because of their involvement in fiber development as well as biotic and abiotic stress tolerance. Relative to stress factors, different genes linked to drought were found, including NAC 100 (NAC domain-containing protein 100), and others including COL3, COL4 (zinc finger protein), At3g19950 (E3 ubiquitin protein ligase), and UBX2 (plant UBX domain containing protein) [38]. Interestingly, At3g19950 was found to be associated with GOBAR_AA37282 and GOBAR_AA29781. The plant-specific NAC family was found to be involved in regulating several important biological phenomena in wheat. NAC TFs are considered to play a significant role in processes like senescence, nutrient remobilization [36,39], and reactions to biotic (stripe rust) [40,41] and abiotic stress (drought and salt) [42].
Ten members of the genes CYCU4-1 and CYCP3-1, related to serine/threonine-protein kinases proteins, play a significant role in plant cell growth, development, and oncogenesis [43]. Plants’ survival despite increasing environmental degradation is linked to vital proteins like E3-ubiquitin-protein ligase, i.e., RING1-like (a really interesting gene) was found to be involved in fiber development [44], while ORTRUS 2 and ubiquitin thiosterase OTU 1, belonging to At3g19950, ORTH 2, and yod1 genes, also have the same functions. These proteins regulate cell trafficking, DNA repair, early flowering, and prevention cell degradation through hydrolysis and signaling, and together have profound significance in cell biology [45].
We identified different members of these genes, i.e., MLO 8, 10 (MLO-like protein), At2g377000 (protein CER1), CER 1 (protein ECIFERUM), PAT 1(protein PAT1 homolog), AFP2, AFP3, AFP-B1 (Ninja family protein), GH3.5 (indole 3 acetic acid amido synthase), CYCU4-1, CYCP3-1 (cyclin U-4-1), FAD3, FAD7A-1 (Omega-3 fatty acid desaturase), MED33A, MED33B (mediator RNA II polymerase transcription), and L1MYB (L10 interacting MYB domain-containing protein); which have significant role in fiber development at different stages through its quality improvement in cotton along with enhancing plant defense against pathogen [46].
Among the four identified genes, the GOBAR_DD27526 has a single domain (PF02338) and is highly conserved, which can be useful in an evolutionary study of cotton. The other three genes are uncharacterized, while the homology of two genes, i.e., GOBAR_DD15579 and GOBAR_AA04676, was found to be similar in Arabidopsis thaliana (L.) Heynh., At4g09830.1. This homologue is the nuclear receptor protein family 2 group C proteins expressed during various plant growth developmental phases (http://cottonfgd.org/analyze).
The results of RNA sequence expression indicated that 60 genes are involved in upregulation at different fiber developmental stages, as shown in the heatmap, e.g., AFP2, AFP3, and AFP-B1 (Ninja family protein), which are linked to fiber development in plants through antagonistic interactions by regulating plant growth under stress conditions [47]. The FDR2 member of the ABC transporter family (pleiotropic drug resistant protein 2) is understood to play a role in the signaling and plant defense mechanism [48]. The ABC superfamily includes membrane-bound transporters as well as soluble proteins that have roles in different processes, many of which have significant potential in the agriculture, biotechnology, and medical fields. ABCG38 and ABCG39 (ABC transporter G family member 38, 39) bind with ATP hydrolysis to transport a variety of substances including lipids, heavy metal ions, inorganic acids, glutathione conjugates, sugars, amino acids, peptides, secondary metabolites, and xenomolecules across several membranes [49]. PUX2 (Plant UBX domain-containing protein 2) controls plant growth by monitoring the oligomeric structure and function, as studied in Arabidopsis [50]. The cysteine-rich protein kinases (CRKs), also known as DUF26 RLKs, are one subfamily of RLKs. CRKs have a typical RLK domain structure, i.e., they contain an extracellular domain responsible for signal perception, a trans-membrane domain, and a conserved intracellular protein kinase domain responsible for signal transduction [51]. CRKs are involved in early flowering and leaf senses under environmental stress. CRK3 reduces the cell density, ultimately increasing the cell expansion [52]. Similar results were found in our study, indicating the crucial role of CRK3 in cell expansion (e.g., fiber development) and the best match with the full sequence of MUCS0064 in G. barbadense.
The identification of these genes from the polymorphic EST-SSR and gSSRs offers plant breeders subsequent use of the recognized genes to improve the highly evolved tetraploid cotton. As shown in the cotton QTL database (http://www2.cottonqtldb.org:8081/), the cotton genome D has been linked with numerous stable QTLs of morphological, physiological, and biochemical traits associated with fiber qualities. Furthermore, it has been determined to play an important role during biotic and abiotic stress conditions compared to the A genome [53].
The highest diversity within the G. darwinii and G. barbadense accessions involved in this study is generally in accordance with the Wendell and Percy investigations, with few differences [19]. Moreover, the grouping of accessions into distinct clusters was linked to island of origin by employing the neighbor-joining (NJ) method, as Nie et al. described in 1983. The accessions were distinguished into five distinct clusters based on Nie’s genetic distance pattern. The same results have been indicated in various studies of genetic diversity among Gossypium accessions [54]. Alleles were identified in a range from one to seven; there were on average 2.85 alleles per locus. The results of polymorphism information content (PIC) showed values from 0.008 to 0.995, with an average of 0.520. The PIC value ranged from 0.037 to 0.825, with an average of 0.489 for G. darwinii; this was higher than for G. barbadense accessions (0.091–0.774, average: 0.459), even though downstreaming the G. darwinii samples equal to G. barbadense was in contrast to earlier reports of Wendell and Percy, in which they suggested that G. barbadense has high genetic diversity compared to G. darwinii. The discrimination power was found to be high in the majority of the EST-SSRs and gSSRs, with an average of 0.98. The discrimination power is an extension of the polymorphism information content (PIC), which actually describes the efficiency of a given marker to discriminate between genotypes, i.e., the probability that two randomly selected individuals have different arrays [30]. Thus, high PIC coupled with DP values exhibited that these markers have the potential to disclose allelic variation and each of these markers had greater affinity towards discriminating between two accessions [55]. The principal coordinate analysis (PCoA) supported the neighbor-joining (NJ) clustering of accessions. The cumulative variation was found to be 48.58% along the two principal coordinates, showing high genetic diversity among the newly collected cotton accessions. The AMOVA results estimated 38% variation among population of accessions and 62% genetic variation within the populations of both species. A similar previous study indicated 14% variation among populations and 52% variation between individuals of G. arboreum [56].

5. Conclusions

The EST-SSRs and gSSR markers used in this study have great potential to be used for mapping functional genes studies in cotton segregating populations. Moreover, the genes mined in G. barbadense will set a precedent for solving the dilemma of cotton breeding for fiber quality improvement. The high Polymorphism Information Content (PIC), combined with Discriminant Power (DP), can assist with QTL identification and marker-assisted selection because linking the markers with functional regions of genome has become a comprehensive studying tool that will open up new avenues for cotton breeders to use in future cotton breeding programs.

Supplementary Materials

The following are available online at https://www.mdpi.com/2073-4395/8/9/181/s1, Figure S1: Dendrogram based on neighbor-joining (NJ) method, Table S1: The characteristics of mined genes from SSR marker regions, Table S2: GO functional annotations of EST-SSRs and gSSRs, Table S3: Summary of 49 genes with differential expression during fiber development, Table S4: RNA seq expression data of 108 genes with differential expression of both up and down regulation and Table S5: Markers with physical positions and PIC value.

Author Contributions

K.W., A.D., and F.L. planned the experiments. A.D. and Z.Z. conducted the experiments and analyzed the results. A.D. and Z.Z. performed the majority of the experiments and contributed equally. A.D. applied all computational analyses. F.L., X.C., X.W., K.W.O., M.S., Y.X., Y.H., M.K.R.K., and M.S.I. participated in mapping experiments. A.D. created the draft of the manuscript and K.W. reviewed and studied the manuscript. Ultimately, all authors read and agreed to submit the final manuscript.

Funding

This research program was financially sponsored by the National Key Research and Development Plan (2016YFD0100306, 2016YFD0100203) and the National Natural Science Foundation of China (31530053, 31671745).

Acknowledgments

We are grateful to all the team- and lab mates and friends who helped us during the research project. We express our deepest gratitude to Kunbo Wang and Fang Liu (Institute of Cotton Research) for their visionary approach that helped us to finish this research work.

Conflicts of Interest

The authors declare that they have no competing interests.

Abbreviations

PICpolymorphism information content
GDgenetic distance
Poppopulation
AMOVAanalysis of molecular variance
PCoAprincipal coordinate analysis
PCRpolymerase chain reaction
DNAdeoxyribonucleic acid
ESTexpressed sequence tags
gSSRgenomic SSR
SSRsimple sequence repeats
DPdiscrimination power
GGossypium
NAUNanjing Agriculture University

References

  1. Chen, Z.J.; Scheffler, B.E.; Dennis, E.; Triplett, B.A.; Zhang, T.; Guo, W.; Chen, X.; Stelly, D.M.; Rabinowicz, P.D.; Town, C.D.; et al. Toward sequencing cotton (Gossypium) genomes. Plant Physiol. 2007, 145, 1303–1310. [Google Scholar] [CrossRef] [PubMed]
  2. Wendel, J.F.; Grover, C.E. Taxonomy and evolution of the cotton genus, Gossypium. Cotton 2015, 57, 25–44. [Google Scholar]
  3. Zhang, J.; Lu, Y.; Yu, S. Cleaved aflp (caflp), a modified amplified fragment length polymorphism analysis for cotton. Theor. Appl. Genet. 2005, 111, 1385–1395. [Google Scholar] [CrossRef] [PubMed]
  4. Hammer, K. Resolving the Challenge Posed by Agrobiodiversity and Plant Genetic Resouces—An Attempt; Kassel University Press: Kassel, Germany, 2004; 184p. [Google Scholar]
  5. Borlaug, N.E. Sixty-two years of fighting hunger: Personal recollections. Euphytica 2007, 157, 287–297. [Google Scholar] [CrossRef]
  6. Gerald, N.D.L.F.; Ursula, K.-F.; Thomas, L. Accelerating plant breeding. Cell 2013, 18, 667–672. [Google Scholar] [Green Version]
  7. Kadirvel, P.; Senthilvel, S.; Geethanjali, S.; Sujatha, M.; Varaprasad, K. Genetic markers, trait mapping and marker-assisted selection in plant breeding. In Plant Biology and Biotechnology; Springer India: New Delhi, India, 2015; pp. 65–88. [Google Scholar]
  8. Wang, Q.; Fang, L.; Chen, J.; Hu, Y.; Si, Z.; Wang, S.; Chang, L.; Guo, W.; Zhang, T. Genome-wide mining, characterization, and development of microsatellite markers in Gossypium species. Sci. Rep. 2015, 5. [Google Scholar] [CrossRef] [PubMed]
  9. Cato, S.; Gardner, R.; Kent, J.; Richardson, T. A rapid pcr-based method for genetically mapping ests. Theor. Appl. Genet. 2001, 102, 296–306. [Google Scholar] [CrossRef]
  10. Liang, F.; Holt, I.; Pertea, G.; Karamycheva, S.; Salzberg, S.L.; Quackenbush, J. An optimized protocol for analysis of est sequences. Nucleic Acids Res. 2000, 28, 3657–3665. [Google Scholar] [CrossRef] [PubMed]
  11. John, Z.Y.; Fang, D.D.; Kohel, R.J.; Ulloa, M.; Hinze, L.L.; Percy, R.G.; Zhang, J.; Chee, P.; Scheffler, B.E.; Jones, D.C. Development of a core set of ssr markers for the characterization of Gossypium germplasm. Euphytica 2012, 187, 203–213. [Google Scholar]
  12. Jia, H.; Yang, H.; Sun, P.; Li, J.; Zhang, J.; Guo, Y.; Han, X.; Zhang, G.; Lu, M.; Hu, J. De novo transcriptome assembly, development of est-ssr markers and population genetic analyses for the desert biomass willow, salix psammophila. Sci. Rep. 2016, 6. [Google Scholar] [CrossRef] [PubMed]
  13. Yu, J.-K.; Dake, T.M.; Singh, S.; Benscher, D.; Li, W.; Gill, B.; Sorrells, M.E. Development and mapping of est-derived simple sequence repeat markers for hexaploid wheat. Genome 2004, 47, 805–818. [Google Scholar] [CrossRef] [PubMed]
  14. Thiel, T.; Michalek, W.; Varshney, R.; Graner, A. Exploiting est databases for the development and characterization of gene-derived ssr-markers in barley (Hordeum vulgare L.). Theor. Appl. Genet. 2003, 106, 411–422. [Google Scholar] [CrossRef] [PubMed]
  15. Da Silva, J.A. Preliminary analysis of microsatellite markers derived from sugarcane expressed sequence tags (ests). Genet. Mol. Biol. 2001, 24, 155–159. [Google Scholar] [CrossRef]
  16. Feng, S.P.; Li, W.G.; Huang, H.S.; Wang, J.Y.; Wu, Y.T. Development, characterization and cross-species/genera transferability of est-ssr markers for rubber tree (Hevea brasiliensis). Mol. Breed. 2008, 23, 85–97. [Google Scholar] [CrossRef]
  17. Zhu, T.; Liang, C.; Meng, Z.; Sun, G.; Meng, Z.; Guo, S.; Zhang, R. Cottonfgd: An integrated functional genomics database for cotton. BMC Plant Biol. 2017, 17. [Google Scholar] [CrossRef] [PubMed]
  18. Wang, B.; Guo, X.; Zhao, P.; Ruan, M.; Yu, X.; Zou, L.; Yang, Y.; Li, X.; Deng, D.; Xiao, J. Molecular diversity analysis, drought related marker-traits association mapping and discovery of excellent alleles for 100-day old plants by est-ssrs in cassava germplasms (Manihot esculenta Cranz). PLoS ONE 2017, 12, e0177456. [Google Scholar] [CrossRef] [PubMed]
  19. Percy, R.; Wendel, J.F. Allozyme evidence for the origin and diversification of Gossypium barbadense L. Theor. Appl. Genet. 1990, 79, 529–542. [Google Scholar] [CrossRef] [PubMed]
  20. Zhang, J.; Stewart, J. Economical and rapid method for extracting cotton genomic DNA. J. Cotton Sci. 2000, 4, 193–201. [Google Scholar]
  21. Yu, J.; Jung, S.; Cheng, C.-H.; Ficklin, S.P.; Lee, T.; Zheng, P.; Jones, D.; Percy, R.G.; Main, D. Cottongen: A genomics, genetics and breeding database for cotton research. Nucleic Acids Res. 2013, 42, D1229–D1236. [Google Scholar] [CrossRef] [PubMed]
  22. Okubazghi, K.W.; Li, X.-N.; Cai, X.-Y.; Wang, X.-X.; Chen, H.-D.; Zhou, Z.-L.; Wang, C.-Y.; Wang, Y.-H.; Fang, L.; Wang, K.-B. Genome-wide assessment of genetic diversity and fiber quality traits characterization in Gossypium hirsutum races. J. Integr. Agric. 2017, 16, 2402–2412. [Google Scholar] [CrossRef]
  23. Gallagher, J.P.; Grover, C.E.; Rex, K.; Moran, M.; Wendel, J.F. A new species of cotton from wake atoll, Gossypium stephensii (Malvaceae). Syst. Bot. 2017, 42, 115–123. [Google Scholar] [CrossRef]
  24. Zhang, J.; Guo, W.; Zhang, T. Molecular linkage map of allotetraploid cotton (Gossypium hirsutum L.× Gossypium barbadense L.) with a haploid population. Theor. Appl. Genet. 2002, 105, 1166–1174. [Google Scholar] [PubMed]
  25. Wang, K.; Wang, Z.; Li, F.; Ye, W.; Wang, J.; Song, G.; Yue, Z.; Cong, L.; Shang, H.; Zhu, S. The draft genome of a diploid cotton Gossypium raimondii. Nat. Genet. 2012, 44. [Google Scholar] [CrossRef] [PubMed]
  26. Marconi, T.G.; Costa, E.A.; Miranda, H.R.; Mancini, M.C.; Cardoso-Silva, C.B.; Oliveira, K.M.; Pinto, L.R.; Mollinari, M.; Garcia, A.A.; Souza, A.P. Functional markers for gene mapping and genetic diversity studies in sugarcane. BMC Res. Notes 2011, 4. [Google Scholar] [CrossRef] [PubMed] [Green Version]
  27. Ditta, A.; Zhou, Z.; Cai, X.; Wang, X.; Okubazghi, K.W.; Shehzad, M.; Xu, Y.; Hou, Y.; Sajid Iqbal, M.; Khan, M.K.R.; et al. Assessment of genetic diversity, population structure, and evolutionary relationship of uncharacterized genes in a novel germplasm collection of diploid and allotetraploid Gossypium accessions using est and genomic ssr markers. Int. J. Mol. Sci. 2018, 19, 2401. [Google Scholar] [CrossRef] [PubMed]
  28. Priyam, A.; Woodcroft, B.J.; Rai, V.; Munagala, A.; Moghul, I.; Ter, F.; Gibbins, M.A.; Moon, H.; Leonard, G.; Rumpf, W. Sequenceserver: A modern graphical user interface for custom blast databases. Biorxiv 2015. [Google Scholar] [CrossRef]
  29. Kuhnert, P.; Venables, B.; Zocchi, S.S. An Introduction to R: Software for Statistical Modelling & Computing; CSIRO Mathematical and Information Sciences: Cleveland, Australia, 2005. [Google Scholar]
  30. Anderson, J.A.; Churchill, G.; Autrique, J.; Tanksley, S.; Sorrells, M. Optimizing parental selection for genetic linkage maps. Genome 1993, 36, 181–186. [Google Scholar] [CrossRef] [PubMed]
  31. Tessier, C.; David, J.; This, P.; Boursiquot, J.-M.; Charrier, A. Optimization of the choice of molecular markers for varietal identification in vitis vinifera l. Theor. Appl. Genet. 1999, 98, 171–177. [Google Scholar] [CrossRef]
  32. Nei, M.; Tajima, F.; Tateno, Y. Accuracy of estimated phylogenetic trees from molecular data. J. Mol. Evol. 1983, 19, 153–170. [Google Scholar] [CrossRef] [PubMed]
  33. Liu, K.; Muse, S.V. Powermarker: An integrated analysis environment for genetic marker analysis. Bioinformatics 2005, 21, 2128–2129. [Google Scholar] [CrossRef] [PubMed]
  34. Oliveira, K.M.; Pinto, L.R.; Marconi, T.G.; Margarido, G.R.; Pastina, M.M.; Teixeira, L.H.M.; Figueira, A.V.; Ulian, E.C.; Garcia, A.A.F.; Souza, A.P. Functional integrated genetic linkage map based on est-markers for a sugarcane (Saccharum spp.) commercial cross. Mol. Breed. 2007, 20, 189–208. [Google Scholar] [CrossRef]
  35. Schloss, S.; Mitchell, S.; White, G.; Kukatla, R.; Bowers, J.; Paterson, A.; Kresovich, S. Characterization of rflp probe sequences for gene discovery and ssr development in sorghum bicolor (L.) moench. Theor. Appl. Genet. 2002, 105, 912–920. [Google Scholar] [PubMed]
  36. Hinze, L.L.; Gazave, E.; Gore, M.A.; Fang, D.D.; Scheffler, B.E.; Yu, J.Z.; Jones, D.C.; Frelichowski, J.; Percy, R.G. Genetic diversity of the two commercial tetraploid cotton species in the Gossypium diversity reference set. J. Hered. 2016, 107, 274–286. [Google Scholar] [CrossRef] [PubMed]
  37. Juturu, V.N.; Mekala, G.K.; Kirti, P. Current status of tissue culture and genetic transformation research in cotton (Gossypium spp.). Plant Cell Tissue Organ Cult. (PCTOC) 2015, 120, 813–839. [Google Scholar] [CrossRef]
  38. Klug, A. The discovery of zinc fingers and their applications in gene regulation and genome manipulation. Ann. Rev. Biochem. 2010, 79, 213–231. [Google Scholar] [CrossRef] [PubMed]
  39. Hulse-Kemp, A.M.; Ashrafi, H.; Zheng, X.; Wang, F.; Hoegenauer, K.A.; Maeda, A.B.; Yang, S.S.; Stoffel, K.; Matvienko, M.; Clemons, K. Development and bin mapping of gene-associated interspecific snps for cotton (Gossypium hirsutum L.) introgression breeding efforts. BMC Genom. 2014, 15. [Google Scholar] [CrossRef] [PubMed]
  40. Zhao, D.; Derkx, A.; Liu, D.C.; Buchner, P.; Hawkesford, M. Overexpression of a nac transcription factor delays leaf senescence and increases grain nitrogen concentration in wheat. Plant Biol. 2015, 17, 904–913. [Google Scholar] [CrossRef] [PubMed]
  41. Wang, F.; Lin, R.; Feng, J.; Chen, W.; Qiu, D.; Xu, S. Tanac1 acts as a negative regulator of stripe rust resistance in wheat, enhances susceptibility to pseudomonas syringae, and promotes lateral root development in transgenic arabidopsis thaliana. Front. Plant Sci. 2015, 6. [Google Scholar] [CrossRef] [PubMed]
  42. Huang, Q.; Wang, Y.; Li, B.; Chang, J.; Chen, M.; Li, K.; Yang, G.; He, G. Tanac29, a nac transcription factor from wheat, enhances salt and drought tolerance in transgenic arabidopsis. BMC Plant Biol. 2015, 15. [Google Scholar] [CrossRef] [PubMed]
  43. Acosta, J.T.; de Almeida Engler, J.; Raes, J.; Magyar, Z.; De Groodt, R.; Inzé, D.; De Veylder, L. Molecular characterization of arabidopsis pho80-like proteins, a novel class of cdka; 1-interacting cyclins. Cell. Mol. Life Sci. 2004, 61, 1485–1497. [Google Scholar]
  44. Rudrabhatla, P.; Reddy, M.M.; Rajasekharan, R. Genome-wide analysis and experimentation of plant serine/threonine/tyrosine-specific protein kinases. Plant Mol. Biol. 2006, 60, 293–319. [Google Scholar] [CrossRef] [PubMed]
  45. Teixeira, L.K.; Reed, S.I. Ubiquitin ligases and cell cycle control. Ann. Rev. Biochem. 2013, 82, 387–414. [Google Scholar] [CrossRef] [PubMed]
  46. Ablazov, A.; Tombuloglu, H. Genome-wide identification of the mildew resistance locus o (mlo) gene family in novel cereal model species brachypodium distachyon. Eur. J. Plant Pathol. 2016, 145, 239–253. [Google Scholar] [CrossRef]
  47. Zorzatto, C.; Machado, J.P.B.; Lopes, K.V.; Nascimento, K.J.; Pereira, W.A.; Brustolini, O.J.; Reis, P.A.; Calil, I.P.; Deguchi, M.; Sachetto-Martins, G. Nik1-mediated translation suppression functions as a plant antiviral immunity mechanism. Nature 2015, 520. [Google Scholar] [CrossRef] [PubMed]
  48. Garcia, M.E.; Lynch, T.; Peeters, J.; Snowden, C.; Finkelstein, R. A small plant-specific protein family of abi five binding proteins (afps) regulates stress response in germinating arabidopsis seeds and seedlings. Plant Mol. Biol. 2008, 67, 643–658. [Google Scholar] [CrossRef] [PubMed]
  49. Verrier, P.J.; Bird, D.; Burla, B.; Dassa, E.; Forestier, C.; Geisler, M.; Klein, M.; Kolukisaoglu, U.; Lee, Y.; Martinoia, E. Plant abc proteins—A unified nomenclature and updated inventory. Trends Plant Sci. 2008, 13, 151–159. [Google Scholar] [CrossRef] [PubMed] [Green Version]
  50. Rancour, D.M.; Park, S.; Knight, S.D.; Bednarek, S.Y. Plant ubx-domain containing protein 1, pux1, regulates the oligomeric structure and activity of arabidopsis cdc48. J. Biol. Chem. 2004, 279, 54264–54274. [Google Scholar] [CrossRef] [PubMed]
  51. Shiu, S.-H.; Karlowski, W.M.; Pan, R.; Tzeng, Y.-H.; Mayer, K.F.; Li, W.-H. Comparative analysis of the receptor-like kinase family in arabidopsis and rice. Plant Cell 2004, 16, 1220–1234. [Google Scholar] [CrossRef] [PubMed]
  52. Serna, L. The role of brassinosteroids and abscisic acid in stomatal development. Plant Sci. 2014, 225, 95–101. [Google Scholar] [CrossRef] [PubMed]
  53. Jamshed, M.; Jia, F.; Gong, J.; Palanga, K.K.; Shi, Y.; Li, J.; Shang, H.; Liu, A.; Chen, T.; Zhang, Z. Identification of stable quantitative trait loci (qtls) for fiber quality traits across multiple environments in Gossypium hirsutum recombinant inbred line population. BMC Genom. 2016, 17. [Google Scholar] [CrossRef] [PubMed]
  54. Bourgou, L.; Sawadogo, M.; Sanfo, D.; Lacape, J.-M. Ssr-based genetic diversity of traditional and perennial cotton (Gossypium spp.) populations collected in burkina faso. Genet. Resour. Crop Evol. 2017, 64, 1743–1759. [Google Scholar] [CrossRef]
  55. Ashraf, J.; Malik, W.; Iqbal, M.; Khan, A.; Qayyum, A.; Noor, E.; Abid, M.; Cheema, H.; Ahmad, M. Comparative analysis of genetic diversity among bt cotton genotypes using est-ssr, issr and morphological markers. J. Agric. Sci. Technol. 2016, 18, 517–531. [Google Scholar]
  56. Sethi, K.; Siwach, P.; Verma, S.K. Assessing genetic diversity among six populations of Gossypium arboreum L. Using microsatellites markers. Physiol. Mol. Biol. Plants 2015, 21, 531–539. [Google Scholar] [CrossRef] [PubMed]
Figure 1. Gene ontology functional classification for G. barbadense with differential expression of 155 genes. GO analysis of 155 protein sequences illustrated for their association with biological processes (BP), molecular functions (MF), and cellular components (CC) along with the Q-value. Results are indicated in pie charts and presented in detail in Table S2.
Agronomy 08 00181 g001
Figure 2. RNA sequence data analysis of 108 genes with differential expression of both up- and downregulation for each RNA sequence. The heatmap was constructed by using log 10 of the expression values. Color coding shows expression as clarified in the key and genes represented along the y-axis divided into three distinct groups with relative expression (2−ΔΔCt). The DPAs are demonstrated at the top.
Agronomy 08 00181 g002
Figure 3. Dendrogram based on NJ analysis. The different colored dots indicate the wild-type accessions, while red and light blue squares represent the improved accessions.
Agronomy 08 00181 g003
Figure 4. Two-dimensional principal coordinate analysis (PCoA) of 79 accessions of G. barbadense and G. darwinii collected from the Galapagos Islands. Blue (Cluster I), Green (Cluster II), Light green (Cluster III), Orange (Cluster IV), Red (Cluster V).
Agronomy 08 00181 g004
Table 1. Summary of germplasm collection from the Galapagos Islands.
Sr. No.Species NameGenome TypeTotal No.No. of AccessionsPlace of Collection
1G. barbadenseAD22015Santa Cruz, Galapagos
5Wild cotton germplasm nursery of China
2G. darwiniiAD55913Santa Cruz, Galapagos
25Isabella
16San Cristobal
5Wild cotton germplasm nursery of China
Sr.: Serial; No.: Number.
Table 2. Summary of analysis of molecular variance (AMOVA).
SourcedfSSMSEst. Var.%
Among Pops41591.508397.87723.91938%
Within Pops742915.13739.39439.39462%
Total784506.646 63.313100%
df: degree of freedom; SS: sum of squares; MS: mean squares; Est. Var.: estimated variation.

