Article

GWAS for Fusarium Head Blight Related Traits in Winter Wheat (Triticum Aestivum L.) in an Artificially Warmed Treatment

by
Elisane W. Tessmann
and
David A. Van Sanford
*
Department of Plant and Soil Sciences, University of Kentucky, Lexington, KY 40546, USA
*
Author to whom correspondence should be addressed.
Agronomy 2018, 8(5), 68; https://doi.org/10.3390/agronomy8050068
Submission received: 13 March 2018 / Revised: 13 April 2018 / Accepted: 3 May 2018 / Published: 5 May 2018
(This article belongs to the Special Issue Disease Resistance Trade-offs in Crop Breeding for Disease Resistance)

Abstract

:
Global temperature increases will affect Fusarium head blight (FHB) levels in wheat (Triticum aestivum L.). A pressing question is whether current sources of resistance will be effective in a warmer environment. We evaluated phenotypic response to disease in 238 soft winter wheat breeding lines and cultivars grown in 2015–2016 and 2016–2017 under control and warmed (+3 °C) conditions. Warming was achieved with heating cables buried 3 cm in the rhizosphere. We measured heading date, plant height, yield, FHB rating, Fusarium damaged kernels (FDK), deoxynivalenol (DON), leaf blotch rating, powdery mildew rating and leaf rust rating. There were significant (p < 0.01) differences among genotypes for all traits measured. Genome-wide association study (GWAS) identified 19 and 10 significant SNPs in the control and warmed treatments, respectively. FDK and DON levels were often significantly (p < 0.05) higher in warmed than in control when we contrasted alleles at important quantitative trait locus (QTL) such as Fhb1, Rht-B1 and D1 and all vernalization and photoperiod loci. Increased rhizosphere temperature resulted in a significantly (p < 0.01) earlier heading date (~3.5 days) both years of the study. Rank correlation between warmed and control treatments was moderate (r = 0.56). Though encouraging, it indicates that selection for performance under warming should be carried out in a warmed environment.

1. Introduction

Wheat (Triticum aestivum L.) is one of the most important cereals in the nation and widely consumed around the world. Increases in population, changes in diet, social and policy issues especially in developing countries, will increase the demand for staple foods such as wheat [1]. Among the challenges that researchers are facing, the most daunting is how to increase production in a sustainable way with minimum increase in area. Ray et al. [2] using historical data determined that wheat yield is increasing by 0.9% per year, substantially lower than the rate that we need (~2.4% per year by 2050). In addition, increased temperature and changes in rainfall patterns over the next decades will require extra effort to increase grain production [3]. Without efficient selection of adapted plants and improvement in genetic material, a global decrease in production is estimated on the order of 6.0% in wheat, 7.4% in maize, 3.2% in rice and 3.1% in soybean for each degree-Celsius increase in temperature [4].
IPCC [3] projects a global increase, under all emission scenarios, in air temperature by 1 to 3.7 °C by the end of this century. Decrease in crop production due to weather events is not only a future problem, in that drought, flood and extreme temperatures are already reducing production worldwide. Lesk et al. [5] estimated that from 1964 to 2007 around 9–10% of the reduction in cereal production worldwide was due to drought and extreme heat events. They determined that yield losses due to drought were associated with decreased harvested area and heat events, though extreme heat was the primary factor in yield decreases. In a more regional analysis of data from wheat field trials in the United States from 1985 to 2013, there was a yield reduction due to extreme heat in spring [6]. In addition, Tack et al. [6] observed that recently released cultivars had a lower ability to resist heat stress than old varieties. Climate change is expected to increase not only air temperature but also soil temperature. Studies with winter wheat [7] and barley [8] testing soil warming conditions showed limited crop development and yield production.
Climate change will also affect disease occurrence, distribution and intensity. A major disease threat to wheat and other small grains is Fusarium head blight (FHB) which causes yield losses, decreases in grain quality and toxin production [9]. Using a modeling approach, Backhouse et al. [10] found a positive correlation between climate and distribution of pathogenic species of Fusarium which includes Fusarium graminearum. His group predicted wide distribution in countries where this disease already occurs and further, that new regions such as Mexico, North Africa, Ethiopia and western Siberia would be vulnerable to FHB epidemics [10].
Despite the ability of this pathogen to reduce yield, the production of mycotoxins such as deoxynivalenol (DON) which are harmful to plants, animal and humans is the driving force behind selection for resistance to FHB [9]. A study predicting wheat phenology and DON in north-western Europe pointed out that due to climate change, flowering and maturity will be 1 to 2 weeks earlier in the season and DON levels will increase up to 3 times in most of the regions where the study was carried out [11]. Fusarium damaged kernels (FDK) is also an important trait since kernel damage is associated with reduced test weight, which directly affects farmers who receive lower prices for their grain.
Success during infection and colonization of plants by Fusarium is a function of host susceptibility, time of infection, fungal pathogenicity and meteorological conditions [12,13]. The disease occurs during or just after flowering where spores that overwintered in plant debris can germinate and penetrate floral tissue. FHB is driven by weather conditions where wet and warm environments are required for fungal development [9]. Integrated management using cultivar resistance and FHB-specific fungicide application are the most effective management techniques [14]. The challenges of fungicide application derive mainly from timeliness of the fungicide application. Prediction tools such as FHB Prediction Center (http://www.wheatscab.psu.edu) are helping farmers to assess the risk of disease and decide whether or not fungicide application is profitable.
In recent decades, investigators worldwide have carried out extensive studies to develop genetically resistant cultivars. Quantitative trait locus (QTL) such as Fhb1, Qfhs.ifa-5A and QFhs.nau-2DL are widely used as sources of resistance in breeding programs [12,15,16]. Fhb1, for instance, provides resistance against spread of the disease (type II resistance) while Qfhs.ifa-5A provides resistance to penetration (type I resistance) [17,18]. A map-based cloning of Fhb1 was recently published, opening the possibility of direct cloning and use of that gene [19]. Furthermore, techniques such as RNA interference (RNAi) for fungicide development and cultivar resistance are promising approaches to controlling FHB [20]. However, FHB is a quantitative disease, thus an individual QTL approach may not be efficient in controlling this disease, since resistant cultivars have a compilation of major and minor genes that work together to provide resistance.
Plant resistance to diseases will be positively or negatively affected by climate change [21,22]. The genetic composition of a variety can provide resistance to disease; however, environmental conditions largely influence whether or not resistance genes will be expressed [13]. This raises an important question: how responsive are our cultivars to climate change? Are the current sources of resistance to FHB responsive to an increase in temperature? To our knowledge, there are no studies evaluating whether the current sources of FHB resistance will be effective in a warmed environment. In order to answer that question, we conducted over two years an artificially warmed experiment in order to assess the disease response in a large, diverse wheat mapping panel. Our goal was to determine whether or not the QTL used today for FHB resistance would be responsive to disease in an artificially warmed treatment. Specific objectives were: (i) to evaluate phenotypic response to FHB and other disease traits in a large, diverse soft wheat mapping panel under warmed and control conditions; and (ii) to determine whether there were QTL associated with FHB traits under warmed conditions when compared with control conditions based on GWAS analysis.

2. Materials and Methods

2.1. Site Description and Experiment Design

The study was conducted at the University of Kentucky Spindletop Research Farm in Lexington, KY (38°7′37.81″ N, 84°29′44.85″ W) (37°6′7.37″ N, 87°52′13.62″ W). Soil type at the site is a Maury silt loam (fine, mixed, semi active, mesic Typic Paleudalfs). The experimental material consisted of two hundred and thirty-eight elite soft red winter wheat cultivars and breeding lines from an elite mapping panel constituted under the Triticeae Coordinated Agricultural Project (TCAP). The TCAP project was a consortium that involved 21 states and 55 universities, funded by the National Institute for Food and Agriculture (NIFA) of the United States Department of Agriculture (USDA; http://www.triticeaecap.org/). Populations such as the elite panel were genotyped with the 90 K Illumina SNP chip.
The two hundred and thirty-eight wheat lines used in this study differed in characteristics such as heading date, height and the environment to which they were adapted. The studies were planted 20 October 2015 and 22 October 2016 in a nested factorial split block design at Spindletop farm in Lexington, KY. The experimental unit was a hill plot. Two replications per genotype per treatment were planted in 2015 whereas four replications were planted in 2016. Two treatments were used: the control (ambient) treatment and an artificially warmed treatment. Soil heating cables (Gro-Quick 42 m length, 120 V, 700 watt) were used to warm the rhizosphere in the artificially warmed treatment [23,24]. Cables were active during the majority of the growing season, from December through June.
Cables were buried at a depth of ±3 cm between rows to warm the rhizosphere. A Campbell weather station was placed at the site to measure soil temperature and air temperature within each treatment. There were 8 thermocouple wires (OMEGA Engineering, Stamford, CT, USA) in each block in the warmed treatment and two in the control treatment that measured soil temperature. Soil temperature sensors were placed at a depth of ±5 cm. Air temperature was measured by two thermocouple wires in the warmed treatment and two in the controlled treatment. The air sensors were positioned on a metal bar placed into the ground and they were moved up to follow plant growth. Each probe within each treatment measured soil/air temperature daily every 15 min and measurements were averaged along each row throughout the duration of the study. Each row was flanked by two heating cables. The two temperature sensors for each row were averaged to determine the temperature threshold for each cable compared to the control treatment. When the temperature difference between control and warmed was less than 5 °C, cables in the warmed treatment were activated to heat the soil.
In 2016, hill plots were sprayed with a conidial spore solution to encourage initial infection of wheat plants by F. graminearum. Spore concentration in the solution was 50,000 macroconidia mL−1. Hill plots were sprayed manually with a bottle sprayer before, during and after flowering to insure the presence of spores during the most favorable stage for infection. In 2017, scabby corn (Zea mays L.) seed infected with F. graminearum spores was spread three weeks prior to heading of the earliest genotype [25]. Inoculum came from 27 isolates taken from scabby wheat seed collected from multiple locations across Kentucky, 2007–2010. An overhead irrigation system on an automatic timer was used to provide favorable conditions for disease development.

2.2. Traits Measured

Heading date (HD; Julian) was determined for each hill plot when more than 50% of the spikes had emerged from the flag leaf. Plant height (PH; cm) was measured from the soil surface to the top of the spike, excluding awns. FHB rating is a visual index of FHB incidence and severity ranging from 1 (≤10% of spikes showed FHB symptoms) to 9 (≥90% of spikes showed FHB symptoms) 24 days after heading date. Yield from each hill plot was recorded in grams m−2.
In addition to the traits described above, in 2017 FHB pressure was sufficiently high that we were able to measure Fusarium damaged kernels (FDK) and deoxynivalenol (DON). In addition, there was natural infection by other pathogens such that we were able to rate leaf blotch (Septoria tritici), powdery mildew (Blumeria graminis f. sp. Tritici) and leaf rust (Puccinia triticina). FDK is a visual estimate of kernel damage ranging from ≤5% to ≥90% of scabby kernels. Two samples of each genotype were sent for DON analysis; sample 1 was composed of replications 1 and 2 and sample 2 was composed of replications 3 and 4. Each whole kernel sample (15 g) was sent to University of Minnesota DON testing laboratory which uses gas chromatography with mass spectrometry (GC-MS) [26]. For leaf blotch, powdery mildew and leaf rust rating a visual estimate was taken ranging from 1 (≤10% of plants showed disease symptoms) to 9 (≥90% of plants showed disease symptoms). At harvest maturity, all spikes of each hill plot were hand harvested using a sickle. Harvest maturity was determined when grain was hard and could not be split by a thumbnail. After harvest, grain was mechanically threshed.

2.3. Statistical Analysis

Analysis of variance (ANOVA) was performed using SAS Procedure GLM [27] to determine genotype and treatment effects. The model used was:
Yijkl = µ + Ti + R(T)ij + Gk + Ti × Gk + Yl + Ti × Yl + Gk × Yl + Eijkl
where Yijkl = the observation in the kth genotype in the jth rep in the ith treatment, µ = the overall mean, Ti = the effect of the ith treatment, R(T)ij = the effect of jth rep within ith treatment, Gk = the effect of the kth genotype, Ti × Gk = the effect of the interaction of the ith treatment and the kth genotype, Yl = the effect of the lth year, Ti × Yl = the effect of the interaction of the ith treatment and the lth year, Gk × Yl = the effect of the interaction of the kth genotype and the lth year, Eijkl = the residual error.
Broad sense heritability of the traits measured in both years of the study was estimated on an entry mean basis using the following model:
Yijk = µ + Yi + R(Y)ij + Gk + Yi × Gk + Eijk
where Yijk = the observation in the kth genotype in the jth rep in the ith treatment, µ = the overall mean, Yi = the effect of the ith year, R(Y)ij = the effect of jth rep within ith year, Gk = the effect of the kth genotype, Yi × Gk = the effect of the interaction of the ith year and the kth genotype, Eijk = the residual error. Because we wanted to determine whether heritability was affected by warming, estimates were generated for each treatment separately.
Data was analyzed using the GLM procedure of SAS [27]. Genotypic and phenotypic variance components were estimated from the expected mean squares (EMS) and heritability estimates were computed as:
h2 = σg2/σp2
where h2 = heritability, σg2 = genotypic variance, σp2 = phenotypic variance. Confidence intervals (90%) were calculated after Knapp et al. [28] as:
UL = 1 – (MS3/MS2 × FUL (0.05, v1 and v2 df))−1
LL = 1 – (MS3/MS2 × FLL (0.95, v1 and v2 df))−1
where UL = upper limit of the confidence interval, MS3 = entry mean square, MS2 = residual mean square, FUL and FLL = F value for the upper and lower limits, respectively.
Several traits were measured only in 2016–2017; broad sense heritability estimates of these traits are termed “repeatability” [29] and the model used for estimation was:
Yijk = µ + Ri + Gj + Eij
where effects are defined as above.
Proc CORR [27] was used to analyze the relationships among traits on an entry mean basis.

2.4. Genome Wide Association

All entries in the mapping panel were genotyped with the 90 K Illumina SNP chip to identify single nucleotide polymorphisms (SNPs). A total of 3919 SNPs were used for the GWAS in this study. Genotypic and phenotypic data were formatted to HapMap and text file format, respectively. We used the following QTL as covariates in the model: Fhb1, Rht_B1, Rht_D1, vrn_A1, vrn_B1, vrn_D3, Ppd_A1, Ppd_B1 and Ppd_D1. Genomic Association and Prediction Integrated Tool (GAPIT; [30]) which uses compressed mixed linear model approach for the genome wide association study was used to identify SNPs associated with the traits of interest.

3. Results

3.1. Phenotypic Variation

The average soil temperature over the whole growing season was higher in the warmed treatment than in the control treatment for both years of this study. The cables were programmed for a 5 °C temperature threshold, however the temperature in the warmed treatment ranged from 0.65–2.95 °C and 0.75–3.30 °C greater than the control treatment in 2016 and 2017, respectively (Figure S1a,b).
Means for control and warmed treatment in 2016 and 2017 are presented in Table 1. Independent of the warming treatment, heading date was 8.4 days earlier in 2017 than in 2016, on average. The warmed treatment was 3.53 and 3.41 days earlier, on average, when compared with the control treatment in 2016 and 2017, respectively. Intensity of FHB differed dramatically between the years of the study. In 2016 the experiment was sprayed with conidia 3 times; however, the lack of moisture reduced scab pressure to the extent that we did not obtain reliable data for FDK and DON. In 2017, we were able to use scabby corn and mist irrigation and had a much higher level of disease pressure. Thus, of the scab traits, only FHB rating was recorded both years of the study; DON and FDK data are presented only for 2017. For FHB rating the difference between control and warmed treatment in 2016 was 0.24, while in 2017 was 0.55. Plant height in the warmed treatment was slightly greater (0.73 cm), on average, than in the control in 2016. In contrast, the warmed treatment reduced plant height 5.74 cm in 2017 (Table 1). Both increased and reduced height in response to warming have been observed in other studies carried out in our lab [23,24]. Yield was evaluated in small hill plots thus its estimation is not as reliable as estimates based on conventional yield plots [31]. Yield increased under warmed conditions by 21% in 2016 and decreased by 6.4% under warmed conditions in 2017. For the disease traits such as DON, FDK, leaf blotch rating and powdery mildew rating the warmed treatment increased disease pressure. DON increased by 84%, FDK 131%, leaf blotch rating 17.3% and powdery mildew rating 0.66% under warmed conditions. For leaf rust rating, there was no change between control and warmed treatments (Table 1).
The warming treatment had a significant (p < 0.05) effect on HD, DON, FDK and leaf blotch rating (Table 1). There were significant differences among the genotypes for all traits evaluated. Significant treatment × genotype interaction (p < 0.05) was observed for DON, FDK, leaf blotch rating and leaf rust rating (Table 1). The results of the interactions involving year are shown only for the traits evaluated in both years: HD, FHB rating, PH and yield. While there was no significant year × genotype interactions, year × treatment interaction was significant for all traits, except for HD (Table 1).
Correlations among traits under control and warmed conditions for 2016 and 2017 are shown in Table 2 and Table 3, respectively. Low correlations among most traits were observed in 2016 (Table 2). Heading date was positively correlated with plant height in both treatments. FHB rating was negatively correlated with plant height: −0.28 under warmed conditions and −0.20 under control conditions (p < 0.01). A negative correlation was also observed between FHB rating and yield in both treatments. Yield and plant height were positively correlated in both years under control and warmed conditions (Table 2 and Table 3); correlations were intermediate in all cases.
In 2017, the correlation between HD and FHB rating varied among treatments; in the warmed treatment, the traits were positively correlated (0.51), while under control conditions there was no correlation between these traits (Table 3). Under control conditions, PH and FHB rating had a correlation of −0.30, however under warmed conditions the correlation was not significant. FDK and DON were correlated with values of 0.42 and 0.57 under control and warmed conditions, respectively. Leaf diseases were not correlated with FDK and DON, with the exception of a weak but significant correlation between powdery mildew rating and FDK in the warmed treatment (−0.12; Table 3).
Heritability estimates and confidence intervals (90%) are presented in Table 4. These estimates were based on individual analysis of treatments. For traits measured in both years heritability ranged from 0.23 to 0.81 in the control treatment and from 0.13 to 0.80 in the warmed treatment (Table 4). Repeatability of those disease traits measured only in 2017 ranged from 0.39 to 0.80 in the control treatment and 0.35 to 0.84 in the warmed treatment (Table 5). Repeatability of FDK was 0.80 and 0.84 under control and warmed conditions, respectively. DON also had high repeatability in both treatments, with values of 0.71 for control and 0.75 for the warmed treatments. Leaf blotch rating had repeatability of 0.39 and 0.35 under control and warmed conditions, respectively. A repeatability estimate of 0.42 was observed for powdery mildew rating under control conditions versus 0.69 under warmed conditions (Table 5). Heritability of rating had a confidence interval that enclosed zero in the warmed treatment (Table 4). For traits such as heading date and plant height high heritability values were observed in control and warmed treatments (Table 4).

3.2. Genome-Wide Association Study (GWAS)

We performed a GWAS for the control and warmed treatments separately and used known QTL as covariates in the model. Manhattan plots for FDK, DON, HD and PH show promising QTL for those traits (Figure 1). Potential SNPs for FDK, DON, HD and PH are presented in Table 6. Only SNPs with LOD score >3 are listed in the table. We detected 19 SNPs in the control and 10 SNPs in the warmed treatments. These SNPs were located on almost all chromosomes with the exception of 2B, 2D, 4B, 4D, 6D and 7D where we did not detect SNPs associated with the traits measured in this study (Table 6; Figure 1). Seven SNPs in the control treatment were found for FDK on chromosomes 1A, 1B, 2A, 3B and 5A. The SNP effects ranged from −2.32 to 2.40%. Two SNPs on chromosome 1B, M1905 and M1563, explained 2.40 and 2.11%, respectively, of the variation observed for FDK under control conditions (Table 6). The SNPs M1591 and M480 were associated with 1.99 and 1.72%, respectively of variation in FDK. There was no SNP under warmed conditions for FDK that met our LOD score threshold.
The association mapping for DON identified five SNPs in the control treatment and three SNPs in the warmed treatment. SNPs, under control conditions, were observed on chromosomes 1B, 4A, 6A and 6B, while under warmed conditions chromosomes 3B and 4A had SNPs for DON. A SNP (M1528) at position 243.59 on chromosome 1B had a positive effect of 0.87% on the variation observed for DON under control conditions. A negative effect of −0.96% was associated with SNP M11423 on chromosome 6B under control conditions (Table 6). Under warmed conditions a SNP (M5744) on chromosome 3B explained 1.13% of the DON variation (Table 6).
Heading date had four and six SNPs for control and warmed treatments, respectively. Under control conditions, SNPs were observed on chromosomes 4A, 5D and 7B with effects ranging from -0.55 to 0.62%. Under warmed conditions, chromosomes 1D, 3B, 3D and 7A had SNPs where the effects ranged from −0.78 to 0.68% for HD (Table 6). The GWAS for plant height uncovered four potential SNPs on chromosome 5B, three in the control and one in the warmed treatment (Table 6).
Under control conditions SNPs M8584 and M9257 had effects of 2.41 and 2.13%, respectively. The SNP M8584 was also identified in the analysis for the warmed treatment and it explained 2% of the variation.
The effects of known QTL in the genotype response to an artificially warmed treatment for FDK and DON are presented in Table 7. The QTL analyzed in the population were: Fhb1, Rht_B1, Rht_D1, vrn_A1, vrn_B1, vrn_D3, Ppd_A1, Ppd_B1 and Ppd_D1. The population was classified for each allelic form of the QTL and the levels of FDK and DON are presented for each treatment. In the warmed treatment, there was drastically increased disease pressure. For example, FDK increased from 98 (vrn_A1_short) to 135% (Ppd_A1_sensitive) in the warmed treatment when compared with the control treatment. DON levels increased under warming conditions from 50 (Rht_B1b) to 121% (vrn_A1_short) when compared with the control treatment (Table 7). Under warming, lines with resistance alleles at Fhb1 had 13.08 and 29.87% FDK under control and warmed conditions, respectively, an increase of 128% associated with warming. For DON, on the other hand, these lines did not differ significantly from one treatment to the other. Lines that did not possess Fhb1 R alleles showed 120% more FDK and 69% more DON under warmed conditions (Table 7).
In our population, the dwarfing alleles, Rht-B1b and Rht-D1b, were present in 123 and 84 genotypes, respectively. Wild type alleles, Rht_B1a and Rht_D1a, were present in a total of 112 and 151 genotypes had those genes, respectively. Both alleles at the Rht loci were strongly affected by the treatment, in that the warmed treatment changed plant morphology by shortening the plants (Figure 2). FDK levels were 129 and 112% greater for Rht-B1b and Rht-D1b under warmed conditions, respectively, than under control conditions (Table 7). Under warming, DON levels for Rht-B1b and Rht-D1b were increased 50 and 78%, respectively, over control levels. Average levels for FDK and DON were also higher under warmed than under control conditions for the wild-type genotype (Rht_B1a and Rht_D1a).
The TCAP panel was also genotyped at vernalization loci. A total of 225 genotypes had vrn_A1, 230 had vrn_B1 and 165 genotypes had vrn_D3 (Table 7). In the warmed treatment, genotypes with vrn_A1 had 123% more FDK and 60% more DON than in the control treatment. Similarly, vrn_B1 had increases of 122% for FDK and 62% for DON under warmed conditions. The last vrn gene, vrn_D3, was also associated with high DON concentration and high FDK level under warming, with increases of 120% for FDK and 66% for DON in the warmed treatment versus the control. In addition to the vernalization genes, we also analyzed disease impact as affected by photoperiod genes Ppd_A1, Ppd_B1 and Ppd_D1. A total of 138 genotypes were Ppd_A1_insensitive; these showed an increase in FDK of 111% and 60% for DON under warmed conditions (Table 7). In the nineteen genotypes with the Ppd_B1_insensitive allele, FDK increased by 109% and DON concentration was 65% higher in the warmed treatment when compared with the control. Genotypes with Ppd_D1_insensitive alleles had increased disease levels of 119 and 65% for FDK and DON, respectively, under warmed conditions. Disease impact for Ppd sensitive genotypes was also higher in the warmed treatment when compared to the control: FDK increased by 135, 121 and 125% for Ppd_A1, Ppd_B1 and Ppd_D1, respectively. DON levels were 64, 61 and 62% higher in the warmed treatment than in the control for Ppd_A1, Ppd_B1 and Ppd_D1, respectively (Table 7).

4. Discussion

Maintaining and/or increasing yield production under climate change is one of the most important challenges of this century. The stress caused by elevation in temperature, changes in rainfall patterns and increases in pests and diseases is predicted to affect crop production significantly [4,5,13]. Field experiments can best assess crop response to the environment due to natural exposure to pest and disease pressure and weather conditions such as rain, temperature and cloud cover. In this study, we simulated increased temperature by artificially warming the rhizosphere and by causing an FHB epidemic, with the goal of assessing changes in plant response under these stresses. We observed that increasing the temperature by 1.8 °C and 2.0 °C in 2016 and 2017 respectively, reduced the length of the winter wheat growing period (Table 1). Other researchers have reported field studies simulating increases in air temperature that showed an effect on wheat phenology by reducing the pre-anthesis period [32,33]. In another study, soil warming conditions have shown a shortening of the total crop growing season in wheat [7].
Understanding the effects of a warmed environment in crop response is fundamental to achieving sustainable production in the years ahead. Crop models have been used to predict the effects of climate change. These models show a decrease in yield for each degree-Celsius increase in temperature [4,11,34]. Our results showed an increase in yield of 21% in 2016 and a decrease of 6.4% in 2017 under warmed conditions. Increased yield in 2016 could be explained by the experimental design where in 2016 we had only two replications while in 2017 we had four. Since we presented average values for the genotypes in hill plots, the number of replications could affect the final value. Even though crop models predict a reduction in yield in a warmer environment, other researchers have also found an increase in yield. Li et al. [35], evaluating the effects of soil warming in wheat, observed an increase in yield. Similar results were observed by Tian et al. [33] in an experiment with air temperature increase tested in winter wheat. Högy et al. [8] under elevated soil temperature observed no change in grain yield of barley. Variation in yield response to warming agrees with previous studies in our group [24].
Progress in plant breeding depends, in part, on the heritability of the traits of interest. We were particularly interested in differences in heritability estimates between control and warmed conditions. As expected, based on previous studies [24], heading date and plant height had high heritability in the control treatment as well as in the warmed treatment. FHB rating, an indication of disease incidence and severity, had a low heritability in the control environment and its heritability under warmed conditions was not significantly different from zero. Heritability of rating in one of our advanced breeding line trials (grown in single row plots in the scab nursery) in 2016 and 2017 was low, averaging 0.32 (data not shown). The other factors that can account for the low heritability of FHB rating in the present study are: (i) hill plots present a different picture to the person rating than do single rows—there is not as much material for the reviewer to look at and rate; and (ii) the very low h2 rating in the warmed treatment is probably a reflection of the more rapid development of the plant, making it even more difficult to rate at the proper time.
For FDK and DON, repeatability estimates were greater in the warmed treatment than in the control treatment (Table 5). FDK repeatability estimates were 0.80 and 0.84 under control and warmed conditions, respectively. Similarly, DON repeatability estimates were 0.71 and 0.75 under control and warmed conditions, respectively. High repeatability values indicated reproducibility of the data in the control and warmed treatment. Our results suggest that selection for disease traits such as FDK and DON could be achieved in a warm treatment. Heading date and FHB rating had a moderate correlation of 0.51 in the warming treatment (Table 3). This result implies that genotypes with a long flowering period had a prolonged period of exposure to the pathogen.
Genome wide association studies (GWAS) provide a tool that breeders can use to investigate a large population of breeding lines and cultivars for association of genomic markers with important agronomic and disease traits. Furthermore, GWAS, by concurrent analysis of genotypic and phenotypic data, allows the detection of QTL across populations with different backgrounds [36,37]. Exploring recombination events that occurred years ago in unrelated individuals to identify alleles in linkage disequilibrium with the marker are one of the advantages of GWAS [38,39]. The panel used in this study represents soft red winter wheat lines and cultivars from breeding programs distributed across 14 states. A large and diverse panel provides a more realistic assessment of the genetic response to a warmed treatment than would be possible with a single bi-parental population. Several breeding lines and cultivars from the panel have been used as parents in the University of Kentucky breeding program; thus, the results of the GWAS are relevant to possible breeding progress for performance in a warmer treatment in our program.
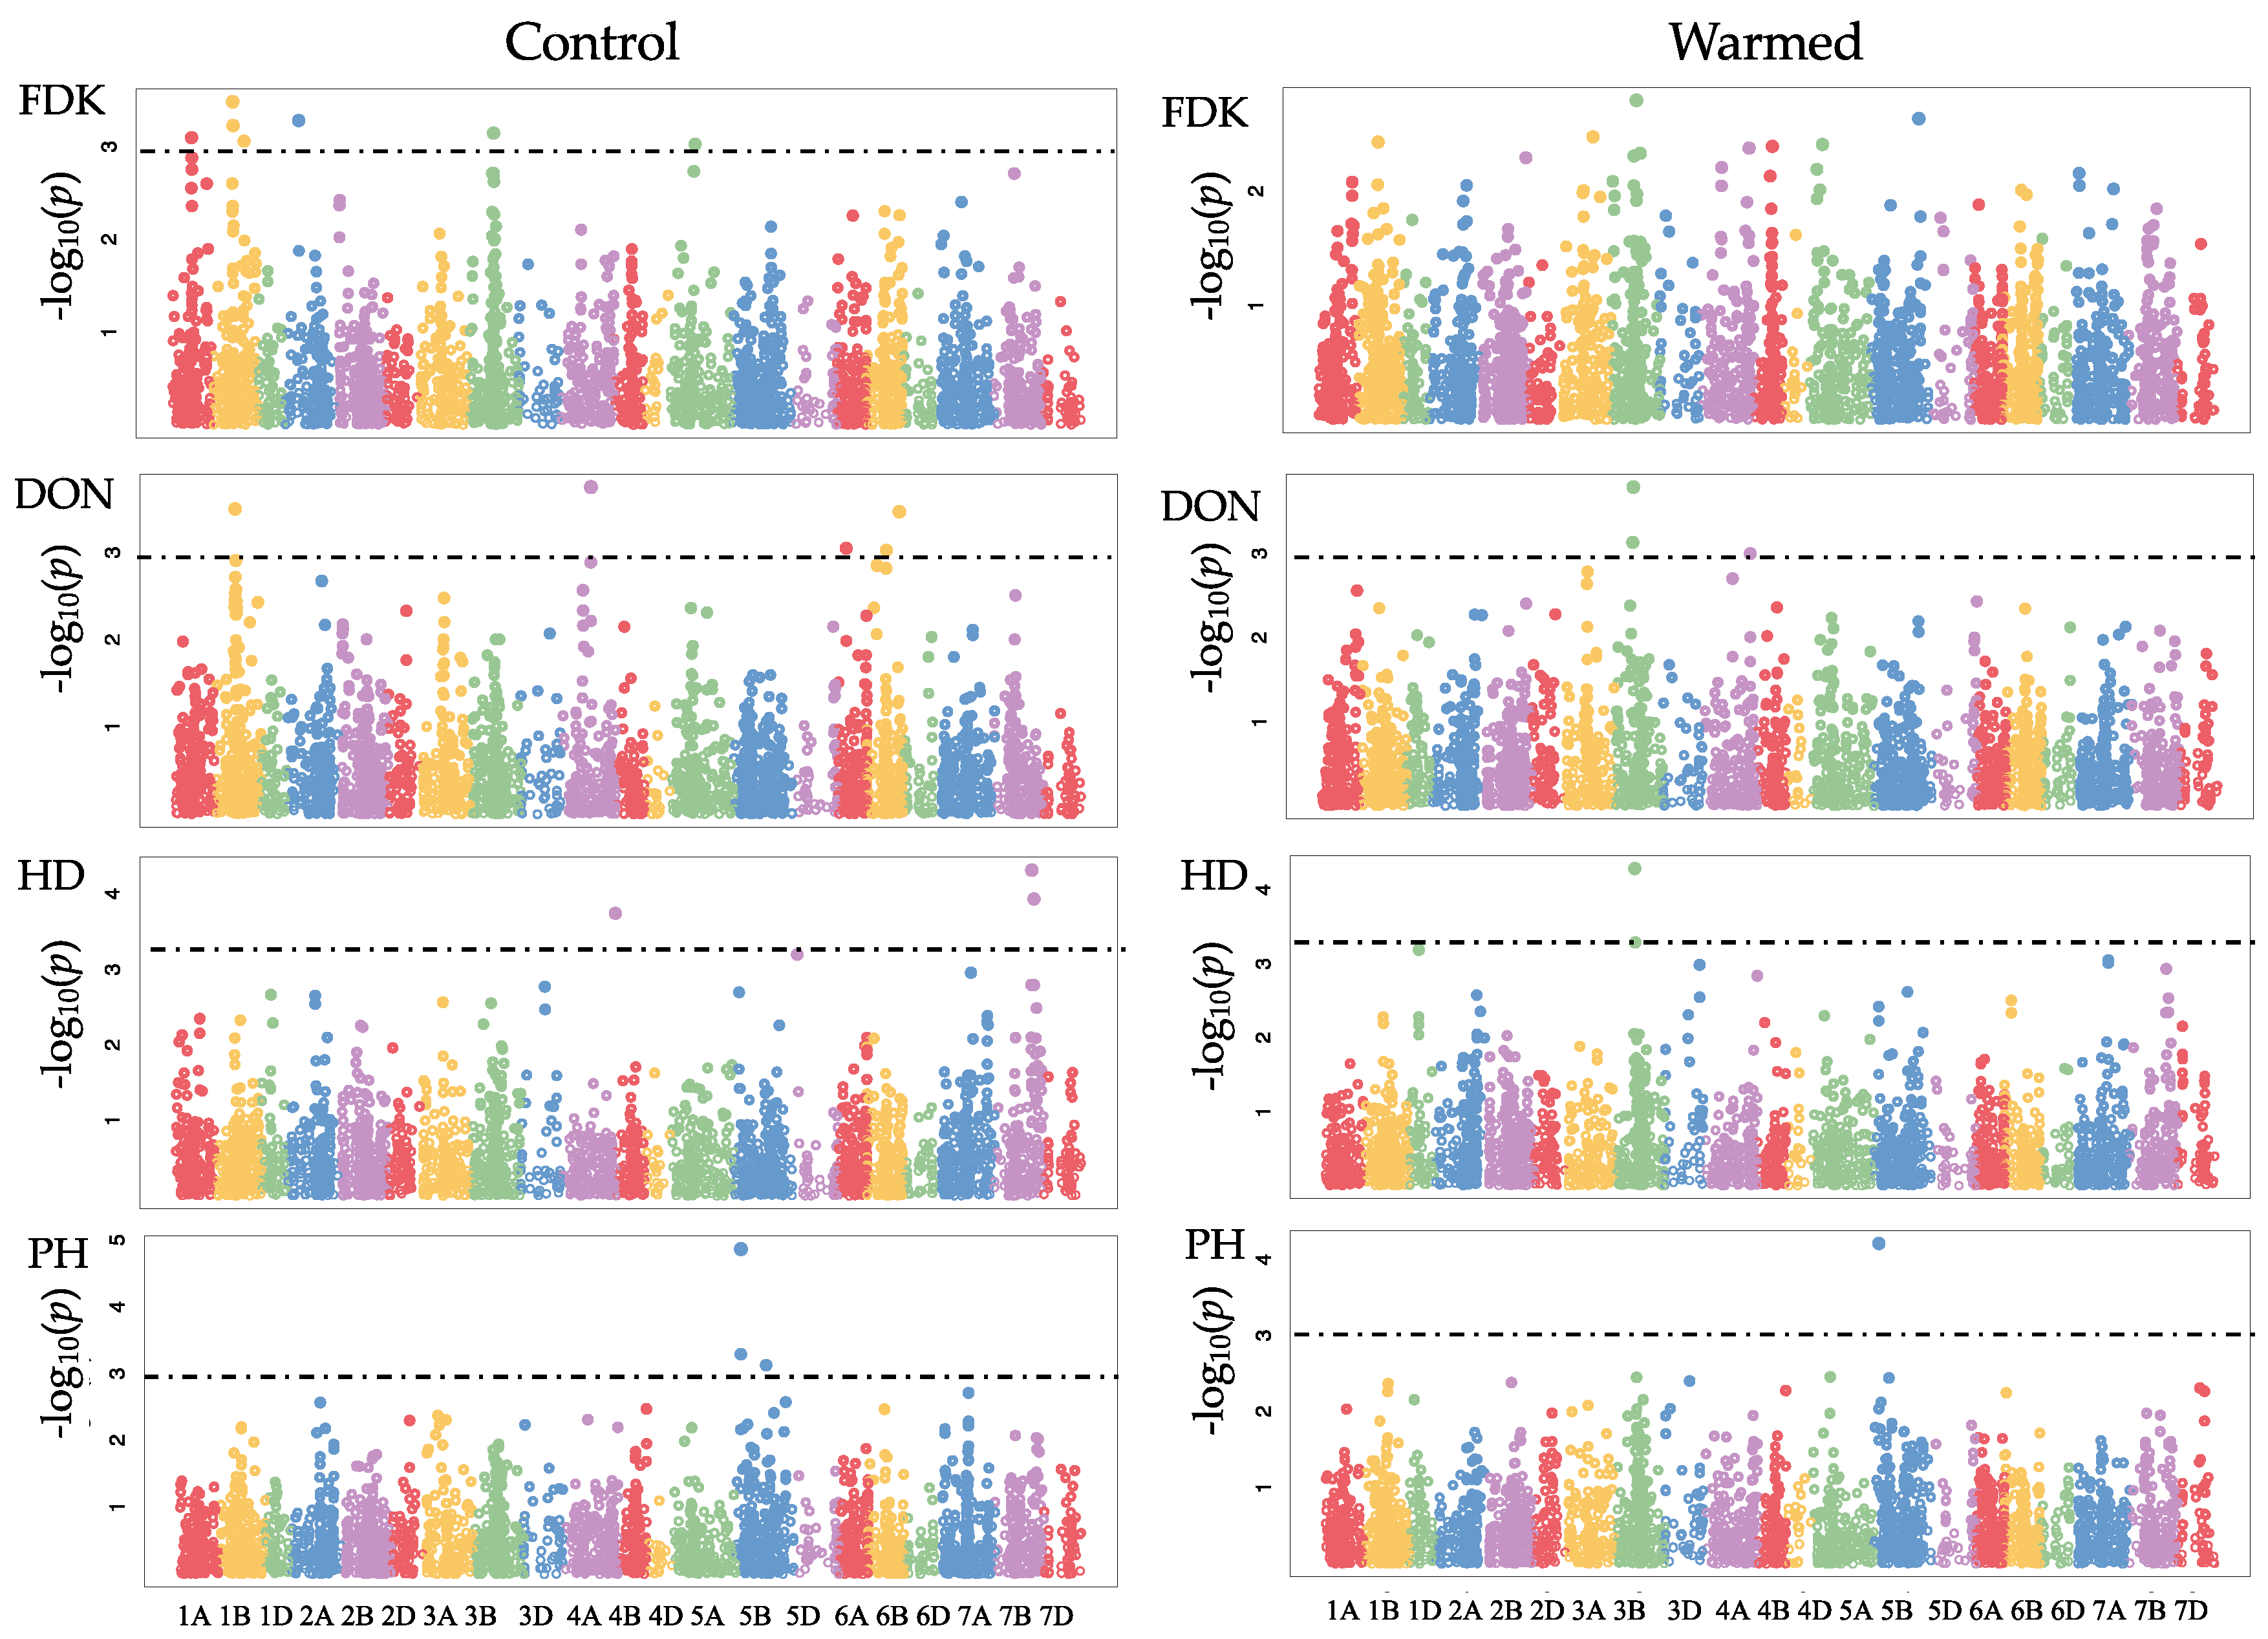
GWAS was carried out for the control and warmed treatments separately. Using a LOD threshold of 3, we detected 19 and 10 SNPs under control and warmed conditions, respectively (Table 6, Figure 1). There were significant SNPs for FDK under control conditions with effects ranging from −2.32 to 2.40 on chromosomes 1A, 1B, 2A, 3B, 5A (Table 6). However, there was no significant SNP for FDK under warmed conditions. In the control treatment, we observed a significant SNP on chromosome 1B with effect of 0.87% on DON levels was founded. In the warmed treatment, the chromosome 3B had two SNPs with effects of 1.13% and 0.94% on DON; neither of these SNPs is associated with Fhb1. The analysis of HD showed effects ranging from −0.78 to 0.68% under warmed conditions. GWAS revealed potential plant height QTL (not associated with the Rht loci) with effects from 1.75 to 2.41%. SNP M8584 was detected in the control and warmed treatment, suggesting that this SNP could be used to evaluate populations under warmed conditions.
In complex diseases such as FHB, major and minor genes are involved in conferring levels of resistance [40,41]. Plant morphology, resistance to infection and spread of disease as well as environmental factors are critical in determining plant response to pathogens [17,18,42]. The detection of large QTL effects decreases exponentially with the increase in trait complexity [43]. Thus, for complex traits, with multiple genes involved, an identification of small QTL effects is more likely [43,44]. As pointed out by Massman et al. [44], major QTL in breeding germplasms are under strong selection for multiple years and, thus, fixed in multiple genetic backgrounds. In our study, QTL effects were small, explaining ~−2.5% to +2.6% of the phenotypic variation observed for the traits. If these estimates are accurate, these small effect QTL could be useful in a genomic selection program under warmed conditions.
In addition to the GWAS analysis, we were interested in evaluating the effects of a warmed treatment for disease levels of important wheat QTL (Table 7). Fhb1 is widely used in breeding programs to provide resistance to FHB [19,45]. In our population of study, under control conditions the presence or absence of this QTL was not statistically significant, which indicates that in these lines the Fhb1 resistance was not expressed. Fhb1 increased by 120 and 128%, FDK levels in warmed conditions in absence and presence of the R alleles, respectively. In addition, lines which lacked the resistance alleles at Fhb1 presented ~69% increase in DON levels under warmed conditions. Traits such as FDK and DON are very important in selecting for FHB resistance since they quantify visually and chemically the level of infection. These traits express phenotypically the effects of resistant QTL such as Fhb1. Heritability estimates are important in guiding the breeder during selection. The high repeatability values across both environments for FDK and DON are encouraging for selection in a warmed environment (Table 5).
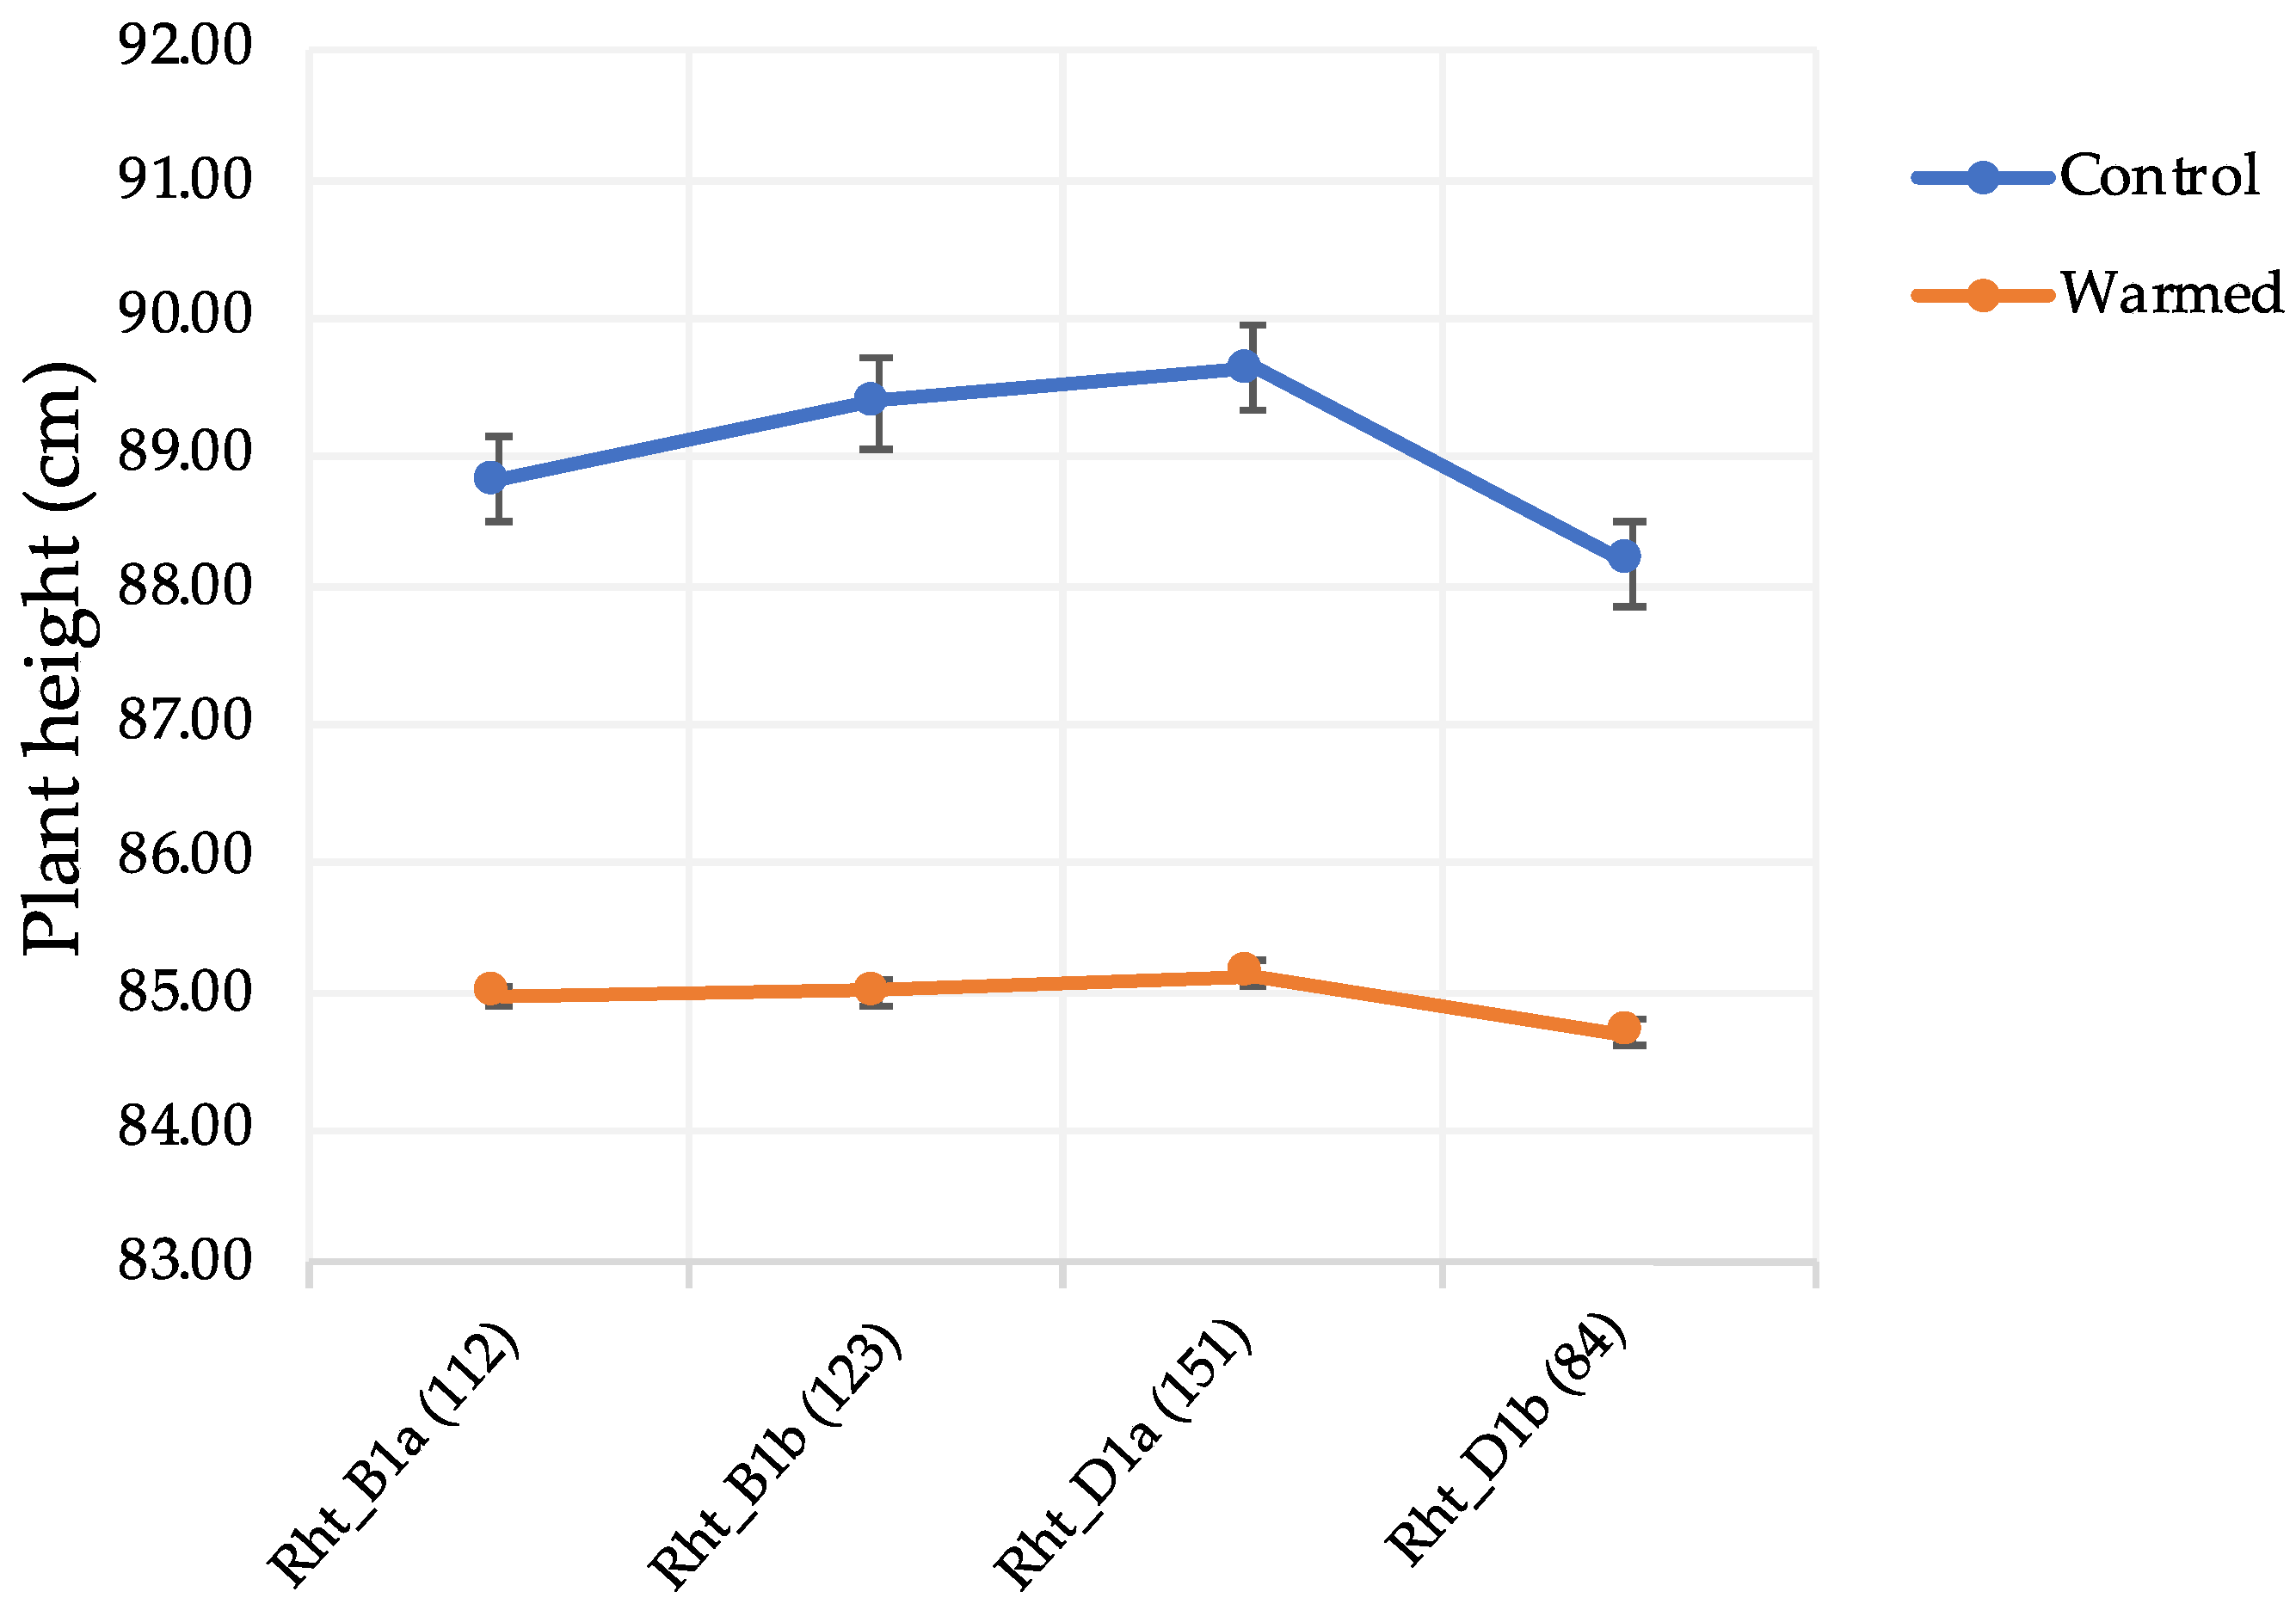
The semi-dwarfing genes (Rht_B1 and Rht_D1) had an effect on FDK and DON under warmed conditions. A total of 123 lines had Rht_B1b (the height reducing allele) in their background. Disease levels for those lines, increased by ~129% and 50% for FDK and DON, respectively, under warmed conditions. Genotypes with Rht_D1b also showed increased disease levels of ~112% for FDK and ~78% for DON in the warmed treatment (Table 7). Similar results were observed for tall plants with the wild-type alleles (Rht_B1a and Rht_D1a) where the disease increased under warmed conditions (Table 7). The literature suggests that taller genotypes could maintain a cooler canopy in environments with increased temperatures [46]. A correlation between increased plant height and reduced FHB is reported in numerous studies [47,48,49]. In one study, the investigators showed that plants with Rht-B1b and Rht_D1b significantly decreased resistance to initial infection (Type 1) and Rht_B1b increased resistance to spread of the fungus [42]. Under control conditions, in our study, we observed increased disease when the height reducing alleles were present at these QTL. However, the warmed treatment more than doubled the disease rates independent of the allele present (Table 7). A warmer rhizosphere changed plant morphology by shortening the genotypes which could have favored increased disease levels (Figure 2). Short plants have higher disease levels due to the microclimate around the spike where high moisture and humidity and close proximity to the inoculum are favorable for increased disease [50]. Yan et al. [51] demonstrated this result by studying near-isogenic lines for Rht genes. His group observed that tall plants were more resistant to infection (type I) than the semi-dwarf phenotypes, however when both phenotypes were at the same height that difference disappeared [51].
Wheat is cultivated in a wide range of environments due to its vernalization and photoperiod genes. A prerequisite for winter wheat is the accumulation of cold temperature which may be affected by climate change in that warm winters will be more frequent. Vernalization requirements are controlled by Vrn genes and specific environmental conditions are needed for the activation of these genes [52,53]. Zheng et al. [54] studied the rates of climate change in Australia; they suggested an earlier sowing to escape frost and heat stresses. In addition to earlier sowing, longer season varieties have been proposed as a strategy to adapt to future climate change [54,55]. However, longer season varieties in an environment with a high level of disease pressure could increase FHB rates due to increased exposure to the pathogen. Meteorological factors such as wet and warm environments are essential for pathogen development and whether or not such factors will occur in a specific region is difficult to predict [13]. In this study, we found that plants with vrn_A1 had 123% more FDK and 60% more DON under warmed conditions (Table 7). Similar results were observed for vrn_B1 with vales of 122% for FDK and 62% for DON. In addition, FDK and DON had increases of 120% and 66%, respectively, for vrn_D3. An analysis of heading date showed that plants under warmed conditions headed earlier than the control (Table 1). This suggests that plants were exposed earlier to the pathogen increasing the period for disease, which could explain the increased disease levels found in this study.
Photoperiod (Ppd) genes are another important major gene for the transition from vegetative stage to reproductive stage in plants [56]. In photoperiod response, the dominant allele confers flowering under short day-length through photoperiod insensitivity [57]. After vernalization requirements are met, plants with photoperiod insensitivity will shift to the reproductive stage when temperatures increase, while for photoperiod sensitive plants, a long day is also needed [56]. In the warmed treatment genotypes had an earlier flowering period when compared with the control (Table 1). An increase in disease levels in the warmed treatment was observed, ranging from 109 to 135% for FDK and from 60 to 65% for DON in the genotypes classified in sensitive and insensitive photoperiod (Table 7). An earlier heading period favored disease development since the pathogen was present and wet conditions prevailed in the environment. Therefore, a late heading type, characterized by Ppd sensitivity, probably would not avoid disease in a warmer environment.
The ultimate goal in breeding programs is to develop cultivars with high yield performance and adaptability to multiple environments. Screening for agronomic as well as disease resistance traits is fundamental for the selection of superior genotypes. Future projections of increasing temperature add another degree of complexity to selection. Disease evaluations are complex and highly dependent on environmental conditions. Changes in temperature and rainfall patterns can potentially influence levels of disease, with increased spore production and aggressiveness of the pathogen [13]. The design of experiments evaluating increases in temperature associated with disease pressure is critical for a better understanding of the genetics behind the phenotypic response. Moreover, the evaluation under warmed conditions of mycotoxin production such as DON is essential for food security.
The Food and Drug Administration (FDA, [58]) advisory level for DON in finished wheat products such as flour, bran and germ consumed by humans is 1 ppm. Therefore, it is extremely important to develop genotypes that have the ability to fight the infection caused by the pathogen either by morphological characteristics or by resistance QTL [40,49]. To assess the variation among cultivars and breeding lines for DON levels, we classified the genotypes in the warmed treatment for best and worst performance for DON levels and ranked them from one to two hundred and thirty-eight. After that, we determined how those genotypes performed in the control treatment and their rank order among the 238 genotypes (Table 8). Spearman’s rank correlation between warmed and control was 0.56, indicating a moderate correlation between genotype ranks in the two treatments.
The best fifteen performers under warmed conditions had, on average, 2.30 ppm DON with the lowest being 1.70 ppm and the highest 2.78 ppm (Table 8). Under control conditions, those genotypes had a similar response with 2.48 ppm of DON, on average. The best fifteen in the warmed treatment, had similar performance in the control treatment, with low DON levels. The exception was the genotype 0570A1-2-39-5, which had 135% more DON under control conditions than in the warmed treatment. The best four lines in the TCAP population had levels of DON below 2 ppm in the warmed treatment. Even though the best fifteen lines had DON levels above the FDA advisory level, those lines performed well under warmed conditions and could be indicated for use in breeding programs targeting disease resistance under climate change.
The worst fifteen performing genotypes for DON under warmed conditions and their respective performance under control conditions are presented in Table 8. The average DON level was 16.74 ppm under warmed conditions and 8.23 ppm under control conditions. DON levels varied from 14.18 to 24.83 ppm under warming and from 3.75 to 14.55 ppm in the control treatment. These results show the dramatic effect of a warmed treatment on genotypes that have low plasticity to an increase in temperature. Genotypes such as MD03W61-11-2 and BECKER had low levels of DON under control conditions; however, under warmed conditions these two lines showed increases of ~290 and 417%, respectively (Table 8). Similarly, the breeding line VA10W-140 had an increase of ~231% under warmed conditions when compared with its performance under control conditions. Some genotypes had high levels of DON in both treatments. For instance, the MO100535 and 03633A1-69-2-5 had 11.90 and 14.55 ppm under control conditions, respectively. Under warmed conditions, MO100535 had 14.58 ppm and 03633A1-69-2-5 had 19.27 ppm, an increase of ~23 and 32%, respectively. For OH08-149-11 and MD03W665-10-3, DON levels were 10.50 ppm and 10.85 ppm under control conditions, respectively. Under warmed conditions, OH08-149-11 and MD03W665-10-3, had 14.63 ppm and 15.23 ppm an increase of ~39 and 40%, respectively. These genotypes presented high levels of disease and thus would not be indicated for use in breeding programs irrespective of treatment.
As mentioned by Atlin et al. [59], breeding programs will play a fundamental role in adaptation to climate change, where favorable alleles to environmental stresses will need to be rapidly and constantly incorporated into breeding material to produce genotypes capable of adapting to the environment. Therefore, evaluating our current germplasm for disease resistance under warmed conditions is very important. An artificially warmed treatment can be efficient in screening the genotypes and providing valuable information regarding disease response. In the current study, we demonstrated that an increase in soil temperature of a few degrees resulted in earlier heading. As a consequence, disease levels were higher in the warmed treatment than in the control treatment. Our GWAS analysis identified 19 SNPs in the control treatment and 10 SNPs in the warmed treatment. These SNPs can be useful for selection under warmed conditions. We studied the effect of genotype at important QTL such as Fhb1, Rht, vrn and Ppd on disease levels in the population. While we did observe some differences between mutant and wild type alleles at certain loci (e.g., Rht-D1), the much greater difference in disease levels was observed between the warmed and control treatments, independent of the allelic form present. Evaluation of cultivar/breeding line performance under warmed conditions showed that the superior genotypes under control conditions were often the best performers in the warmed treatment. There were exceptions to this trend, however. For example, KY02C-2215-02, 0570A1-2-39-5, 0513A1-1-3 ranked highly for DON under warming but slipped to ranks 51, 186 and 57 in the control treatment (Table 8). Falconer [60] showed that for indirect selection to be superior to direct selection, the genetic correlation must be high and heritability of the trait to be selected must exceed that of the other trait. Using phenotypic correlation as a proxy for genetic correlation and taking the square root of the reliability estimates allows us to estimate Q, the ratio of indirect to direct selection which is expressed as the product of the genetic correlation coefficient and the ratio of the square roots of the heritabilities (e.g., Q = rg × h1/h2; [60]). In this instance rp = 0.58, h1 = 0.84 and h2 = 0.86 which leads to a product of 0.56, which is less than 1 and clearly does not support indirect selection under control conditions for performance under warming.
These findings, coupled with moderate to high reliability estimates suggest that breeding for disease resistance in a warming treatment should be possible. The active warming method described herein should provide breeders with a tool to pursue this breeding objective.

Supplementary Materials

The following are available online at https://www.mdpi.com/2073-4395/8/5/68/s1, Figure S1: Monthly average of soil temperature in warmed and control treatments from temperature probes placed at a depth of 10 cm below the ground. Temperatures were collected daily every 15 min, 2016 (a) and 2017 (b) at Lexington, KY.

Author Contributions

E.W.T. and D.A.V.S. conceived and designed the experiments; E.W.T. performed the experiments; E.W.T. and D.A.V.S. analyzed the data; E.W.T. wrote the paper.

Acknowledgments

This work was funded by grants from USDA Triticeae Coordinate Agricultural Project, N 59-0206-4-002 and the U.S. Department of Agriculture, through the US Wheat and Barley Scab Initiative under Agreement No. 59-0206-9-054. We thank Kathleen Russell, John Connelley and Sandy Swanson for technical assistance.

Conflicts of Interest

The authors declare no conflict of interest. The funding sponsors had no role in the design of the study; in the collection, analyses, or interpretation of data; in the writing of the manuscript and in the decision to publish the results.

References

  1. Borlaug, N.E.; Dowswell, C.R. Feeding a world of ten billion people: A 21st century challenge. In Proceedings of the International Congress “In the Wake of the Double Helix: From the Green Revolution to the Gene Revolution”, Bologna, Italy, 27–31 May 2013. [Google Scholar]
  2. Ray, D.K.; Mueller, N.D.; West, P.C.; Foley, J.A. Yield trends are insufficient to double global crop production by 2050. PLoS ONE 2013, 8, e66428. [Google Scholar] [CrossRef]
  3. Intergovernmental Panel on Climate Change (IPCC). Synthesis Report. Contribution of Working Groups I, II, and III to the Fourth Assessment Report of the Intergovernmental Panel on Climate Change; Core Writing Team, Pachauri, R.K., Meyer, L.A., Eds.; IPCC: Geneva, Switzerland, 2014. [Google Scholar]
  4. Zhao, C.; Liu, B.; Piao, S.; Wang, X.; Lobell, D.B.; Huang, Y.; Huang, M.; Yao, Y.; Bassu, S.; Ciais, P.; et al. Temperature increase reduces global yield of major crops in four independent estimates. PNAS 2017, 114, 9326–9331. [Google Scholar] [CrossRef] [PubMed]
  5. Lesk, C.; Rowhani, P.; Ramankutty, N. Influence of extreme weather disasters on global crop production. Nature 2016, 529, 84–87. [Google Scholar] [CrossRef] [PubMed]
  6. Tack, J.; Barkley, A.; Nalley, L.L. Effect of warming temperatures on US wheat yields. PNAS 2015, 112, 6931–6936. [Google Scholar] [CrossRef] [PubMed]
  7. Patil, R.H.; Laegdsmand, M.; Olesen, J.E.; Porter, J.R. Growth and yield response of winter wheat to soil warming and rainfall patterns. J. Agric. Sci. 2010, 148, 553–566. [Google Scholar] [CrossRef]
  8. Högy, P.; Poll, C.; Marhan, S.; Kandeler, E.; Fangmeier, A. Impacts of temperature increase and change in precipitation pattern on crop yield quality of barley. Food Chem. 2013, 136, 1470–1477. [Google Scholar] [CrossRef] [PubMed]
  9. Audenaert, K.; Vanheule, A.; Höfte, M.; Haesaert, G. Deoxynivalenol: A major player in the multifaceted response of Fusarium to its environment. Toxins 2013, 6, 1–19. [Google Scholar] [CrossRef] [PubMed]
  10. Backhouse, D. Global distribution of Fusarium graminearum, F. asiaticum and F. boothii from wheat in relation to climate. Eur. J. Plant Pathol. 2014, 139, 161–173. [Google Scholar] [CrossRef]
  11. Fels-Klerx, H.J.; Olesen, J.E.; Madsen, M.S.; Goedhart, P.W. Climate change increases deoxynivalenol contamination of wheat in north-western Europe. Food Addit. Contam. Part A 2012, 29, 1593–1604. [Google Scholar] [CrossRef] [PubMed]
  12. Kugler, K.G.; Siegwart, G.; Nussbaumer, T.; Ametz, C.; Spannagl, M.; Steiner, B.; Lemmens, M.; Mayer, K.F.X.; Buerstmayr, H.; Schweiger, W. Quantitative trait loci-independent analysis of a gene co-expression network associated with Fusarium head blight resistance in bread wheat (Triticum aestivum L.). BMC Genom. 2013, 14, 1–15. [Google Scholar] [CrossRef] [PubMed]
  13. Vaughan, M.; Backhouse, D.; Del Ponte, E.M. Climate change impacts on the ecology of Fusarium graminearum species complex and susceptibility of wheat to Fusarium head blight: A review. World Mycotoxin J. 2016, 9, 685–700. [Google Scholar] [CrossRef]
  14. Cowger, C.; Weisz, R.; Arellano, C.; Murphy, P. Profitability of integrated management of Fusarium head blight in North Caroline winter wheat. Am. Phytopathol. Soc. 2016, 106, 814–823. [Google Scholar] [CrossRef] [PubMed]
  15. Zhuang, Y.; Gala, A.; Yen, Y. Identification of functional genic components of major Fusarium head blight resistance quantitative trait loci in wheat cultivar Sumai 3. Mol. Plant-Microbe Interact. 2013, 26, 442–450. [Google Scholar] [CrossRef] [PubMed]
  16. Clark, A.J.; Sarti-Dvorjak, D.; Brown-Guedira, G.; Dong, Y.; Baik, B.-K.; Van Sanford, D.A. Identifying rare FHD-resistant segregants in intransigent backcross and F2 winter wheat populations. Front. Microbiol. 2016, 7, 1–14. [Google Scholar] [CrossRef]
  17. Buerstmayr, H.; Lemmens, M.; Hartl, L.; Doldi, L.; Steiner, B.; Stierschneider, M.; Ruckenbauer, P. Molecular mapping of QTLs for Fusarium head blight resistance in spring wheat. I. Resistance to fungal spread (Type II resistance). Theor. Appl. Genet. 2002, 104, 84–91. [Google Scholar] [CrossRef] [PubMed]
  18. Buerstmayr, H.; Steiner, B.; Hartl, L.; Griesser, M.; Angerer, N.; Lengauer, D.; Miedaner, T.; Schneider, B.; Lemmens, M. Molecular mapping of QTLs for Fusarium head blight resistance in spring wheat. II. Resistance to fungal penetration and spread. Theor. Appl. Genet. 2003, 107, 503–508. [Google Scholar] [CrossRef] [PubMed]
  19. Rawat, N.; Pumphrey, M.O.; Liu, S.; Zhang, X.; Tiwari, V.K.; Ando, K.; Trick, H.N.; Bockus, W.W.; Akhunov, E.; Anderson, J.A.; et al. Wheat Fhb1 encodes a chimeric lectin with agglutinin domains and a pore-forming toxin-like domain conferring resistance to Fusarium head blight. Nat. Genet. 2016, 48, 1576–1580. [Google Scholar] [CrossRef] [PubMed]
  20. Machado, A.K.; Brown, N.A.; Urban, M.; Kanyuka, K.; Hammond-Kosack, K.E. RNAi as an emerging approach to control Fusarium head blight disease and mycotoxin contamination in cereals. Soc. Chem. Ind. 2017, 74, 790–799. [Google Scholar] [CrossRef]
  21. Skelsey, P.; Newton, A.C. Future environmental and geographic risks of Fusarium head blight of wheat in Scotland. Eur. J. Plant Pathol. 2015, 142, 133–147. [Google Scholar] [CrossRef]
  22. Fels-Klerx, H.J.V.; Liu, C.; Battilani, P. Modelling climate change impacts on mycotoxin contamination. World Mycotoxin J. 2016, 9, 717–726. [Google Scholar] [CrossRef]
  23. Hitz, K. Breeding for Nitrogen Use Efficiency in Soft Red Winter Wheat. Master’s Thesis, University of Kentucky, Lexington, KY, USA, 2015. [Google Scholar]
  24. Russell, K. Genotype × Environment × Management: Implications for Selection to Heat Stress Tolerance and Nitrogen Use Efficiency in Soft Red Winter Wheat. Ph.D. Thesis, University of Kentucky, Lexington, KY, USA, 2017. [Google Scholar]
  25. Balut, A.L.; Clark, A.J.; Brown-Guedira, G.; Souza, E.; Van Sanford, D.A. Validation of Fhb1 and QFhs. nau-2DL in several soft read winter wheat population. Crop Sci. 2013, 53, 934–945. [Google Scholar] [CrossRef]
  26. Mirocha, C.J.; Kolaczkowski, E.; Xie, W.; Yu, H.; Jelen, H. Analysis of deoxynivalenol and its derivatives (batch and single) using gas chromatography/mass spectrometry. J. Agric. Food Chem. 1998, 46, 1414–1418. [Google Scholar] [CrossRef]
  27. SAS Institute. The SAS System for WindowsTM, Release 9.3; SAS Institute Inc.: Cary, NC, USA, 2011. [Google Scholar]
  28. Knapp, S.J.; Stroup, W.W.; Ross, W.M. Exact confidence intervals for heritability on a progeny mean basis. Crop Sci. 1985, 25, 192–195. [Google Scholar] [CrossRef]
  29. Holland, J.B.; Nvquist, W.E.; Cervantes-Martínez, C.T. Estimating and interpreting heritability for plant breeding: An update. Plant Breed. Rev. 2003, 22, 9–112. [Google Scholar]
  30. Lipka, A.E.; Tian, F.; Wang, Q.; Peiffer, J.; Li, M.; Bradbury, P.J.; Gore, M.A.; Buckler, E.S.; Zhang, Z. GAPIT: Genome association and prediction integrated tool. Bioinformatics 2012, 28, 2397–2399. [Google Scholar] [CrossRef] [PubMed]
  31. Hall, M.D.; Van Sanford, D.A. Diallel analysis of Fusarium head blight resistance in soft red winter wheat. Crop Sci. 2003, 43, 1663–1670. [Google Scholar] [CrossRef]
  32. Hou, R.; Ouyang, Z.; Li, Y.; Wilson, G.V.; Li, H. Is the change of winter wheat yield under warming caused by shortened reproductive period? Ecol. Evol. 2012, 2, 2999–3008. [Google Scholar] [CrossRef] [PubMed]
  33. Tian, Y.; Zheng, C.; Chen, J.; Chen, C.; Deng, A.; Song, Z.; Zhang, B.; Zhang, W. Climatic warming increases winter wheat yield but reduces grain nitrogen concentration in east China. PLoS ONE 2014, 9, e95108. [Google Scholar] [CrossRef]
  34. Liu, B.; Asseng, S.; Müller, C.; Ewert, F.; Elliott, J.; Lobell, D.B.; Martre, P.; Ruane, A.C.; Wallach, D.; Jones, J.W.; et al. Similar estimates of temperature impacts on global wheat yield by three independent methods. Nat. Clim. Chang. 2016. [Google Scholar] [CrossRef]
  35. Li, X.; Jiang, D.; Liu, F. Soil warming enhances the hidden shift of elemental stoichiometry by elevated CO2 in wheat. Sci. Rep. 2016, 6, 1–10. [Google Scholar] [CrossRef]
  36. Lee, S.J.; Ban, S.H.; Kim, G.H.; Kwon, S., II; Kim, J.H.; Choi, C. Identification of potential gene-associated major traits using GBS-GWAS for Korean apple germplasm collections. Plant Breed. 2017, 1–10. [Google Scholar] [CrossRef]
  37. Ogbonnaya, F.C.; Rasheed, A.; Okechukwu, E.C.; Jighly, A.; Makdis, F.; Wuletaw, T.; Hagras, A.; Uguru, M.I.; Agbo, C.U. Genome-wide association study for agronomic and physiological traits in spring wheat evaluated in a range of heat prone environments. Theor. Appl. Genet. 2017, 130, 1819–1835. [Google Scholar] [CrossRef] [PubMed]
  38. George, A.W.; Cavanagh, C. Genome wide association mapping in plants. Theor. Appl. Genet. 2015, 128, 1163–1174. [Google Scholar] [CrossRef] [PubMed]
  39. Arruda, M.P.; Brown, P.; Brown-Guedira, G.; Krill, A.M.; Thurber, C.; Merrill, K.R.; Foresman, B.J.; Kolb, F.L. Genome-wide association mapping of Fusarium head blight resistance in wheat using genotyping-by-sequencing. Plant Genome 2016, 9, 1–14. [Google Scholar] [CrossRef] [PubMed]
  40. Buerstmayr, H.; Ban, T.; Anderson, J.A. QTL mapping and marker-assisted selection for Fusarium head blight resistance in wheat: A review. Plant Breed. 2009, 128, 1–26. [Google Scholar] [CrossRef]
  41. Cai, J.; Wang, S.; Li, T.; Zhang, G.; Bai, G. Multiple minor QTLs are responsible for Fusarium head blight resistance in Chinese wheat landrace Haiyanzhong. PLoS ONE 2016, 11, e0163292. [Google Scholar] [CrossRef] [PubMed]
  42. Srinivasachary; Gosman, N.; Steed, A.; Hollins, T.W.; Bayles, R.; Jennings, P.; Nicholson, P. Semi-dwarfing Rht-B1 and Rht-D1 loci of wheat differ significantly in their influence on resistance to Fusarium head blight. Theor. Appl. Genet. 2009, 118, 695–702. [Google Scholar] [CrossRef] [PubMed]
  43. Robertson, A. The nature of quantitative genetic variation. In Heritage from Mendel; Brink, A., Ed.; University of Wisconsin: Madison, WI, USA, 1967; pp. 265–280. [Google Scholar]
  44. Massman, J.; Cooper, B.; Horley, R.; Neate, S.; Dill-Macky, R.; Chao, S.; Dong, Y.; Schwarz, P.; Muehlbauer, G.J.; Smith, K.P. Genome-wide association mapping of Fusarium head blight resistance in contemporary barley breeding germplasm. Mol. Breed. 2011, 27, 439–454. [Google Scholar] [CrossRef]
  45. Steiner, B.; Buerstmayr, M.; Michel, S.; Schweiger, W.; Lemmens, M.; Buerstmayr, H. Breeding strategies and advances in line selection for Fusarium head blight resistance in wheat. Trop. Plant Pathol. 2017, 42, 165–174. [Google Scholar] [CrossRef]
  46. Pask, A.; Joshi, A.K.; Manès, Y.; Sharma, I.; Chatrath, R.; Singh, G.P.; Sohu, V.S.; Mavi, G.S.; Sakuru, V.S.P.; Kalappanavar, I.K.; et al. A wheat phenotyping network to incorporate physiological traits for climate change in South Asia. Field Crops Res. 2014, 168, 156–167. [Google Scholar] [CrossRef]
  47. Buerstmayr, M.; Lemmens, M.; Steiner, B.; Buerstmayr, H. Advanced backcross QTL mapping of resistance to Fusarium head blight and plant morphological traits in a Triticum mocha × T. aestivum population. Theor. Appl. Genet. 2011, 123, 293–306. [Google Scholar] [CrossRef] [PubMed]
  48. Mao, S.-L.; Wei, Y.-M.; Cao, W.; Lan, X.-J.; Yu, M.; Chen, Z.-M.; Chen, G.-Y.; Zheng, Y.-L. Confirmation of the relationship between plant height and Fusarium head blight resistance in wheat (Triticum aestivum L.) by QTL meta-analysis. Euphytica 2010, 174, 343–356. [Google Scholar] [CrossRef]
  49. Lu, Q.; Lillemo, M.; Skinnes, H.; He, X.; Shi, J.; Ji, F.; Dong, Y.; Bjornstad, A. Anther extrusion and plant height are associated with Type I resistance to Fusarium head blight in bread wheat line ‘Shanghai-3/Catbird’. Theor. Appl. Genet. 2013, 126, 317–334. [Google Scholar] [CrossRef] [PubMed]
  50. Klahr, A.; Zimmermann, G.; Wenzel, G.; Mohler, V. Effects of environment, disease progress, plant height and heading date on the detection of QTLs for resistance to Fusarium head blight in an European winter wheat cross. Euphytica 2007, 154, 17–28. [Google Scholar] [CrossRef]
  51. Yan, W.; Li, H.B.; Cai, S.B.; Ma, H.X.; Rebetzke, G.J.; Liu, C.J. Effects of plant height on type I and type II resistance to fusarium head blight in wheat. Plant Pathol. 2011, 60, 506–512. [Google Scholar] [CrossRef]
  52. Allard, V.; Veisz, O.; Koszegi, B.; Rousset, M.; Gouis, J.L.; Martre, P. The quantitative response of wheat vernalization to environmental variables indicates that vernalization is not a response to cold temperature. J. Exp. Bot. 2012, 63, 847–857. [Google Scholar] [CrossRef] [PubMed]
  53. Wu, X.; Liu, H.; Li, X.; Tian, Y.; Mahecha, M.D. Response of winter wheat yields to warming-mediated vernalization variations across temperature Europe. Front. Ecol. Evol. 2017, 5, 1–10. [Google Scholar] [CrossRef]
  54. Zheng, B.; Chenu, K.; Dreccer, M.F.; Chapman, S.C. Breeding for the future: What are the potential impacts of future frost and heat events on sowing and flowering time requirements for Australian bread wheat (Triticum aestivum) varieties? Glob. Chang. Biol. 2012, 18, 2899–2914. [Google Scholar] [CrossRef] [PubMed]
  55. Zheng, B.; Chenu, K.; Chapman, S.C. Velocity of temperature and flowering time in wheat—Assisting breeder to keep pace with climate change. Glob. Chang. Biol. 2016, 22, 921–933. [Google Scholar] [CrossRef] [PubMed]
  56. Guedira, M.; Xiong, M.; Hao, Y.F.; Johnson, J.; Harrison, S.; Marshall, D.; Brown-Guedira, G. Heading date QTL in winter wheat (Triticum aestivum L.) coincide with major developmental genes VERNALIZATION1 and PHOTOPERIOD1. PLoS ONE 2016, 11, e0154242. [Google Scholar] [CrossRef] [PubMed]
  57. Griffths, S.; Simmonds, J.; Leverington, M.; Wang, Y.; Fish, L.; Sayers, L.; Alibert, L.; Orford, S.; Wingen, L.; Herry, L.; et al. Meta-QTL analysis of the genetic control of ear emergence in elite European winter wheat germplasm. Theor. Appl. Genet. 2009, 119, 383–395. [Google Scholar] [CrossRef] [PubMed]
  58. The Food and Drug Administration. Available online: https://www.fda.gov/food/guidanceregulation/guidancedocumentsregulatoryinformation/ucm120184.htm (accessed on 5 January 2018).
  59. Atlin, G.N.; Cairns, J.E.; Das, B. Rapid breeding and varietal replacement are critical to adaptation of cropping systems in the developing world to climate change. Glob. Food Secur. 2017, 12, 31–37. [Google Scholar] [CrossRef] [PubMed]
  60. Falcone, D.S. Introduction to Quantitative Genetics, 1st ed.; Ronald Press: New York, NY, USA, 1960. [Google Scholar]
Figure 1. Manhattan plots of genome-wide association study (GWAS) was performed for Fusarium damaged kernels (FDK), deoxynivalenol (DON), heading date (HD) and plant height (PH). GWAS results of 238 soft red winter wheat cultivars and breeding lines from the T-CAP panel grown in a control treatment and warmed treatment in Lexington, KY, 2017.
Agronomy 08 00068 g001
Figure 2. Allelic effects of dwarfing genes on plant height in control and warmed treatments, Lexington, KY, 2016–2017. Values in parentheses represent the number of genotypes that have the allele.
Agronomy 08 00068 g002
Table 1. Means of disease traits for the 2016–2017 study of 238 soft red winter wheat lines grown in a control and warmed treatments, Lexington, KY USA. Below the means, mean squares and level of significance for treatment (T), genotype (G), treatment × genotype (T × G), year, year × genotype (Y × G) and year × treatment (Y × T) are shown for each trait evaluated.
HD 1Rating 2PH 3Yield 4DON 5FDK 6LBR 7PMR 8LRR 9
Control 2016122.67 A1.50 A72.83 A215.00 B
Warmed 2016119.14 B1.74 A73.56 A260.00 A
Control 2017114.21 A1.76 B89.62 A572.20 A4.01 B11.66 B3.18 B1.75 B2.36 A
Warmed 2017110.80 B2.31 A83.88 B537.80 B7.39 A26.98 A3.73 A2.13 A2.35 A
Treatment (T)5657.35 **60.38 ns2901.21 ns18.84 ns2678.49 *54,941.38 **73.77 **35.37 ns0.004 ns
Genotype (G)26.02 **2.54 **261.59 **91.06 **31.84 **289.86 **1.12 **3.02 **4.02 **
Year33,292.43 **61.16 **86,639.61 **1,119,898.21 **
T × G2.55 ns1.17 ns22.11 ns28.50 ns10.56 **84.42 **0.65 *0.62 ns1.14 **
Y × G4.92 ns2.02 ns30.55 ns44.35 ns
Y × T1.39 ns18.89 **4904.21 **1704.82 **
CV 101.5356.406.1026.0839.1128.8521.4944.0840.24
1 HD = heading date; 2 Rating = Fusarium head blight rating (1 to 9); 3 PH = plant height (cm); 4 (g m−2); 5 DON = deoxynivalenol (ppm); 6 FDK = Fusarium damaged kernel (%); 7 LBR = leaf blotch rating (1 to 9); 8 PMR = powdery mildew rating (1 to 9); 9 LRR = leaf rust rating (1 to 9); 10 CV = coefficient of variation; * p < 0.10; ** p < 0.05; ns = no significant.
Table 2. Pearson correlations among traits for control and warmed treatments in 2016 Lexington, KY. Control treatment above diagonal, warmed treatment below diagonal.
Control Treatment
HDRatingPHYield
Warmed TreatmentHD 0.02 ns0.19 **−0.09 ns
Rating0.11 *.−0.20 **−0.25 **
PH0.27 **−0.28 ** 0.53 **
Yield0.04 ns−0.28 **0.56 **
HD = heading date (Julian); Rating = Fusarium head blight rating (0 to 9); PH = plant height (cm); yield (g); *, **, ns significant at p ≤ 0.05, p ≤ 0.01 and no significant, respectively.
Table 3. Pearson correlations among traits for control and warmed treatments in 2017 Lexington, KY. Control treatment above diagonal, warmed treatment below diagonal.
Control Treatment
HDRatingPHYieldFDKDONLBRPMRLRR
Warmed TreatmentHD −0.02 ns0.35 **0.11 *0.03 ns0.18 **−0.10 *0.07 ns0.26 **
Rating0.51 ** −0.30 **−0.18 **0.40 **0.43 **0.18 **0.04 ns0.10 *
PH0.47 **0.07 ns 0.46 **−0.32 **−0.16 **0.10 *0.14 **0.27 **
Yield0.10 *0.01 ns0.47 ** −0.28 **−0.15 **0.01 ns0.06 ns0.08 ns
FDK0.01 ns0.38 **−0.26 **−0.22 ** 0.42 **−0.05 ns−0.02 ns−0.01 ns
DON0.11 *0.35 **−0.13 **−0.20 **0.57 ** −0.03 ns−0.01 ns0.06 ns
LBR−0.01 ns0.17 **0.13 **0.10 *0.02 ns0.07 ns 0.08 ns0.36 **
PMR−0.01 ns−0.01 ns0.16 **0.09 ns−0.12 **−0.07 ns0.14 ** 0.05 ns
LRR0.39 **0.26 **0.39 **0.10 *0.03 ns0.08 ns0.25 **0.03 ns
HD = heading date (Julian); Rating = Fusarium head blight rating (0 to 9); PH = plant height (cm); Yield (g); FDK = Fusarium damaged kernels (%); DON = deoxynivalenol (ppm); LBR = leaf blotch rating (1 to 9); PMR = powdery mildew rating (1 to 9); LRR = leaf rust rating (1 to 9); *, **, ns significant at p ≤ 0.05, p ≤ 0.01 and not significant, respectively.
Table 4. Broad sense heritability (h2) and 90% confidence interval (lower limit (LL) and upper limit (UL)) for traits evaluated in control and warmed treatments in 2016 and 2017, Lexington, KY.
Control TreatmentWarmed Treatment
Traith2LLUPh2LLUP
HD0.730.670.780.700.630.76
Rating0.230.060.380.13−0.070.29
PH0.810.770.850.800.750.84
Yield0.320.170.450.460.330.56
HD = heading date (Julian); Rating = Fusarium head blight rating (0 to 9); PH = plant height (cm); yield (g).
Table 5. Repeatability and 90% confidence interval (lower limit (LL) and upper limit (UL)) for traits evaluated in control and warmed treatments in 2017, Lexington, KY.
Control TreatmentWarmed Treatment
Traith2LLUPh2LLUP
FDK0.800.750.840.840.810.87
DON0.710.650.770.750.700.80
LBR0.390.240.500.350.200.47
PMR0.420.280.530.690.610.75
LRR0.580.480.650.700.630.75
FDK = Fusarium damaged kernels (%); DON = deoxynivalenol (ppm); LBR = leaf blotch rating (1 to 9); PMR = powdery mildew rating (1 to 9), LRR = leaf rust rating (1 to 9).
Table 6. GWAS of 238 soft red winter wheat lines grown in control and warmed treatments in Lexington, KY, 2017. Only SNPs with LOD score >3 are shown. Effect of SNPs is expressed in percent of the mean of each trait.
TraitTreat 1SNPChr. 2Positionp ValueEffect (%)R2 (w/o SNP)R2 (w/SNP)
FDK 3ControlM15631B250.980.000332.110.045580.10364
M25082A173.960.00052−2.320.045580.09960
M15911B255.130.000591.990.045580.09853
M62413B285.320.00072−1.820.045580.09693
M4801A256.000.000801.720.045580.09597
M19051B382.270.000872.400.045580.09523
M83135A311.790.00094−1.730.045580.09458
Warm-------
DON 4ControlM69594A356.780.00018−0.740.125350.18343
M15281B243.590.000320.870.125350.17884
M114236B375.210.00034−0.960.125350.17827
M98216A97.500.000900.630.125350.17065
M110466B226.640.000940.640.125350.17024
WarmM57443B224.480.000161.130.126510.18522
M57433B218.710.000740.940.126510.17323
M71504A564.640.001010.900.126510.17085
HD 5ControlM130207B433.394.84 × 10−50.620.053090.12743
M130447B458.560.000120.560.053090.11969
M72394A641.890.00018−0.550.053090.11587
M96095D61.480.00063−0.490.053090.10508
WarmM57483B226.995.19 × 10−5−0.780.065170.13794
M57583B231.850.00052−0.550.065170.11820
M21321D108.870.000650.660.065170.11627
M122947A456.600.000900.580.065170.11353
M122937A456.600.000970.570.065170.11292
M67083D414.710.001040.680.065170.11237
PH 6ControlM85845B62.861.37 × 10−52.410.031290.11890
M85775B61.070.000511.750.031290.08628
M92575B357.100.000752.130.031290.08302
WarmM85845B62.866.16 × 10−52.000.035370.10891
1 Treat = treatment; 2 Chr. = chromosome; 3 FDK = Fusarium damaged kernels; 4 DON = deoxynivalenol; 5 HD = heading date; 6 PH = plant height.
Table 7. Quantitative trait locus (QTL) effect on Fusarium damaged kernels (FDK) and deoxynivalenol (DON) lsmeans of 238 soft red winter wheat lines grown in control and warmed treatments, Lexington, KY, 2017.
Number of LinesFDKDON
QTLControlWarmedControlWarmed
Fhb1–S 121812.57B a27.76A a4.60B b7.75A a
Fhb1–R 21913.08B a29.87A a6.05A a7.18A a
Rht_B1a11213.28B a28.31A a5.02B a8.80A a
Rht_B1b12312.01B a27.56A a4.49B a6.75A b
Rht_D1a15111.94B b27.20A a4.39B b6.69A b
Rht_D1b8413.78B a29.18A a5.38B a9.57A a
vrn_A1_short1313.39B a26.51A a3.92B a8.67A a
vrn_A122512.53B a27.99A a4.77B a7.65A a
vrn_B1_short511.39A a19.59A a3.52A a6.33A a
vrn_B123012.60B a28.00A a4.75B a7.71A a
vrn_D3a_early7012.52B a28.06A a4.38B a6.75A b
vrn_D3b16512.68B a27.93A a4.89B a8.14A a
Ppd_A1_sensitive9412.20B a28.65A a5.07B a8.33A a
Ppd_A1_insensitive13812.92B a27.25A a4.53B a7.23A b
Ppd_B1_sensitive17512.48B a27.57A a4.77B a7.67A a
Ppd_B1_insensitive1913.72B a28.73A a5.14B a8.48A a
Ppd_D1_sensitive11212.36B a27.77A a4.53B a7.34A a
Ppd_D1_insensitive12312.73B a27.89A a4.85B a7.99A a
Means followed by the same capital letter in the row, for a given trait, do not differ (p ≤ 0.05) by t test; means followed by the same lower case in the column, for a given treatment, do not differ (p ≤ 0.05) by t test; 1 Fhb1–S = susceptible; 2 Fhb1–R = resistant.
Table 8. Deoxynivalenol (DON) concentration of soft red winter wheat breeding lines and cultivars in an artificially warmed treatment, Lexington, KY, 2017.
Best GenotypesWarmedControlWorst GenotypesWarmedControl
DONRankDONRankDONRankDONRank
07287RA1-141.7011.33207290A1-1214.182245.05149
OH08-207-331.8321.839MO10017214.382255.50167
05287A1-1-131.9032.2023SS52014.382264.55136
MO0816521.9342.4533MO10053514.5822711.90236
MO0816992.0351.693OH08-149-1114.6322810.50229
OH08-101-722.0863.2574D8006 14.982298.15219
CLARK2.3372.2525MD03W665-10-315.2323010.85233
MO0801042.3882.3730MD03W61-11-215.432313.95109
OH08-234-42.3891.786OH07-238-1515.882327.95217
IL08-340202.58102.0013SS520517.2323311.35234
KY02C-2215-022.58112.7551MD03W485-10-217.782349.25226
0570A1-2-39-52.58126.05186MO10051918.832358.65223
0513A1-1-32.63132.855703633A1-69-2-519.2723614.55237
IL02-19483B2.73142.5541BECKER19.382373.7596
IL06-137082.78151.9011VA10W-14024.832387.50210
Average2.30 2.48 Average16.74 8.23

