Article

Effect of Long-Term Continuous Fumigation on Soil Microbial Communities

1
United States Department of Agriculture (USDA), Agricultural Research Service, San Joaquin Valley Agricultural Sciences Center, 9611 S. Riverbend Ave., Parlier, CA 93648, USA
2
Department of Plant Sciences, University of California, Davis, One Shields Ave., Davis, CA 95616, USA
3
Agro-Environmental Sciences Department, University of Puerto Rico-Mayagüez, Box 9000, Mayagüez, PR 00681, USA
*
Author to whom correspondence should be addressed.
Agronomy 2017, 7(2), 37; https://doi.org/10.3390/agronomy7020037
Submission received: 14 March 2017 / Revised: 11 May 2017 / Accepted: 11 May 2017 / Published: 24 May 2017
(This article belongs to the Special Issue Soil Microbial Functional Groups and Plant Growth)

Abstract

:
High value crop producers in California rely heavily on soil fumigation to control a wide array of soil borne pests including nematodes, pathogens and weeds. Fumigants with broad biocidal activity can affect soil microbial communities that contribute to nutrient cycling and plant nutrient uptake which can impact soil health. It is often thought that soil microbial communities make a relatively rapid recovery following fumigation. However, recently it has been found that repeated application of fumigants over time can have greater and longer lasting impacts on soil microorganisms than single fumigation events. Therefore, the main objective of this study was to determine the effect of long-term repeated application of fumigants on soil microbial communities and compare them with non-fumigated and organic sites. Soil samples were collected from fields in Watsonville, CA. Chronosequence sites were defined by number of years of annual fumigation (yaf) with methyl bromide (15, 26, 33, 39 yaf) at the time of sampling, and representative non-fumigated sites were also included for comparison. Phospholipid fatty acid (PLFA) analysis was used to analyze the samples. The canonical variate analysis showed that microbial communities in sites with a longer history of fumigation (33 and 39 yaf) were similar to one another; however, they differed significantly from 15 yaf site and further analysis concluded that non-fumigated sites were significantly different than fumigated sites. This study showed that the proportion of arbuscular mycorrhizal fungi (AMF) was lower in all fumigated (15, 33 and 39 yaf) sites as compared to their non-fumigated counterparts, which could be a threat to sustainability since AMF plays a major role in soil health and quality.

1. Introduction

For over 50 years, California has been the US’s top agricultural state generating approximately $54 billion a year in farm-gate value [1]. California is one of the largest users of methyl bromide (MeBr) and other soil fumigants in the United States (US) [2]. Due to its deleterious effects on stratospheric ozone, the import and manufacture of MeBr has largely been phased out under the provisions of the U.S. Clean Air Act and the Montreal Protocol [3,4]. California strawberry producers have continued using MeBr under a critical use exemption subject to annual review by the parties of the Montreal Protocol [5]. In the US, 1,3-dichloropropene (1,3-D), chloropicrin, dimethyl disulfide (DMDS), and methyl isothiocyanate (MITC) have been proposed as the most likely chemical alternatives to MeBr [3,5,6]. Of these, DMDS is not currently registered in California.
To reduce the use of methyl bromide fumigation and alleviate its detrimental effects to the soil, rotation with cover crops has been recommended [7]. Cover crops grown in rotation with cash crops can alleviate the accumulation of weeds and pathogens in the soil, increase soil organic matter and improve soil physical, chemical, and biological properties [8]. Therefore, strawberry fields in California are rotated with cover crops such as rye and barley, or other cash crops; however, in areas where land and water costs are high, cover crops are not economically feasible.
Several short-term studies on the recovery of soil microbial communities in fumigated fields concluded that soil microbial communities make a relatively rapid recovery (less than a year) after the application of fumigants [9,10,11,12]. However, there are limited studies on the effect of long-term, repeated application of fumigants on soil microbial communities. Reeve et al. [13] proposed that long-term repeated application of fumigants can have significantly different and longer lasting impacts on soil microorganisms compared to single fumigation events.
It is important to study the effect of fumigants on soil microbial communities in regularly-fumigated fields, as soil microorganisms are crucial in sustaining long-term health of agricultural soil [9]. Hence, understanding the impact of fumigants on beneficial soil microbial communities is essential to help further preserve the health and sustainability of these fumigated lands. Therefore, the main objective of this study was to determine the effect of long-term annual application of fumigants (15, 26, 33 and 39 years of annual fumigation) on soil microbial communities and compare them with non-fumigated sites.

2. Materials and Methods

2.1. Study Area and Soil Sampling

The study was conducted in the Watsonville, California area (Table 1) which accounts for almost half of the state’s strawberry acreage. In California, fumigation with MeBr and chloropicrin became an integral part of strawberry cultivation around 1960 and, until recently, nearly all strawberry acres were fumigated with a mixture of both fumigants prior to planting [5]. The chronosequence selected for this study contained four sites defined by number of years of annual fumigation (yaf) with MeBr and chloropicrin. The sites were a strawberry field with 15 years of annual fumigation (15 yaf; 36°56′26.8″ N, 121°43′11.4″ W) with no crop rotation, a 26 yaf site where beans, peas or barley were rotated annually with strawberries, a 33 years of annual fumigation site where either barley, peas and beans were rotated with strawberries (33 yaf; 36°52′35.2″ N, 121°40′42.3″ W), two 39 yaf sites where strawberries were rotated with barley (39a; 36°54′15.01″ N, 121°49′30.4″ W and 39b yaf; 36°54′11.3″ N, 121°49′25.2″ W) every other year, and three representative non-fumigated (NF) sites. Two non-fumigated sites, NF-15 (36°56′26.8″ N, 121°43′11.4″ W) and NF-33 (36°52′24.06″ N, 121°41′31.05″ W) were vegetable gardens that had never been fumigated adjacent to the 15 yaf and 33 yaf sites. An organic strawberry farm established in 2006 adjacent to the 39a and 39b yaf sites which had been previously fumigated until 2002 and fallowed for 3 years to get organic certification (NF-39; 36°54′12.9″ N, 121°49′23.08″ W) was chosen as a non-fumigated control for 39 yaf sites. The soil texture at the 15 yaf, NF-15 and 26 yaf sites are clay loam while the 33 yaf, NF-33, 39a yaf, 39b yaf and NF-39 sites are sandy loam soils. Methyl bromide-fumigated and non-fumigated fields were selected across the Watsonville area on the basis of data provided by representatives from the fumigation industry and grower interviews.
Soil samples were collected in May 2013 from 0–5, 5–15 and 15–30 cm depths. Three 100 m transects were randomly placed at each site and soil samples were collected from four equally spaced points along the transects. Due to the difficulty in finding fumigated sites of the same age and the non-fumigated treatments, each transect was considered a replicate and the four sampling points were not composited. Samples for phospholipid fatty acids (PLFA) analysis were placed in sealed plastic bags, stored on dry ice immediately after collection, and then returned to the laboratory where they were placed in a −20 °C freezer until analyzed.

2.2. Soil Physicochemical Analysis

Soil pH was determined by using 1:1 soil to deionized water (DI) ratio. Dissolved organic carbon (DOC) was determined after saturating the soil with DI water (1:1 soil: water) for 24 h, shaken for 1 h on a reciprocal shaker, and filtered through a Whatman, no. 42 filter. Carbon recovered in the water extract was determined by using Fusion Total Organic Carbon Analyzer from Teledyne Tekmar. Total nitrogen (TN) and total carbon (TC) contents were determined by dry combustion with a Flash 2000 N & C Soil Analyzer (Thermo Scientific®, Pittsburgh, PA, USA). Macronutrients such as Ca, Mg, S, K and Na were determined using ICP-OES (Varian, Palo Alto, CA, USA).

2.3. Soil PLFA Analysis

Phospholipid fatty acids (PLFA) were extracted from 5 g soil samples using a modified Bligh-Dyer methodology [14]. Fatty acids were directly extracted from soil samples using a mixture of chloroform: methanol: phosphate buffer (1:2:0.8). Phospholipid fatty acids were separated from neutral and glycolipid fatty acids in a solid phase extraction column. After mild alkaline methanolysis, PLFA samples were qualitatively and quantitatively analyzed using an Agilent 6890 gas chromatograph (Agilent Technologies, Palo Alto, CA, USA) and fatty acids were identified using the MIDI PLFAD1 calibration mix and naming table [15], (MIDI Inc., Newark, NJ, USA).
Individual PLFA signatures were used to quantify the abundances of specific microbial groups in soil samples [15]. Gram + bacteria were identified and quantified by the presence of iso- and anteiso-branched fatty acids, Gram − bacteria with monounsaturated fatty acids and cyclopropyl 17:0 and 19:0, and eubacteria with 15:0, 17:0 cyclo, 19:0 cyclo, 15:1 iso, and 17:1 iso and 17:1 anteiso. Fungi were identified and quantified with 18:2 ω6c, arbuscular mycorrhizal fungi (AMF) with 16:1 ω5c, and actinomycetes with 10-methyl fatty acids [16]. As indicators of physiological or nutritional stress in bacterial communities, the ratio of saturated (SAT) and monounsaturated PLFAs were used in conjunction with the ratios of the sum of cyclopropyl PLFAs to the sum of their monoenoic precursors (cy 17:0 + cy 19:0)/(16:1ω7 + 18:1ω7; abbreviated as Cy/pre) [17].

2.4. Data Analysis

Two-way analysis of variance was used to analyze fumigation effects on soil chemical properties using SAS 9.4 [18]. Fatty acids were summed into biomarker groups according to [15]. The ANOVA was conducted on total PLFA and on each biomarker group to determine fumigation effects on the total microbial biomass and biomass of each group of organisms. Additionally, ANOVA (generalized linear model) using proc GLIMMIX and a link-logit function were conducted on the proportion of each biomarker. A multivariate method (canonical analysis) was used to compare soil microbial communities in fumigated and non-fumigated sites. In this analysis, MANOVA on the relative area of each biomarker was used to identify the linear combination of variables (referred to as canonical variates) that best separated soil microbial community structure at different treatments. The canonical variates were graphed to summarize group differences [19,20]. All statistical analyses were performed at the p < 0.05 significance level.

3. Results

3.1. Response of Carbon, Nitrogen and Macronutrients to Fumigation and Non-Fumigation

In order to understand the long-term repeated application of fumigants on soil properties, macronutrients, TC, TN, and DOC were determined (Table 2). Soil pH was lower in the fumigated 39b site as compared to other fumigated and non-fumigated sites (Table 2). Concentration of Ca was significantly higher in 39 yaf site compared to 33 and lowest in 15 and 26 yaf sites. Concentration of K, Mg and Na were significantly higher in NF-15 site and concentration of S was significantly higher in 39a and 39b yaf sites compared to other fumigated and non-fumigated sites where it remained similar to each other (Table 2). The DOC, TN and TC varied between fumigated and non-fumigated sites (Table 2). The DOC was higher in NF-15 and 15 yaf sites than fumigated 26, 33, 39a, 39b sites and non-fumigated 33 and 39 sites. Total N was higher in 15 yaf site than NF-15 site. Total C was significantly higher in NF-33 and 39b yaf sites.

3.2. Response of Soil Microbial Communities to Long-Term Fumigation and Non-Fumigation

Soil microbial community biomass represented by total PLFA was significantly (p < 0.05) higher in NF-33 site as compared to the fumigated 33 yaf site at the first 5 cm depth (Figure 1A). At the 5–15 cm depth, total PLFA in NF-33 site was higher than in fumigated 26, 39a, 39b and non-fumigated 39 sites; whereas at 15–30 cm depth, total microbial biomass in non-fumigated sites (33 and 15) was higher in comparison to 26 yaf site (Figure 1B,C).
The proportion of fungal PLFA was much higher in the 15 and 26 yaf sites than NF-15 site at 0–5 cm depth (Table 3). The AMF PLFA proportion was higher in all non-fumigated (NF-15, NF-33 and NF-39) sites as compared to their fumigated (15, 33 and 39 yaf) counterparts. Gram positive bacterial proportion was lower in NF-33 than 33 yaf, whereas Gram positive proportion was lower in the NF-15 site compared to 15 and 26 yaf sites. In addition, proportional levels of Gram negative and actinomycetes PLFA were higher in the NF-33 and the NF-15 sites compared to the 33 yaf and the 26 yaf sites. In the 5–15 cm depth, the 15 yaf site had significantly higher proportions of fungal PLFA than the NF-15 site (Table 4). Moreover, the amount of AMF was higher in the NF-15 site than in the 15 and 26 yaf sites. Proportional levels of Gram + and actinomycetes PLFAs were significantly higher in the NF-15 compared to the 15 yaf site, whereas eukaryotic PLFA was higher at the 15 yaf site compared to the 26 yaf site. At the 15–30 cm depth, significantly higher proportions of AMF in the NF-33 and the NF-15 sites than in the 33 and the 15 yaf sites were observed (Table 5). Also, actinomycetes proportions were higher in the 26 yaf site compared to the 15 yaf site.
At the 0–5 cm depth, the proportion of AMF PLFA was significantly lower in 33 yaf site as compared to fumigated 15, 26, 39a and 39b sites (Figure 2). Fungal PLFA in 15 and 26 yaf sites were significantly higher in proportion than 33 and 39 yaf sites. Additionally, the fungal PLFA proportion was higher in fumigated 39 yaf sites compared to the 33 yaf site. Gram + bacterial PLFA at the 33 yaf site was significantly higher than the 15, 26 and 39 yaf sites and Gram − bacterial PLFA was lower in 33 yaf site compared to 15 yaf site. No differences among locations were observed in the proportion of actinomycetes and eukaryotic biomarkers. At the 5–15 cm depth, the proportion of AMF PLFA was much higher in 26, 39a and 39b yaf sites than in 15 and 33 yaf sites (Figure 3). However, fungal biomarkers were significantly higher in the 15 yaf site than in 26, 33 and 39 yaf sites. No significant differences in proportion of Gram + and Gram − bacteria were detected. The 26 yaf field had higher proportional levels of actinomycetes biomarkers than 15 and 33 yaf fields. Moreover, lower eukaryotic biomarker proportions were detected in the 26 yaf site than 33, 39a and 39b sites. At the 15–30 cm depth, proportions of AMF, fungal, actinomycetes and eukaryotic PLFAs were lower in the 33 yaf site compared to other fumigated fields (Figure 4). Gram + bacterial proportion was significantly higher in the 26 yaf site compared to the 33 yaf site.

3.3. Microbial Community Structure

Canonical multivariate analysis of variance suggests that differences in the microbial communities in fumigated and non-fumigated sites are significantly (p < 0.05) different. However, similarities were observed among clay loam 15 and 26 yaf sites; while the older fumigated sandy loam 33, 39a and 39b yaf sites were also similar to each other. Similarities were observed among NF-15 and NF-39 sites. Moreover, the NF-33 and 15 yaf sites are distinct from one another as well as the other fumigated sites at 0–5 cm depth (Figure 5). At the 5–15 cm depth, differences between fumigated and non-fumigated sites remain significant; all the fumigated sites except 33 yaf site remained in a close proximity as compared to non-fumigated sites where differences were greater (Figure 3). At the deeper depth, the 33 yaf and NF-33 sites were distinct from all other fumigated and non-fumigated sites (Figure 4).
Discriminant analysis indicated that microbial community structure in the fumigated site was completely different than non-fumigated sites. Canonical variates one and two discriminated 33 yaf site vs. NF-33, 15 yaf vs. NF-15 and NF-39 vs. 39 yaf site at the three soil depths (Table 6). At the 0–5 cm depth, the 33 yaf site contained higher actinomycetes.
Physiological stress was determined using the ratios of saturated to monounsaturated (S/M) and the ratios of cyclopropyl PLFAs to their monoenoic precursors (cy/pre; Table 7). The S/M ratio was significantly greater for 15 yaf compared to NF-39 at 5–15 cm depth but not between other fumigated and non-fumigated sites at 0–5 and 5–15 cm depths. However, Cy/P ratio was significantly higher in the 15 yaf site compared to other fumigated and non-fumigated sites at 5–15 cm depth. Elevated levels of these indicate greater levels of microbial community stress in 15 years old fumigated sites at 5–15 cm depth.

4. Discussion

California is one of the largest users of MeBr and other soil fumigants in the US. To ensure better and more consistent crop yields and provide greater benefits to growers, soil fumigation has become an important agricultural practice. Therefore, producers of strawberries, tomatoes and other high value cash crops have been applying soil fumigants to control a wide array of target soil borne pests including nematodes, pathogens and weeds [21]. For example, California alone used 3550 tons of MeBr in 2004 before it was banned [22]. With the phase-out of MeBr because of its role in depleting stratospheric ozone, several alternatives have been used or in registration. However, the broad biocidal activity of fumigants and the continuous application can affect both target or harmful as well as non-target or beneficial soil organisms. Beneficial microorganisms are crucial in sustaining the health of agricultural soil by contributing to nutrient cycling, plant nutrient uptake, and agricultural productivity. This study helps to understand the effect of long-term repeated MeBr fumigation and early importance in studying the impact of alternative fumigants which will help to protect and create awareness among farmers on the importance of beneficial microorganisms.
Several short-term studies on the effect of soil microbial communities after fumigation have concluded that fumigation does not harm non-target soil microorganisms. Other studies have suggested there may be differences in deleterious and beneficial rhizosphere colonizers following fumigation in strawberry rhizosphere fumigated and non-fumigated soils [23]. A study by Ibekwe et al. [24] concluded that the lack of negative effects after fumigation may be due to the reduction in populations of plant pathogens and weeds, thus enhancing bacteria to rebound after the initial decline in population and use the available carbon sources for growth. Moreover, Ibekwe et al. [25] confirmed that MeBr has the greatest impact on soil microbial communities and that 1,3-D has the least impact. Therefore, whether it is a short-term or a long-term study, the residual effects of different fumigants on beneficial microorganisms are still unclear. Almost all of the studies conducted to investigate the effect of fumigants on soil microbial communities have focused on the short-term effect. In the present study, we have focused on the field sites where MeBr was applied annually for 15 years or every other year for 26, 33 and 39 years.
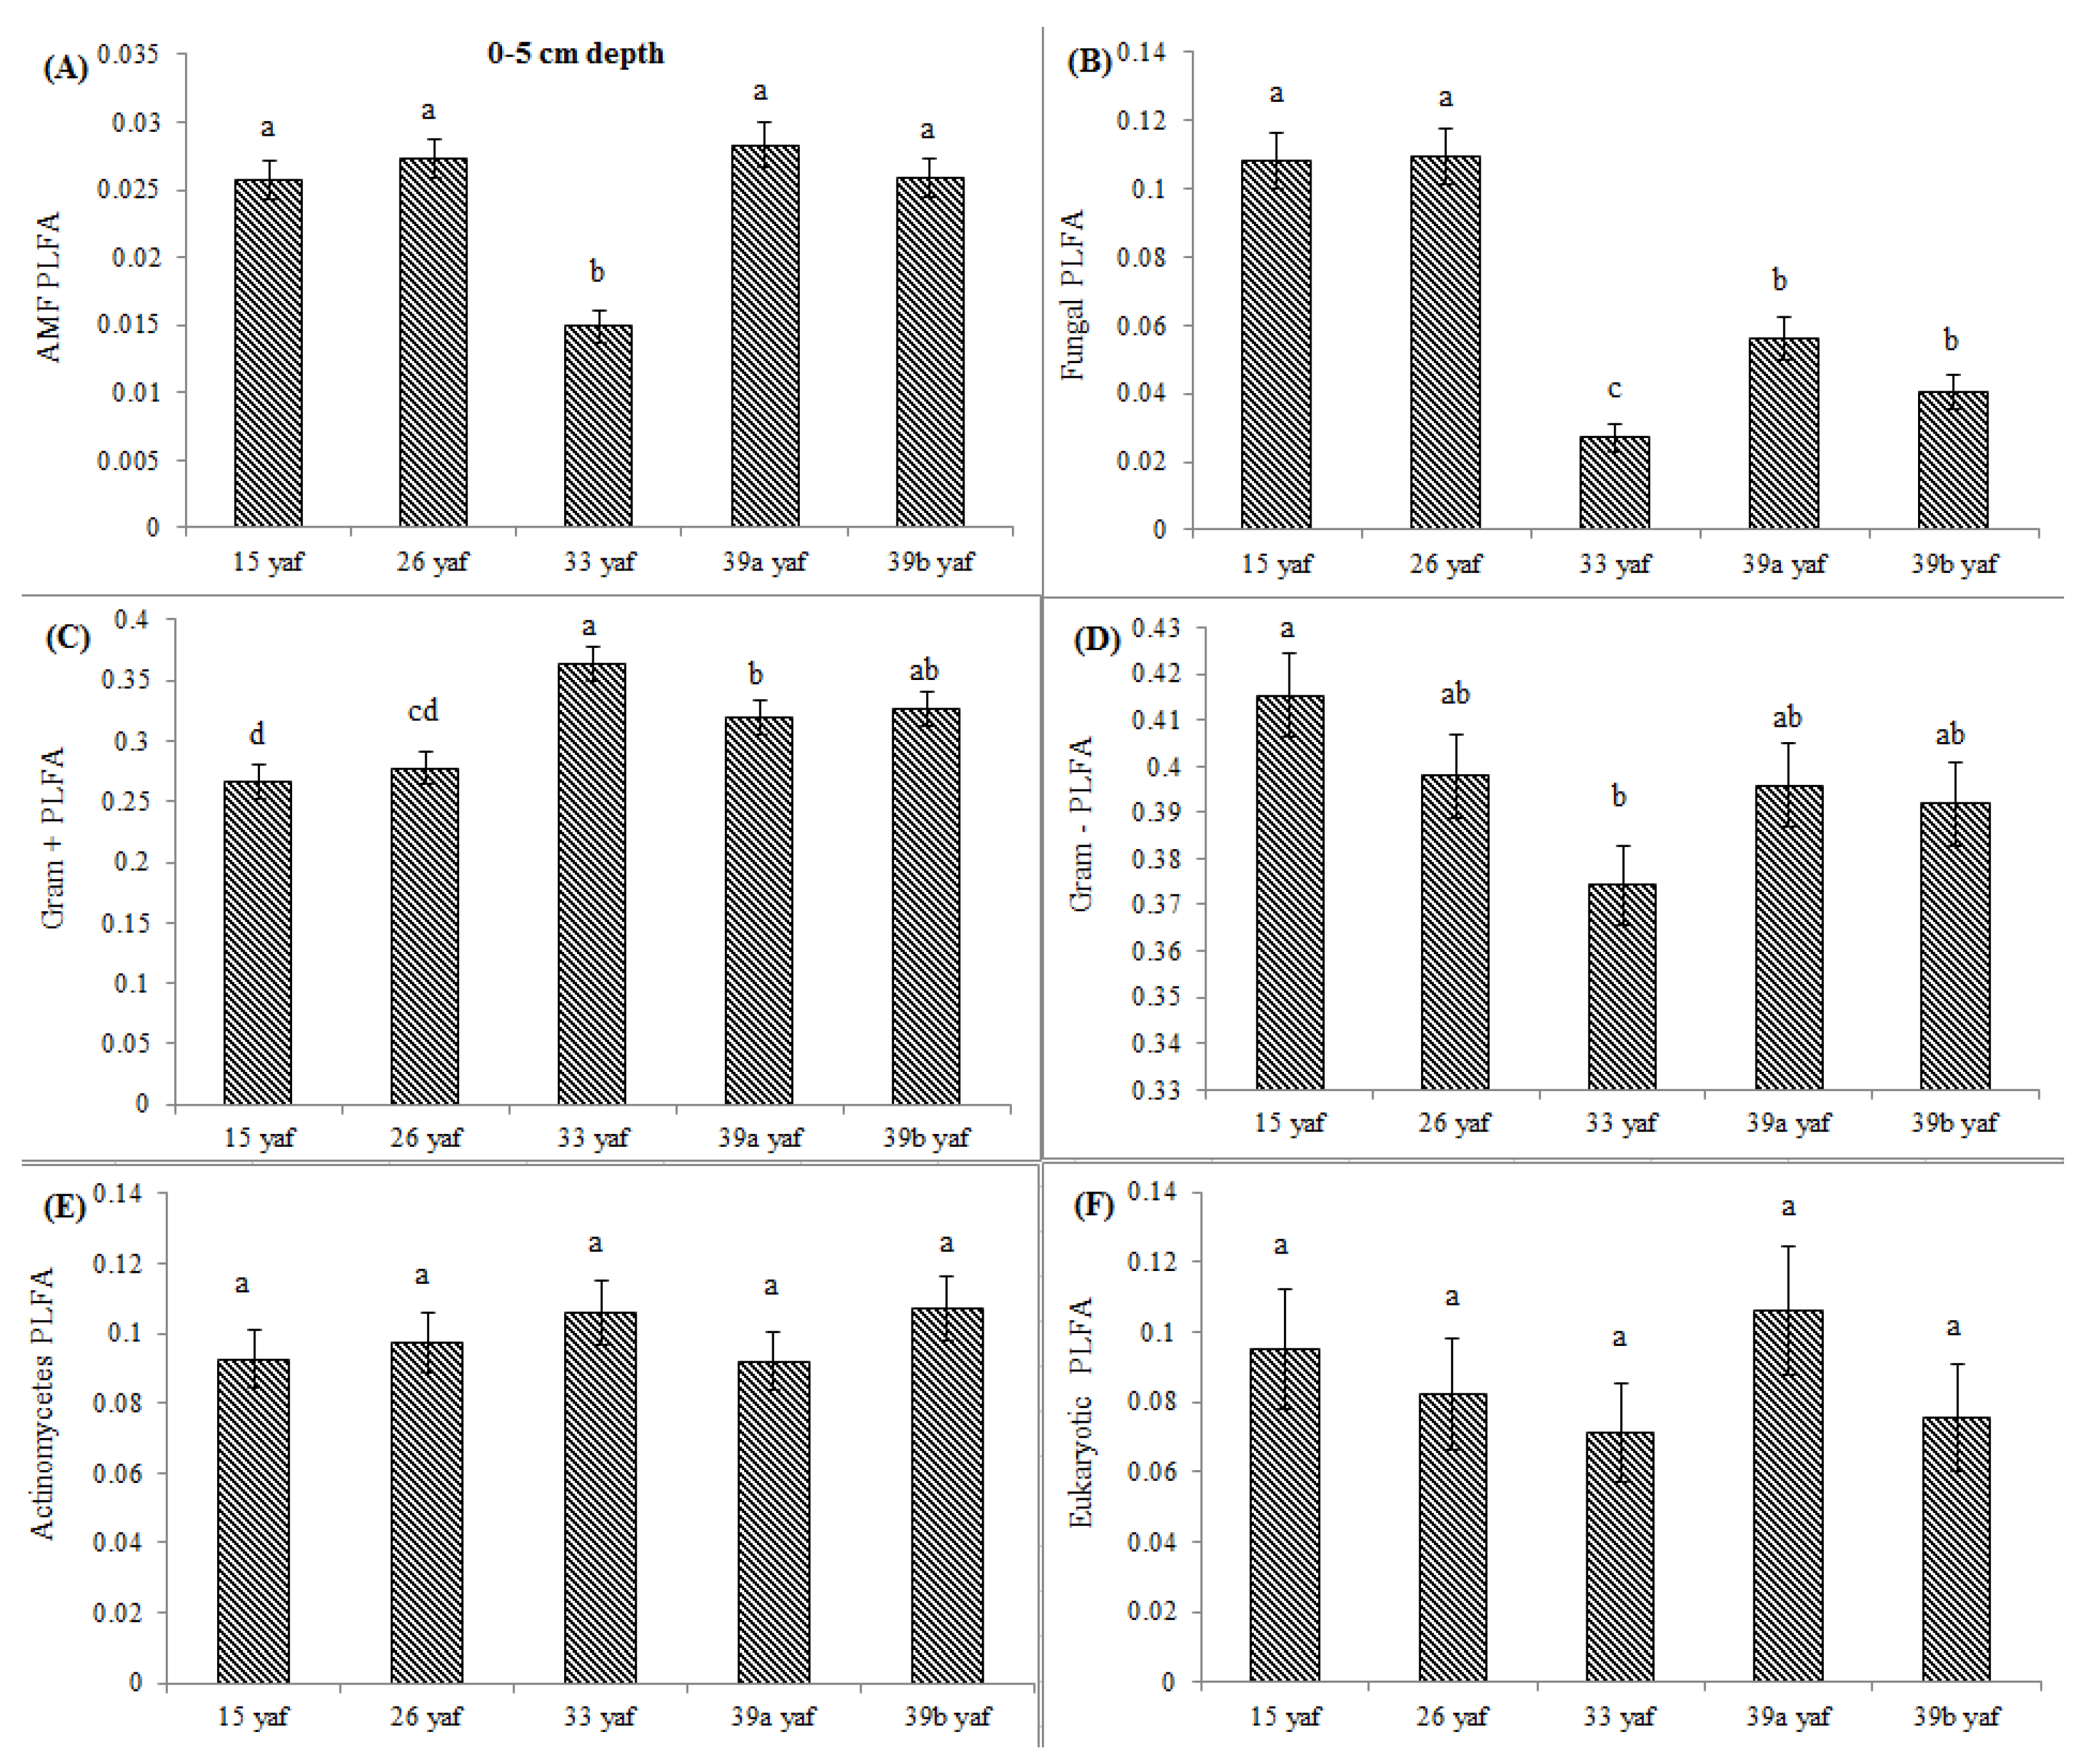
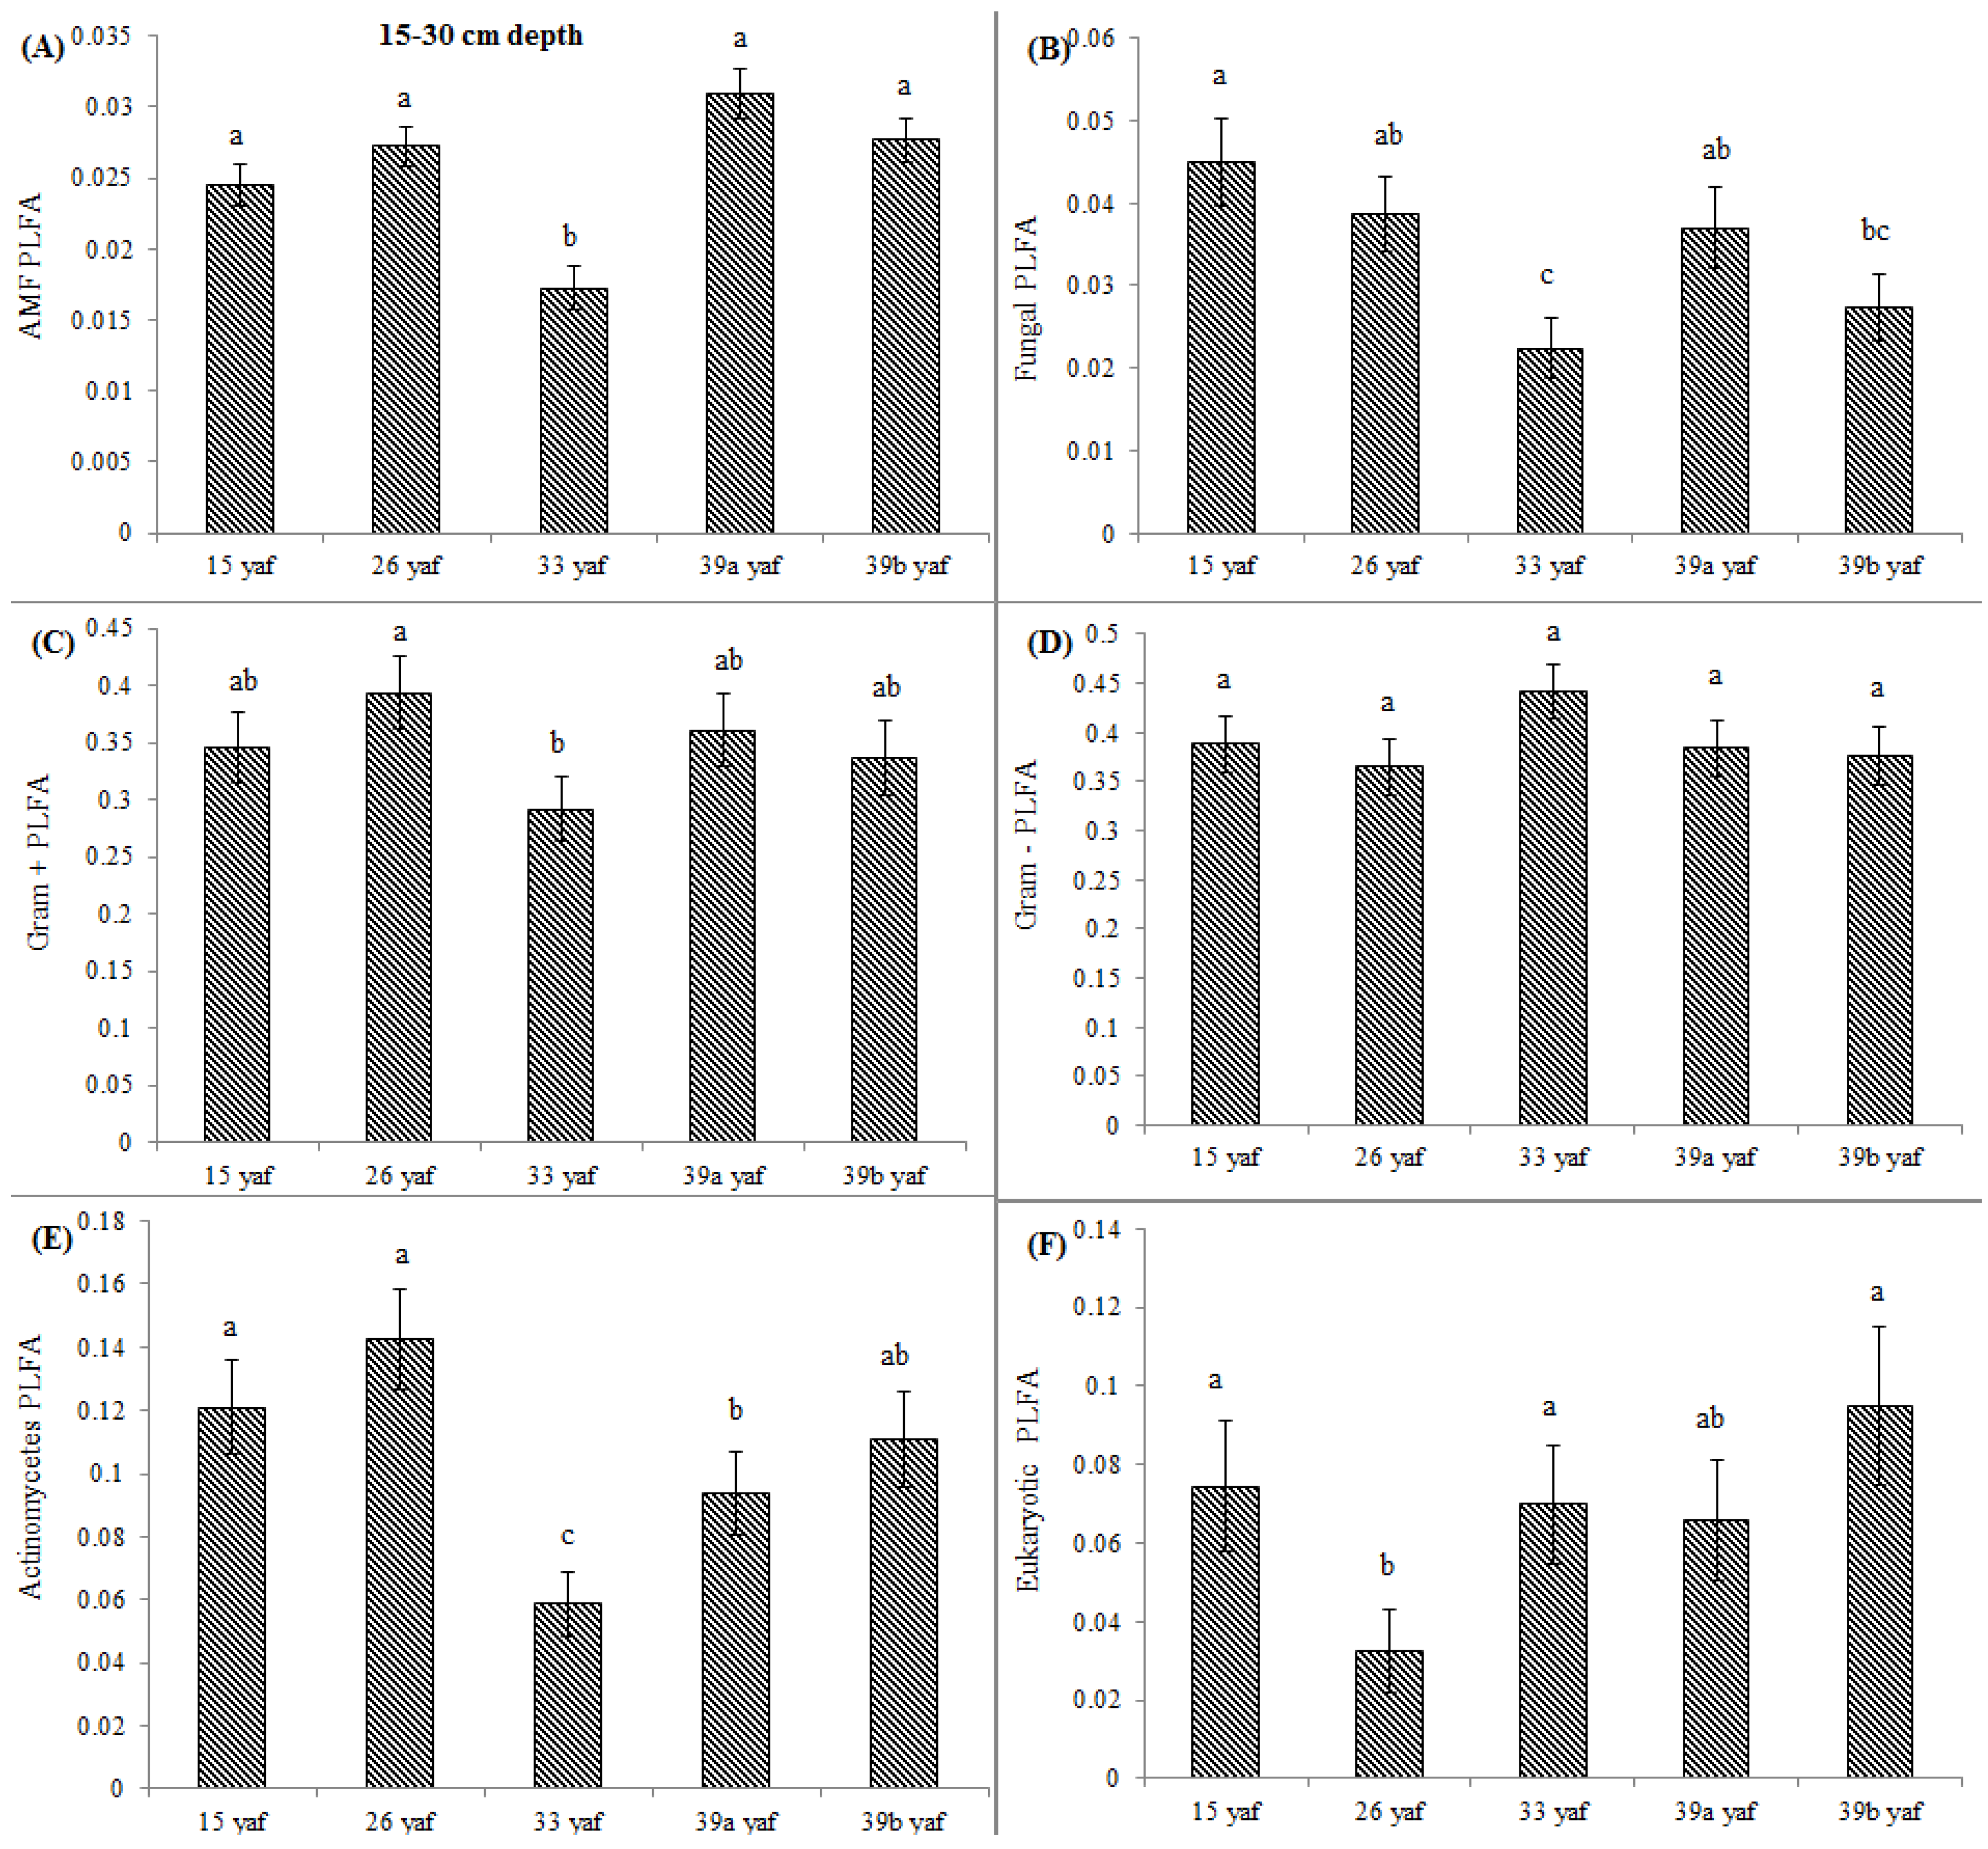
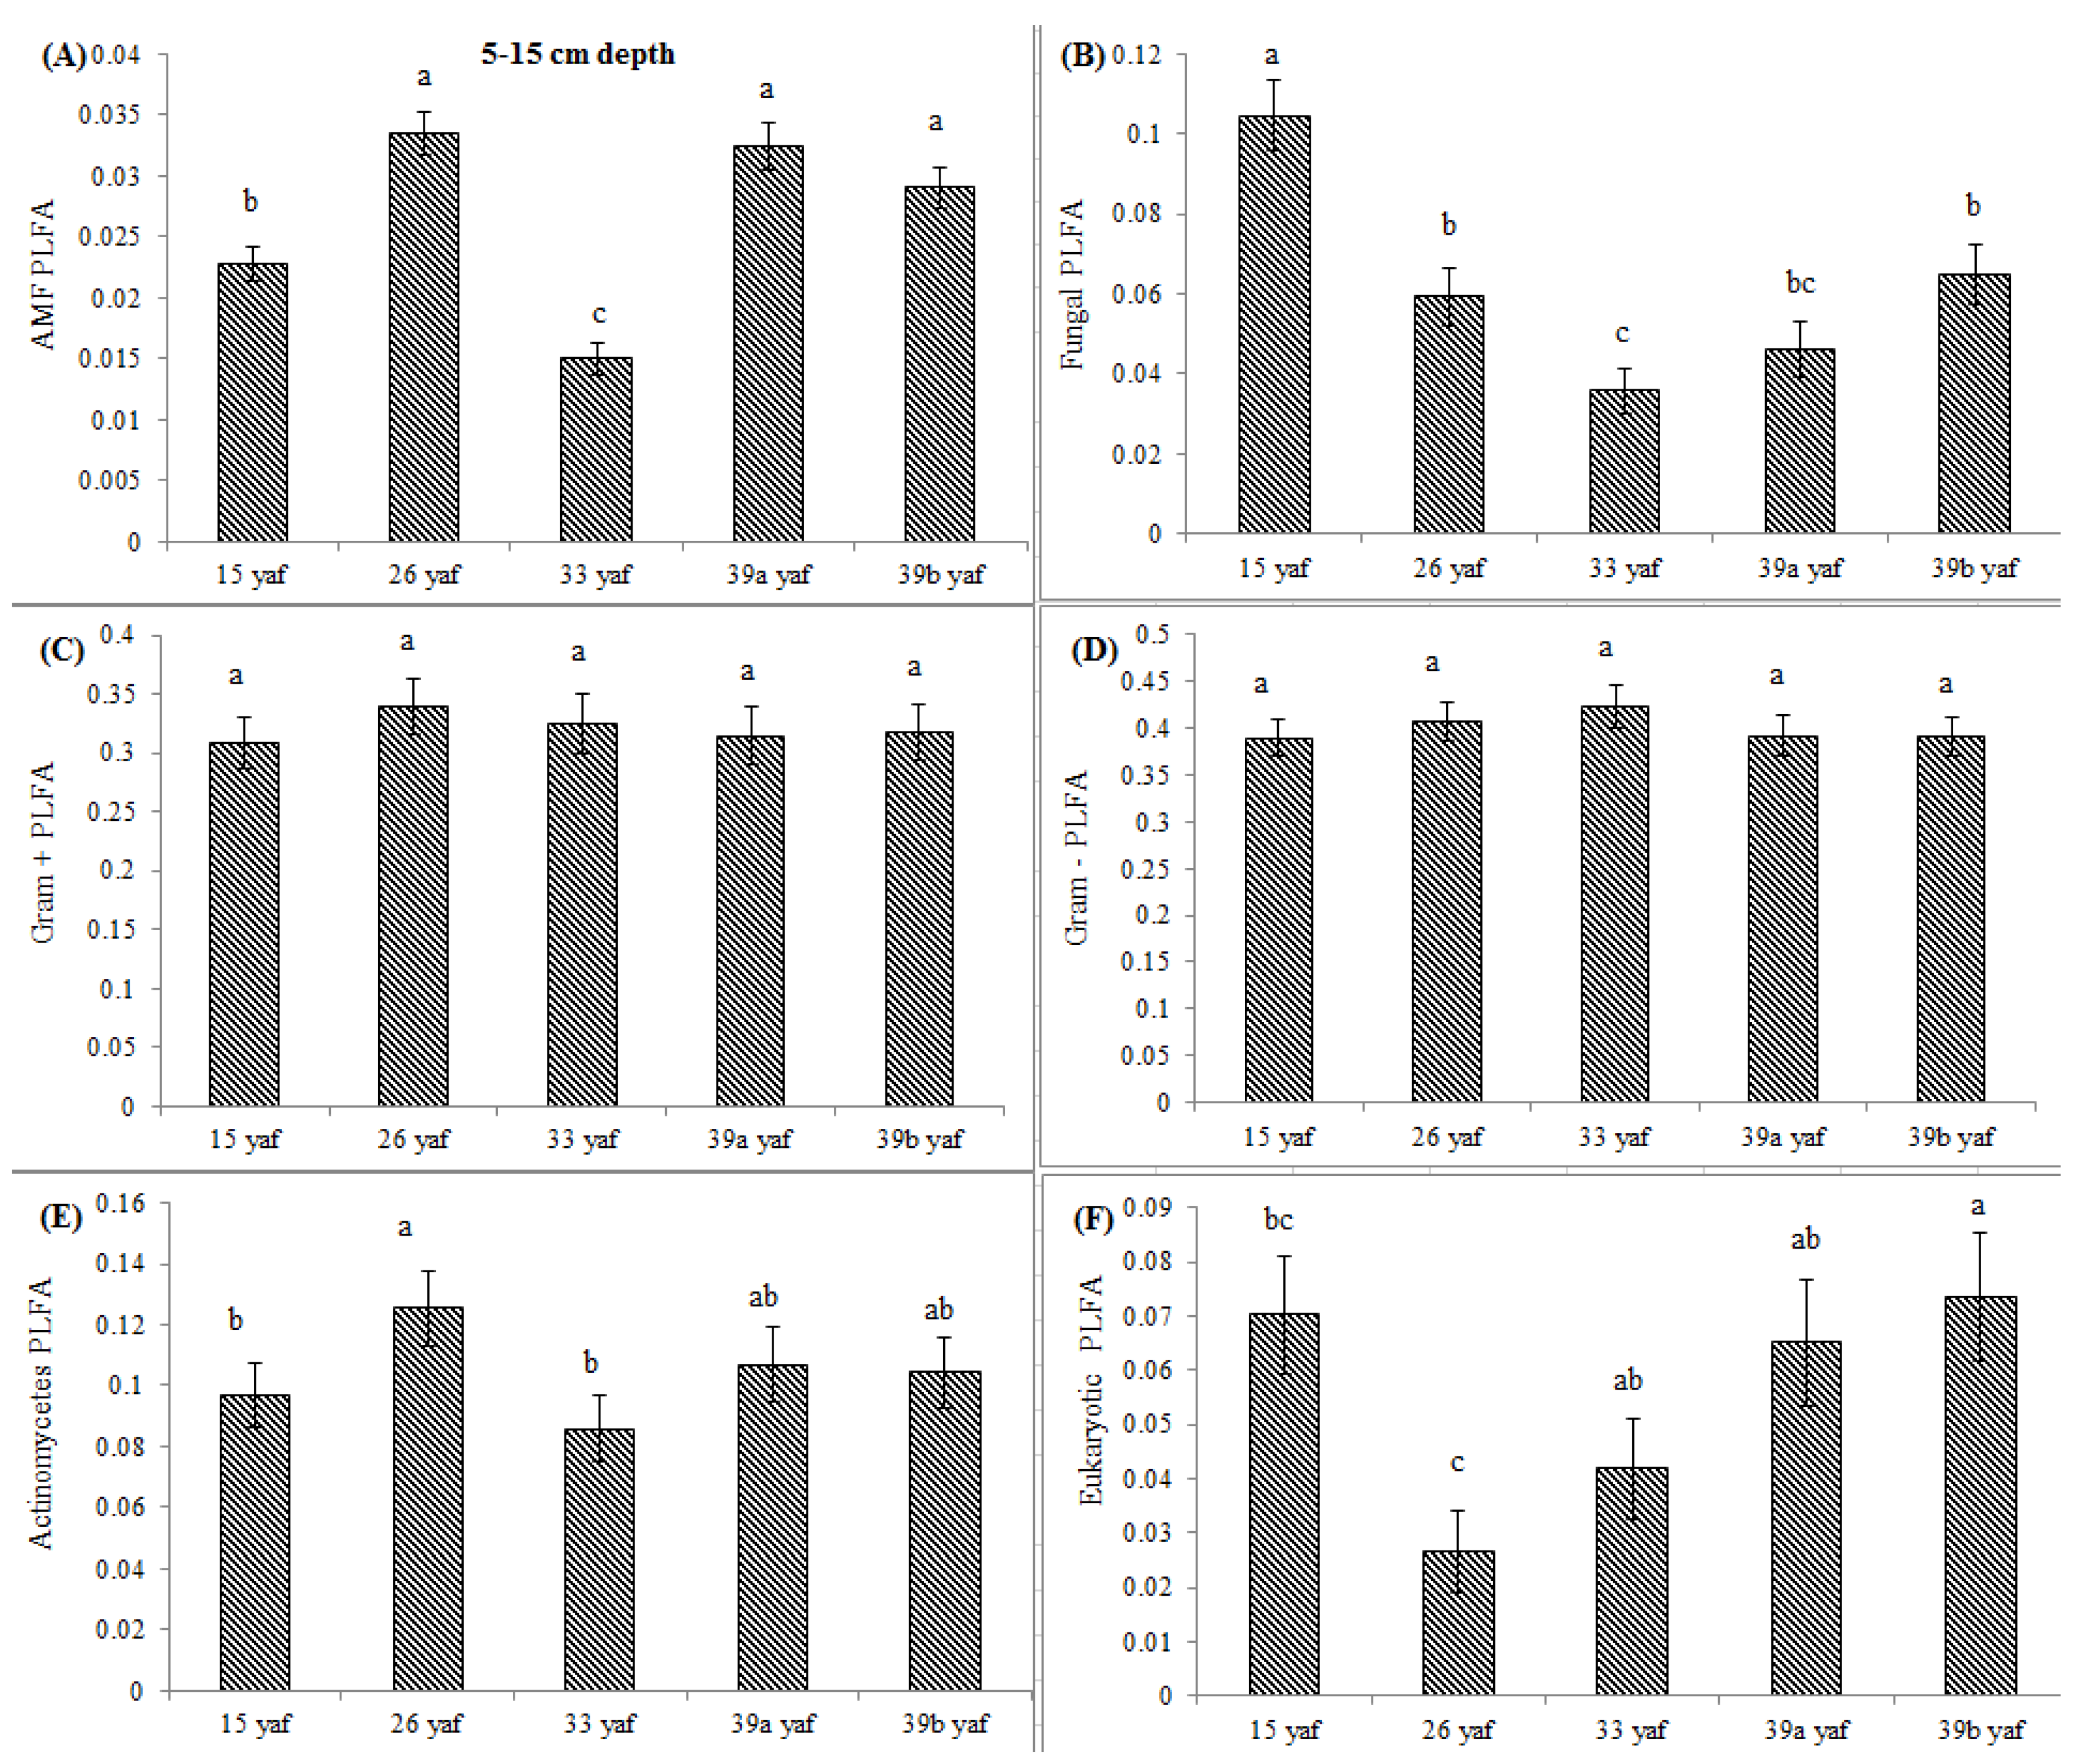
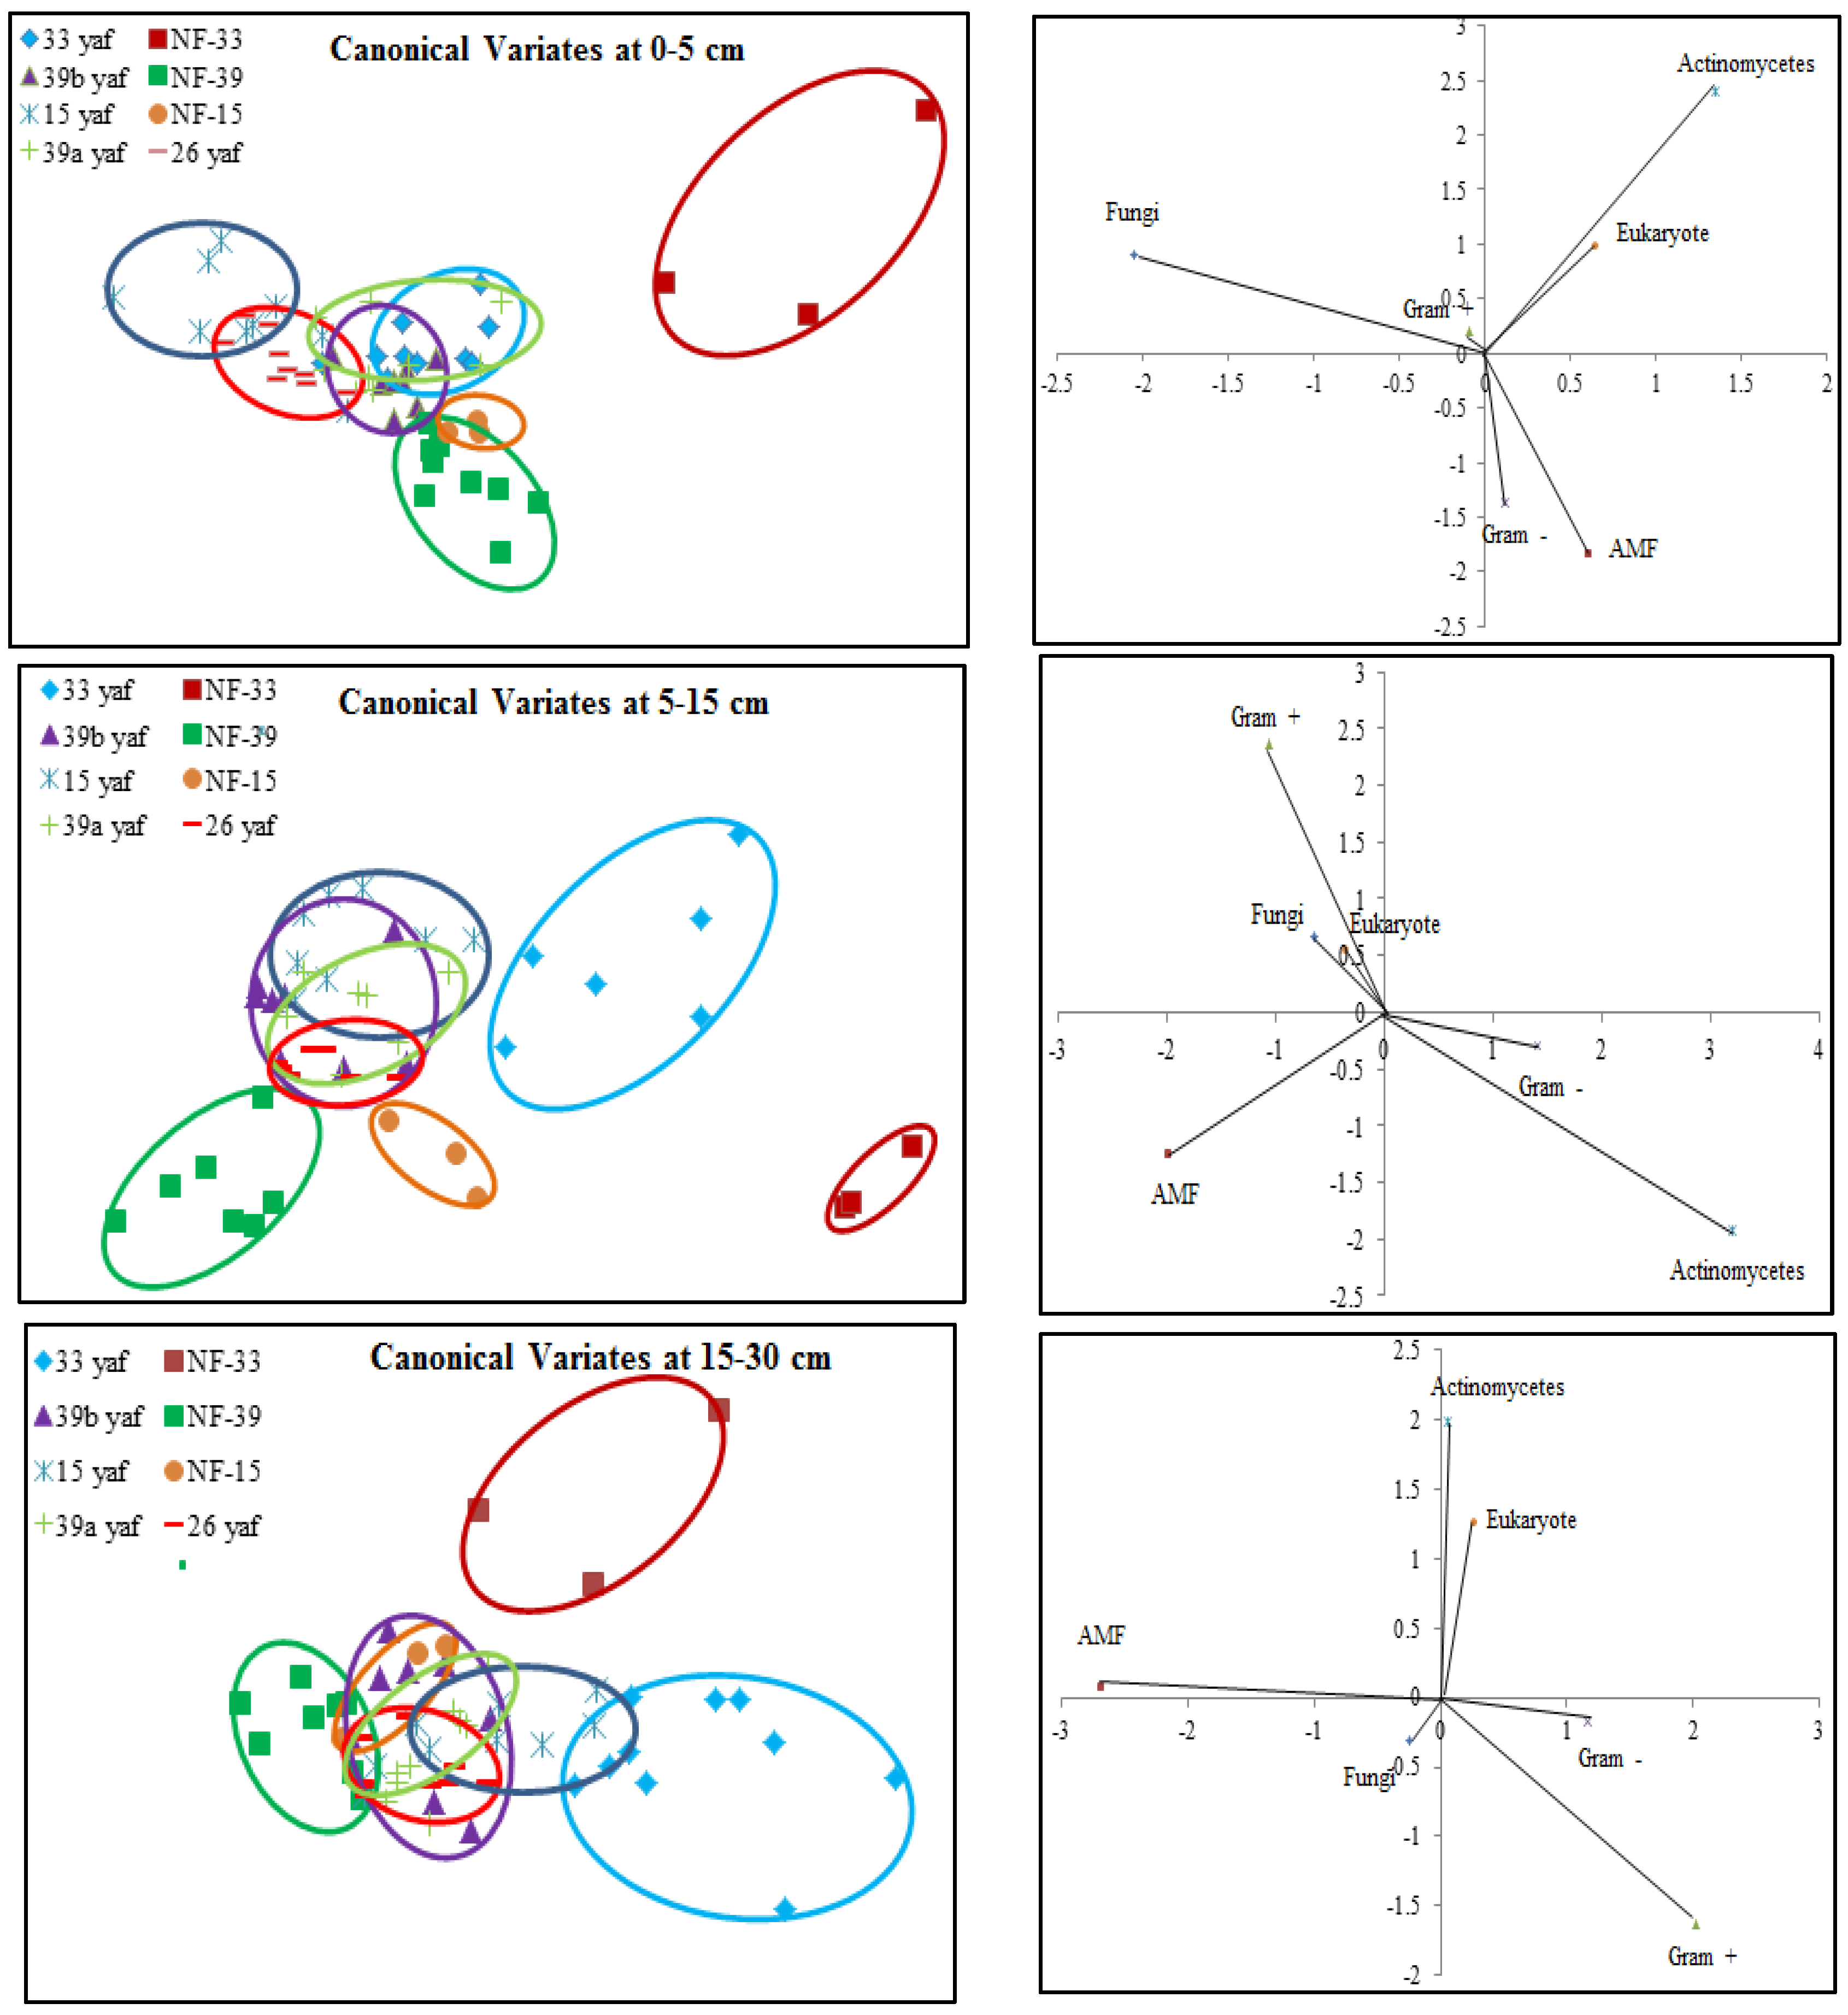
Soil microbial biomass (total PLFA) was affected by long-term repeated fumigation in the 33 yaf site. Soil microbial biomass in the non-fumigated 33 year old site was higher than in the 33 yaf site (Figure 1); however, the different years (15, 33 and 39) did not affect soil microbial biomass. Nevertheless, canonical multivariate analysis showed that microbial communities in fumigated and non-fumigated sites are completely different and similarities were also observed between 15 and 26 yaf clay loam fields and 33, 39a, and 39b yaf sandy loam fields at the soil surface. Also, the shift in microbial community occurred in the 15 yaf continuously fumigated site at 5–15 cm depth, as evidenced by elevated levels of the stress rations S/M and Cy/Pre. These stress markers reflect the degree to which microorganisms are affected by temperature, nutrient, pesticide application and tillage [17,26]. However, other fumigated and non-fumigated sites in 0–5 and 15–30 cm depths did not show differences in S/M and Cy/Pre ratios.
Reeve et al. [13] proposed that the long-term repeated use of fumigants may have more significant and lasting effects on soil microbial populations than have been measured in a single fumigation events study. To test the long-term effect on microbial community structure, we collected soil samples from different years of continuous fumigation. Our study shows that the proportion of fungal biomarkers was significantly higher in 15 and 26 yaf as compared to sites with 33 and 39 years of annual fumigation. However, AMF proportion was higher in 39a and 39b yaf sites compared to 33 yaf site. Lower fungal biomass is typical of intensively cultivated agricultural soils and it has been attributed to different factors such as physical disturbance, and altered amount and complexity of nutrient inputs and decrease in soil organic matter as compared to undisturbed soil [27]. Gram + bacterial proportion was lower in 15 and 26 yaf sites than older fumigated sites, i.e., 33, 39a and 39b yaf sites. A study by Ibekwe et al. [25] and Zelles et al. [28] also found that Gram + bacteria were less injured by fumigation and concluded that this is due to protection by the cell wall structure of the bacteria by formation of spores and ability to adapt to fumigant vapor more quickly. Other studies on the effect of fumigation on soil microbial composition determined that application of high doses of metam sodium (MS) fumigant increased actinomycetes and Gram + bacterial population following fumigation; moreover, fungal and arbuscular mycorrhizal fungal populations were sensitive to MS [29].
The soil textural effect (sandy loam and clay loam) of long-term annual fumigation on soil microbial communities was also studied. Ibekwe et al. [30] suggested clayey soils might protect microorganisms from the effects of fumigation, and clay loam soil in 15 and 26 yaf sites might have protected fungal communities somewhat from the effects of fumigation as compared to the sandy loam at the 33, 39a and 39b yaf sites. However, the proportional level of AMF PLFA was significantly lower in fumigated 33 and 39 yaf sandy loam soils and 15 and 26 yaf clay loam soils compared to their non-fumigated counterparts. Similarly, a study on effects of soil type and farm management on soil ecological functional genes and microbial activities conducted by Reeve et al. [13] concluded that over the long term under field conditions some genes were more affected by management on silty clay loam soil compared to sandy loam.
Cover crops can improve soil quality [31] by reducing chemical inputs such as methyl bromide and other fumigations in strawberry production. Continuous strawberry production on the same site can decrease strawberry yield by causing proliferation of weeds and accumulation of pathogens in the soil [32]. Limited information is available on the effect on microbial community in strawberry after rotation with cover crops in comparison with continuous strawberry production. However, continuous strawberry production at the 15 yaf site was associated with significantly higher proportions of fungal biomarkers as compared to rotation sites. Similar to our results, a study by Zhang et al. [33] on short-term effects of crop rotation on microbial communities found that soils under corn-soybean rotation had lower fungal biomass compared to soils under monoculture corn. In the present study, cover crop such as barley in 39 yaf site and cash crop such as peas or beans at the 33 yaf site possibly increased Gram + bacterial proportion. Long-term repeated fumigation without any crop rotation at the 15 yaf site was associated with a lower proportion of Gram + bacteria and actinomycetes.
In the current study, to present comparative data from fumigated and non-fumigated sites, we collected soil samples from differently aged fumigated sites as well as from never-fumigated sites, and organic sites that have not been fumigated for at least 10 years. Arbuscular mycorrhizal fungi play a crucial role in nutrient acquisition and soil fertility. Our results show that proportions of AMF were significantly lower at the 15, 33 and 39 yaf sites compared to their non-fumigated counterparts. Other studies have also found MeBr to be clearly detrimental to AMF [34], which causes stunting or poor production in several cropping systems [35]. Also, [36] showed that AMF spore abundance and species diversity was significantly higher in the organic than in the conventional systems.
Microbial biomass is often correlated with soil organic C [37,38] and may be more highly correlated with active C than total C [39]. In the present study, the non-fumigated site compared to the 33 yaf site had significantly greater total C as well as greater microbial biomass (total PLFA) at the surface soil. Total carbon (organic carbon) can have a beneficial impact on soil quality, enhancing soil structure and fertility, and increasing water infiltration and storage [40]. However, no notable difference in DOC between fumigated and non-fumigated sites was found. Also, TN was significantly higher at the 15 yaf site compared to its representative non-fumigated site. Levels of macronutrients were significantly lower in 15 yaf surface soil compared to its non-fumigated counterpart, similar to the 39 years old yaf surface soil in comparison to organic surface soil, excluding Ca being notably higher in NF-33 soil.

5. Conclusions

Strawberry fields had lower AMF populations as compared to their non-fumigated sites in all fumigated fields, which is a risk to fumigated fields as AMF plays a major role in soil health and fertility. Crop rotations and cover crops likely helped bacterial proportions; however, proportions of Gram + bacteria and actinomycetes were affected without any crop rotations in the 15 yaf site. This study stresses a need for further research on the effects of crop rotation as well as the long-term impact of currently used MeBr alternative soil treatments on beneficial soil microorganisms to select soil disinfestation methods that have low negative environmental impacts, maintain soil health, and enhance sustainable crop production in California.

Acknowledgments

The authors would like to acknowledge Allie Marquez, Margaret Axiak and David Correia for assistance with field and lab work; Ernie Levya from TriCal, Inc. and collaborating farmers; Rod Koda, Adrian Espinoza, Luis Martin, Miguel Ramos and Darrel Uyeda who participated in this project by helping find fumigated and non-fumigated sites. Financial support for this research was provided by California Department of Food and Agriculture (CDFA) Specialty Crop Block Grant Program (Grant No. 12043). Mention of trade names or commercial products in this publication is solely for the purpose of providing specific information and does not imply recommendation or endorsement by the U.S. Department of Agriculture. USDA is an equal opportunity provider and employer.

Author Contributions

Sadikshya R. Dangi and James Gerik conceived and designed experiments; Bradley D. Hanson contributed in critical revision of the manuscript; Rebecca Tirado Corbala performed soil chemical analysis and analyzed data; Sadikshya R. Dangi performed the experiments, analyzed data and wrote the paper.

Conflicts of Interest

The authors declare no conflict of interest.

Abbreviations

1,3-dichloropropene(1,3-D)
chloropicrin, dimethyl disulfide(DMDS)
methyl isothiocyanate(MITC)

References

  1. CDFA, California Department of Food and Agriculture. California Agricultural Production Statistics. Sacramento, CA, USA, 2014. Available online: https://www.cdfa.ca.gov/statistics/ (accessed on 12 January 2017).
  2. Carpenter, J.; Lynch, L.; Trout, T. Township limits on 1,3-D will impact adjustment to methyl bromide phase-out. Calif. Agric. 2001, 55, 8–12. [Google Scholar] [CrossRef]
  3. Hanson, B.D.; Gao, S.; Gerik, J.S.; Qin, R.; Cabrera, J.A.; Jhala, A.J.; Abit, M.J.M.; Cox, D.; Correiar, B.; Wang, D.; et al. Preplant 1,3-D treatments test well for perennial crop nurseries, but challenges remain. Calif. Agric. 2013, 67, 181–189. [Google Scholar] [CrossRef]
  4. McCarthy, J.E.; Copeland, C.; Parker, L.; Schierow, L.J. Clean Air Act: A Summary of the Act and Its Major Requirements; Congressional Research Service (CRS): Washington, DC, USA, 2011. [Google Scholar]
  5. Fennimore, S.A.; Serohijos, R.; Samtani, J.B.; Ajwa, H.A.; Subbarao, K.V.; Martin, F.N.; Daugovish, O.; Legard, D.; Browne, G.T.; Muramoto, J.; et al. TIF film, substrates and nonfumigant soil disinfestation maintain fruit yields. Calif. Agric. 2013, 67, 139–146. [Google Scholar] [CrossRef]
  6. Fennimore, S.A.; Martin, F.N.; Miller, T.C.; Broome, J.C.; Dorn, N.; Greene, I. Evaluation of a mobile steam applicator for soil disinfection in California strawberry. HortScience 2014, 49, 1542–1549. [Google Scholar]
  7. Reicosky, D.; Forcella, F. Cover crop and soil quality interactions in agroecosystems. J. Soil Water Conserv. 1998, 53, 224–229. [Google Scholar]
  8. Seigies, A.; Pritts, M. Cover crop rotations alter soil microbiology and reduce replant disorders in strawberry. HortScience 2006, 41, 1303–1308. [Google Scholar]
  9. Dangi, S.R.; Tirado-Corbalá, R.; Cabrera, J.A.; Wang, D.; Gerik, J. Soil biotic and abiotic responses to dimethyl disulfide spot drip fumigation in established grape vines. Soil Sci. Soc. Am. J. 2014, 78, 520–530. [Google Scholar] [CrossRef]
  10. Dangi, S.R.; Gerik, J.; Tirado-Corbalá, R.; Ajwa, H. Soil microbial community structure and target organisms under different fumigation treatments. Appl. Environ. Soil Sci. 2015. [Google Scholar] [CrossRef]
  11. Dungan, R.S.; Ibekwe, A.M.; Yates, S.R. Effect of propargyl bromide and 1, 3 dichloropropene on microbial communities in an organically amended soil. FEMS Microbiol. Ecol. 2003, 43, 75–87. [Google Scholar] [CrossRef] [PubMed]
  12. Klose, S.; Ajwa, H.A. Enzyme activities in agricultural soils fumigated with methyl bromide alternatives. Soil Biol. Biochem. 2004, 36, 1625–1635. [Google Scholar] [CrossRef]
  13. Reeve, J.R.; Schadt, C.W.; Carpenter-Boggs, L.; Kang, S.; Zhou, J.; Reganold, J.P. Effects of soil type and farm management on soil ecological functional genes and microbial activities. ISME J. 2010, 4, 1099–1107. [Google Scholar] [CrossRef] [PubMed]
  14. Buyer, J.S.; Teasdale, J.R.; Roberts, D.P.; Zasada, I.A.; Maul, J.E. Factors affecting soil microbial community structure in tomato cropping systems. Soil Biol. Biochem. 2010, 42, 831–841. [Google Scholar] [CrossRef]
  15. Buyer, J.S.; Sasser, M. High throughput phospholipid fatty acid analysis of soils. Appl. Soil Ecol. 2012, 61, 127–130. [Google Scholar] [CrossRef]
  16. Blackwood, C.B.; Buyer, J.S. Soil microbial communities grown with Bt and non—Bt corn in three soils. J. Environ. Qual. 2004, 33, 832–836. [Google Scholar] [CrossRef] [PubMed]
  17. Moore-Kucera, J.; Dick, R.P. PLFA profiling of microbial community structure and seasonal shifts in soils of a Douglas-fir chronosequence. Microb. Ecol. 2008, 55, 500–511. [Google Scholar] [CrossRef] [PubMed]
  18. SAS Institute. SAS/STAT User’s Guide; Version 9.4; SAS Institute: Cary, NC, USA, 2003. [Google Scholar]
  19. Buyer, J.S.; Roberts, D.P.; Russek-Cohen, E. Microbial community structure and function in the spermosphere as affected by soil and seed type. Can. J. Microbiol. 1999, 45, 138–144. [Google Scholar] [CrossRef]
  20. Buyer, J.S.; Roberts, D.P.; Russek-Cohen, E. Soil and plant effects on microbial community structure. Can. J. Microbiol. 2002, 48, 955–964. [Google Scholar] [CrossRef] [PubMed]
  21. Gerik, J.S.; Hanson, B.D. Drip application of methyl bromide alternative chemicals for control of soilborne pathogens and weeds. Pest Manag. Sci. 2011, 67, 1129–1133. [Google Scholar] [CrossRef] [PubMed]
  22. Meadows, R. News overview: Researchers develop alternatives to methyl bromide fumigation. Calif. Agric. 2013, 67, 125–127. [Google Scholar] [CrossRef]
  23. Martin, F.N. Development of alternative strategies for management of soil borne pathogens currently controlled with methyl bromide. Annu. Rev. Phytopathol. 2003, 41, 325–350. [Google Scholar] [CrossRef] [PubMed]
  24. Ibekwe, A.M.; Papiernik, S.K.; Yang, C.H. Influence of soil fumigation by methyl bromide and methyl iodide on rhizosphere and phyllosphere microbial community structure. J. Environ. Sci. Health Part B 2010, 45, 427–436. [Google Scholar] [CrossRef] [PubMed]
  25. Ibekwe, A.M.; Papiernik, S.K.; Gan, J.; Yates, S.R.; Yang, C.H.; Crowley, D.E. Impact of fumigants on soil microbial communities. Appl. Environ. Microbiol. 2001, 67, 3245–3257. [Google Scholar] [CrossRef] [PubMed]
  26. Kaur, A.; Chaudhary, A.; Kaur, A.; Choudhary, R.; Kaushik, A. Phospholipid fatty acid- A bioindicator of environment monitoring and assessment in soil ecosystem. Curr. Sci. 2005, 89, 1103–1112. [Google Scholar]
  27. Lazcano, C.; Gomez-Brandon, M.; Revilla, P.; Dominguez, J. Short-term effects of organic and inorganic fertilizers on soil microbial community structure and function. Biol. Fertil. Soils 2012, 49, 723–733. [Google Scholar] [CrossRef]
  28. Zelles, L.; Palojarvi, A.; Kandeler, E.; Von lutzow, M.; Winter, K.; Bai, Q.Y. Changes in soil microbial properties and phospholipid fatty acid fractions after chloroform fumigation. Soil Biol. Biochem. 1997, 29, 1325–1336. [Google Scholar] [CrossRef]
  29. Macalady, J.L.; Fuller, M.E.; Scow, K.M. Effects of metam sodium fumigation on soil microbial activity and community structure. J. Environ. Qual. 1998, 27, 54–63. [Google Scholar] [CrossRef]
  30. Ibekwe, A.M. Effects of fumigants on non-target organisms in soil. Adv. Agron. 2004, 83, 1–35. [Google Scholar]
  31. Nonnecke, G.; Pritts, M. Sustainable strawberry production and management. In Our Strawberries; Khanizadeh, S., DeEll, J., Eds.; Public Works and Government Services Canada, Publishing and Depository Services: Ottawa, ON, Canada, 2005; pp. 84–96. [Google Scholar]
  32. LaMondia, J.; Elmer, W.; Mervosh, T.; Cowles, R. Integrated management of strawberry pests by rotation and intercropping. Crop Protect. 2002, 21, 837–846. [Google Scholar] [CrossRef]
  33. Zhang, B.; Li, Y.; Ren, T.; Tian, Z.; Wang, G.; He, X. Short-term effect of tillage and crop rotation on microbial community structure and enzyme activities of a clay loam soil. Biol. Fertil. Soils 2014, 50, 1077–1085. [Google Scholar] [CrossRef]
  34. Menge, J.A. Effect of soil fumigants and fungicides on vesicular-arbuscular fungi. Phytopathology 1982, 72, 1125–1132. [Google Scholar]
  35. Hass, J.H.; Bar-Yosef, B.; Krikun, J.; Barak, R.; Markovitz, T.; Kramer, S. Vesicular-arbuscular mycorrhizal-fungus infestation and phosphorus fertigation to overcome pepper stunting after methyl bromide fumigation. Agron. J. 1987, 79, 905–910. [Google Scholar] [CrossRef]
  36. Oehl, F.; Sieverding, E.; Mader, P.; Dubois, D.; Ineichen, K.; Boller, T.; Wiemken, A. Impact of long-term conventional and organic farming on the diversity of arbuscular mycorrhizal fungi. Oecologia 2004, 138, 574–583. [Google Scholar] [CrossRef] [PubMed]
  37. Franzluebbers, A.J.; Haney, R.L.; Hons, F.M.; Zuberer, D.A. Active fraction of organic matter in soils with different texture. Soil Biol. Biochem. 1996, 28, 1367–1372. [Google Scholar] [CrossRef]
  38. Hassink, J. Effect of soil texture on the size of the microbial biomass and on the amount of C and N mineralized per unit of microbial biomass in Dutch grassland soils. Soil Biol. Biochem. 1994, 33, 1713–1722. [Google Scholar] [CrossRef]
  39. Weil, R.R.; Islam, K.R.; Stine, M.A.; Gruver, J.B.; Samson-Liebig, S.E. Estimating active carbon for soil quality assessment: A simplified method for laboratory and field use. Am. J. Altern. Agric. 2003, 18, 3–17. [Google Scholar]
  40. Weil, R.R.; Magdoff, F. Significance of soil organic matter to soil quality and health. In Soil Organic Matter in Sustainable Agriculture; Magdoff, F., Weil, R.R., Eds.; CRC Press: Boca Raton, FL, USA, 2004; pp. 1–43. [Google Scholar]
Figure 1. Total phospholipid fatty acid (PLFA) for fumigated and non-fumigated sites at (A) 0–5 cm; (B) 5–15 cm; and (C) 15–30 cm depths. Different letters indicate significant differences (p < 0.05). Error bars indicate standard error. Soil samples were collected from 15, 26, 33, 39a, 39b yaf sites as well as non-fumigated (NF-15, NF-33 and NF-39) sites.
Agronomy 07 00037 g001
Figure 2. (A) AMF, (B) fungal, (C) gram positive, (D) gram negative, (E) actinomycetes, and (F) eukaryotic PLFA proportions at the 0–5 cm depth. Different letters indicate significant differences (p < 0.05). Error bars indicate standard error. Samples were collected from 15, 26, 33, 39a and 39b yaf sites.
Agronomy 07 00037 g002
Figure 3. (A) AMF, (B) fungal, (C) gram positive, (D) gram negative, (E) actinomycetes, and (F) eukaryotic PLFA proportions at the 5–15 cm depth. Different letters indicate significant differences (p < 0.05). Error bars indicate standard error. Samples were collected from 15, 26, 33, 39a and 39b yaf sites.
Agronomy 07 00037 g003
Figure 4. (A) AMF, (B) fungal, (C) gram positive, (D) gram negative, (E) actinomycetes, and (F) eukaryotic PLFA proportions at the 15–30 cm depth. Different letters indicate significant differences (p < 0.05). Error bars indicate standard error. Samples were collected from 15, 26, 33, 39a and 39b yaf sites.
Agronomy 07 00037 g004
Figure 5. Canonical multivariate analysis of variance of phospholipid fatty acid biomarkers for 0–5 cm, 5–15 and 15–30 cm depths. Vectors represent standardized canonical coefficients and indicate the relative contribution of each biomarker group to each canonical variate. Soil samples were collected from 15, 26, 33, 39a, 39b yaf sites as well as non-fumigated (NF-15, NF-33 and NF-39) sites.
Agronomy 07 00037 g005
Table 1. Description of the five long-term fumigated study sites in Watsonville, CA, USA.
SiteAge * (Yaf)CropFumigation Starting YearFumigation before SamplingFumigants Used
115Strawberry1998May 2013Yearly with MeBr: chloropicrin
226Strawberry rotated with either barley, peas and beans1990May 2013Every other year with MeBr: chloropicrin
333Strawberry rotated either with barley, peas and beans1980May 2013Every other year with MeBr
439aStrawberry and barley1974May 2013Every other year with MeBr: chloropicrin
539bStrawberry and barley1974May 2013Every other year with MeBr: chloropicrin
* Yaf = Years of annual fumigation.
Table 2. pH, macronutrients, dissolved organic carbon (DOC), total nitrogen (TN), and total carbon in fumigated and non-fumigated sites at the 0–5 cm depth.
SitepHCaKMgNaSDOCTNTC
mg kg−1ppm%
15 yaf7.72 a40.0 c13.4 b18.1 b51.1 b39 b494 a0.24 a1.38 b
NF-157.94 a433 a50.9 a162 a145 a310 b512 a0.08 b0.40 b
26 yaf7.89 a45.7 c2.93 c12.2 b8.34 c8.16 c18.8 b0.11 a,b0.86 b
33 yaf7.20 a13.8 d7.13 b6.9 b14.6 c7.6 c58.7 b0.10 a,b0.89 b
NF-337.27 a70.8 b14.8 b26.5 b21.9 b,c37 b68 b0.16 a,b2.35 a
39a yaf6.90 a197 b9.57 b46.1 b34.2 b,c1002a26 b0.15 a,b0.87 b
39b yaf5.92 b189 b8.61 b44.4 b47.4 b,c1338 a22.2 b0.76 a,b4.13 a
NF-396.93 a92.6 b13.9 b26.5 b20.6 b,c329 b24.3 b0.17 a,b0.85 b
Pr > F0.002 *0.001 *0.003 *<0.0001 *<0.0001 *<0.0001 *0.044 *0.042 *0.040 *
SE0.1254.56.729.410.040.51300.050.37
* Means followed by different letters in a column are significantly different by Tukey’s test at p < 0.05. Ca, Calcium; K, potassium; Mg, magnesium; Na, sodium; S, sulfur; dissolved organic carbon, DOC; TN, total nitrogen; TC, total carbon.
Table 3. PLFA biomarker proportions at the 0–5 cm depth.
SiteFungiAMFGram PositiveGram NegativeActinomycetesEukaryote
Sandy loam
33 yaf0.020 (0.004) b0.010 (0.002) c0.365 (0.023) a0.374 (0.010) b0.099 (0.015) b0.092 (0.031) a
NF-330.229 (0.001) b0.025 (0.003) b0.282 (0.024) b0.438 (0.023) a0.149 (0.006) a0.064 (0.013) a
39a yaf0.051 (0.009) a0.021 (0.004) b,c0.318 (0.008) a,b0.396 (0.010) a,b0.094 (0.009) b0.102 (0.020) a
39b yaf0.039 (0.004) a,b0.025 (0.0005) b0.326 (0.008) a,b0.392 (0.012) a,b0.105 (0.005) a,b0.074 (0.015) a
NF-390.035 (0.002) a,b0.046 (0.002) a0.343 (0.002) a,b0.412 (0.003) a,b0.117 (0.001) a,b0.028 (0.003) a
Clay loam
15 yaf0.108 (0.008) a0.025(0.001) b0.265 (0.011) b0.415 (0.005) a,b0.090 (0.003) b0.083 (0.007) a
NF-150.026 (0.002) b0.033 (0.002) a0.346 (0.014) a0.423 (0.009) a0.130 (0.004) a0.021 (0.002) b
26 yaf0.109 (0.008) a0.027(0.0009) b0.277 (0.013) b0.397 (0.004) b0.094 (0.003) b0.072 (0.010) a
Values are least square means. Values for each effect within a column with the same letter were not significantly different (p ≤ 0.05). Standard errors are in parentheses.
Table 4. PLFA biomarker proportions at the 5–15 cm depth.
SiteFungiAMFGram + BacteriaGram − BacteriaActinomycetesEukaryote
Sandy loam
33 yaf0.034 (0.006) a,b0.013 (0.002) b0.346 (0.043) a0.421 (0.050) a0.107 (0.015) a0.040 (0.010) a
NF-330.214 (0.003) b0.029 (0.002) a,b0.332 (0.014) a0.404 (0.007) a0.134 (0.005) a0.049 (0.014) a
39a yaf0.039 (0.008) a,b0.029 (0.004) a,b0.313 (0.021) a0.390 (0.009) a0.104 (0.007) a0.071 (0.013) a
39b yaf0.065 (0.010) a0.028 (0.001) a,b0.314 (0.014) a0.389 (0.008) a0.099 (0.003) a0.074 (0.013) a
NF-390.032 (0.005) a,b0.041 (0.007) a0.324 (0.014) a0.419 (0.007) a0.103 (0.005) a0.057 (0.019) a
Clay loam
15 yaf0.106 (0.014) a0.023 (0.001) c0.305 (0.012) b0.388 (0.008) a0.092 (0.004) b0.067 (0.009) a
NF-150.023 (0.0005) b0.040 (0.0008) a0.360 (0.007) a0.399 (0.009) a0.128 (0.005) a0.030 (0.006) a,b
26 yaf0.057 (0.005) a,b0.033 (0.001) b0.335 (0.003) a,b0.405 (0.006) a0.120 (0.002) a0.018 (0.008) b
Values are least square means. Values for each effect within a column with the same letter were not significantly different (p ≤ 0.05). Standard errors are in parentheses.
Table 5. PLFA biomarker proportions at the 15–30 cm depth.
SiteFungiAMFGram + BacteriaGram − BacteriaActinomycetesEukaryote
Sandy loam
33 yaf0.018 (0.004) a0.008 (0.003) c0.328 (0.047) a0.437 (0.056) a0.072 (0.019) a0.064 (0.014) a
NF-330.013 (0.002) a0.023 (0.002) a,b0.308 (0.012) a0.379 (0.035) a0.118 (0.013) a0.137 (0.047) a
39a yaf0.028 (0.006) a0.024 (0.004) a,b0.355 (0.006) a0.380 (0.009) a0.096 (0.013) a0.089 (0.038) a
39b yaf0.027 (0.005) a0.027 (0.001) a0.329 (0.011) a0.372 (0.010) a0.104 (0.004) a0.100 (0.024) a
NF-390.018 (0.002) a0.034 (0.004) a0.345 (0.013) a0.396 (0.007) a0.108 (0.013) a0.065 (0.017) a
Clay loam
15 yaf0.041 (0.009) a0.022(0.003) b0.341 (0.016) a0.385 (0.001) a0.113 (0.004) b0.059 (0.007) a
NF-150.021 (0.001) a0.035 (0.001) a0.354 (0.0003) a0.399 (0.008) a0.127 (0.001) a,b0.042 (0.010) a
26 yaf0.037 (0.003) a0.027(0.001) b0.389 (0.006) a0.360 (0.008) a0.135 (0.003) a0.013 (0.004) b
Values are least square means. Values for each effect within a column with the same letter were not significantly different (p ≤ 0.05). Standard errors are in parentheses.
Table 6. Structure matrix (pooled with canonical structure) and function at group centroid for 0–5, 5–15, and 15–30 cm soil depths.
Structure Loadings
0–5 cm5–15 cm15–30 cm
ParameterCV† 1CV 2CV 1CV 2CV 1CV 2
Fungi0.320.38−0.050.400.02−0.06
AMF0.28−0.130.0006−0.44−0.160.29
Gram +0.3070.160.31−0.050.130.19
Gram −0.340.330.280.020.250.17
Actino0.510.340.39−0.220.040.30
Eukaryote0.090.560.100.170.200.70
Group Centroids
15 yaf−2.711.35−0.841.710.17−0.19
NF-151.36−1.510.57−1.69−0.860.83
26 yaf−1.980.24−0.80−0.51−0.75−0.78
33 yaf0.500.553.261.233.20−0.62
NF-337.313.314.90−2.071.814.11
39a yaf−0.090.39−0.450.01−0.46−0.47
39b yaf0.07−0.42−1.000.56−0.610.19
NF-391.25−2.77−1.91−1.41−2.040.30
† CV, Canonical variate.
Table 7. Changes in the ratio of saturated/monounsaturated PLFAs and cyclopropyl PLFAs to their precursors for fumigated and non-fumigated sites at 0–5, 5–15, and 15–30 cm depths. Different letters indicate significant differences (p < 0.05). Soil samples were collected from 15, 26, 33, 39a, 39b yaf sites as well as non-fumigated (NF-15, NF-33 and NF-39) sites.
Site0–5 cm5–15 cm15–30 cm
S/MCy/PS/MCy/PS/MCy/P
15 yaf1.190.641.29 a1.31 a1.190.82
NF-150.890.460.99 a,b0.56 b0.950.59
26 yaf1.160.581 a,b0.65 b1.130.75
33 yaf0.930.71.07 a,b0.81 b0.880.79
NF-330.920.560.97 a,b0.64 b0.580.73
39a yaf1.080.410.99 a,b0.62 b1.040.53
39b yaf1.190.531.19 a,b0.69 b1.10.76
NF-390.920.490.81 b0.52 b0.980.56

