
Genetic Diversity in Barley and Wheat for Tolerance to Soil Constraints


Abstract
:1. Introduction
2. Materials and Methods
2.1. Sites Description and Experimental Design
2.2. Soil Sampling and Analysis
2.3. Plant Available Water Capacity (PAWC)
2.4. Plant Analysis
2.5. Statistical Analyses
3. Results
3.1. Soil Constraints
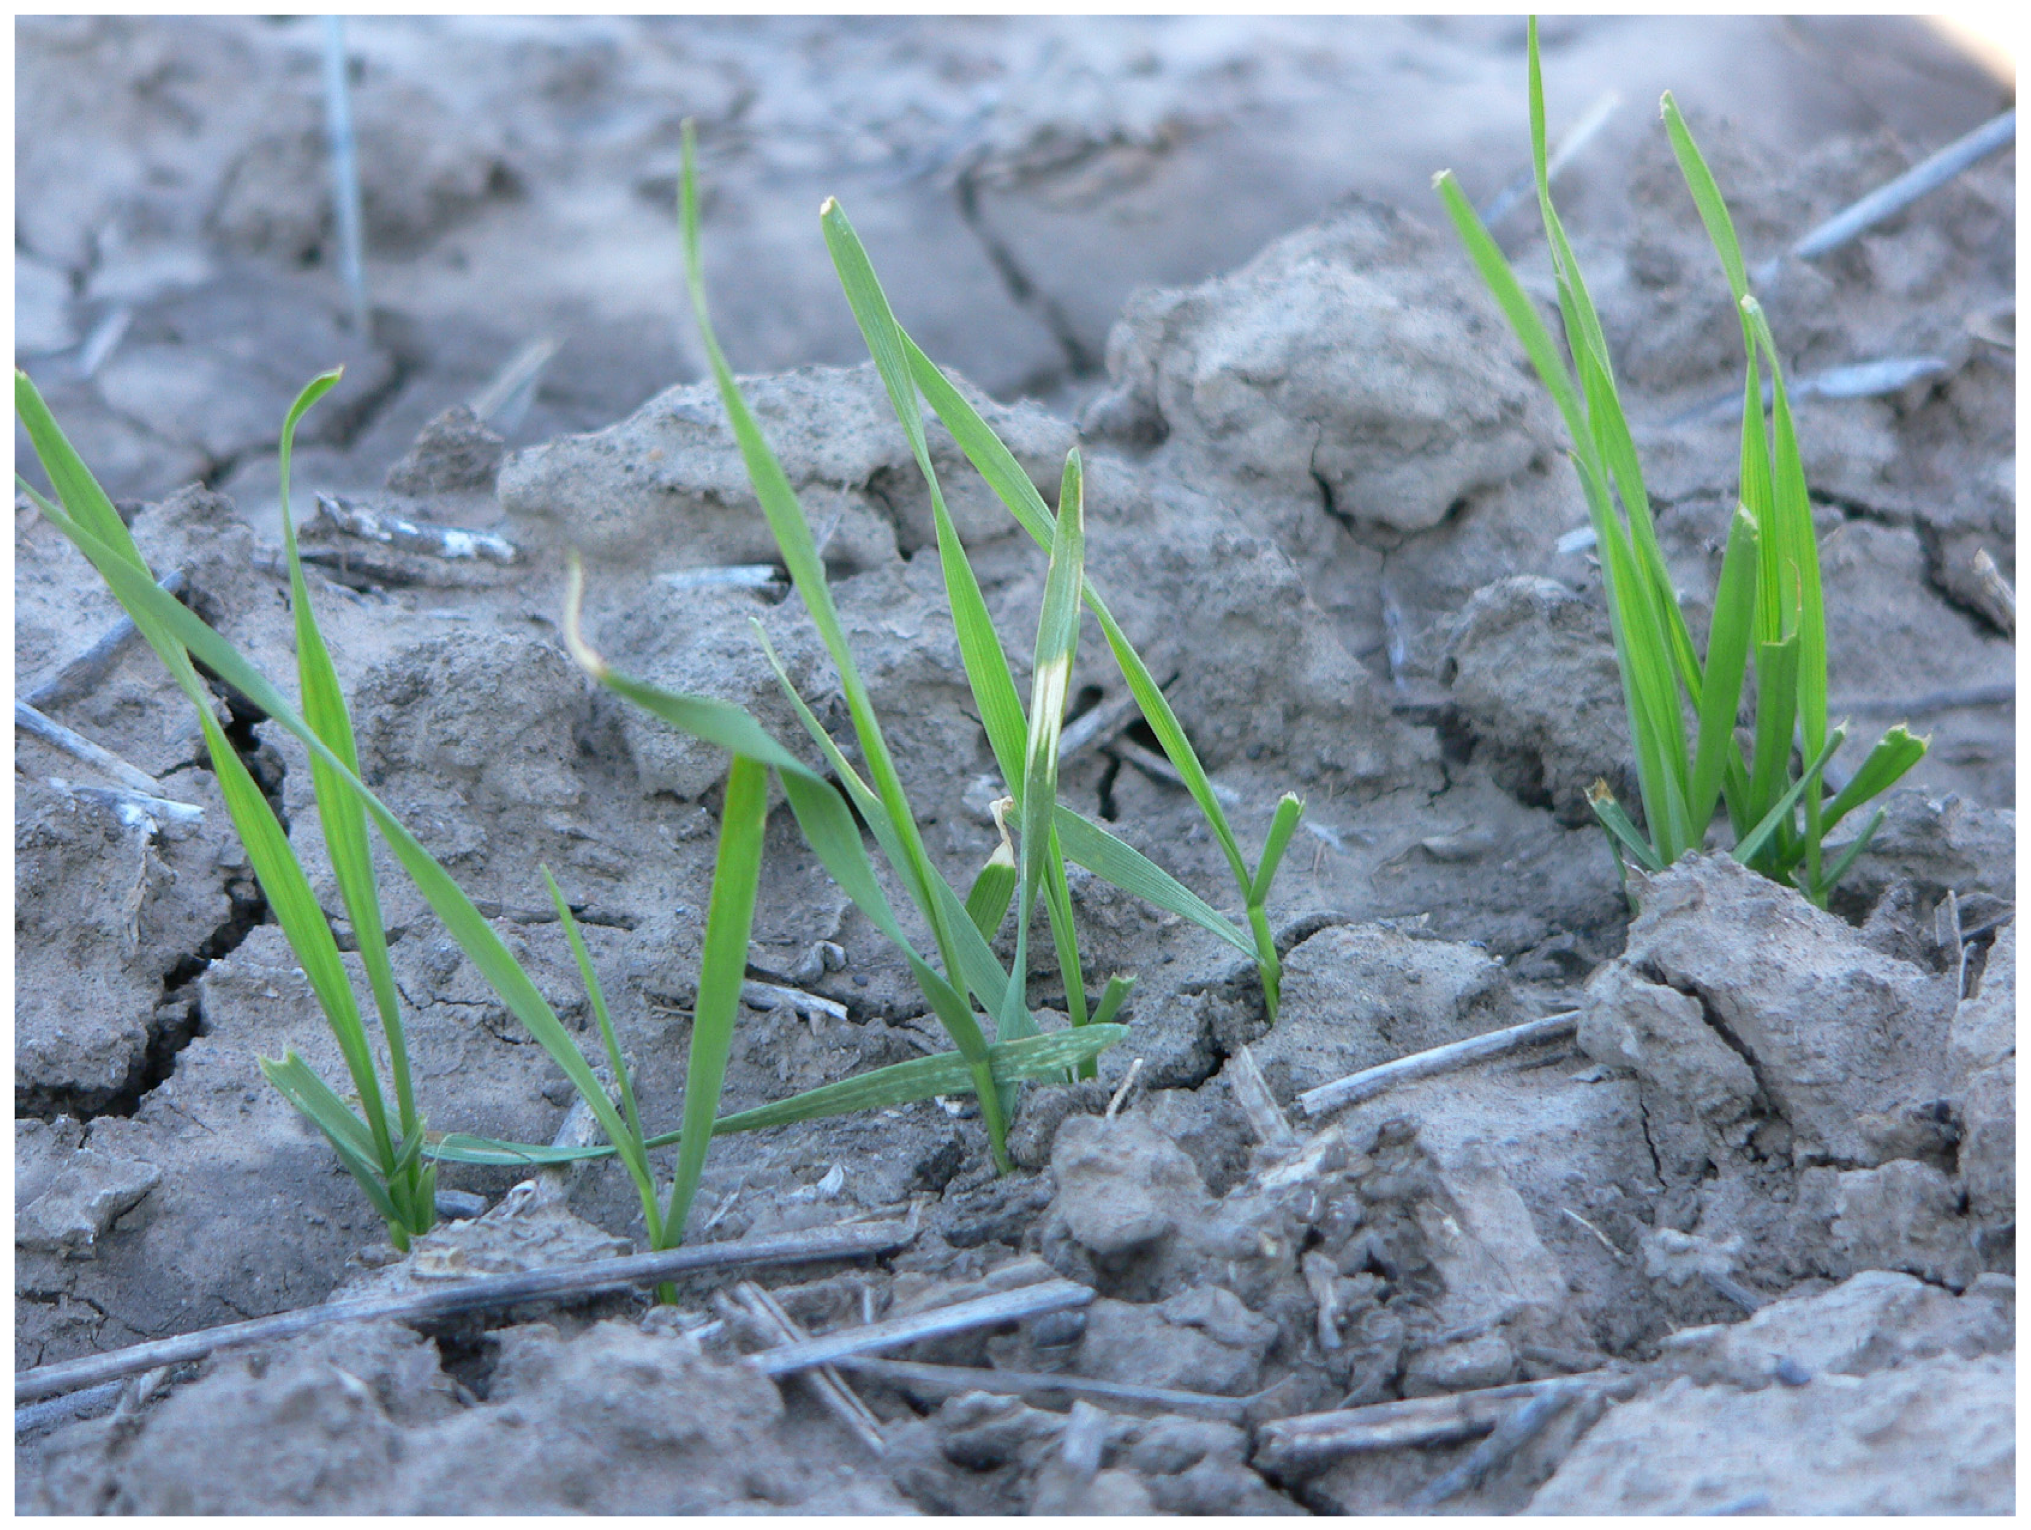
3.2. Visual Symptoms
3.3. Seasonal Water Availability and Site Mean Yields Varied with Species and Season
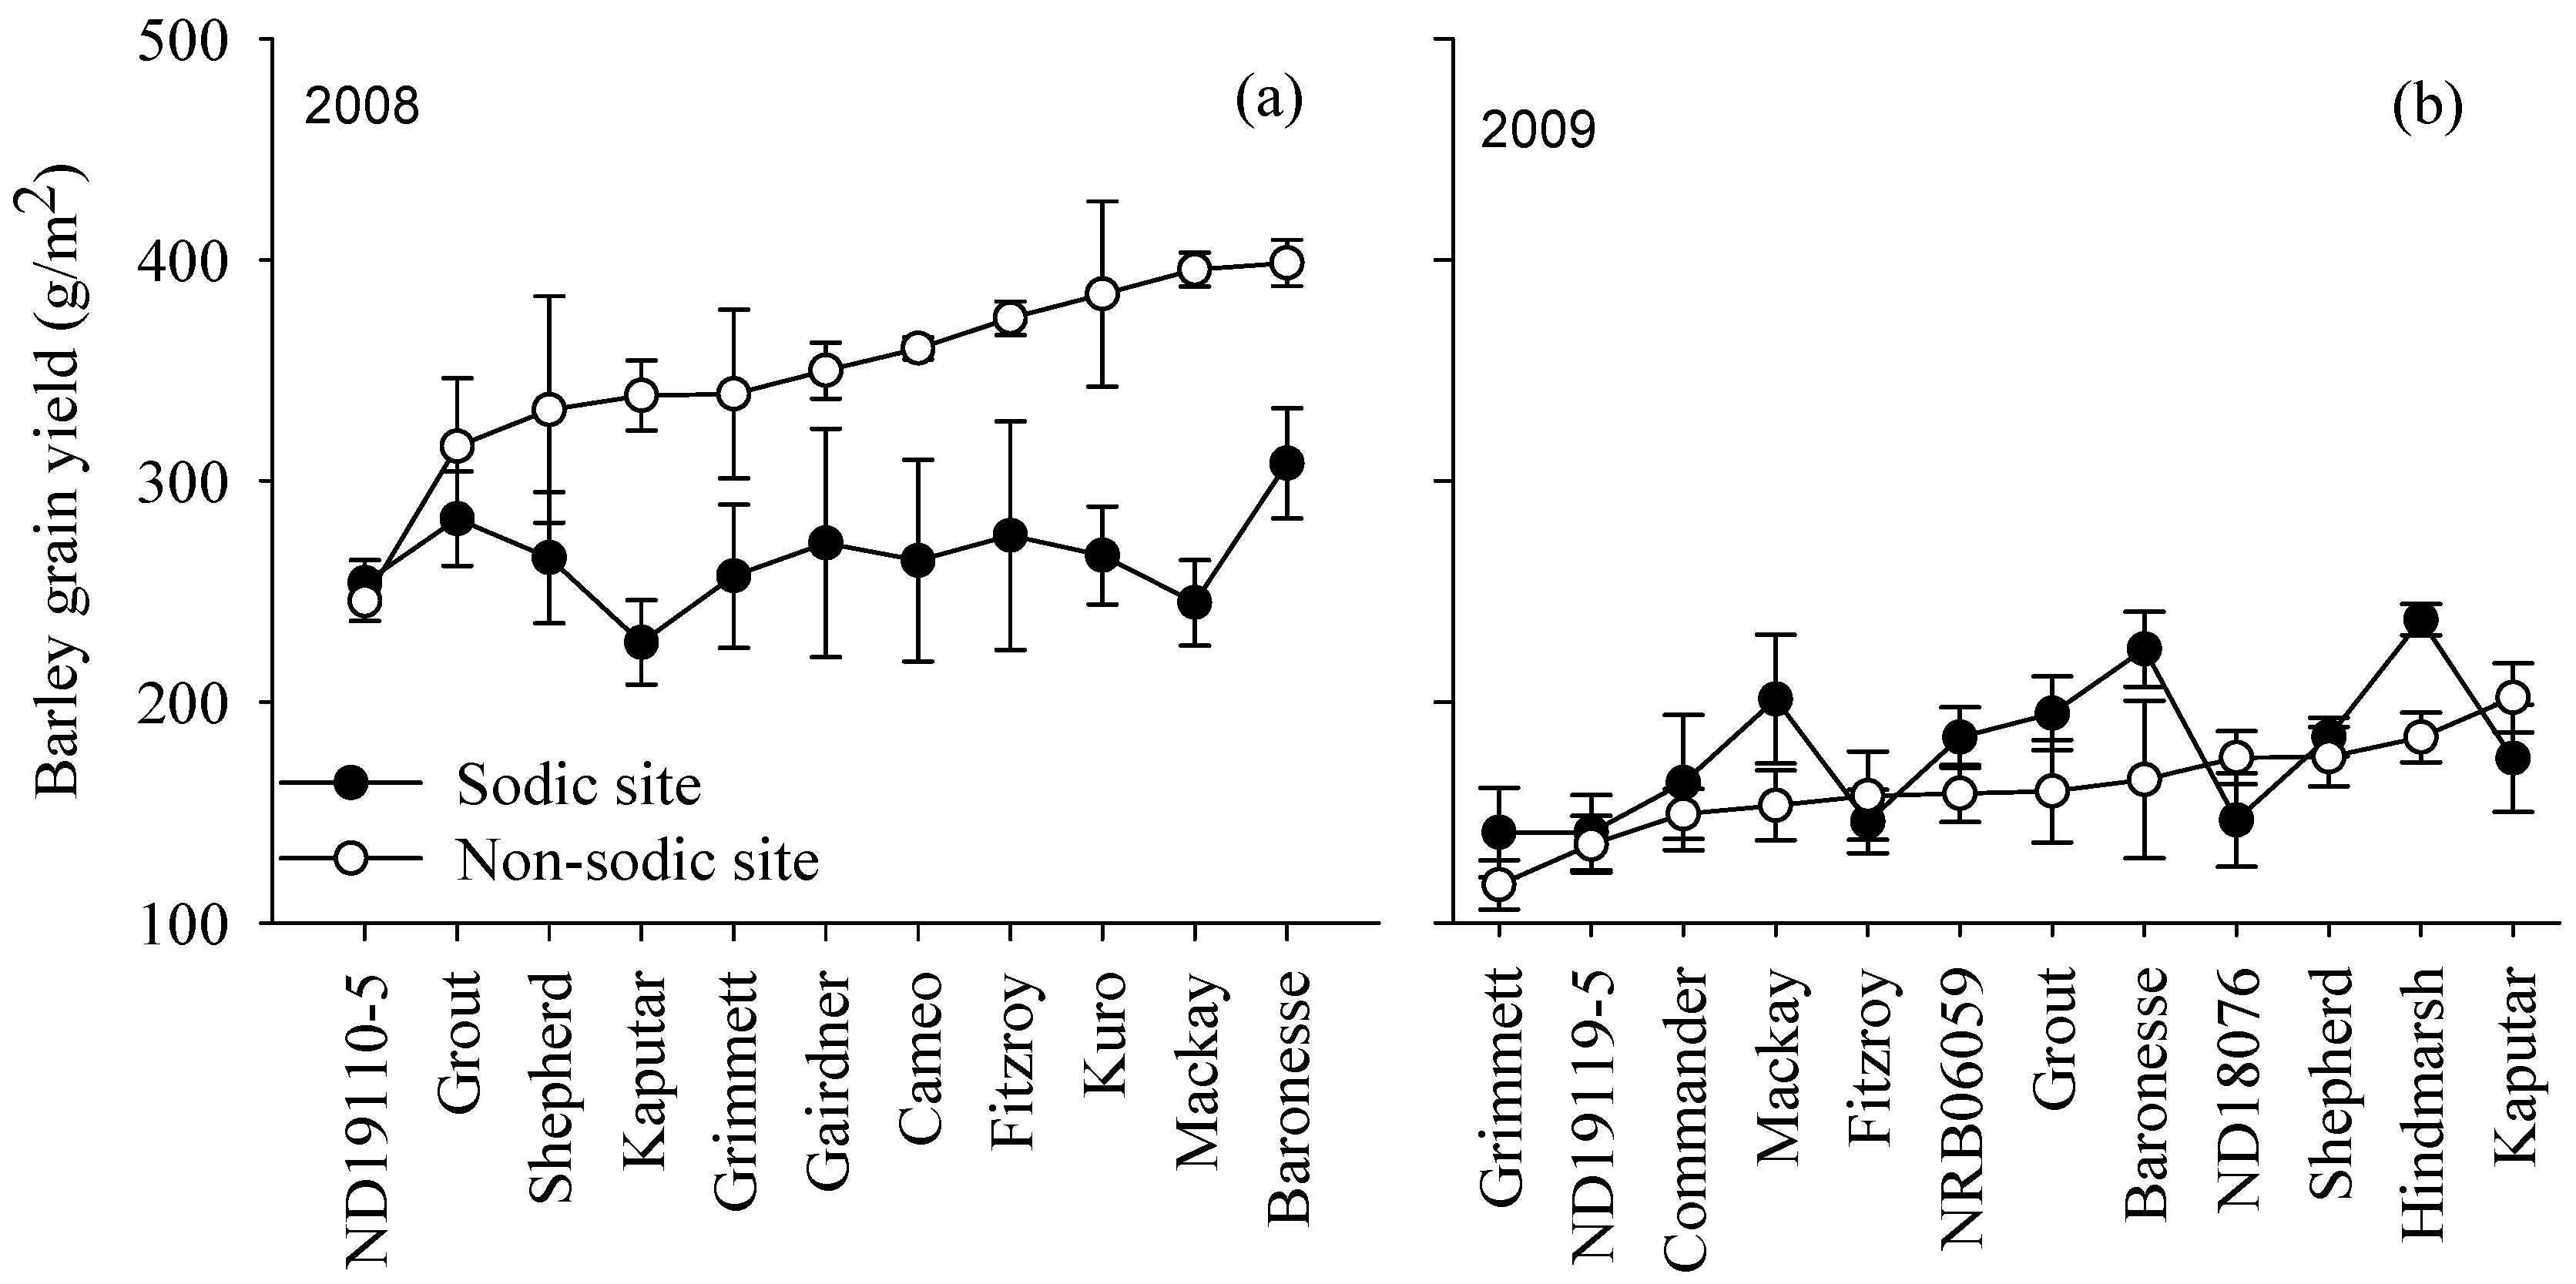
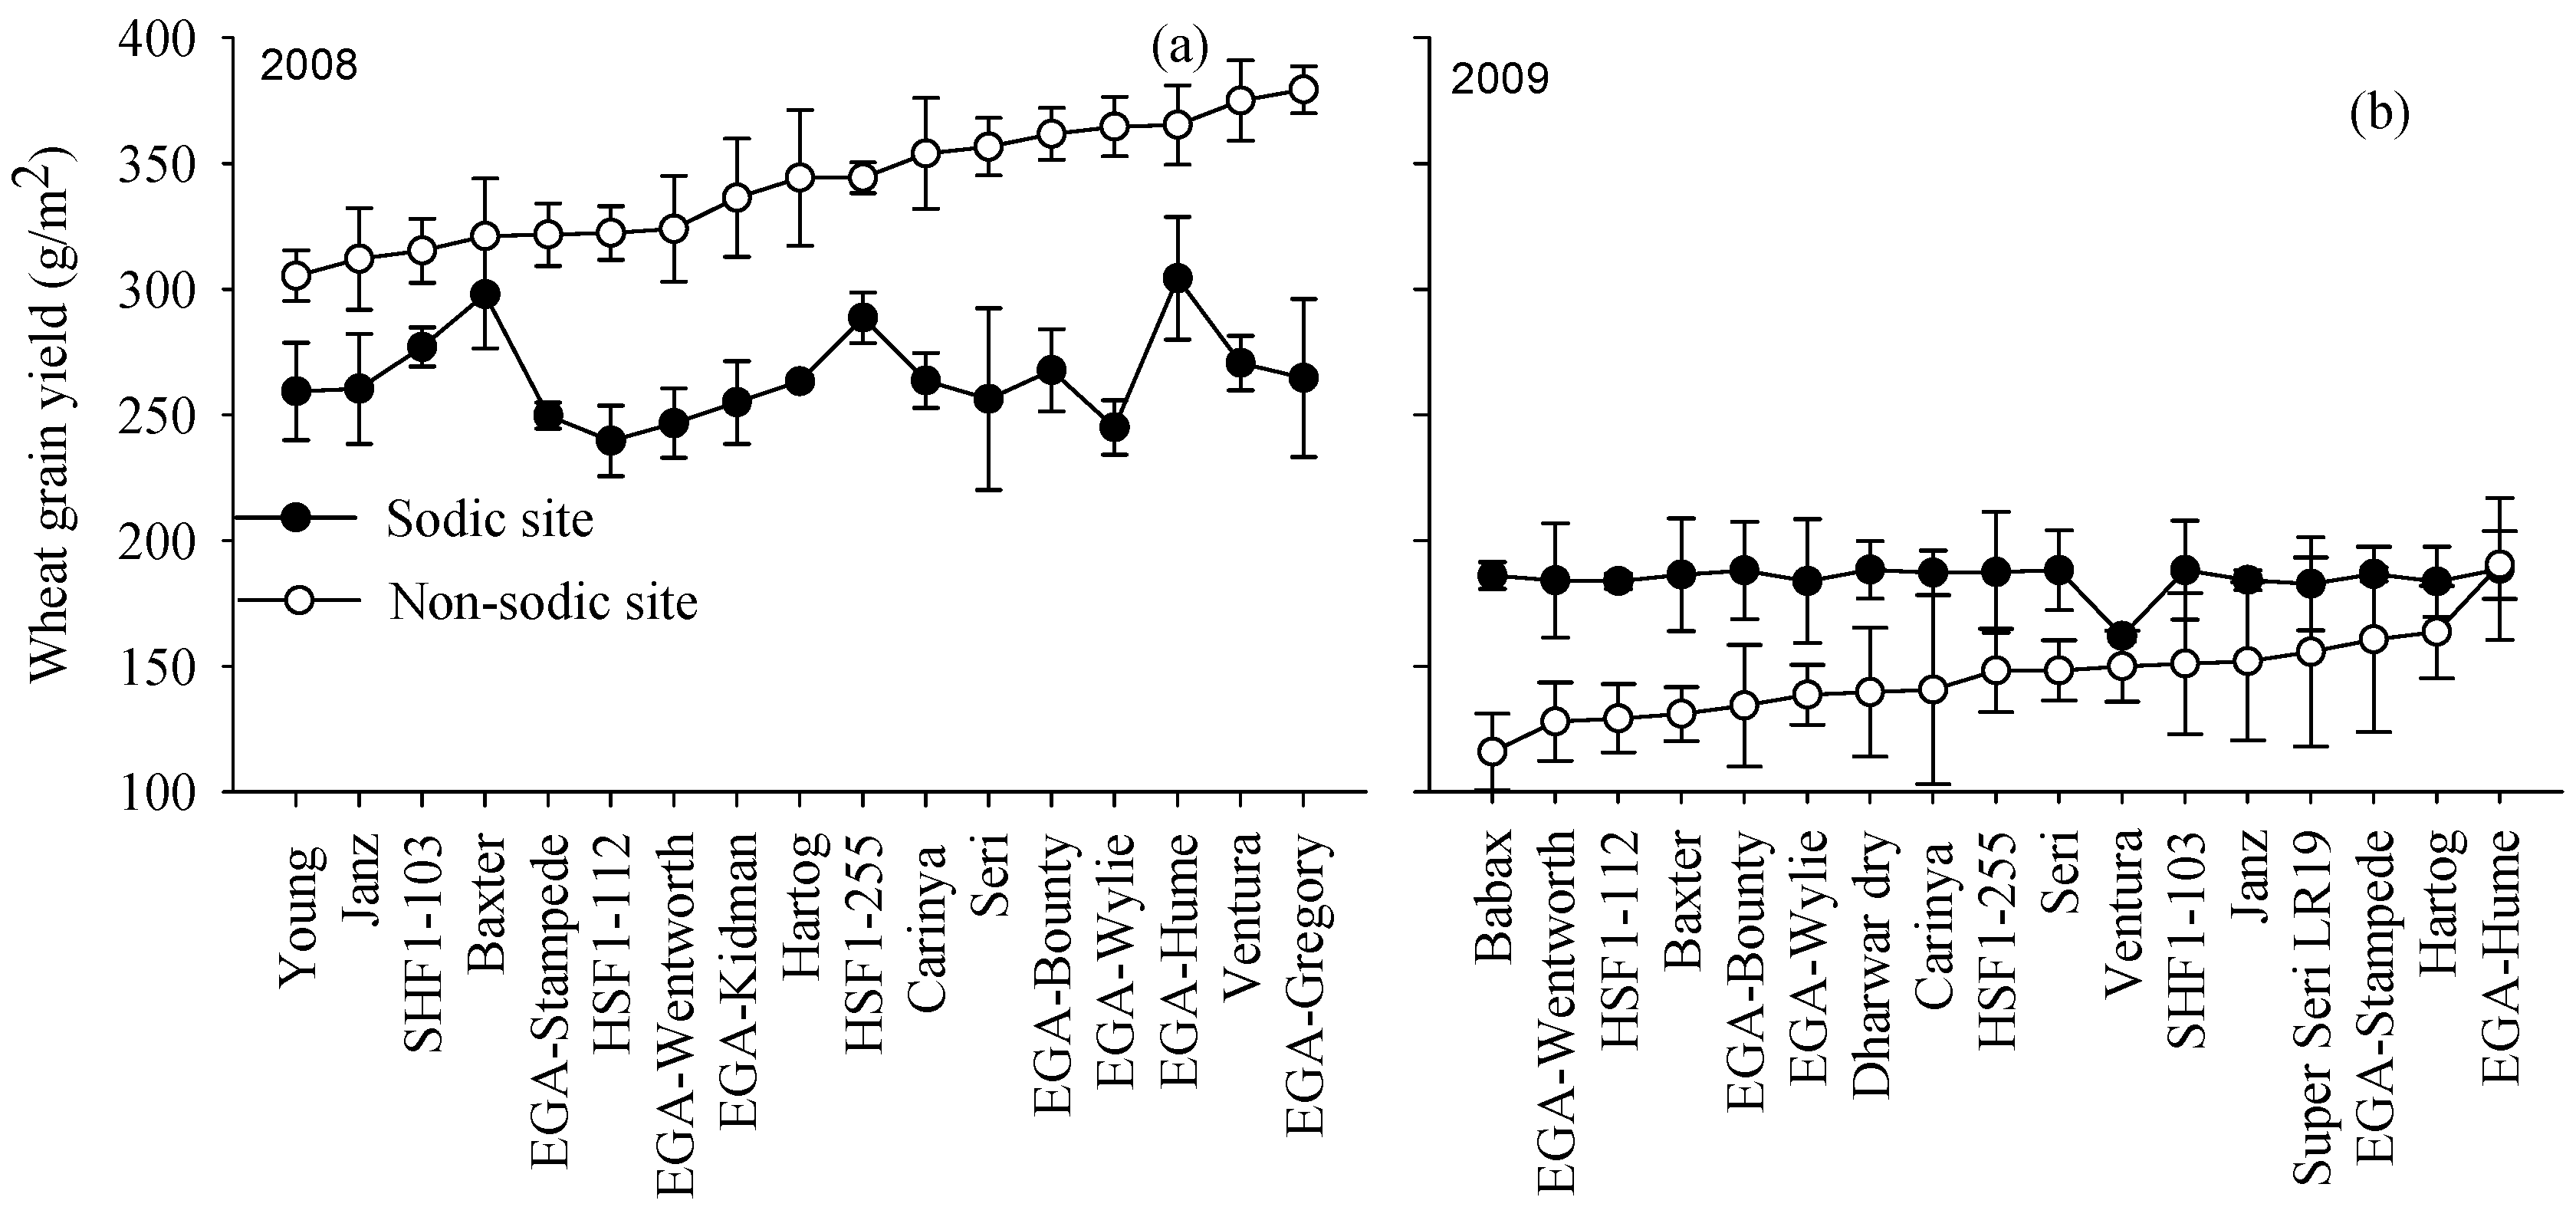
3.4. Yield Rankings for Genotypes Varied with Soil Constraints
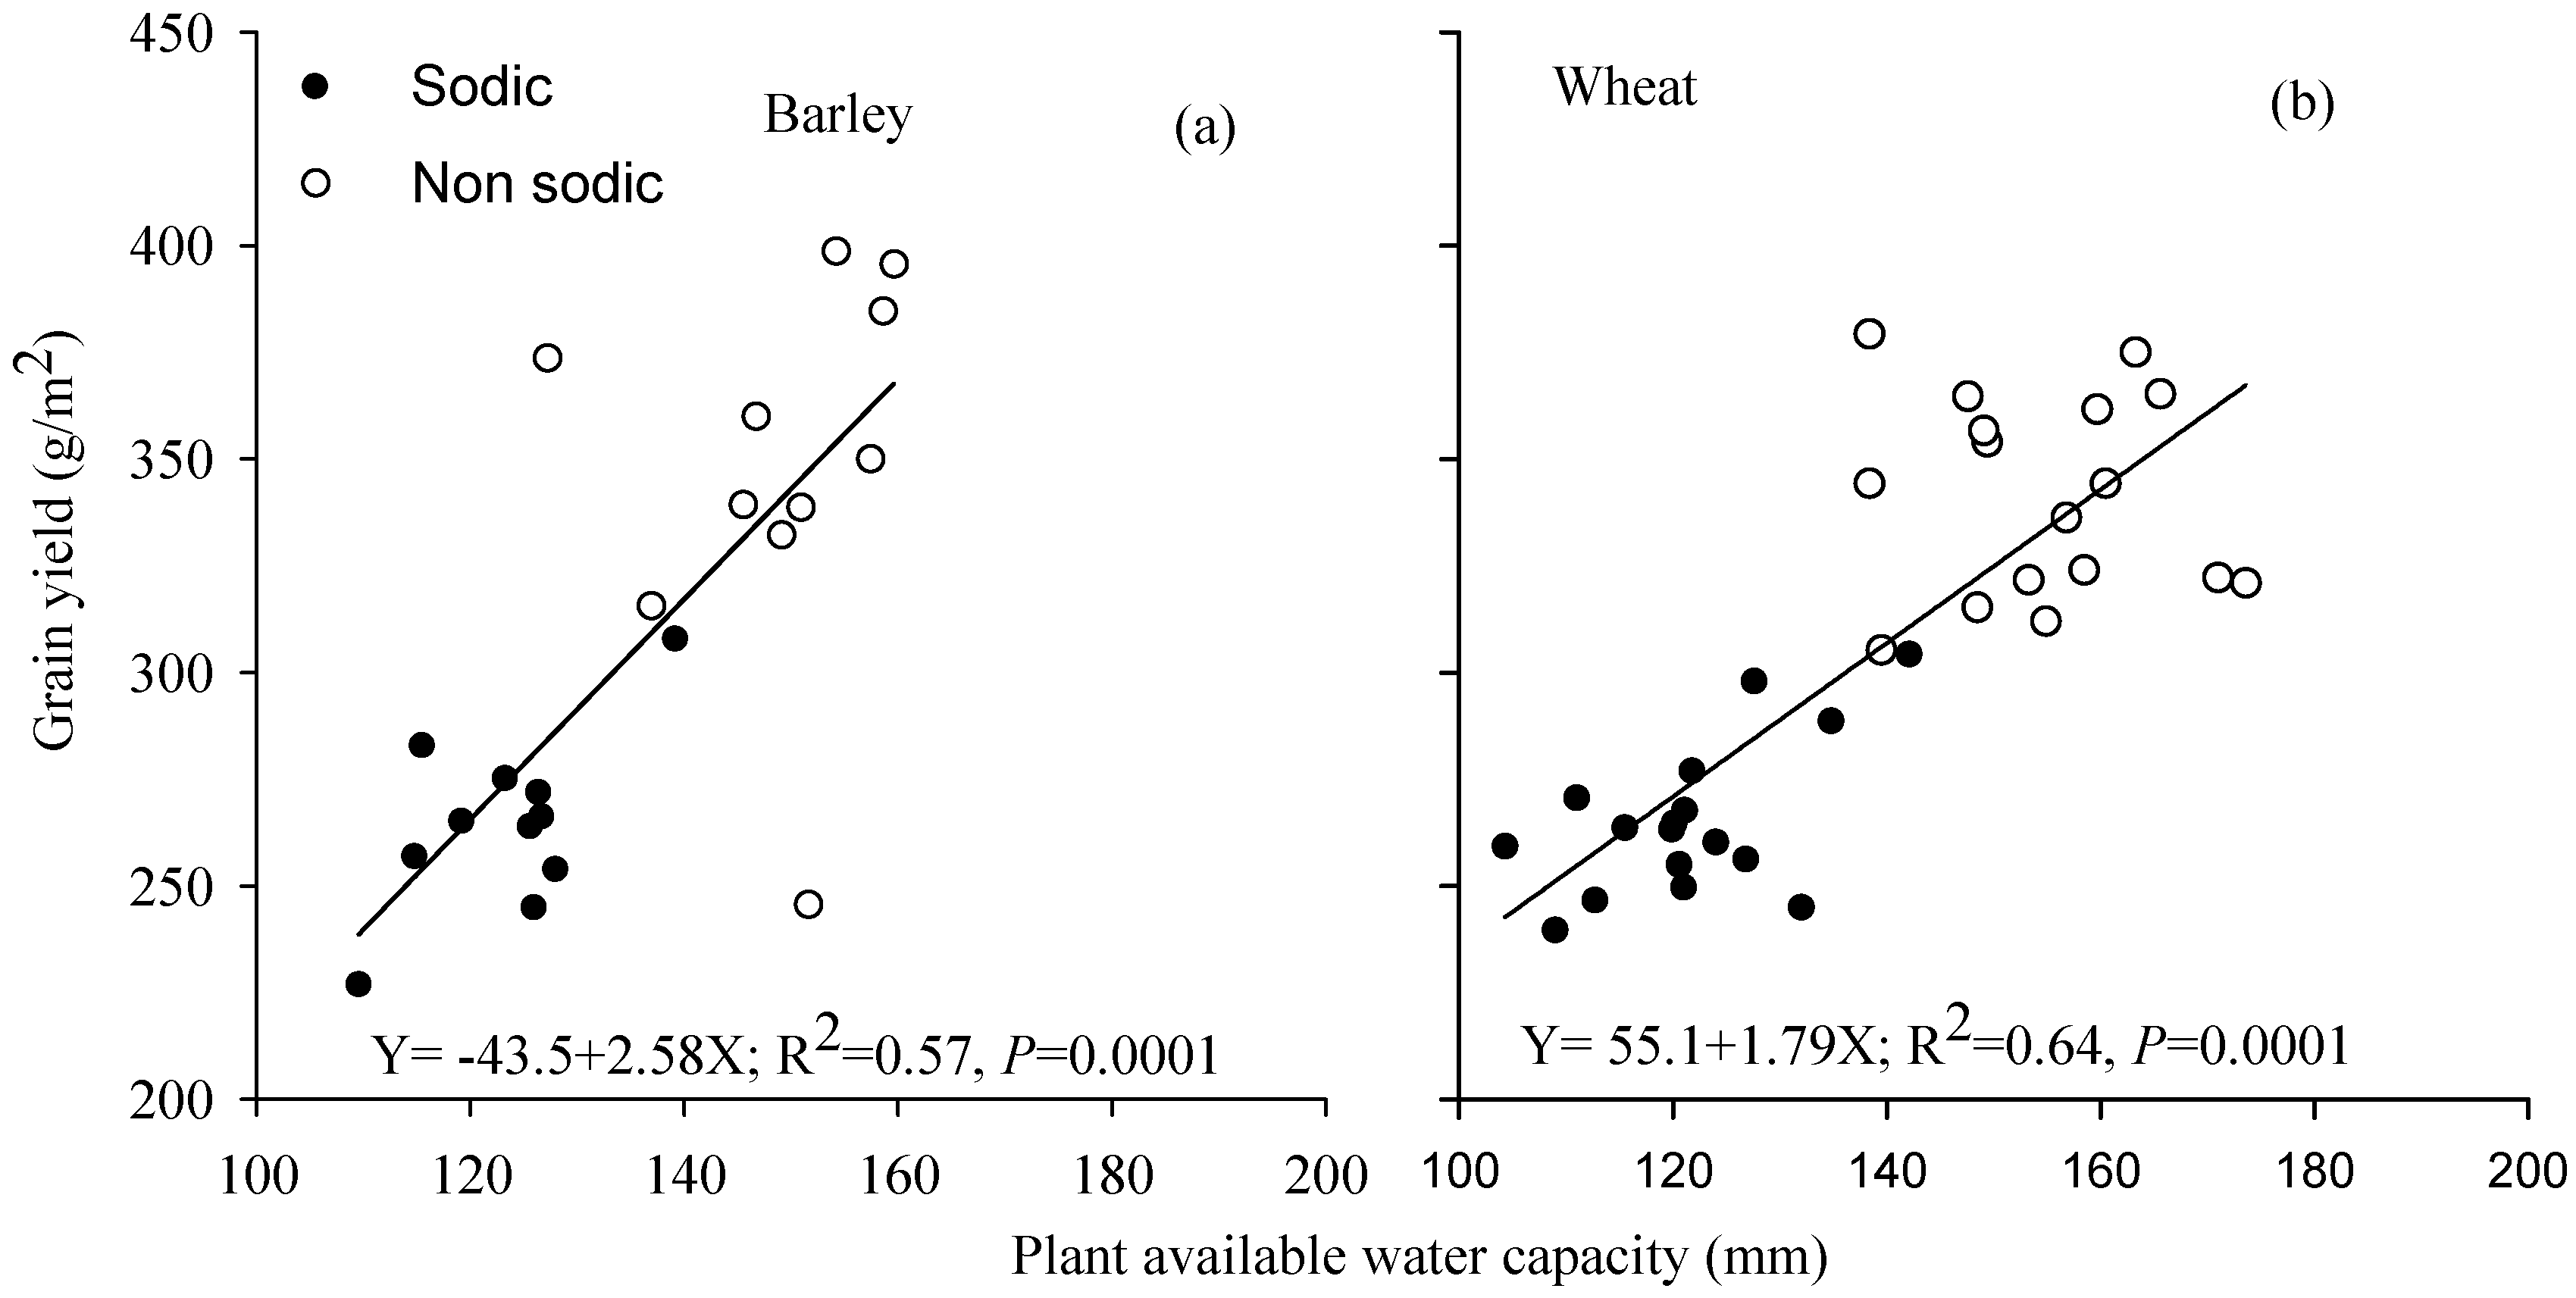
3.5. Relationship between Grain Yield and Plant Available Water Capacity
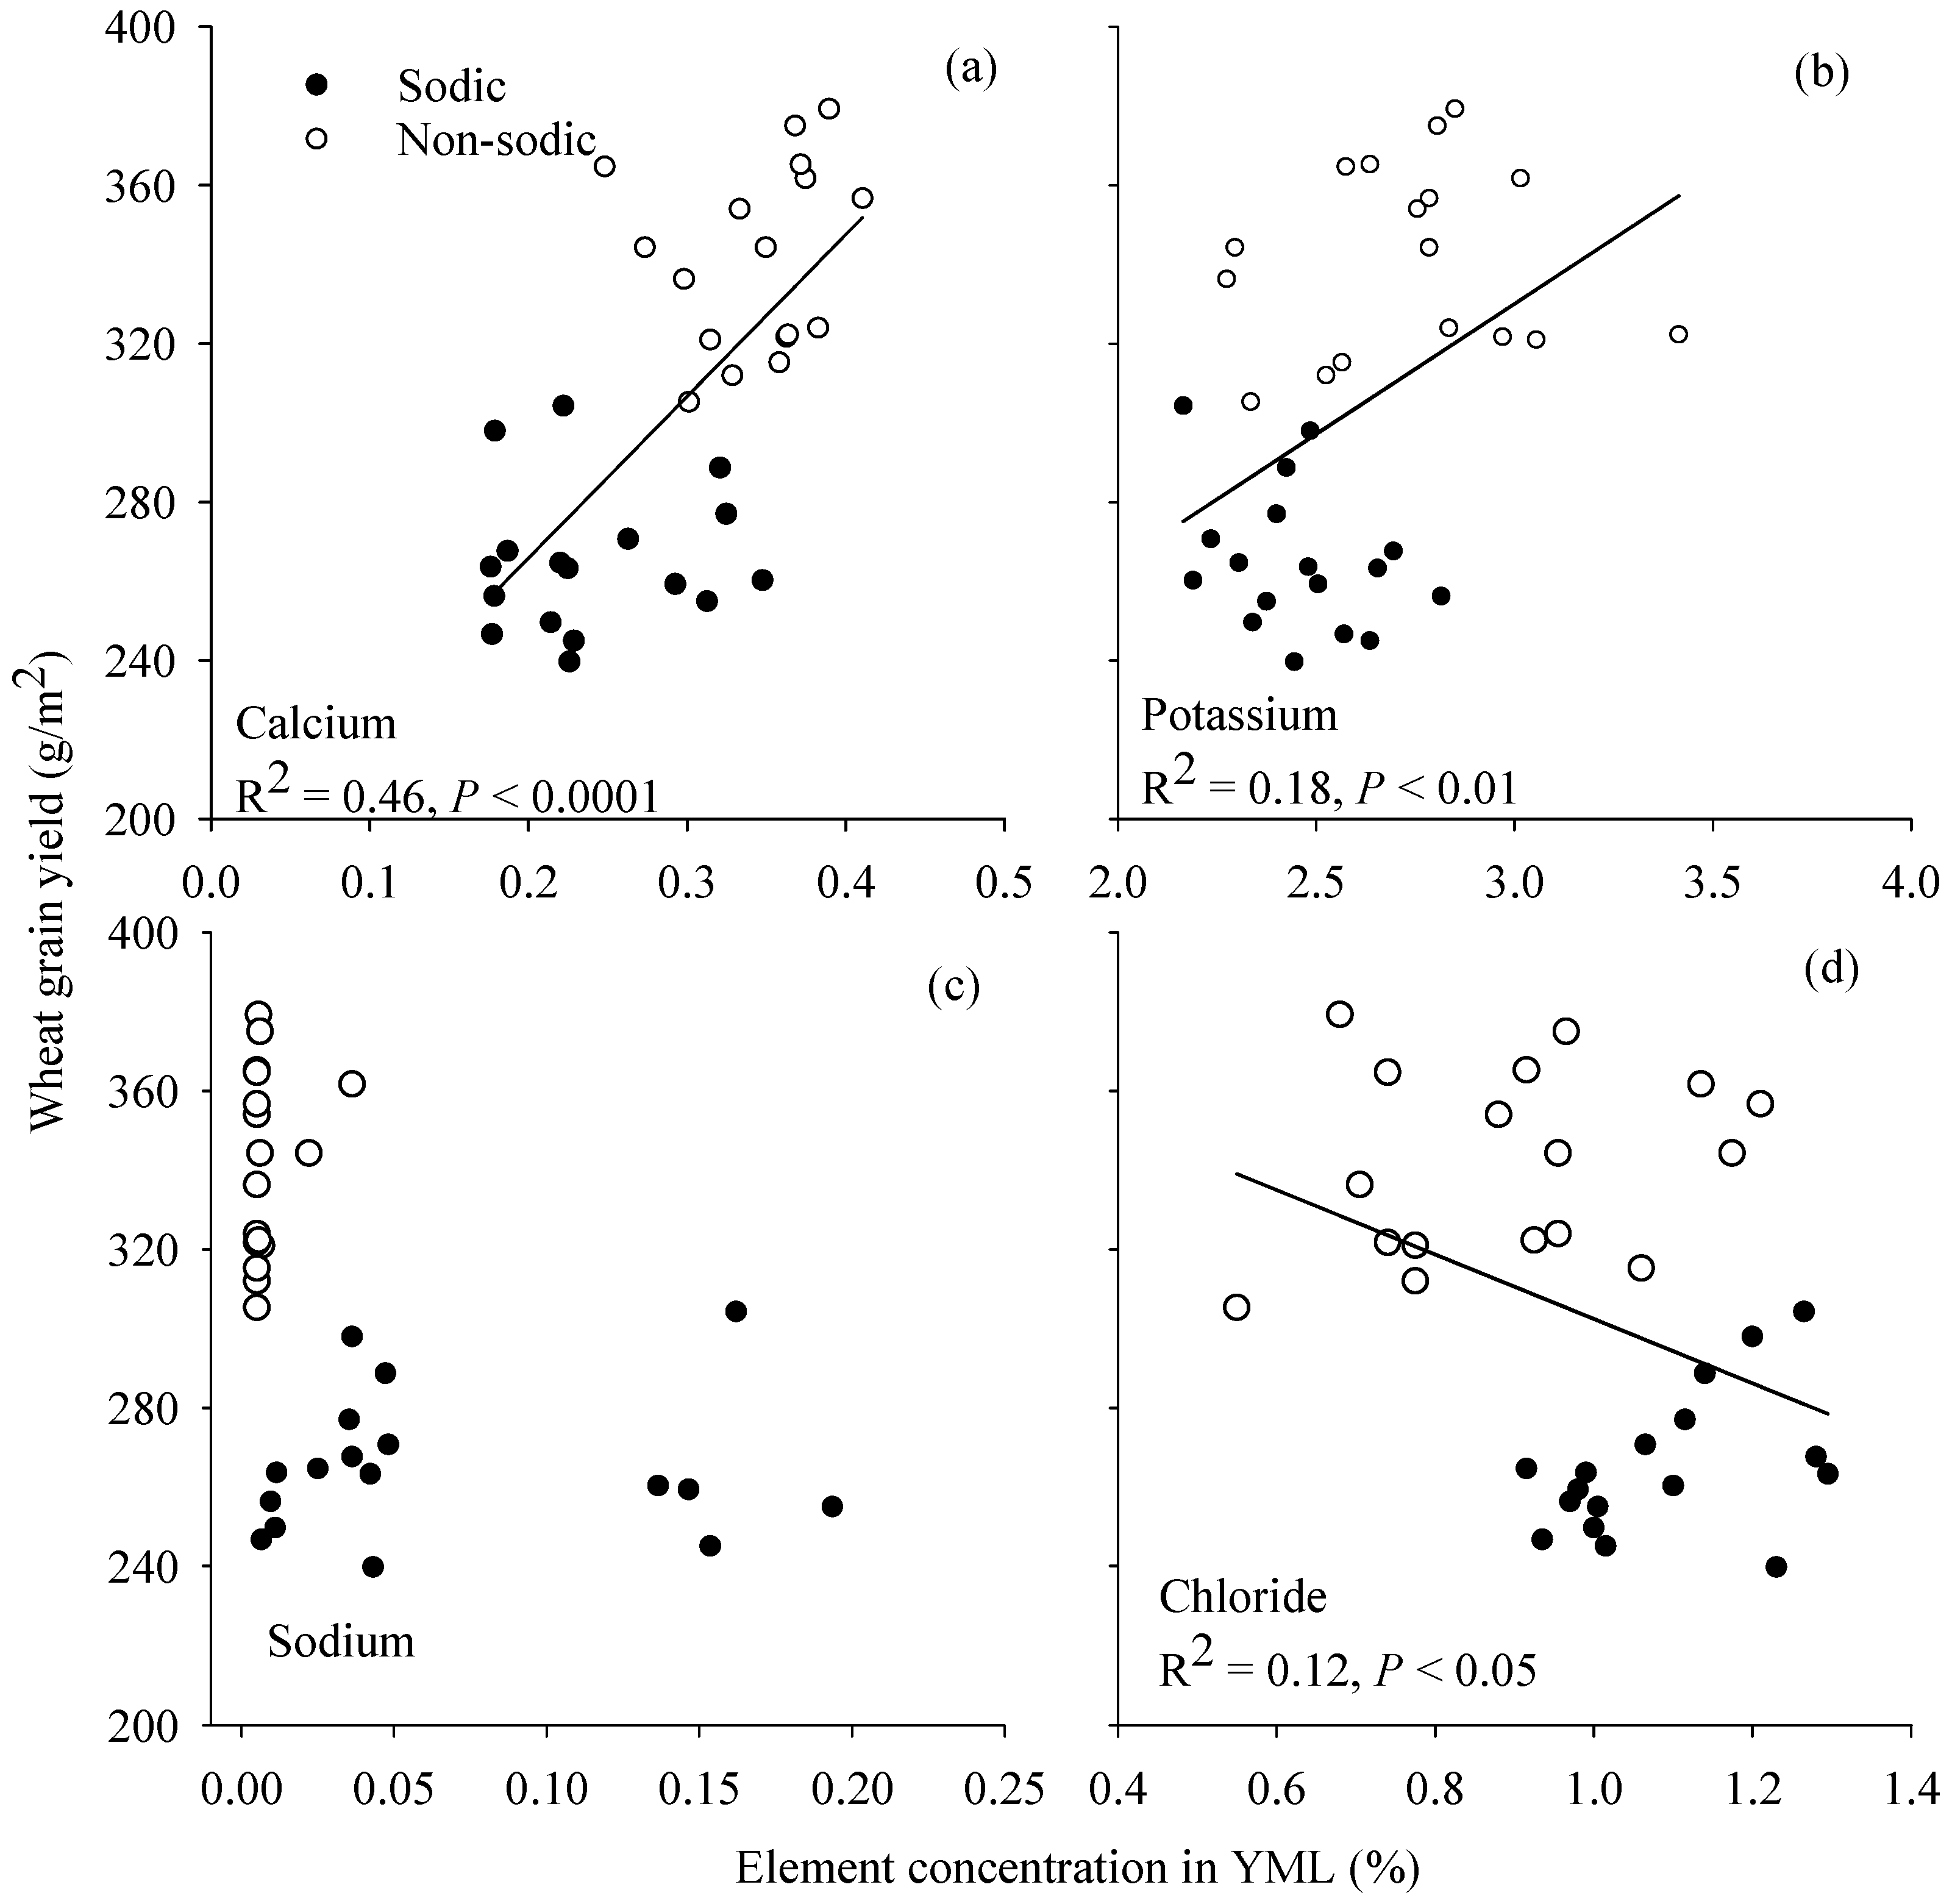
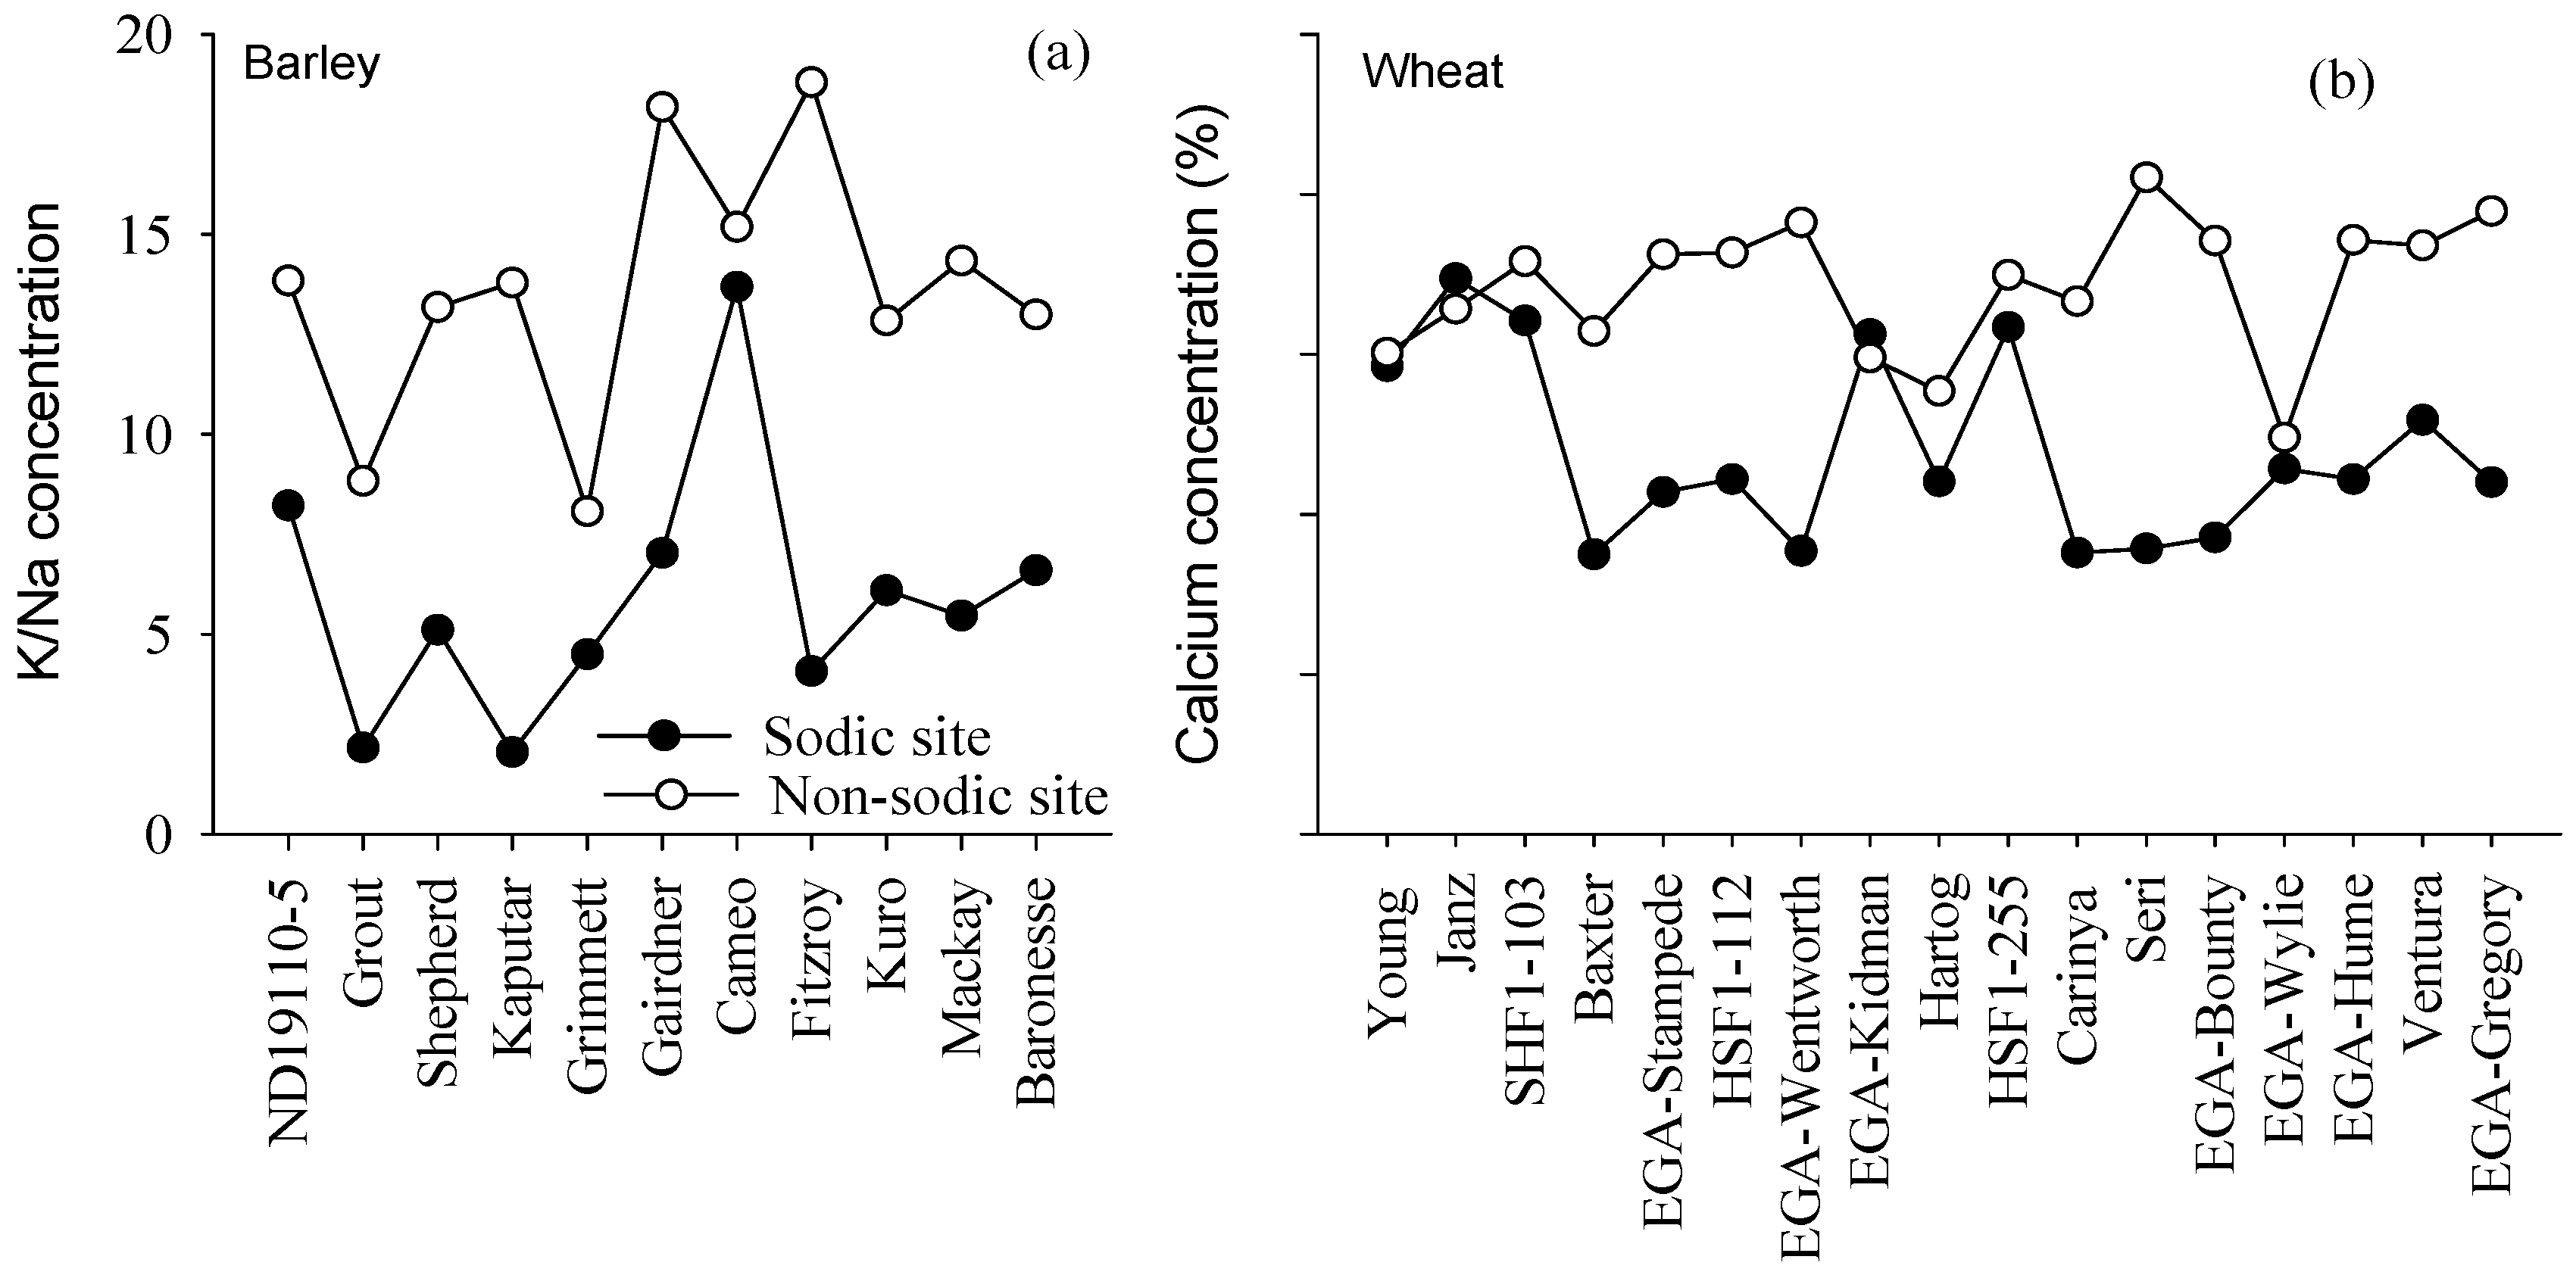
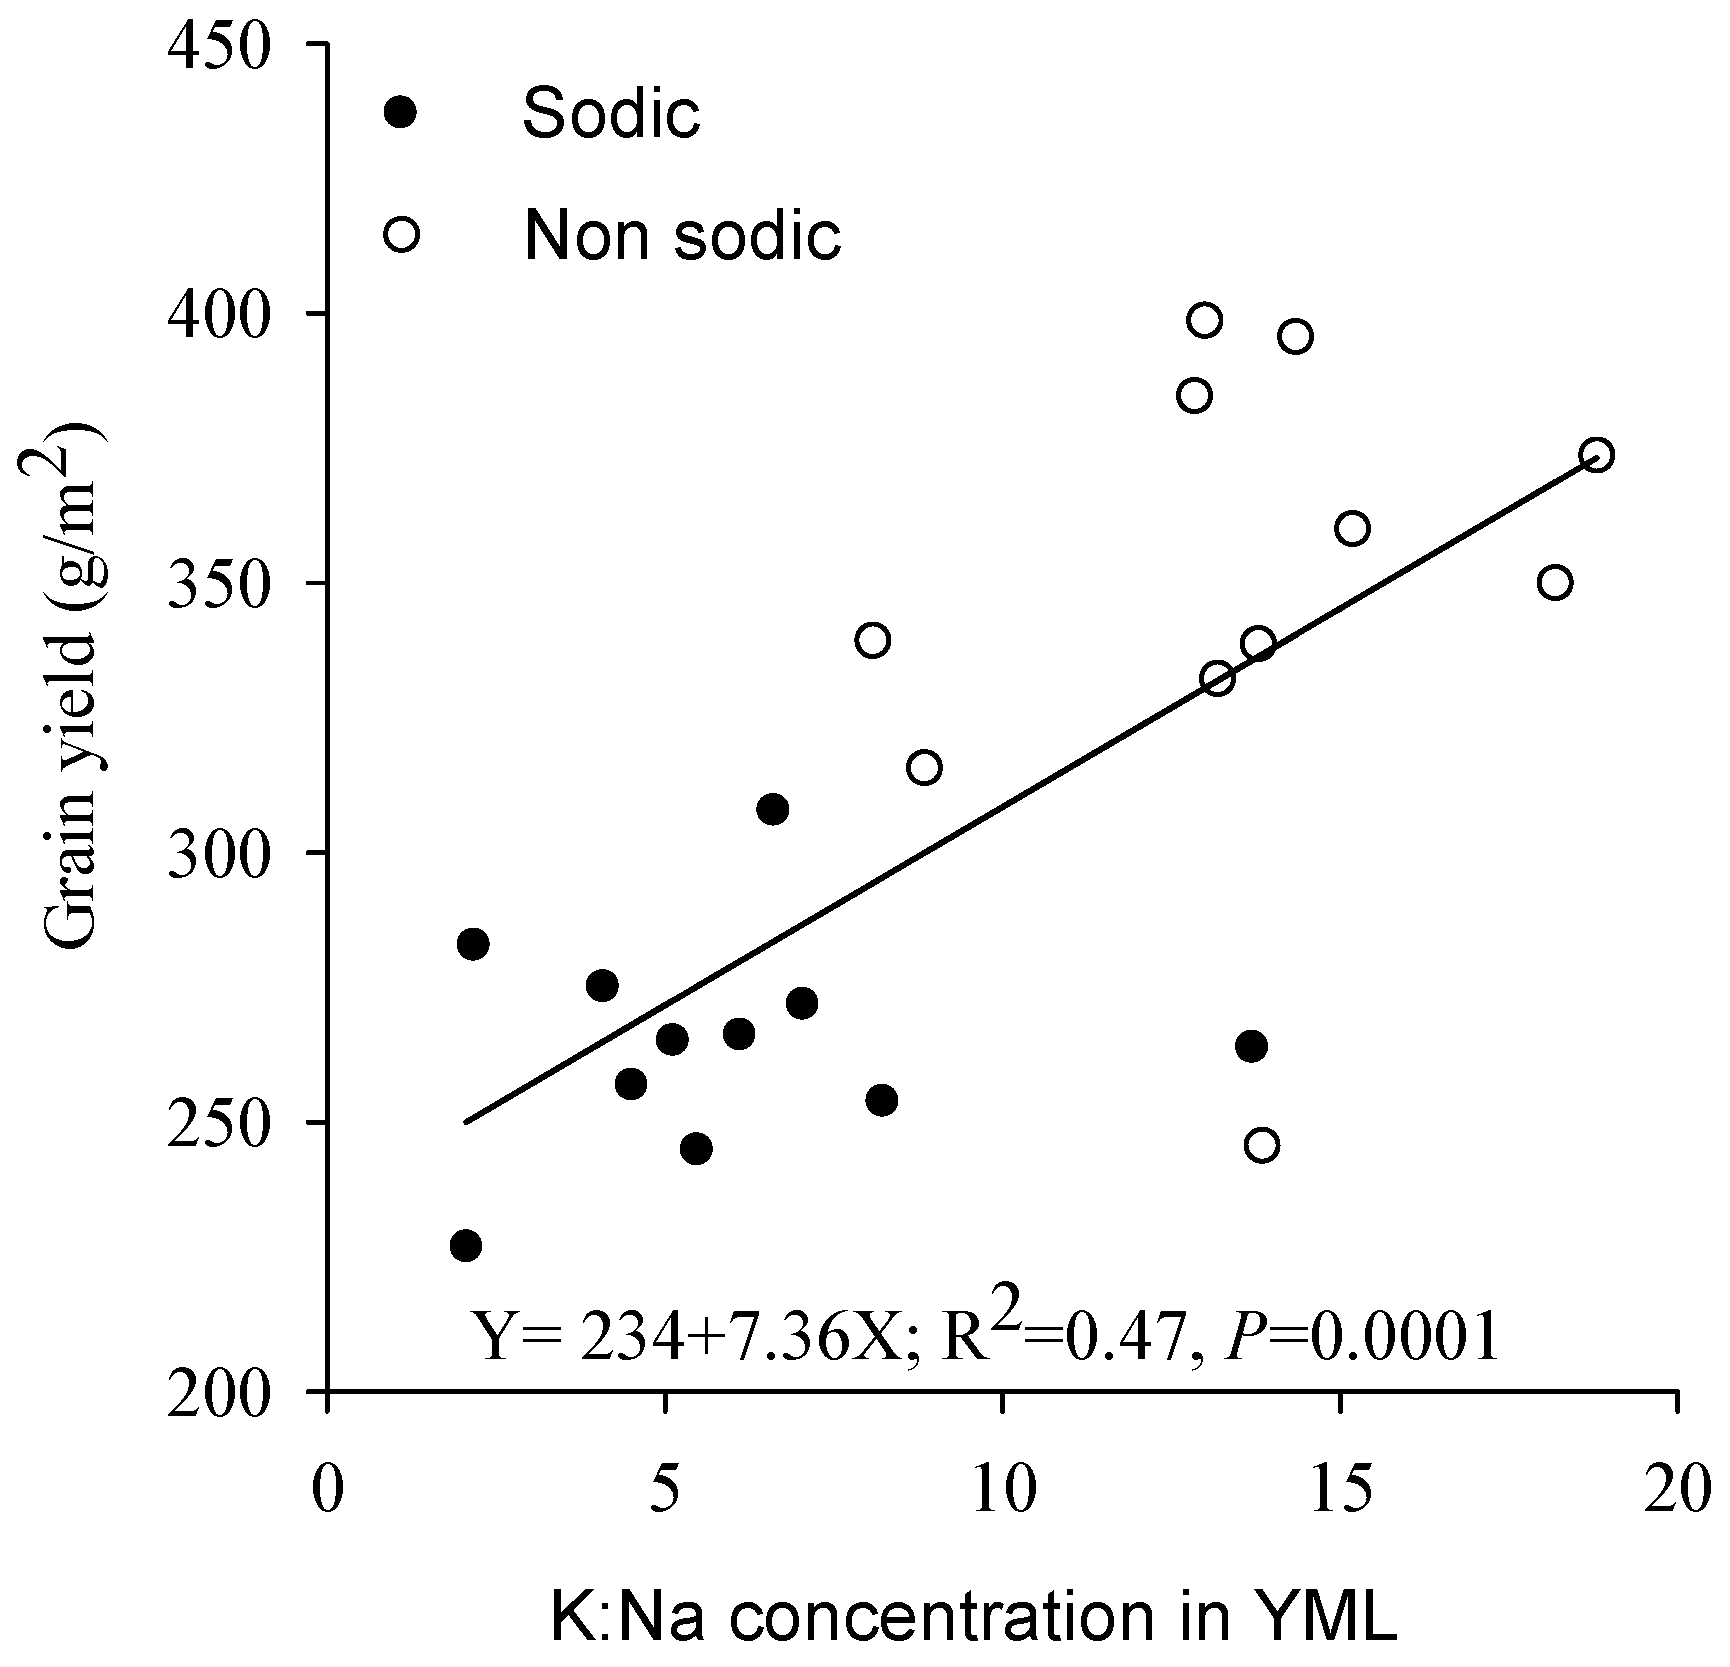
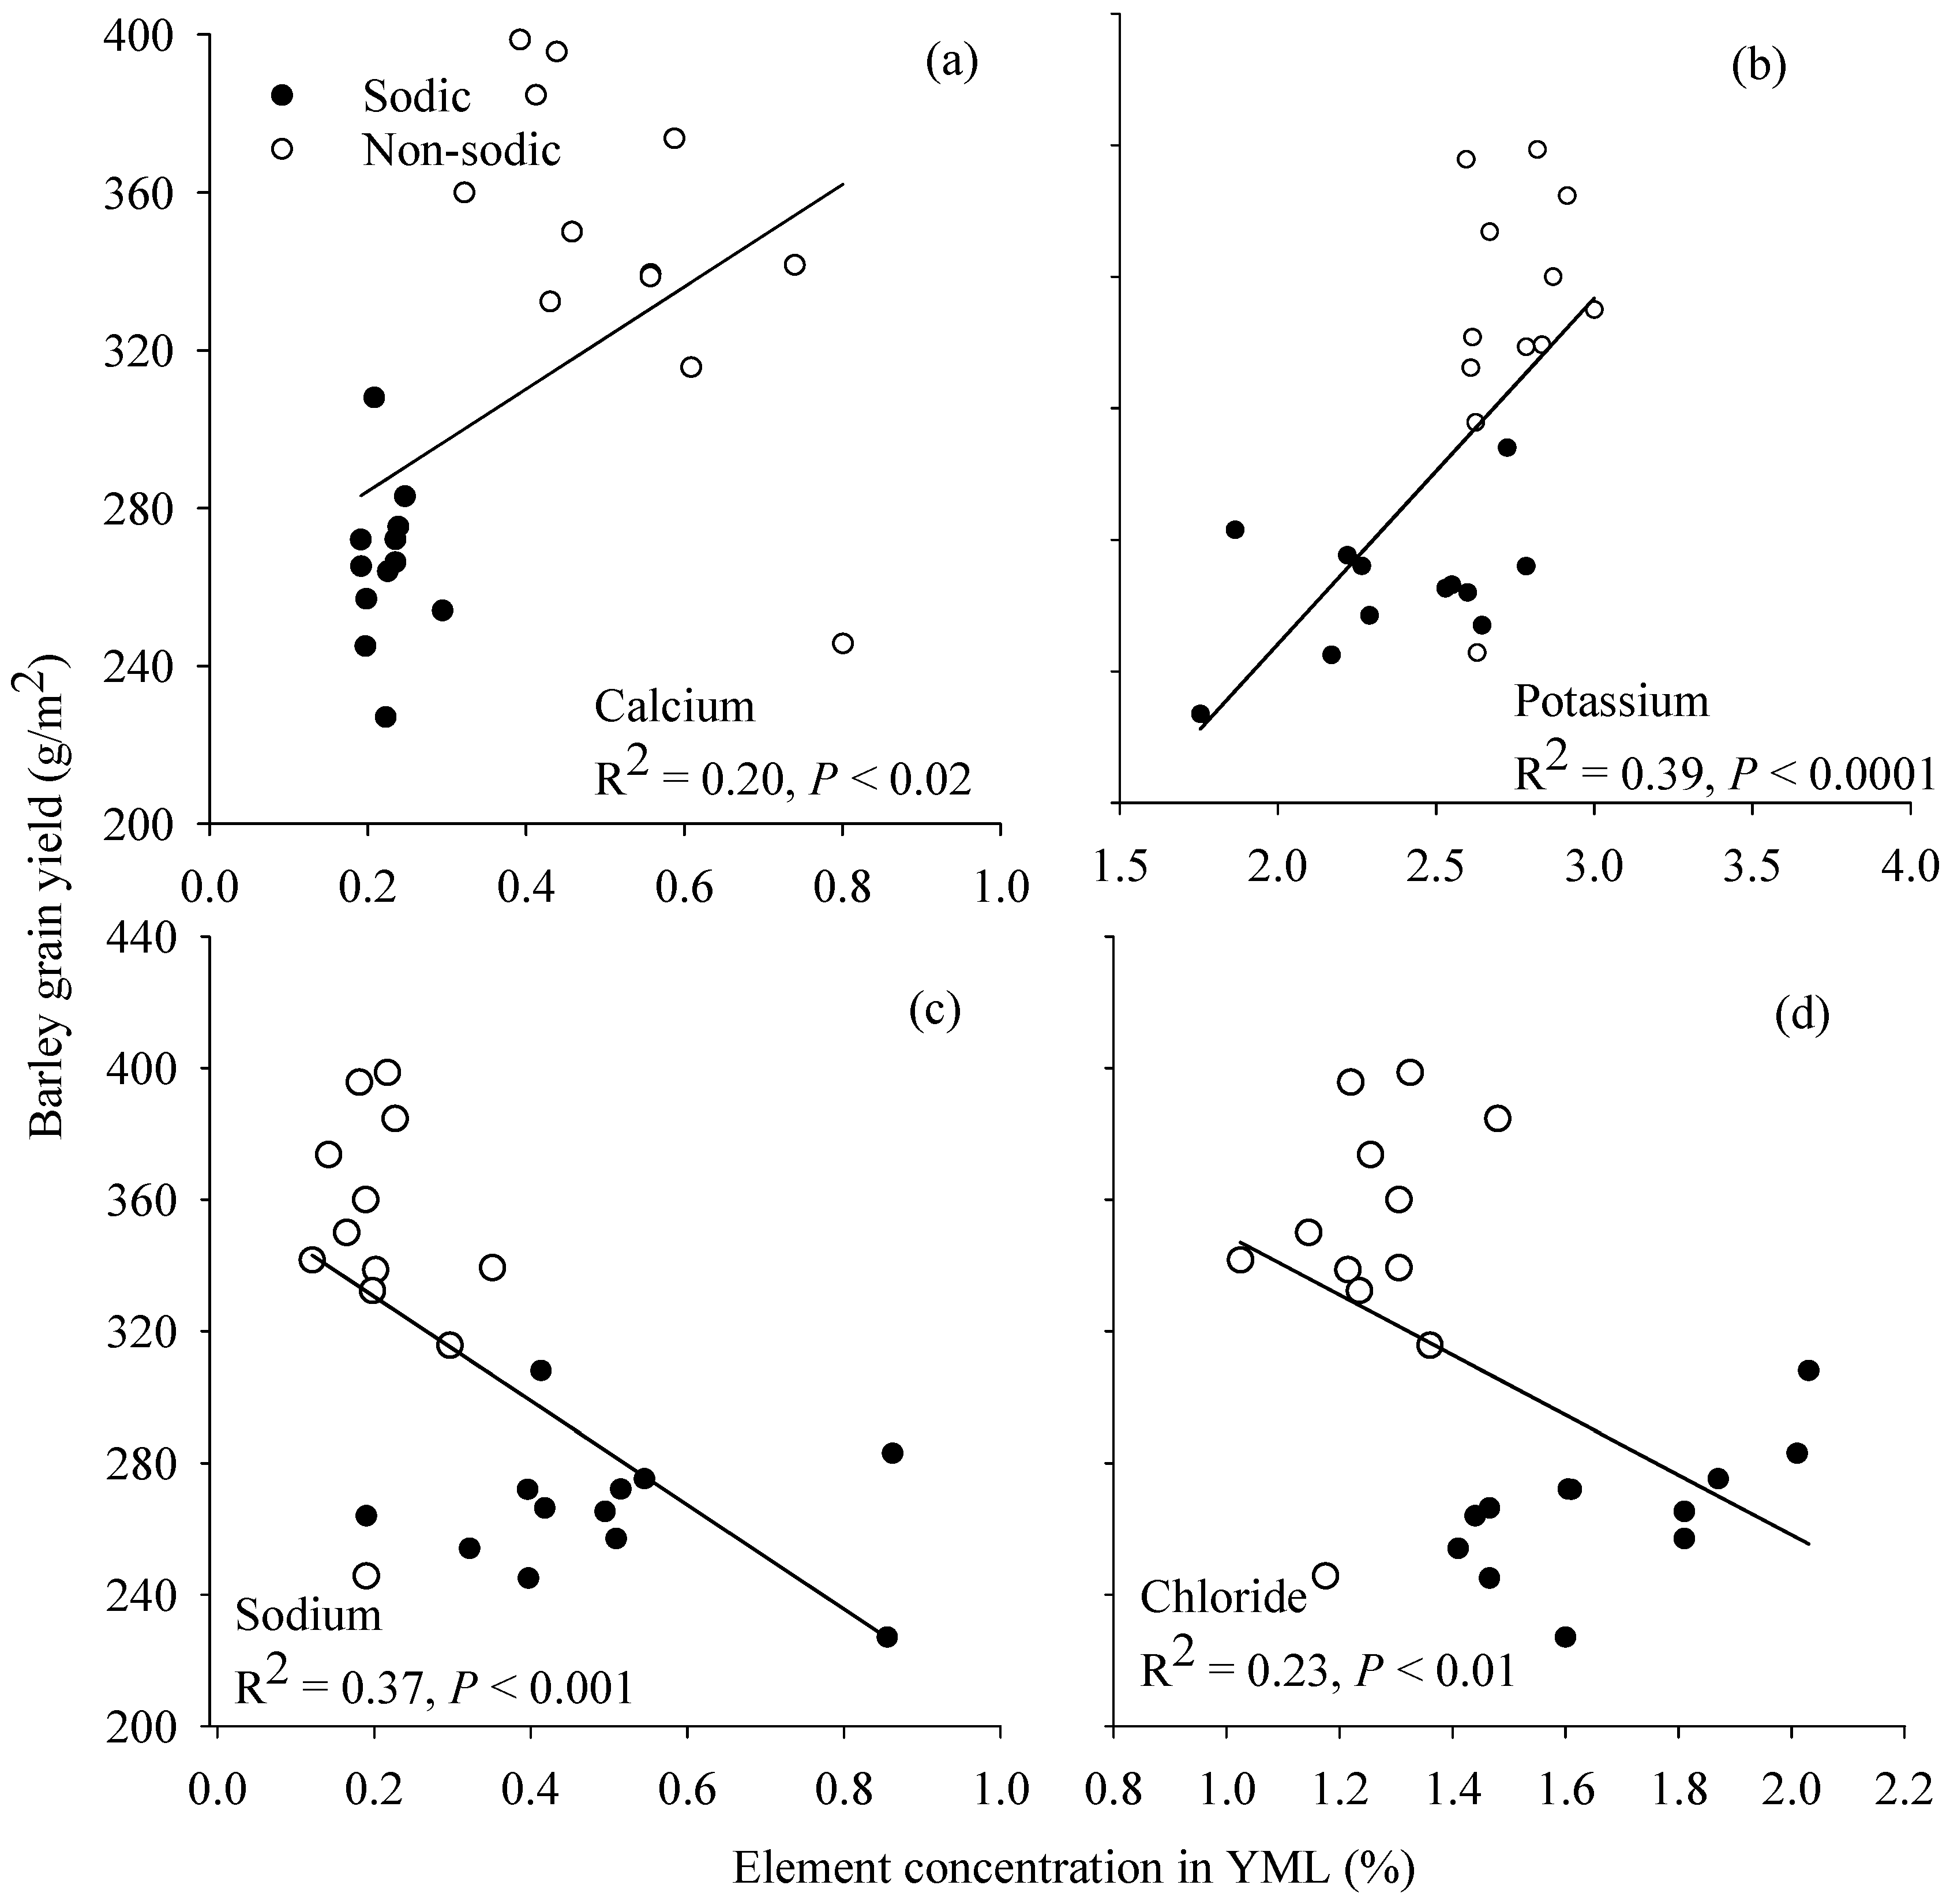
3.6. Relationship between Grain Yield and Element Concentration in Young Mature Leaf
4. Discussion
4.1. Genetic Variation Indicates that the Crop Performance under Non-Sodic Conditions Is Not a Good Indicator of Crop Performance in the Presence of Sodic Soils
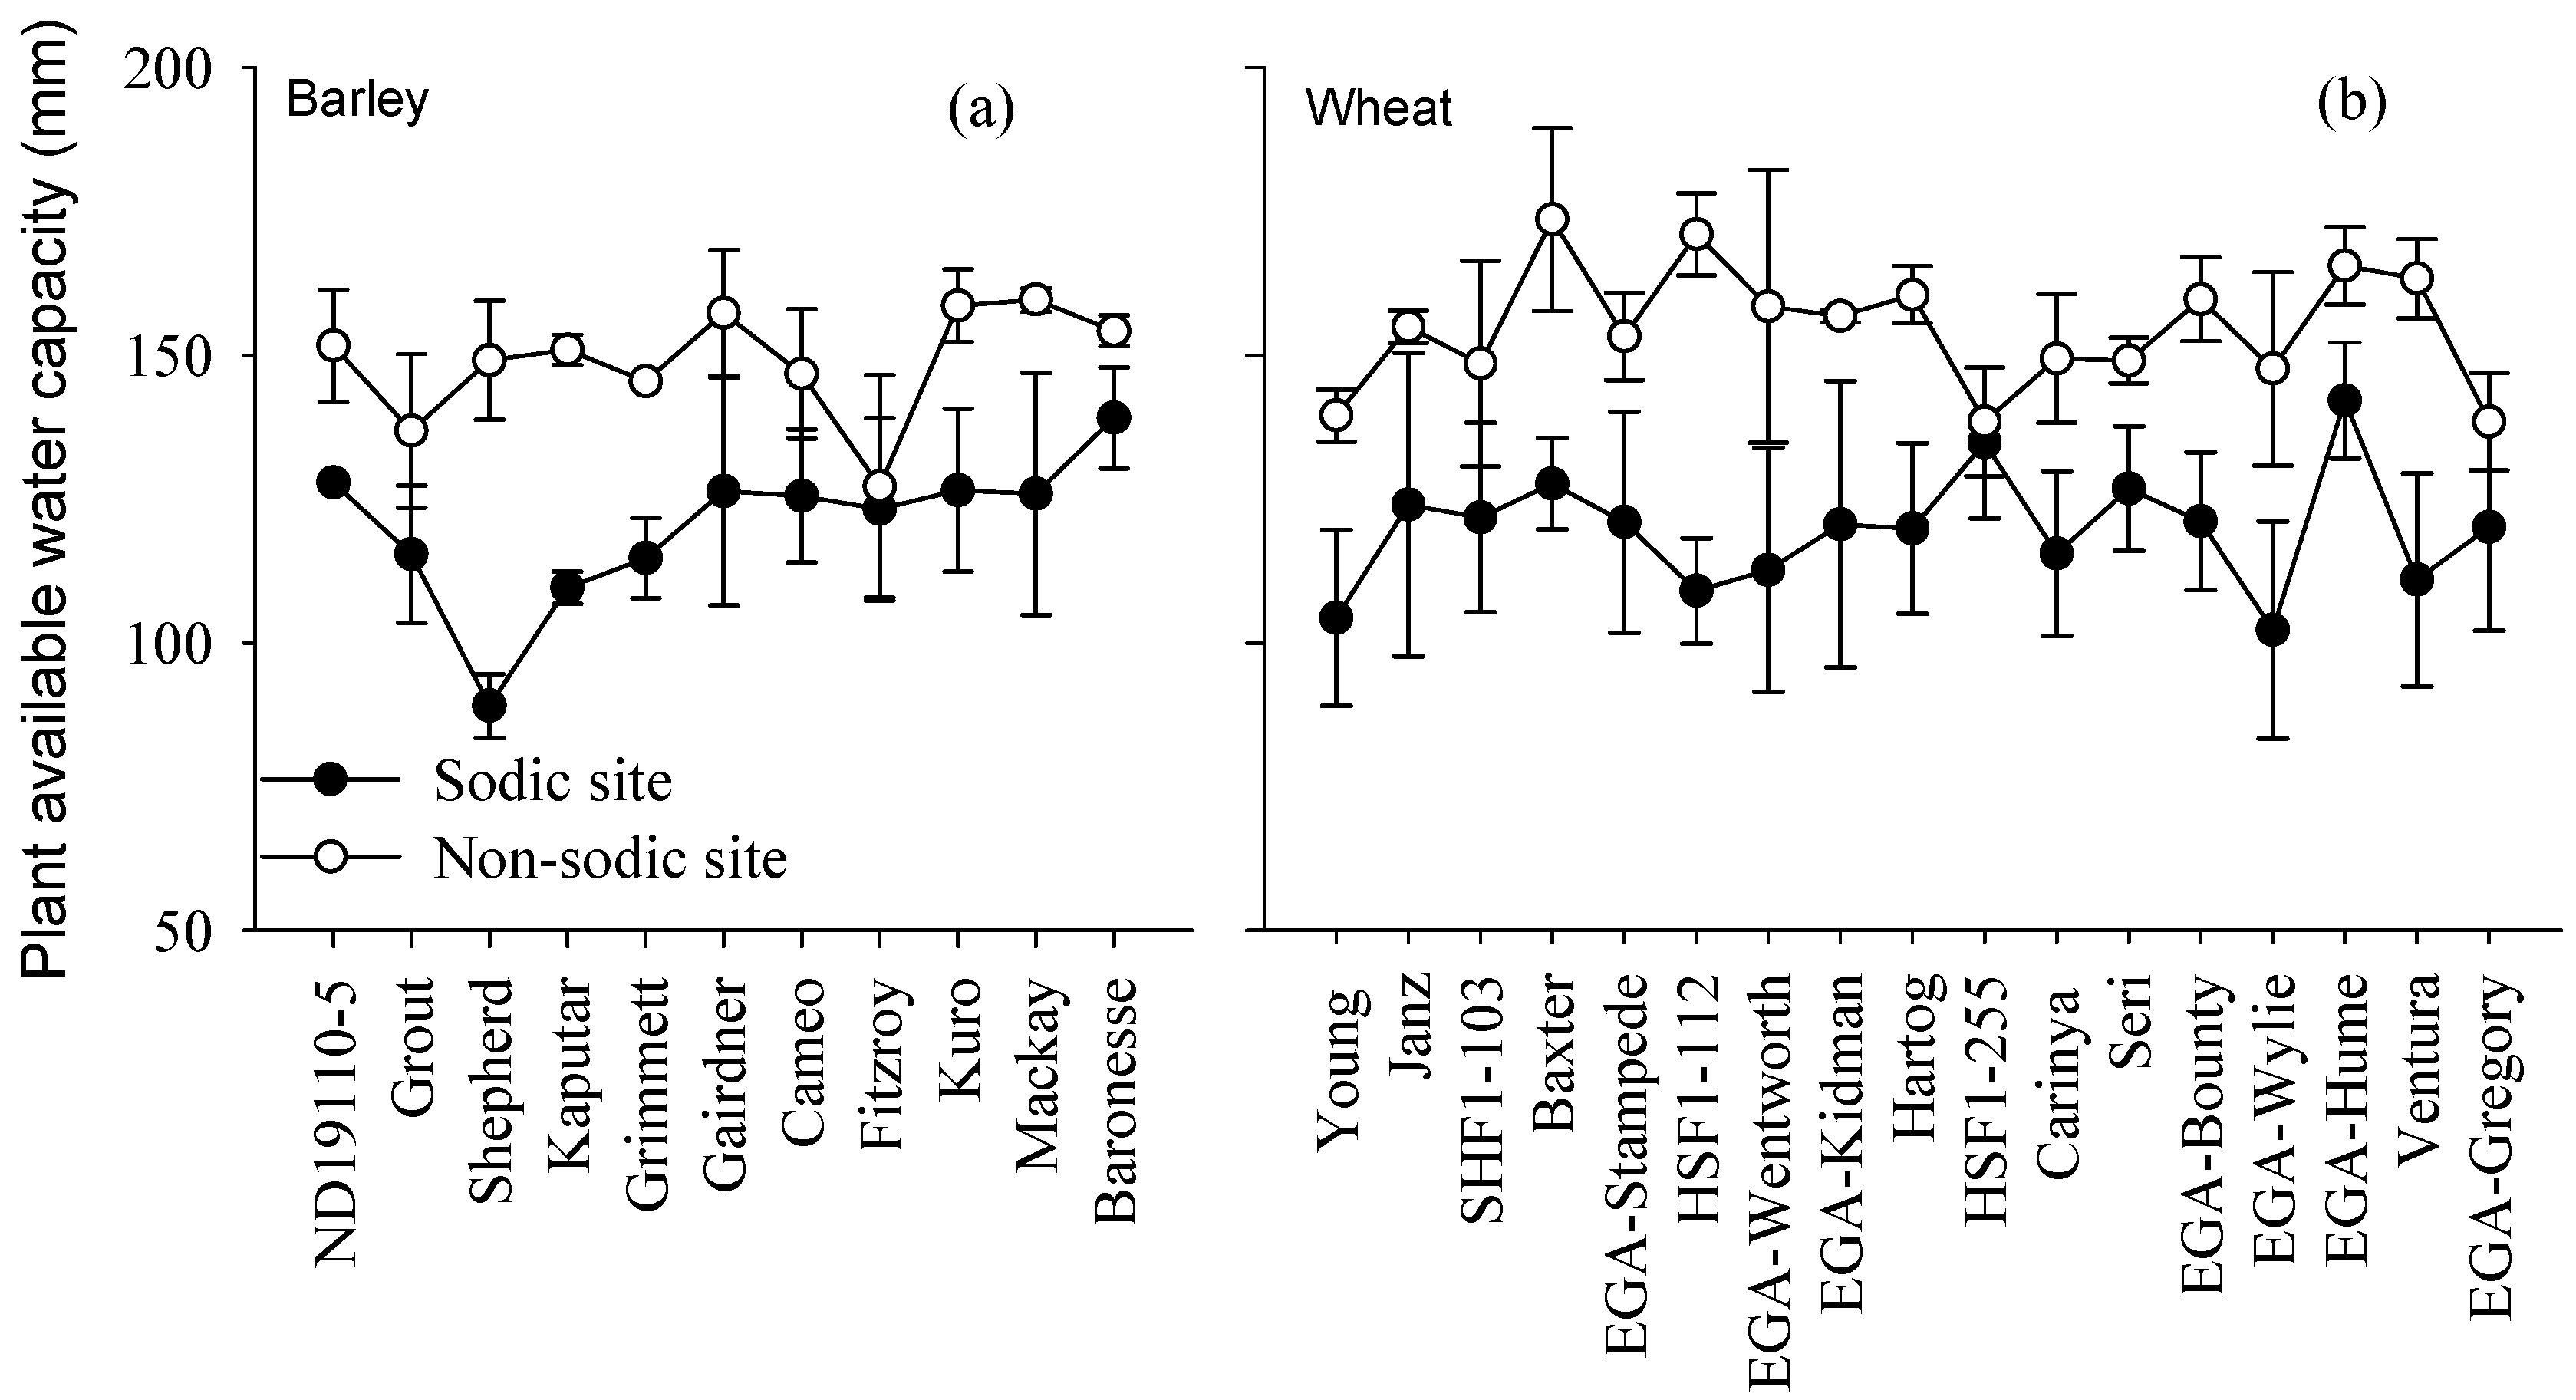
4.2. Differences in Soil Moisture Extraction (PAWC) Were the Major Determinant of Performance Differences in the Face of Sodic Soils with Sub-Soil Constraints
4.3. Concentrations of Ca in Wheat and K:Na Ratio in Barley May Be Good Surrogate Traits to Select for Adaptation to Soil Constraints
5. Conclusions
Acknowledgments
Author Contributions
Conflicts of Interest
References
- Dang, Y.P.; Dalal, R.C.; Routley, R.; Schwenke, G.D.; Daniells, I. Subsoil constraints to grain production in the cropping soils of the north-eastern region of Australia: An overview. Aust. J. Exp. Agric. 2006, 46, 19–35. [Google Scholar] [CrossRef]
- Dang, Y.P.; Dalal, R.C.; Buck, S.R.; Harms, B.; Kelly, R.; Hochman, Z.; Schwenke, G.D.; Biggs, A.J.W.; Ferguson, N.J.; Norrish, S.; et al. Diagnosis, extent, impacts, and management of subsoil constraints in the northern grains cropping region of Australia. Aust. J. Soil Res. 2010, 48, 105–119. [Google Scholar] [CrossRef]
- Rengasamy, P. Transient salinity and subsoil constrints to dryland farming in Australian sodic soil: An overview. Aust. J. Exp. Agric. 2002, 42, 351–361. [Google Scholar] [CrossRef]
- Dang, Y.P.; Dalal, R.C.; Mayer, D.G.; McDonald, M.; Routley, R.; Schwenke, G.D.; Buck, S.R.; Daniells, I.G.; Singh, D.K.; Manning, W.; et al. High subsoil chloride concentrations reduce soil water extraction and crop yield on vertosols in north-eastern Australia. Aust. J. Agric. Res. 2008, 59, 321–330. [Google Scholar] [CrossRef]
- Freebairn, D.M.; Littleboy, M.; Smith, G.D.; Coughlan, K.J. Optimising soil surface management in response to climatic risk. In Climatic Risk in Crop Production: Models and Management for Semiarid Tropics and Subtropics; Muchow, R.C., Bellamy, J.A., Eds.; CAB International: Wallingford, UK, 1991; pp. 283–305. [Google Scholar]
- Dalgliesh, N.; Foale, M. Soil Matters: Monitoring Soil Water and Nutrients in Dryland Farming; CSIRO/Agricultural Production Systems Research Unit: Toowoomba, QLD, Australia, 1998. [Google Scholar]
- Dang, Y.P.; Routley, R.; McDonald, M.; Dalal, R.C.; Singh, D.K.; Orange, D.; Mann, M. Subsoil constraints in vertosols: Crop water use, nutrient concentration, and grain yields of bread wheat, durum wheat, barley, chickpea, and canola. Aust. J. Agric. Res. 2006, 57, 983–998. [Google Scholar] [CrossRef]
- Lawes, R.A.; Oliver, Y.M.; Robertson, M.J. Capturing the in-field spatial-temporal dynamic of yield variation. Crop Pasture Sci. 2009, 60, 834–843. [Google Scholar] [CrossRef]
- Nuttall, J.G.; Armstrong, R.D.; Connor, D.J. Evaluating physio-chemical constraints of calcarosols on wheat yield in victorian southern Mallee. Aust. J. Agric. Res. 2003, 54, 487–498. [Google Scholar] [CrossRef]
- Nuttall, J.G.; Armstrong, R.D. Impact of subsoil physicochemical constraints on crops grown in the wimmera and mallee is reduced during dry seasonal conditions. Aust. J. Soil Res. 2010, 48, 125–139. [Google Scholar] [CrossRef]
- Dang, Y.P.; Dalal, R.C.; Pringle, M.J.; Biggs, A.J.W.; Darr, S.; Sauer, B.; Moss, J.; Payne, J.; Orange, D. Electromagnetic induction sensing of soil identifies constraints to the crop yields of north-eastern Australia. Soil Res. 2011, 49, 559–571. [Google Scholar] [CrossRef]
- Richards, R. Current and emerging environmental challenges in Australian agriculture—The role of plant breeding. Crop Pasture Sci. 2002, 53, 881–892. [Google Scholar] [CrossRef]
- Munns, R.; James, R.A. Screening methods for salinity tolerance: A case study with tetraploid wheat. Plant Soil 2003, 253, 201–218. [Google Scholar] [CrossRef]
- Munns, R.; Gardner, P.A.; Tonnet, M.L.; Rawson, H. Growth and development in nacl-treated plants. II. Do Na+ or Cl− concentrations in dividing or expanding tissues determine growth in barley? Funct. Plant Biol. 1988, 15, 529–540. [Google Scholar] [CrossRef]
- Tavakkoli, E.; Fatehi, F.; Coventry, S.; Rengasamy, P.; McDonald, G.K. Additive effects of Na+ and Cl− ions on barley growth under salinity stress. J. Exp. Bot. 2011, 62, 2189–2203. [Google Scholar] [CrossRef] [PubMed] [Green Version]
- Marschner, P. Marschner’s Mineral Nutrition of Higher Plants; Academic Press: London, UK, 2012; Volume 3. [Google Scholar]
- Teakle, N.L.; Tyerman, S.D. Mechanisms of cl- transport contributing to salt tolerance. Plant Cell Environ. 2010, 33, 566–589. [Google Scholar] [CrossRef] [PubMed]
- Naidu, R.; Rengasamy, P. Ion interactions and constraints to plant nutrition in Australian sodic soils. Aust. J. Soil Res. 1993, 31, 801–819. [Google Scholar] [CrossRef]
- Dang, Y.P.; Mehla, A.S.; Chhabra, R.; Kumar, S. Sodicity induced yield losses and changes in minerals concentration of sugarcane genotypes. In Proceedings of the XXIII International Society of Sugarcane Technologist Congress, New Delhi, India, 22–26 February 1999; Volume 2, pp. 89–99.
- Ma, G.; Rengasamy, P.; Rathjen, A.J. Phytotoxicity of aluminium to wheat plants in high-ph solutions. Aust. J. Exp. Agric. 2003, 43, 497–501. [Google Scholar] [CrossRef]
- Dang, Y.P.; Pringle, M.J.; Schmidt, M.; Dalal, R.C.; Apan, A. Identifying the spatial variability of soil constraints using multi-year remote sensing. Field Crops Res. 2011, 123, 248–258. [Google Scholar] [CrossRef]
- Christopher, J.; Christopher, M.; Jennings, R.; Jones, S.; Fletcher, S.; Borrell, A.; Manschadi, A.M.; Jordan, D.; Mace, E.; Hammer, G. QTL for root angle and number in a population developed from bread wheats (Triticum aestivum) with contrasting adaptation to water-limited environments. Theor. Appl. Genet. 2013, 126, 1563–1574. [Google Scholar] [CrossRef] [PubMed]
- Shaw, R. Salinity and sodicity. In Sustainable Crop Production in the Sub-Tropics: An Australian Perspective; Queensland Department of Primary Industries: Brisbane, Australia, 1997; pp. 79–96. [Google Scholar]
- Rayment, G.E.; Lyons, D.J. Soil Chemical Methods: Australasia; CSIRO Publishing: Collingwood, Victoria, Australia, 2011; Volume 3. [Google Scholar]
- Northcote, K.H.; Skene, J.K.M. Australian Soils with Saline and Sodic Properties; Csiro Division of Soils, Soil Publication No. 27, Commonwealth Scientific and Industrial Research Organisation: Melbourne, Australia, 1972. [Google Scholar]
- Kelly, J.; Rengasamy, P. Diagnosis and Management of Soil Constraints: Transient Salinity, Sodicity and Alkalinity; The University of Adelaide: Adelaide, Australia, 2006. [Google Scholar]
- Curtin, D.; Steppuhn, H.; Selles, F. Plant responses to sulfate and chloride salinity: Growth and ionic relations. Soil Sci. Soc. Am. J. 1993, 57, 1304–1310. [Google Scholar] [CrossRef]
- Bruce, R.C. Soil acidification. In Sustainable Crop Production in the Sub-Tropics; Clarke, A.L., Wylie, P.B., Eds.; Queensland Department of Primary Industries: Brisbane, Queensland, Australia, 1997; pp. 97–111. [Google Scholar]
- Rengasamy, P.; MaKenzie, D.; Armstrong, R.D.; Barrett-Lenard, G.; Bennett, J.; Dalal, R.C.; Dang, Y.P.; Davenport, D.; Fisher, P.; Hall, D.; et al. Dispersive (Sodic and Magnesic) Soils in Australia: The Mechanisms, Distribution and Management; Grains Research Development Corporation Project DAQ 200 Final Report; Grains Research and Development Coroporation: Canberra, Australia, 2016. [Google Scholar]
- Dalal, R.; So, B.; Blasi, M. High Sodium Levels in Subsoil Limits Yield and Water Use in Marginal Cropping Areas; Grains Research & Development Corporation, Final Report DNR 6; Grains Research and Development Coroporation: Canberra, Australia, 2002. [Google Scholar]
- Christopher, J.T.; Dang, Y.P. Superior performance in the presence of sub-soil constraints and under water constraints is associated in certain wheat genotypes. SABRAO J. Breed. Genet. 2009, 41 Special supplement. ISBN 1029-7073, Society for the Advancement of Breeding Researchers in Asia and Oceania: Bangkok, Thialand. [Google Scholar]
- Hochman, Z.; Dang, Y.P.; Schwenke, G.D.; Dalgliesh, N.P.; Routley, R.; McDonald, M.; Daniells, I.G.; Manning, W.; Poulton, P.L. Simulating the effects of saline and sodic subsoils on wheat crops growing on vertosols. Aust. J. Agric. Res. 2007, 58, 802–810. [Google Scholar] [CrossRef]
- Reuter, D.J.; Robinson, J.B.; Dutkiewicz, C. Plant Analysis: An Interpretation Manual; CSIRO Publishing: Melbourne, Australia, 1997. [Google Scholar]
- Ehret, D.L.; Redmann, R.E.; Harvey, B.L.; Cipywnyk, A. Salinity-induced calcium deficiencies in wheat and barley. Plant Soil 1990, 128, 143–151. [Google Scholar] [CrossRef]
- Shabala, S.; Demidchik, V.; Shabala, L.; Cuin, T.A.; Smith, S.J.; Miller, A.J.; Davies, J.M.; Newman, I.A. Extracellular Ca2+ ameliorates nacl-induced k+ loss from arabidopsis root and leaf cells by controlling plasma membrane k +-permeable channels. Plant Physiol. 2006, 141, 1653–1665. [Google Scholar] [CrossRef] [PubMed]
- Shabala, S.; Schimanski, L.J.; Koutoulis, A. Heterogeneity in bean leaf mesophyll tissue and ion flux profiles: Leaf electrophysiological characteristics correlate with the anatomical structure. Ann. Bot. 2002, 89, 221–226. [Google Scholar] [CrossRef] [PubMed]
- Liu, C.Y.; Paull, J.G.; Rathjen, A.J. Shoot mineral composition and yield of wheat genotypes grown on a soic and non-sodic soil. Aust. J. Exp. Agric. 2000, 40, 69–78. [Google Scholar] [CrossRef]
- Kronzucker, H.J.; Coskun, D.; Schulze, L.M.; Wong, J.R.; Britto, D.T. Sodium as nutrient and toxicant. Plant Soil 2013, 369, 1–23. [Google Scholar] [CrossRef]
- Gorham, J.; Wyn Jones, R.G. Utilisation of triticeae for improving salt tolerance in wheat. In Towards the Rational Use of High Salinity Tolerant Plants; Lieths, H., Masoom, A., Eds.; Kluwer Academic Publisher: Dordrecht, The Netherlands, 1993; Volume 2, pp. 27–33. [Google Scholar]
- Ashraf, M.; O’Leary, J.W. Responses of some newly developed salt-tolerant genotypes of spring wheat to salt stress: 1. Yield components and ion distribution. J. Agron. Crop Sci. 1996, 176, 91–101. [Google Scholar] [CrossRef]
- Chhipa, B.; Lal, P. Na/k ratios as the basis of salt tolerance in wheat. Aust. J. Agric. Res. 1995, 46, 533–539. [Google Scholar] [CrossRef]
- Zhu, M.; Shabala, S.; Shabala, L.; Fan, Y.; Zhou, M.X. Evaluating predictive values of various physiological indices for salinity stress tolerance in wheat. J. Agron. Crop Sci. 2016, 202, 115–124. [Google Scholar] [CrossRef]
- Shabala, S.; Cuin, T.A. Potassium transport and plant salt tolerance. Physiol. Plant. 2008, 133, 651–669. [Google Scholar] [CrossRef] [PubMed]
- Wu, H.; Shabala, L.; Zhou, M.; Shabala, S. Durum and bread wheat differ in their ability to retain potassium in leaf mesophyll: Implications for salinity stress tolerance. Plant Cell Physiol. 2014, 55, 1749–1762. [Google Scholar] [CrossRef] [PubMed]
- Manschadi, A.; Christopher, J.; DeVoil, P.; Hammer, G. The role of root architecture traits in adaptation of wheat to water-limited environments. Funct. Plant Biol. 2006, 33, 823–837. [Google Scholar] [CrossRef]
- Christopher, J.T.; Christopher, M.J.; Borrell, A.K.; Fletcher, S.; Chenu, K. Stay-green traits to improve wheat adaptation in well-watered and water-limited environments. Funct. Plant Biol. 2016. [Google Scholar] [CrossRef] [PubMed]
- Christopher, J.T.; Veyradier, M.; Borrell, A.K.; Harvey, G.; Fletcher, S.; Chenu, K. Phenotyping novel stay-green traits to capture genetic variation in senescence dynamics. Funct. Plant Biol. 2014, 41, 1035–1048. [Google Scholar] [CrossRef]


| pH | ECse | Cl | NO3-N | Clay | BD | VMC | Ex Ca | Ex Mg | Ex K | Ex Na | CEC | ESP | |
|---|---|---|---|---|---|---|---|---|---|---|---|---|---|
| (m) | 1:5 H2O | dS·m−1 | mg·kg−1 | mg·kg−1 | (%) | g·cc−1 | mm·mm−1 | cmol (+) kg−1 | % | ||||
| Non-Sodic Site | |||||||||||||
| 0–0.1 | 8.3 | 0.48 | 34 | 4.2 | 46 | 1.32 | 0.46 | 14 | 5 | 0.56 | 1.4 | 24 | 4.2 |
| 0.1–0.3 | 9.0 | 0.79 | 48 | 18 | 53 | 1.39 | 0.47 | 17 | 9 | 0.29 | 3.3 | 30 | 8.9 |
| 0.3–0.5 | 9.1 | 2.04 | 170 | 3.7 | 52 | 1.43 | 0.46 | 15 | 10 | 0.22 | 4.4 | 31 | 14.2 |
| 0.5–07 | 7.9 | 8.44 | 270 | 3.0 | 57 | 1.47 | 0.46 | 15 | 10 | 0.28 | 5.3 | 30 | 17.9 |
| 0.7–0.9 | 7.6 | 8.39 | 548 | 1.8 | 57 | 1.44 | 0.45 | 13 | 11 | 0.25 | 6.1 | 31 | 20.9 |
| 0.9–1.1 | 6.8 | 5.42 | 759 | 1.1 | 61 | 1.47 | 0.45 | 11 | 11 | 0.24 | 6.2 | 30 | 23.0 |
| 1.1–1.3 | 6.6 | 4.21 | 589 | 3.9 | 61 | 1.48 | 0.45 | 11 | 9 | 0.27 | 6.3 | 29 | 22.5 |
| Sodic Site | |||||||||||||
| 0–0.1 | 7.6 | 0.16 | 52 | 16 | 41 | 1.39 | 0.39 | 11 | 8 | 0.75 | 3.4 | 27 | 12.5 |
| 0.1–0.3 | 8.2 | 0.19 | 26 | 12 | 51 | 1.34 | 0.39 | 14 | 10 | 0.40 | 6.0 | 35 | 17.2 |
| 0.3–0.5 | 7.7 | 2.93 | 45 | 15 | 56 | 1.36 | 0.41 | 13 | 11 | 0.35 | 7.4 | 35 | 21.1 |
| 0.5–07 | 7.6 | 3.35 | 201 | 21 | 56 | 1.47 | 0.41 | 11 | 10 | 0.34 | 7.8 | 32 | 24.5 |
| 0.7–0.9 | 7.4 | 3.09 | 610 | 22 | 56 | 1.46 | 0.39 | 8 | 9 | 0.37 | 7.3 | 31 | 23.7 |
| 0.9–1.1 | 5.5 | 3.28 | 1470 | 16 | 58 | 1.47 | 0.39 | 8 | 8 | 0.36 | 7.1 | 30 | 23.7 |
| 1.1–1.3 | 4.5 | 2.48 | 2160 | 10 | 58 | 1.48 | 0.36 | 7 | 8 | 0.37 | 7.2 | 31 | 23.0 |
| Crop | Year | Site | Yield (g/m2) | p | LSD | Genetic Variance | h2 |
|---|---|---|---|---|---|---|---|
| Barley | 2008 | Sodic | 266 a | 0.001 | 50 | 107 | 0.45 |
| 349 b | 259 | 0.64 | |||||
| 2009 | Non-sodic | 184 c | 0.001 | 31 | 960 | 0.84 | |
| 175 c | 348 | 0.72 | |||||
| Wheat | 2008 | Sodic | 265 a | 0.077 | 156 | 0.72 | |
| 341 a | 394 | 0.65 | |||||
| 2009 | Non-sodic | 185 c | 0.001 | 32 | 150 | 0.72 | |
| 147 d | 309 | 0.76 |
| Genotypes | PAWC | Ca | K | Na | Cl | Mg | P | S | B | Zn | Cu | Mn | Fe |
|---|---|---|---|---|---|---|---|---|---|---|---|---|---|
| (mm) | (%) | (mg·kg−1) | |||||||||||
| Non-Sodic Site | |||||||||||||
| ND19110-5 | 154 | 0.39 | 2.77 | 0.36 | 1.38 | 0.18 | 0.35 | 0.41 | 7.6 | 30.5 | 11.6 | 66 | 121 |
| Grout | 147 | 0.32 | 2.69 | 0.31 | 1.46 | 0.19 | 0.35 | 0.40 | 9.1 | 30.6 | 9.7 | 60 | 115 |
| Shepherd | 127 | 0.59 | 2.63 | 0.22 | 1.29 | 0.16 | 0.32 | 0.40 | 9.8 | 26.7 | 9.8 | 55 | 125 |
| Kaputar | 157 | 0.46 | 2.67 | 0.20 | 1.27 | 0.17 | 0.35 | 0.42 | 8.1 | 25.9 | 10.7 | 56 | 121 |
| Grimmett | 146 | 0.56 | 2.52 | 0.12 | 1.02 | 0.14 | 0.32 | 0.38 | 7.3 | 36.4 | 8.7 | 44 | 126 |
| Gairdner | 137 | 0.61 | 2.85 | 0.22 | 1.22 | 0.17 | 0.34 | 0.38 | 8.4 | 25.6 | 10.1 | 61 | 111 |
| Cameo | 151 | 0.56 | 3.01 | 0.20 | 1.32 | 0.18 | 0.37 | 0.42 | 9.7 | 31.9 | 10.2 | 60 | 118 |
| Fitzroy | 159 | 0.41 | 3.10 | 0.17 | 1.16 | 0.16 | 0.35 | 0.39 | 6.3 | 28.6 | 10.3 | 44 | 107 |
| Kuro | 160 | 0.44 | 2.63 | 0.19 | 1.18 | 0.16 | 0.34 | 0.40 | 11.3 | 25.3 | 10.1 | 46 | 112 |
| Mackay | 152 | 0.80 | 2.60 | 0.18 | 1.22 | 0.17 | 0.36 | 0.39 | 6.2 | 27.8 | 9.8 | 55 | 115 |
| Baronesse | 149 | 0.43 | 2.69 | 0.18 | 1.32 | 0.17 | 0.34 | 0.36 | 9.1 | 25.2 | 10.2 | 55 | 118 |
| Mean | 149 | 0.51 | 2.74 | 0.21 | 1.25 | 0.17 | 0.35 | 0.39 | 8.4 | 28.6 | 10.1 | 55 | 117 |
| Sodic Site | |||||||||||||
| ND19110-5 | 139 | 0.21 | 2.12 | 0.75 | 2.00 | 0.13 | 0.23 | 0.29 | 10.9 | 15.4 | 9.4 | 80 | 76 |
| Grout | 126 | 0.23 | 2.59 | 0.39 | 1.87 | 0.11 | 0.25 | 0.28 | 9.2 | 16.5 | 10.5 | 53 | 89 |
| Shepherd | 123 | 0.24 | 2.52 | 0.46 | 1.47 | 0.11 | 0.27 | 0.30 | 16.1 | 17.0 | 12.4 | 53 | 87 |
| Kaputar | 126 | 0.19 | 2.33 | 0.46 | 1.44 | 0.13 | 0.26 | 0.28 | 7.9 | 20.9 | 10.5 | 65 | 102 |
| Grimmett | 115 | 0.20 | 2.32 | 0.61 | 1.91 | 0.15 | 0.25 | 0.32 | 15.0 | 14.6 | 10.6 | 79 | 91 |
| Gairdner | 115 | 0.25 | 2.19 | 0.45 | 1.35 | 0.11 | 0.29 | 0.29 | 9.6 | 21.9 | 13.5 | 79 | 88 |
| Cameo | 110 | 0.22 | 2.08 | 0.83 | 2.01 | 0.13 | 0.27 | 0.34 | 7.3 | 19.2 | 12.1 | 89 | 84 |
| Fitzroy | 127 | 0.24 | 2.31 | 0.31 | 1.56 | 0.10 | 0.26 | 0.27 | 7.8 | 17.3 | 10.4 | 63 | 77 |
| Kuro | 126 | 0.20 | 2.65 | 0.32 | 1.41 | 0.12 | 0.28 | 0.30 | 11.0 | 16.0 | 9.9 | 62 | 100 |
| Mackay | 128 | 0.29 | 2.17 | 0.40 | 1.47 | 0.13 | 0.26 | 0.30 | 10.9 | 19.0 | 9.9 | 65 | 85 |
| Baronesse | 89 | 0.19 | 2.64 | 0.47 | 1.82 | 0.11 | 0.30 | 0.31 | 12.3 | 18.6 | 15.6 | 58 | 93 |
| Mean | 120 | 0.22 | 2.35 | 0.50 | 1.66 | 0.12 | 0.26 | 0.30 | 10.7 | 17.8 | 11.3 | 68 | 88 |
| LSD (p < 0.05) | |||||||||||||
| Site | 9.4 | 0.03 | 0.12 | 0.08 | 0.12 | NS | 0.01 | 0.01 | 1.4 | 1.7 | NS | 5 | 3 |
| Genotype | 22.9 | 0.08 | NS | NS | 0.29 | NS | NS | NS | 3.3 | NS | NS | NS | NS |
| Genotypes | PAWC | Ca | K | Na | Cl | Mg | P | S | B | Zn | Cu | Mn | Fe |
|---|---|---|---|---|---|---|---|---|---|---|---|---|---|
| (mm) | (%) | (mg·kg−1) | |||||||||||
| Non-Sodic Site | |||||||||||||
| Baxter | 174 | 0.31 | 3.06 | 0.007 | 0.78 | 0.16 | 0.25 | 0.34 | 6.3 | 24.7 | 7.6 | 109 | 120 |
| Carinya | 149 | 0.33 | 2.76 | 0.005 | 0.88 | 0.15 | 0.25 | 0.33 | 11.8 | 31.8 | 8.2 | 127 | 115 |
| EGA-Bounty | 160 | 0.37 | 3.02 | 0.036 | 1.14 | 0.15 | 0.25 | 0.32 | 4.3 | 25.2 | 8.2 | 125 | 118 |
| EGA-Gregory | 138 | 0.39 | 2.85 | 0.006 | 0.68 | 0.18 | 0.25 | 0.29 | 8.7 | 23.9 | 11.3 | 124 | 107 |
| EGA-Hume | 166 | 0.37 | 2.64 | 0.005 | 0.92 | 0.19 | 0.24 | 0.30 | 8.9 | 25.8 | 10.3 | 132 | 170 |
| EGA-Kidman | 157 | 0.30 | 2.28 | 0.005 | 0.71 | 0.16 | 0.26 | 0.33 | 6.2 | 29.3 | 10.2 | 105 | 96 |
| EGA-Stampede | 153 | 0.36 | 2.97 | 0.005 | 0.74 | 0.16 | 0.28 | 0.33 | 6.6 | 26.6 | 9.5 | 108 | 123 |
| EGA-Wentworth | 159 | 0.38 | 2.84 | 0.005 | 0.96 | 0.16 | 0.24 | 0.35 | 9.9 | 27.3 | 7.8 | 126 | 110 |
| EGA-Wylie | 148 | 0.25 | 2.58 | 0.005 | 0.74 | 0.13 | 0.26 | 0.35 | 9.1 | 26.7 | 10.6 | 106 | 240 |
| Hartog | 161 | 0.27 | 2.79 | 0.022 | 1.17 | 0.15 | 0.31 | 0.29 | 7.3 | 23.9 | 8.0 | 94 | 117 |
| HSF1-112 | 171 | 0.36 | 3.41 | 0.006 | 0.93 | 0.15 | 0.29 | 0.29 | 5.4 | 29.9 | 8.3 | 124 | 106 |
| HSF1-255 | 138 | 0.35 | 2.30 | 0.006 | 0.96 | 0.15 | 0.24 | 0.30 | 7.5 | 24.1 | 8.2 | 89 | 140 |
| Janz | 155 | 0.33 | 2.53 | 0.005 | 0.78 | 0.14 | 0.22 | 0.30 | 6.4 | 25.8 | 9.8 | 110 | 118 |
| Seri | 149 | 0.41 | 2.79 | 0.005 | 1.21 | 0.14 | 0.26 | 0.34 | 11.5 | 25.7 | 7.6 | 112 | 108 |
| SHF1-103 | 149 | 0.36 | 2.57 | 0.005 | 1.06 | 0.15 | 0.25 | 0.30 | 7.3 | 22.4 | 7.9 | 114 | 309 |
| Ventura | 163 | 0.37 | 2.81 | 0.006 | 0.97 | 0.16 | 0.28 | 0.31 | 7.0 | 27.7 | 8.4 | 109 | 161 |
| Young | 140 | 0.30 | 2.34 | 0.005 | 0.55 | 0.13 | 0.26 | 0.31 | 7.7 | 25.2 | 9.6 | 86 | 129 |
| Mean | 155 | 0.34 | 2.73 | 0.008 | 0.89 | 0.15 | 0.26 | 0.31 | 7.7 | 26.2 | 8.9 | 112 | 140 |
| Sodic Site | |||||||||||||
| Baxter | 128 | 0.18 | 2.49 | 0.036 | 1.20 | 0.14 | 0.34 | 0.38 | 4.3 | 15.6 | 7.8 | 48 | 117 |
| Carinya | 116 | 0.18 | 2.48 | 0.012 | 0.99 | 0.16 | 0.35 | 0.37 | 5.1 | 19.6 | 8.0 | 60 | 95 |
| EGA-Bounty | 121 | 0.19 | 2.70 | 0.036 | 1.28 | 0.16 | 0.33 | 0.38 | 10.8 | 15.8 | 8.2 | 55 | 101 |
| EGA-Gregory | 120 | 0.22 | 2.31 | 0.025 | 0.92 | 0.20 | 0.33 | 0.40 | 7.5 | 16.4 | 7.8 | 73 | 95 |
| EGA-Hume | 142 | 0.22 | 2.17 | 0.162 | 1.27 | 0.16 | 0.33 | 0.35 | 7.9 | 15.6 | 7.9 | 56 | 108 |
| EGA-Kidman | 121 | 0.31 | 2.38 | 0.194 | 1.01 | 0.16 | 0.32 | 0.38 | 8.6 | 18.0 | 8.6 | 59 | 102 |
| EGA-Stampede | 121 | 0.21 | 2.34 | 0.011 | 1.00 | 0.21 | 0.35 | 0.41 | 7.7 | 16.9 | 7.9 | 70 | 96 |
| EGA-Wentworth | 113 | 0.18 | 2.57 | 0.007 | 0.94 | 0.16 | 0.34 | 0.38 | 5.9 | 16.6 | 7.8 | 62 | 92 |
| EGA-Wylie | 132 | 0.23 | 2.64 | 0.154 | 1.02 | 0.14 | 0.34 | 0.40 | 14.4 | 17.8 | 8.5 | 61 | 104 |
| Hartog | 120 | 0.22 | 2.66 | 0.042 | 1.30 | 0.17 | 0.32 | 0.37 | 8.2 | 18.4 | 7.8 | 53 | 97 |
| HSF1-112 | 109 | 0.23 | 2.45 | 0.043 | 1.23 | 0.18 | 0.39 | 0.37 | 5.0 | 17.6 | 7.3 | 51 | 111 |
| HSF1-255 | 135 | 0.32 | 2.43 | 0.047 | 1.14 | 0.19 | 0.32 | 0.41 | 7.3 | 15.0 | 7.1 | 88 | 97 |
| Janz | 124 | 0.35 | 2.19 | 0.137 | 1.10 | 0.16 | 0.33 | 0.40 | 8.5 | 14.9 | 7.3 | 52 | 85 |
| Seri | 127 | 0.18 | 2.82 | 0.010 | 0.97 | 0.16 | 0.34 | 0.35 | 4.7 | 17.7 | 7.6 | 62 | 117 |
| SHF1-103 | 122 | 0.32 | 2.40 | 0.035 | 1.12 | 0.16 | 0.27 | 0.37 | 7.4 | 18.2 | 7.6 | 67 | 97 |
| Ventura | 111 | 0.26 | 2.24 | 0.048 | 1.07 | 0.19 | 0.34 | 0.38 | 9.8 | 17.9 | 7.6 | 64 | 104 |
| Young | 104 | 0.29 | 2.51 | 0.147 | 0.98 | 0.15 | 0.30 | 0.41 | 7.8 | 16.7 | 7.7 | 61 | 117 |
| Mean | 121 | 0.24 | 2.45 | 0.067 | 1.09 | 0.17 | 0.33 | 0.38 | 7.7 | 17.0 | 7.8 | 61 | 102 |
| LSD (p < 0.05) | |||||||||||||
| Site | 10.2 | 0.03 | 0.11 | 0.03 | 0.06 | NS | 0.01 | 0.01 | NS | 1.0 | 0.6 | 6.6 | 17 |
| Genotype | NS | NS | 0.16 | NS | 0.18 | NS | NS | NS | NS | NS | NS | NS | NS |
© 2016 by the authors; licensee MDPI, Basel, Switzerland. This article is an open access article distributed under the terms and conditions of the Creative Commons Attribution (CC-BY) license (http://creativecommons.org/licenses/by/4.0/).
Share and Cite
Dang, Y.P.; Christopher, J.T.; Dalal, R.C. Genetic Diversity in Barley and Wheat for Tolerance to Soil Constraints. Agronomy 2016, 6, 55. https://doi.org/10.3390/agronomy6040055
Dang YP, Christopher JT, Dalal RC. Genetic Diversity in Barley and Wheat for Tolerance to Soil Constraints. Agronomy. 2016; 6(4):55. https://doi.org/10.3390/agronomy6040055
Chicago/Turabian StyleDang, Yash P., Jack T. Christopher, and Ram C. Dalal. 2016. "Genetic Diversity in Barley and Wheat for Tolerance to Soil Constraints" Agronomy 6, no. 4: 55. https://doi.org/10.3390/agronomy6040055