1. Introduction
Molecular markers are being used increasingly in plant breeding either to construct new genotypes having favourable alleles or to better estimate the breeding values of genotypes [
1,
2]. The first option implies the detection of the loci involved in the variation of quantitative traits (QTL). This detection is usually realised either in populations derived from bi-parental crosses between contrasting parents or in populations for which the lineage is unknown (association studies). The first strategy is interesting because linkage disequilibrium (LD) is long in the populations created, allowing the use of a limited number of markers to cover the genome. Nevertheless, this strategy can be limited by difficulties in creating the populations by the low number of alleles surveyed and by the accuracy of the location of the QTL. The second strategy (association studies) is interesting because the populations already exist and can be highly diverse. Nevertheless, it can be limited by short LD, forcing breeders to focus on just a few genes (candidate gene approach) or to use a very large number of markers [
3]. In particular, LD is often very short in outbreeding species [
3].
Synthetic varieties are produced in outbreeding species for which crosses cannot be controlled at large scale to produce hybrid varieties (e.g., in the majority of perennial forage and tree species). Synthetic varieties are created by inter-crossing a number of selected plants (from four to several hundred parents (i.e., making a polycross)) and then multiplying up the resulting population over three or four generations (Syn 3–4), without selection, to obtain sufficient seed for commercialisation. The genetic diversity remaining in synthetic varieties avoids inbreeding depression and also allows better stability of performance in variable environments (spatial and temporal variations) [
4]. When a low number of parents is used, these can be selected for their specific combining ability in addition to their general combining ability [
5]. To apply marker assisted selection (MAS) in such species, QTL can be detected in bi-parental populations and then the favourable alleles must be introgressed into more diverse populations, such as elite varieties. This process is time consuming and the effect of the QTL can change in a new genetic background. Another way is to detect QTL directly in diverse populations such as in the progeny of a polycross or in a given generation of multiplication of a synthetic variety (Syn 2, 3 or 4). Linkage disequilibrium decreases with successive generations of multiplication [
6]. Depending on the genetic architecture of selected traits, the knowledge of candidate genes and the budgetary allocation for genotyping (number of markers necessary to cover the genome depending on the LD) breeders can choose the best population for MAS. For example, a Syn 4 has been used to detect an association between a candidate gene and leaf elongation rate in perennial ryegrass [
7].
Perennial ryegrass (
Lolium perenne L.) is the most commonly sown forage and turf-grass species in temperate climates and it is considered to be a model for genomics in forage grasses [
8]. Varieties are synthetics, due to biological constraints. In this species, LD decreases very rapidly (
r2 < 0.2 over less than 1 kb) in natural populations but also in synthetic varieties, except for in varieties produced from a very small number of parental plants [
9,
10]. Leaf length and leaf elongation rate are important traits affecting: (i) vegetative yield [
11,
12,
13,
14,
15]; (ii) intake rate by dairy cows [
16]; and (iii) plant survival under light competition conditions [
17]. At the plant level, leaf length can be estimated by stretched plant height (PH) and leaf elongation rate by plant growth rate (PGR).
The objective of this study was to demonstrate that the progeny from a polycross can be used advantageously for the detection of QTL with interval mapping because (i) the variability within the progeny can be sufficient to avoid inbreeding depression in the following step of selection to produce a variety; (ii) LD is high, allowing the use of a moderate number of markers to cover the genome; and (iii) polycrosses are classically made in breeding programs for species in which synthetics are produced. Our approach was to identify QTL in the progeny of a polycross of perennial ryegrass including six parents, for PH and for PGR, the increase in plant height over a certain time after a defoliation event.
3. Discussion
In this study, we successfully carried out genetic mapping and QTL detection on the progeny of a polycross, considered as a sum of connected populations. In the progeny, molecular markers allowed the identification of the male parent for each sibling. This approach has previously been used in red clover and alfalfa allowing increase of the selection gain [
20]. As expected, we found the progeny of the polycross with six parents consisted of 15 full-sib families. However, the number of plants per full-sib family was highly variable with some families comprising fewer than five plants. This is a limitation for the estimation of a trait mean for very small families. To avoid this problem in future studies, it would be best to genotype a larger number of plants per half-sib family than the one needed for phenotyping and then to select seedlings based on their genotype so as to have equal numbers of plants per full-sib family. Another point that could be improved is the spatial design of the polycross, which should allow all crosses between the constituents of the polycross [
21].
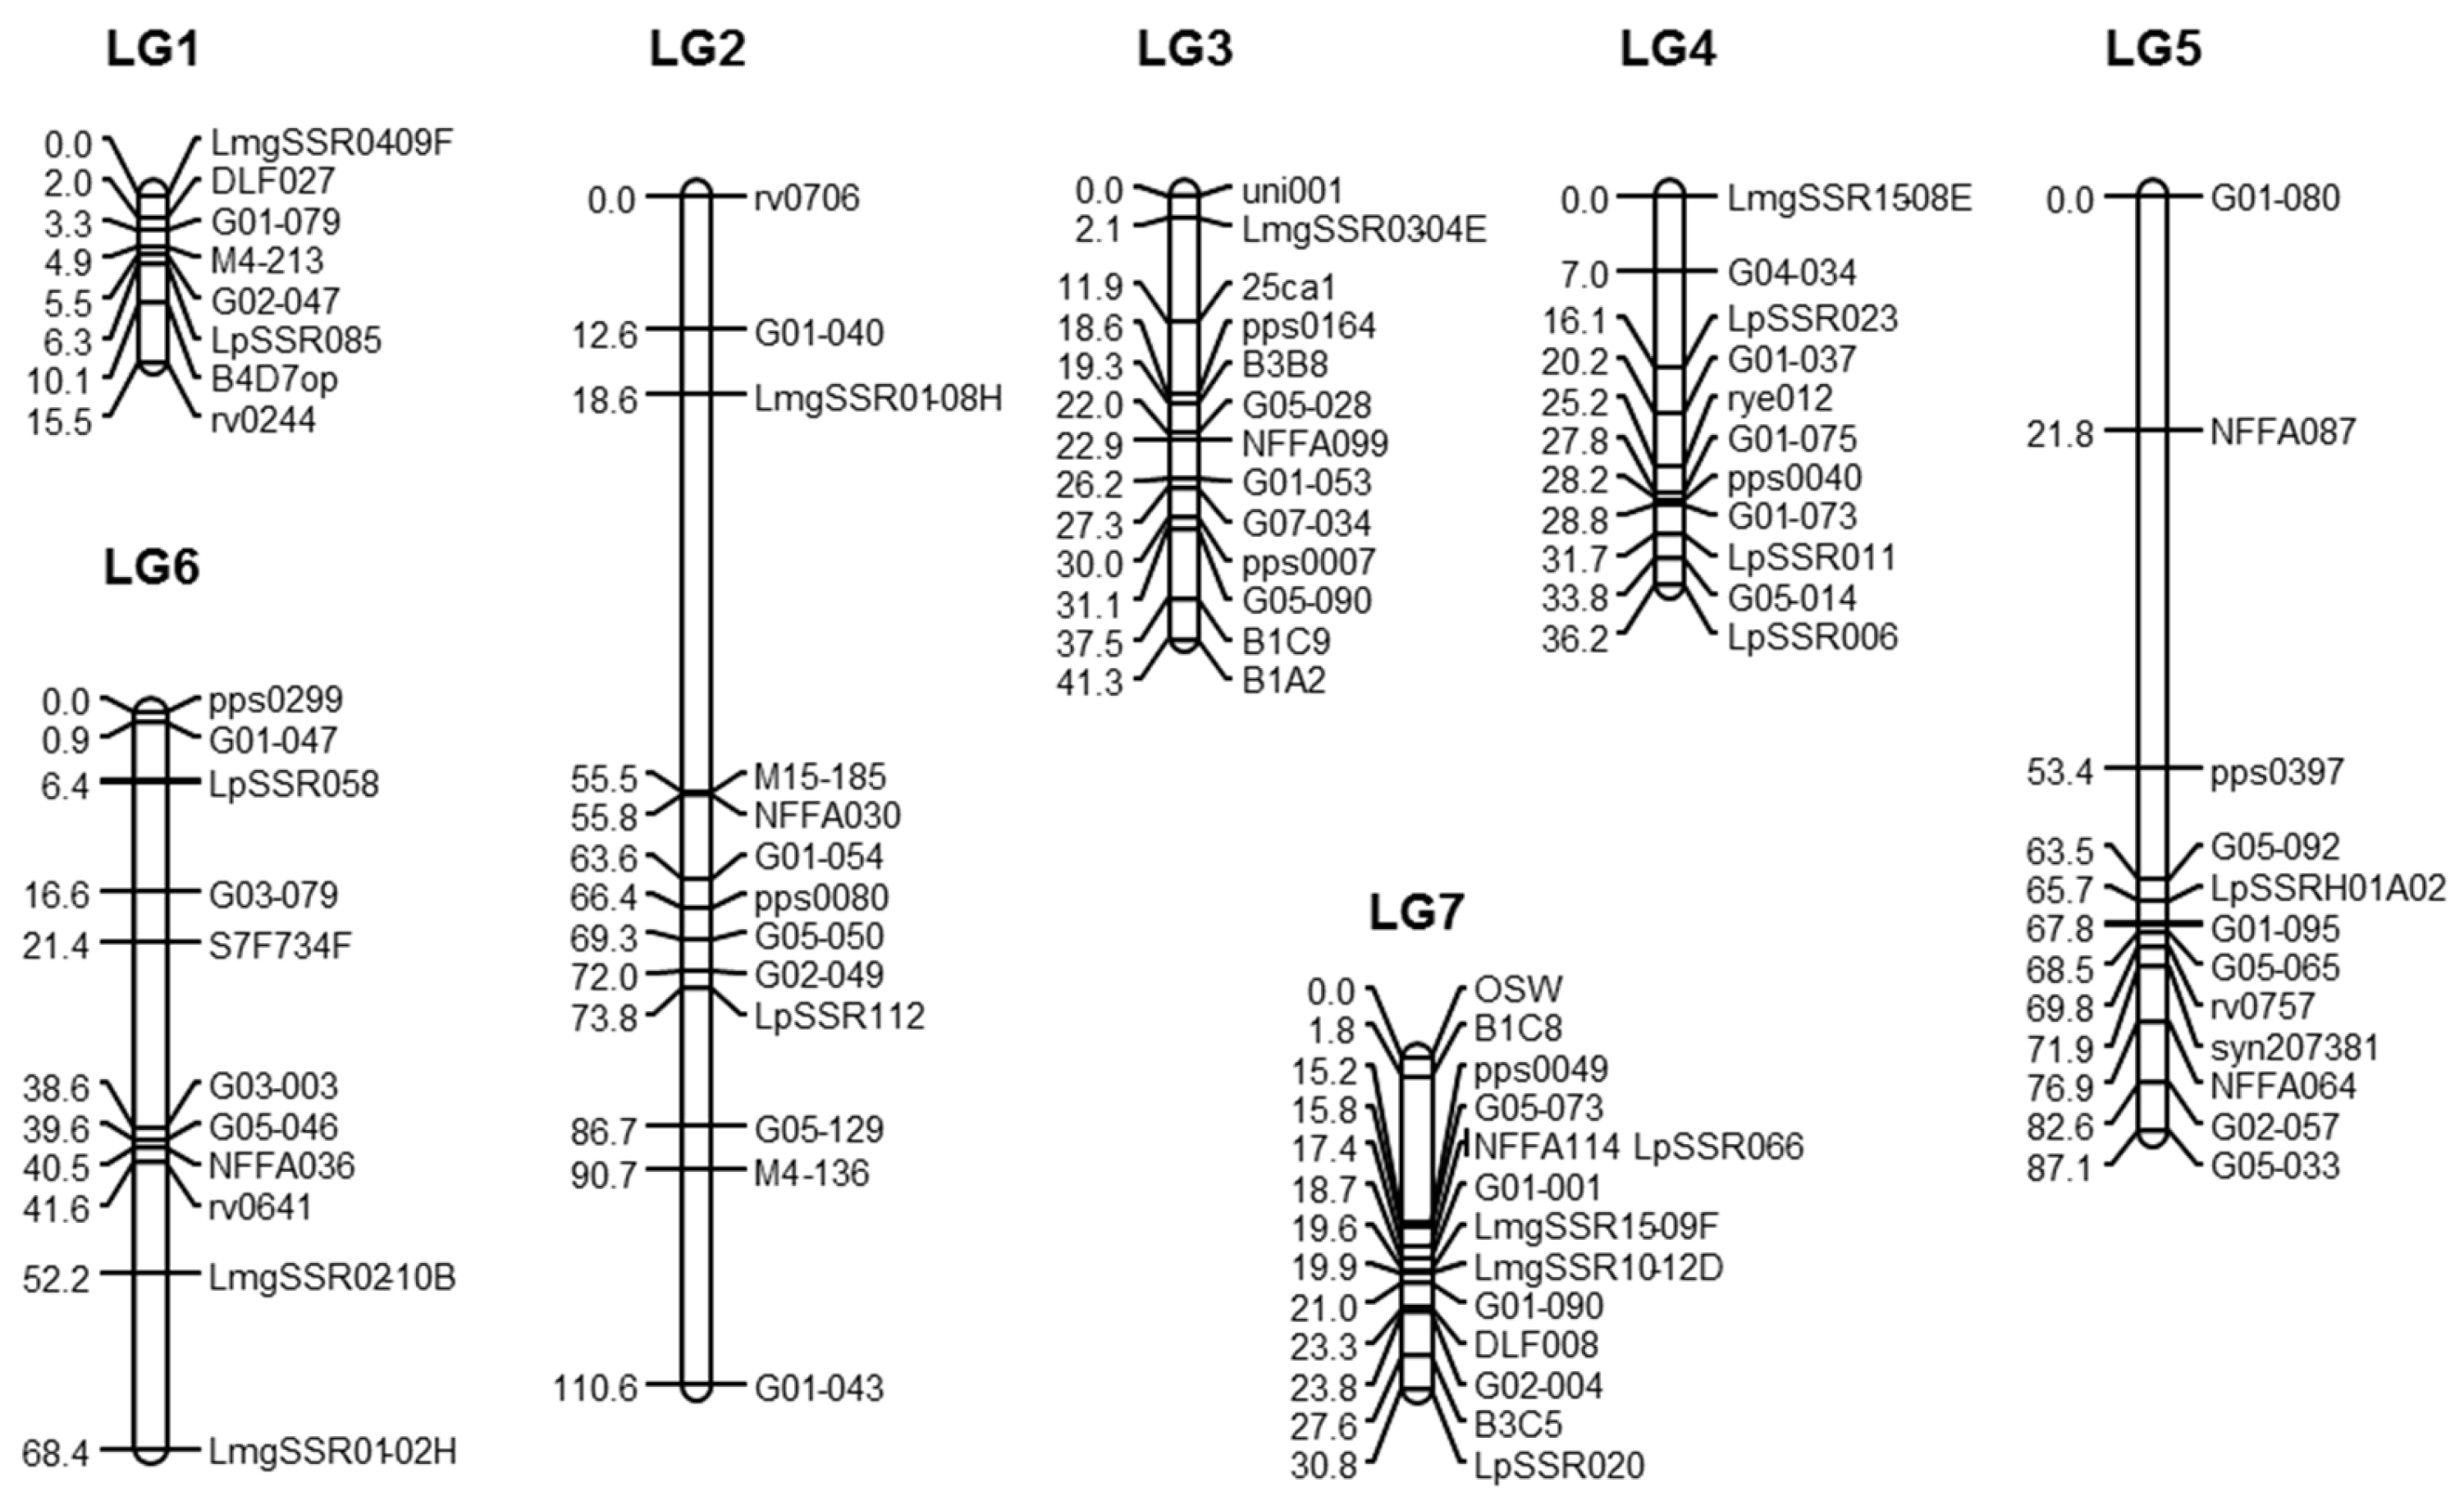
As expected in perennial ryegrass, we were able to build a genetic map with seven linkage groups, but the map was shorter than expected with only 491 cM, instead of between 700 and 800 cM [
19,
22,
23,
24,
25]. The belonging of markers to LG was in agreement with previous studies [
22,
26,
27,
28]. The order of the markers on the LG was generally identical to the one in [
27,
28] except for LG3 and some punctual changes. For example, on LG2, the upper part of the LG, including G01_040 on the map in the present study, was at the opposite extremity in the map of [
28]. The markers used in the present study cover the entire map of [
28], but the size of the map was shrunk. For example, on LG1 the distance between LMgSSR04-09F and LpSSR085 was 33.5 cM in [
28] and only 6.3 cM in this study. This could be due to the limited number of plants within each half-sib family and/or the number of markers in this study. In future, the number of markers used for this kind of study should be increased. This is now feasible at reasonable cost with marker platforms such as Genotyping by Sequencing (GBS) [
29,
30].
Values of QTL with strong effects were detected on LG 3 and 4 for PH and PGR in the spring. These regions have already been identified as QTL involved in traits related to leaf growth, such as leaf length, leaf elongation rate, and plant height [
22,
24,
31,
32,
33,
34,
35]. In particular, the QTL on LG4 nearby LpSSR011 and G05_014 is located on the map of [
22] nearby a QTL for leaf elongation rate, lamina length, and plant height. Moreover this QTL was near LpSSR082 which is close to the gene Gibberellic Acid Insensitive [
9], which is involved in leaf elongation rate and leaf length [
7]. The QTL on LG3 was not far from a QTL for leaf elongation rate in [
32] (marker pps0164 in common) and in [
34] (marker 25ca1 in common), but the very low number of common markers between studies does not allow a real accurate comparison. In the literature cited above, QTL were identified on all seven LG with the percentages of phenotypic variance explained by the QTL ranging from 5% to 43%. The fact that we detected only two strong QTL could arise from (i) the very small size of some full-sib families; (ii) a relatively low number of plants surveyed in comparison to the number of parents [
36]; (iii) a partial genetic map; and (iv) the change of the effect of a QTL with genetic background. Nevertheless, the results obtained in this study are very encouraging for future work with larger populations and higher numbers of markers. It would improve the robustness of QTL to phenotype the plants on a multi-local trial, but due to the cost it could be a good option to keep the multi-local trials for advanced elite material tested on swards.
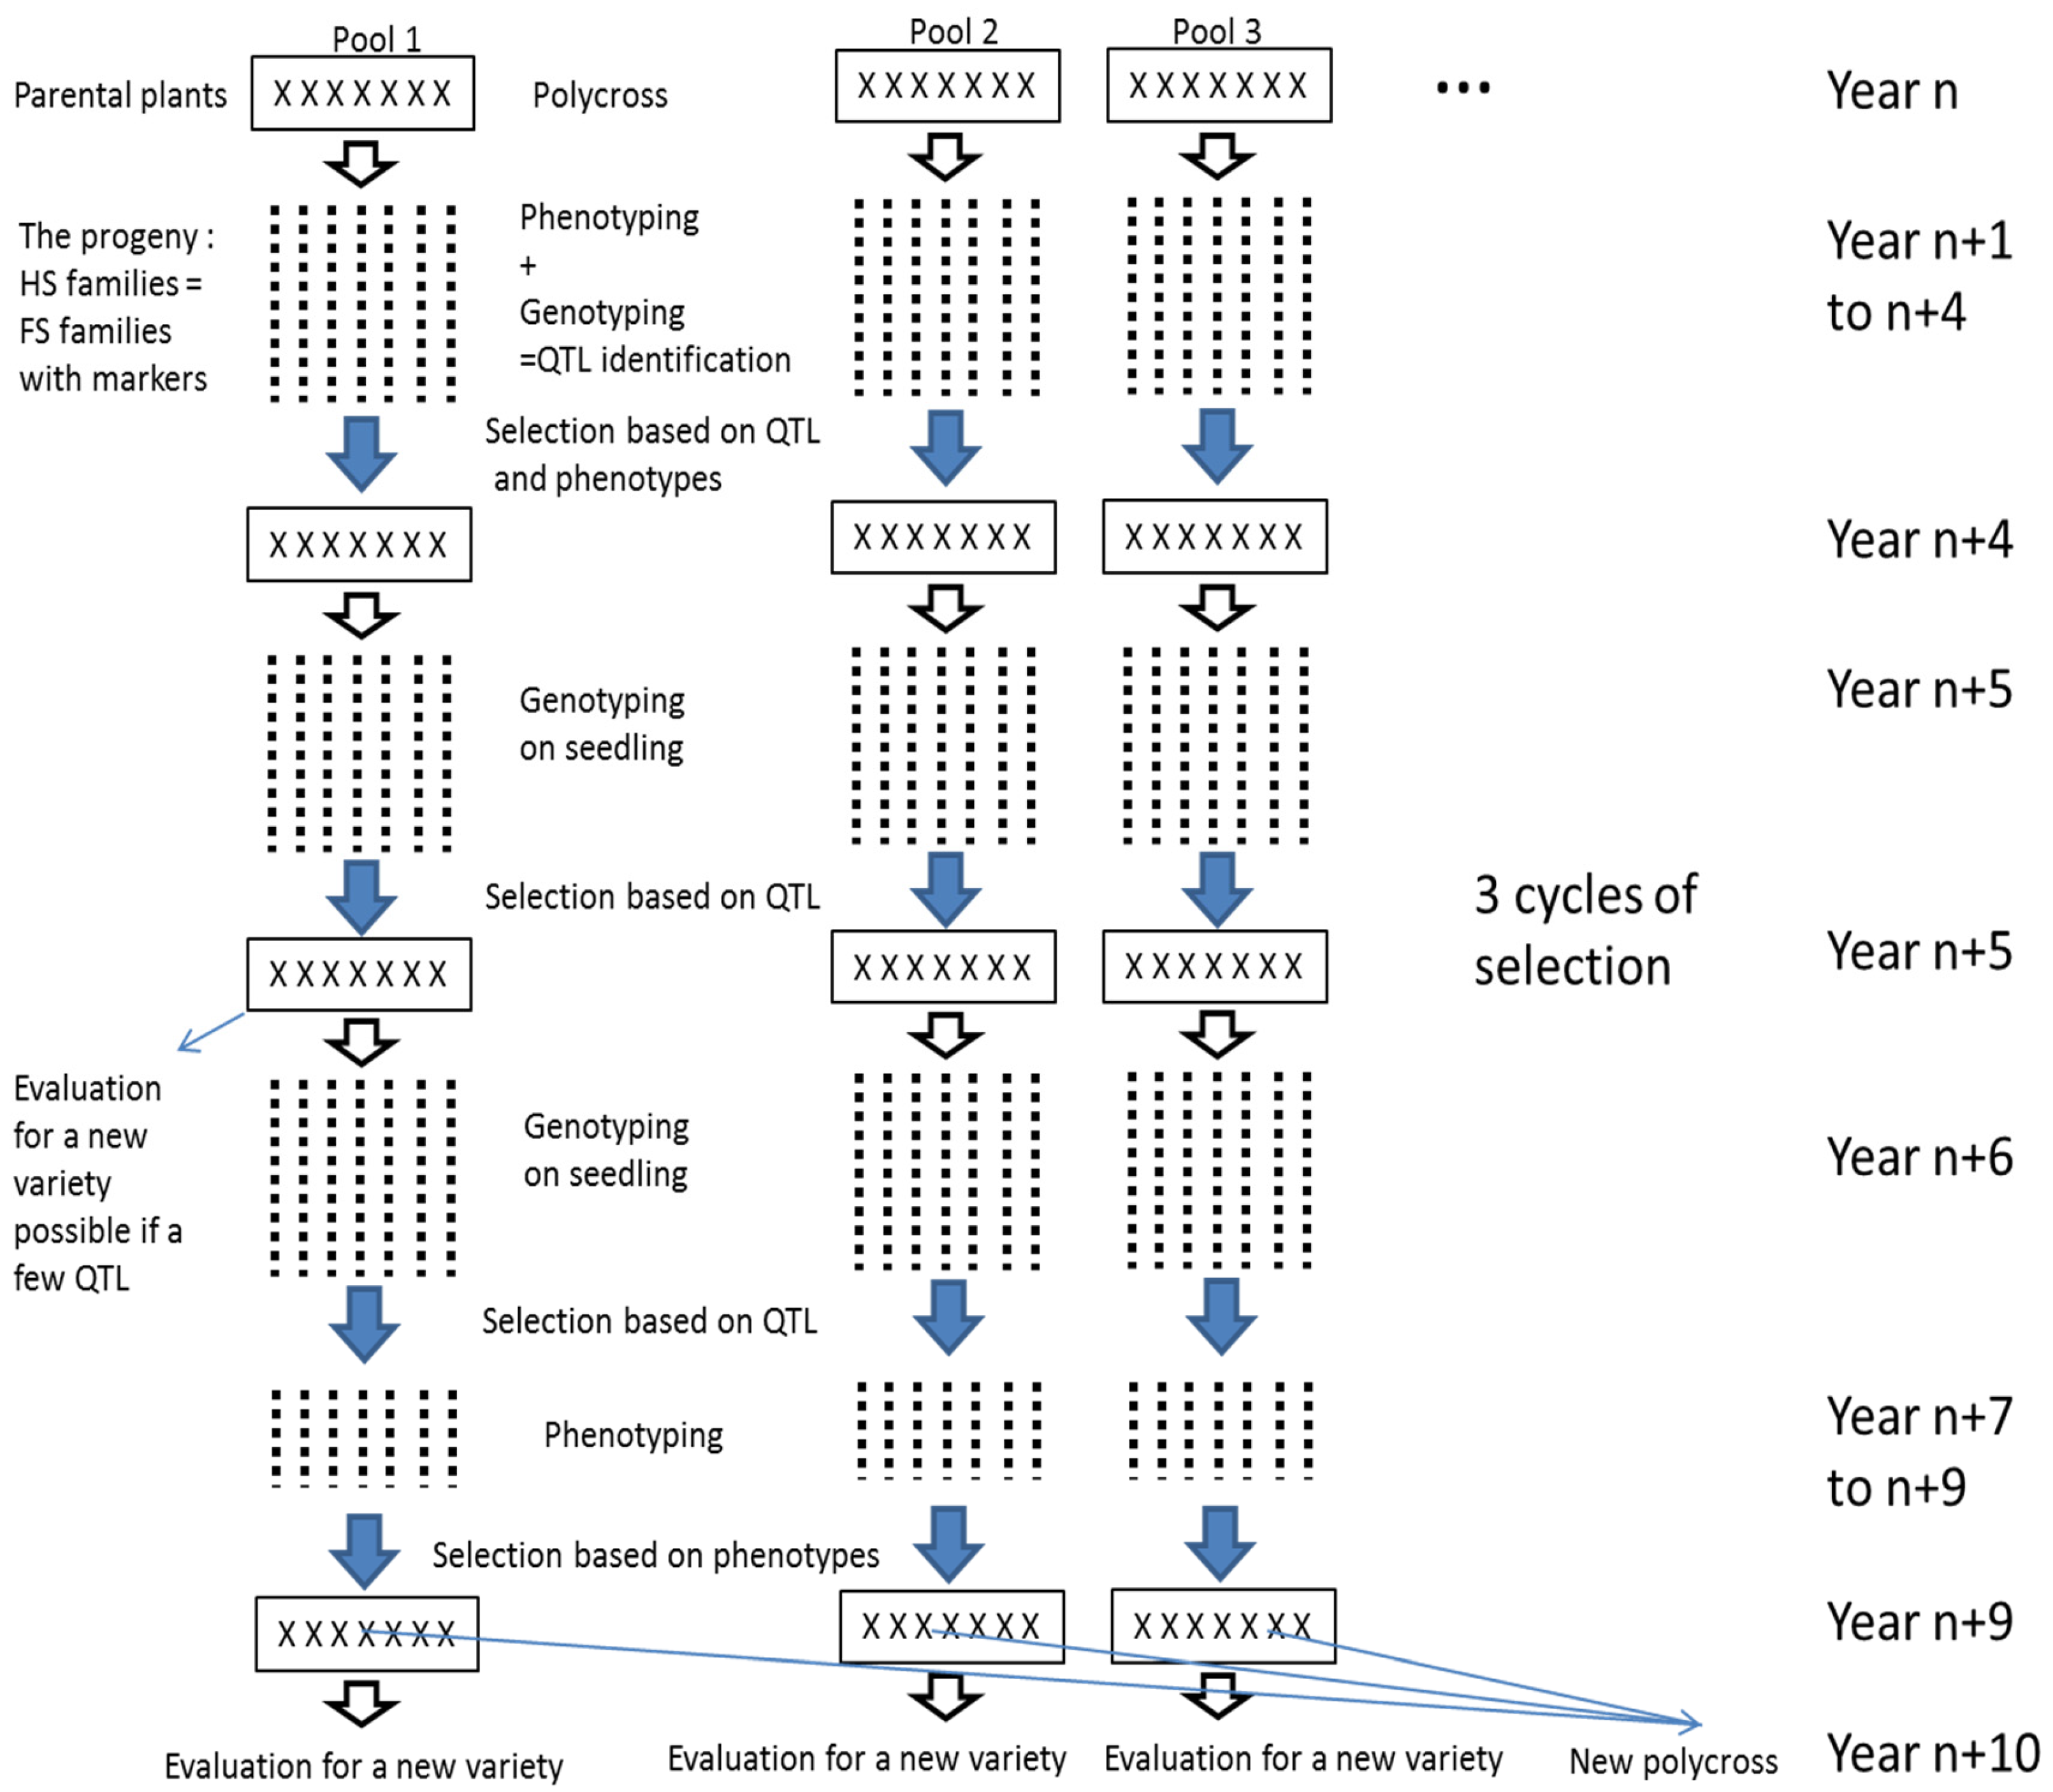
This study shows it was possible to detect QTL in the progeny of a polycross. This finding should be useful for breeding synthetic varieties because it allows maintenance of enough diversity to avoid inbreeding, while still selecting for the best alleles from different parents. Practically, from the progeny of a polycross, we propose to perform 1/ a selection based on molecular markers and on phenotypes (cycle 1) then 2/ a cycle of selection only on molecular markers (cycle 2) and 3/ a selection on seedlings based on molecular markers followed by a selection based on phenotypes on the rest of plants (cycle 3) (
Figure 4). The selected plants could then be used to create a variety or to create new polycrosses for further cycles of selection. This breeding scheme could be done on several polycrosses at the same time and new polycrosses could be created with selected plants from different polycrosses. The selection on molecular markers should be performed for both increasing the frequencies of favourable alleles and for maintaining diversity 1/ on the rest of the genome and if possible 2/ at the QTL locations by selecting different favourable alleles. In our case, genotypes bearing the favourable alleles from Nemo C, Nemo D, and Nemo G for the QTL on LG 3 and the favourable alleles from Nemo B, Nemo C, and Nemo H for the QTL on LG 4 were selected. In addition, we were careful to represent all six parents in the selected genotypes in order to avoid inbreeding depression. Moreover, the LD in the progeny allows the genome to be covered with a moderate number of markers. Connected populations have been used successfully for the detection of QTL in inbreeding [
24,
37] and outbreeding species [
38], but it is the first time the progeny of a polycross has been used.
4. Materials and Methods
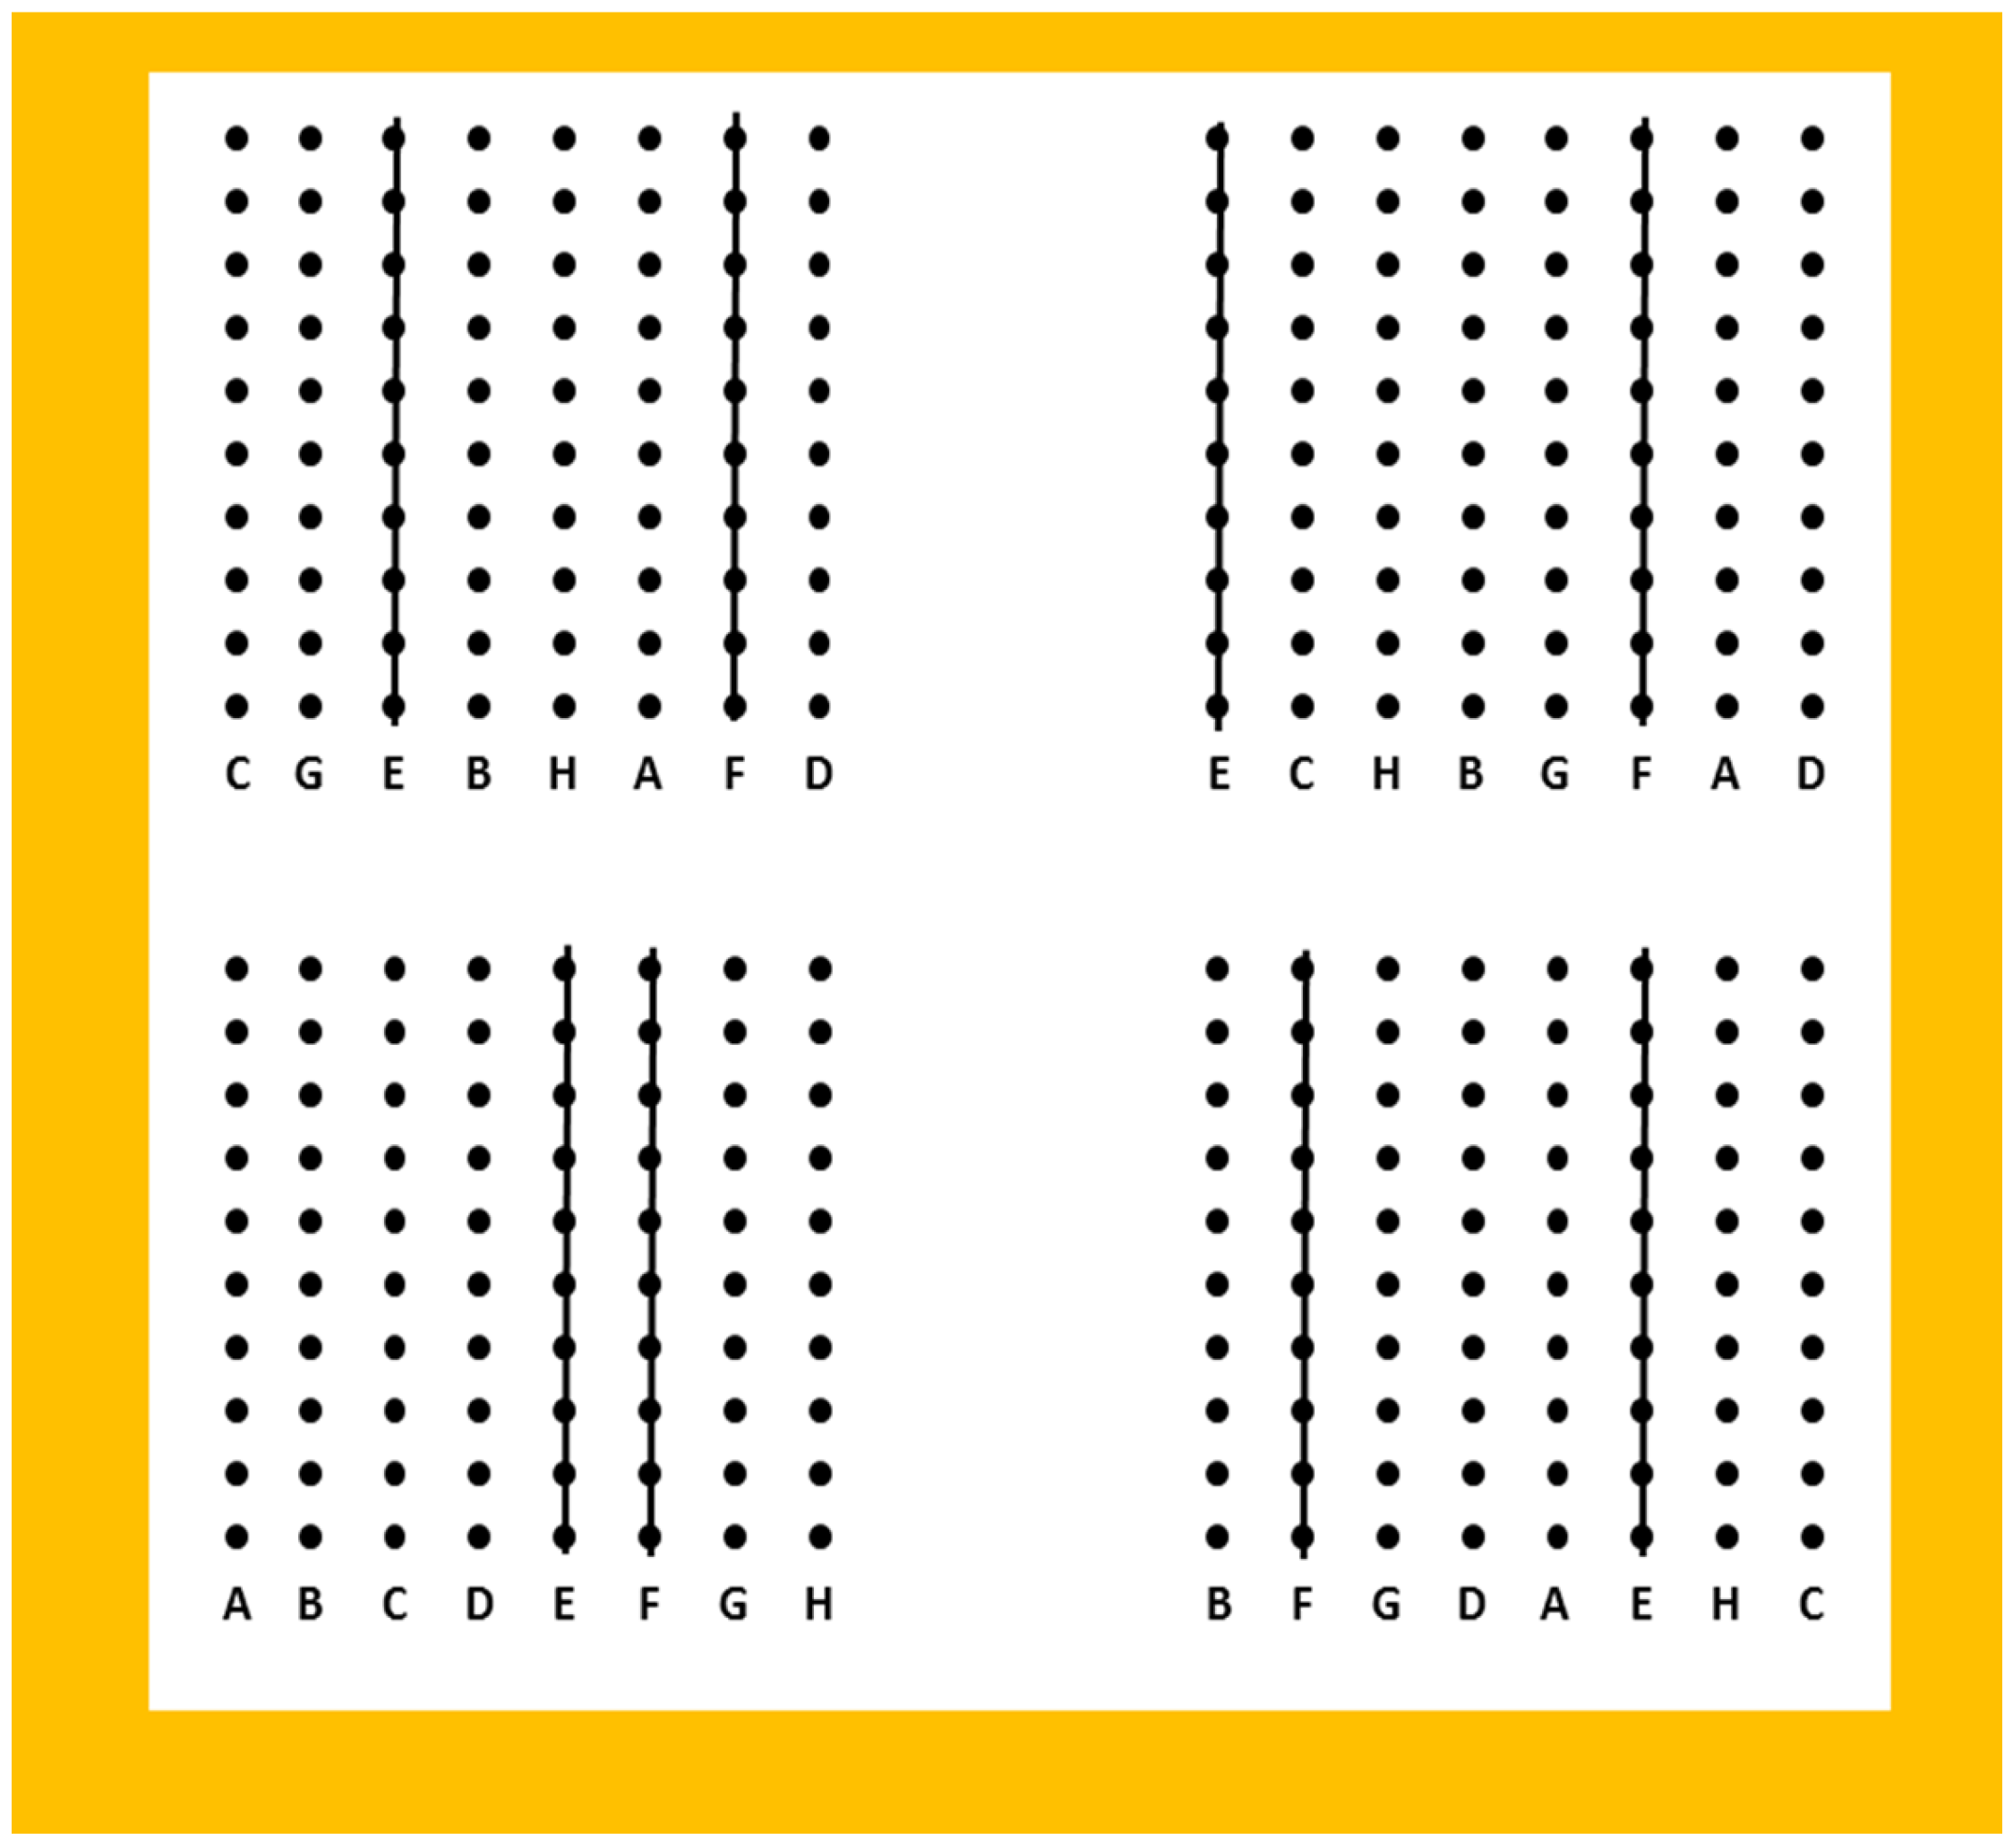
The plants were obtained from Gie GRASS (a French plant breeding company) and come from their elite perennial ryegrass breeding programme. Plant material consisted of six half-sib (HS) families derived from a polycross including six parental plants: Nemo A–D, Nemo G, and Nemo H. The design of the polycross is presented in
Figure 1. Four repetitions of lines (10 clones per line) of the parents were used to minimise any effects of spatial proximity. For each parent, all 40 clones were harvested and threshed together. A total of 42 genotypes per HS family were used. Four clones of each genotype were produced by splitting sets of three to five tillers from a mother plant grown in a spaced-plant nursery. Clones were planted in November 2008 in a spaced-plant trial in a randomised block design with four blocks, at Saint-Sauvant (France) (46°23′1′′ N 0°05′ E). Non-surveyed plants of perennial ryegrass were planted around the trial to avoid border effects. The distance between plants was 75 cm in all directions.
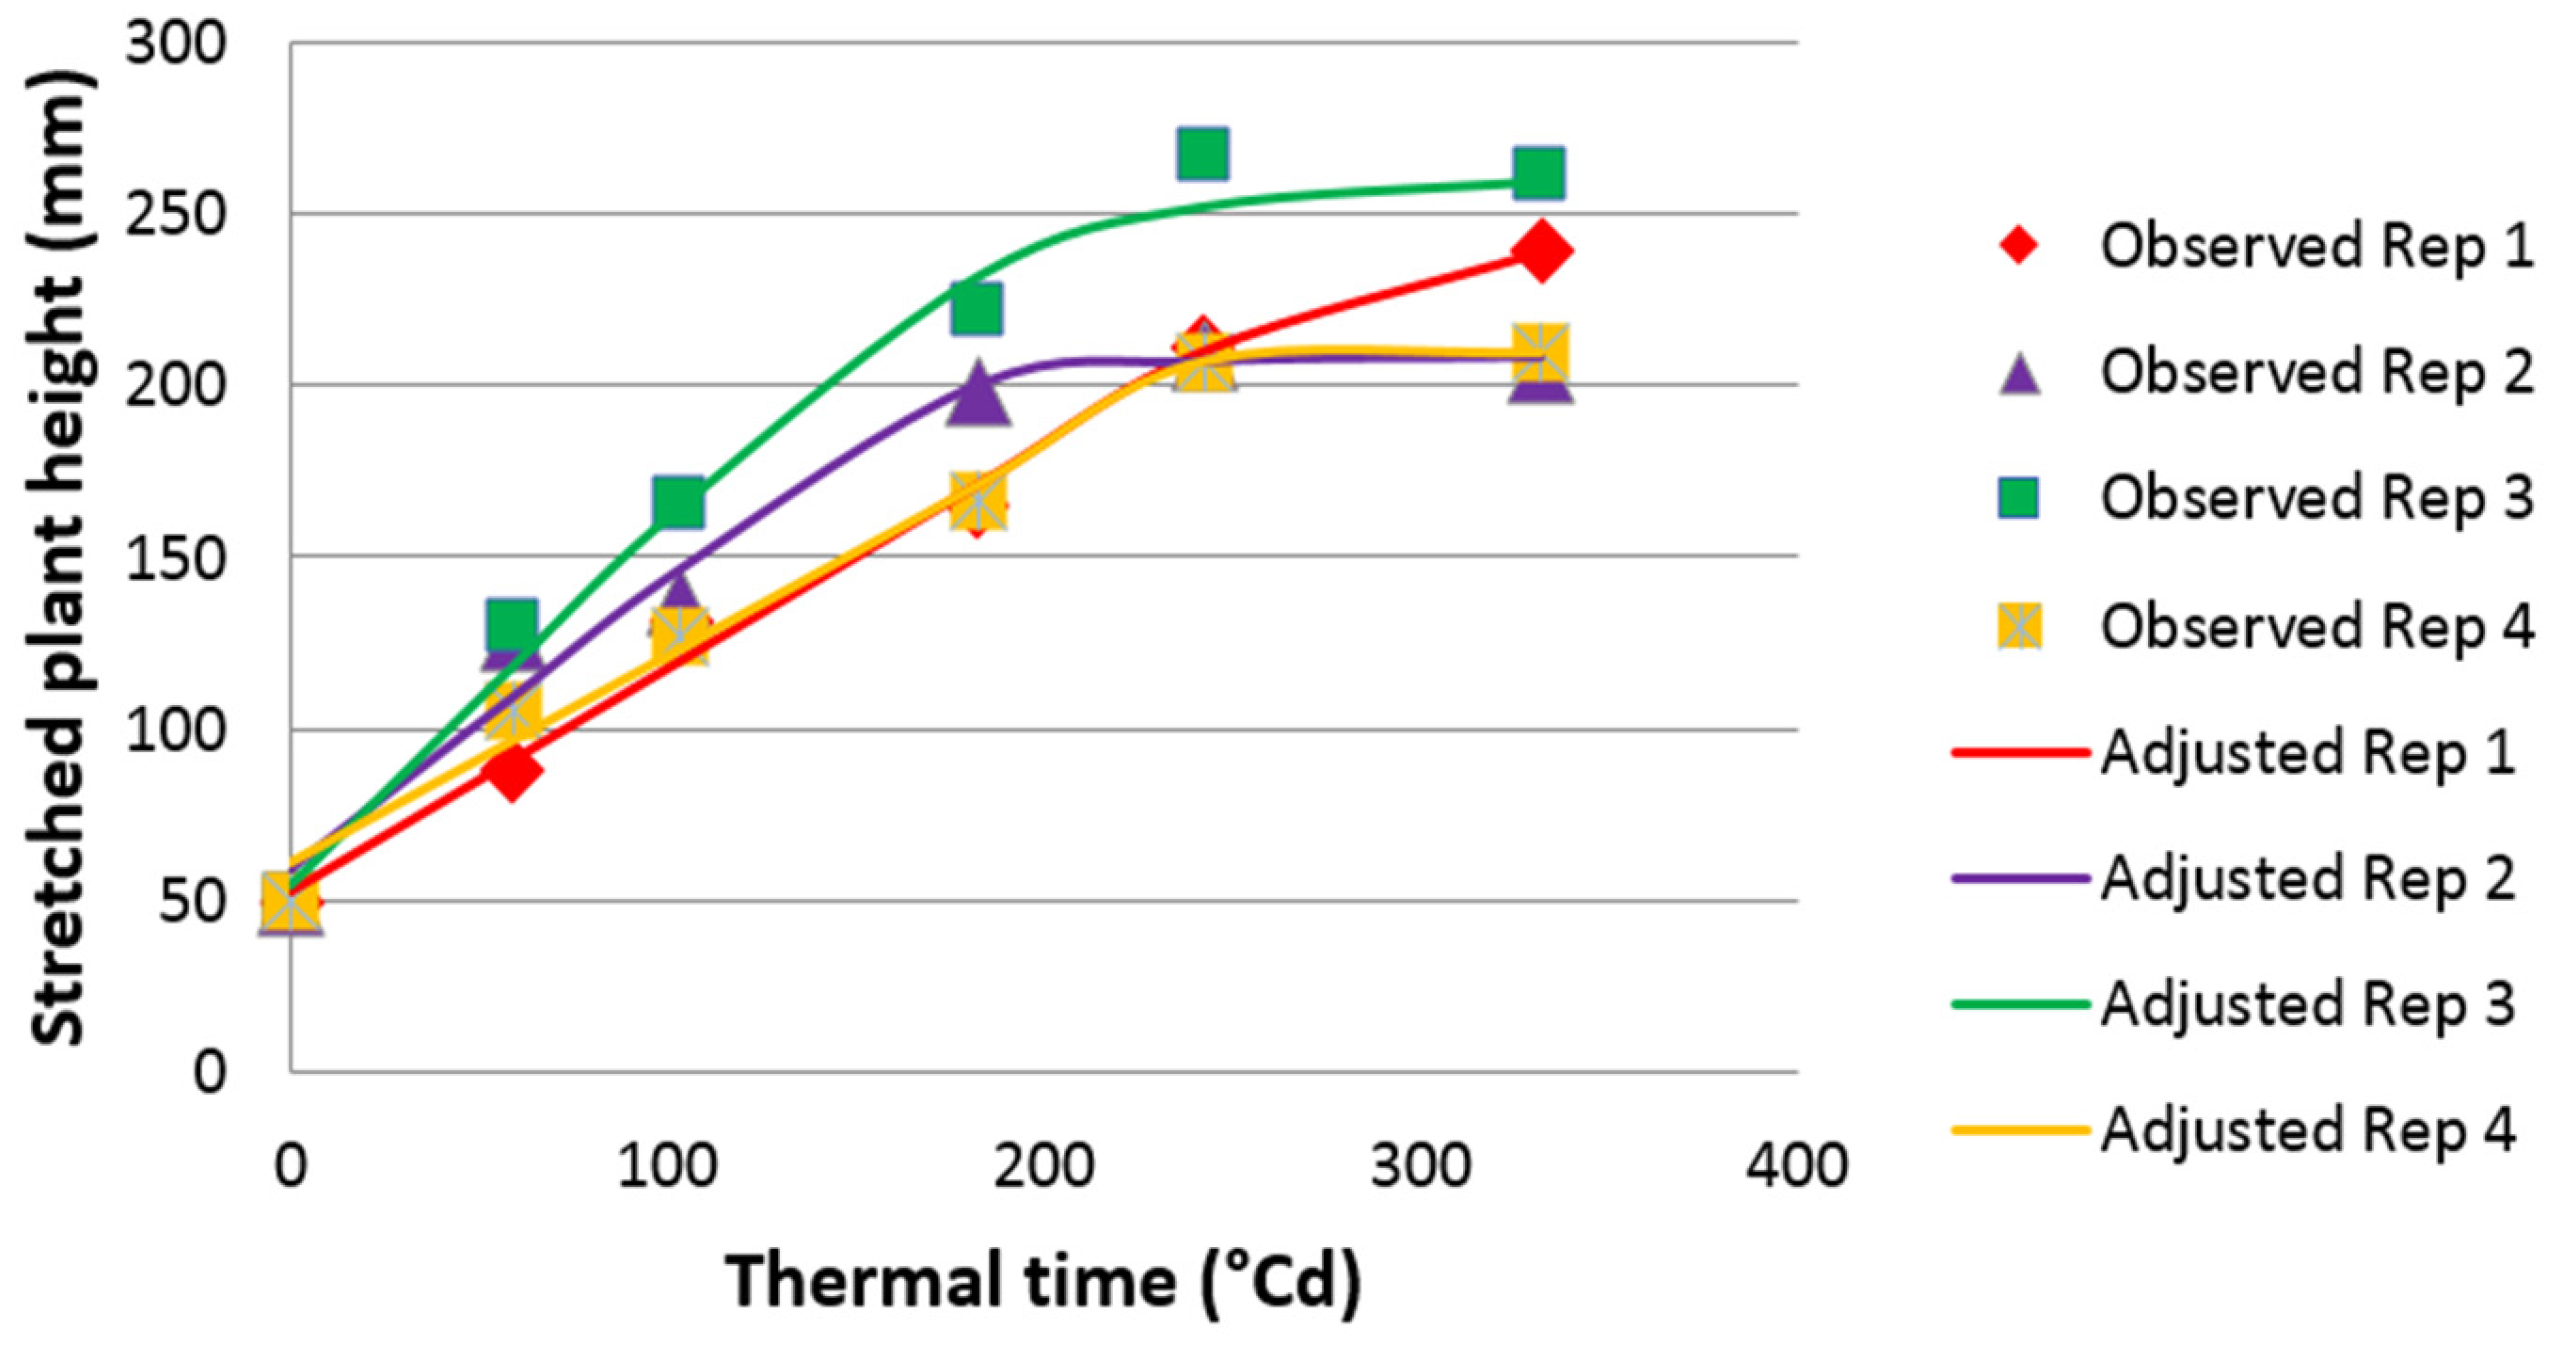
Plants were cut at 5 cm height and fertilised with 50 U of nitrogen on 24 March 2009 and again on 16 July 2009. Stretched plant height (PH) was measured, on 18 March (PH0309), then every seven days from 1 April to 28 April (PH0409_1 to PH0409_5) and on 29 September after 11 weeks of regrowth (PH0909). The value of PH was measured using a modified HerboMETRE® (ARVALIS-Institut du Végétal, Paris, France) which made it possible to stretch the leaves and to record plant height from the ground to the top of the longest leaf.
For each genotype, 50 mg of fresh leaves were harvested and DNA was extracted as in [
24] (i.e., CTAB (Cetyl Trimethyl Ammonium Bromide) followed by chloroform/octanol (24/1) purification). A total of 283 SSR (Simple Sequence Repeat) and STS (Sequence-Tagged Site) were tested for their polymorphism within the six parents of the polycross. A set of 82 markers evenly spread across the genome were selected to genotype the 252 genotypes (
Table 6) as described in [
24] (i.e., separation of PCR (Polymerase Chain Reaction) products on a 6.5% acrylamide gel with a LI-COR DNA sequencer 4200 and coding with SAGA Generation 2 software).
To estimate the maximum plant growth rate (PGR) in spring 2009, a non-equilateral hyperbolic function was fitted between PH from 1 April to 28 April (five measurements) and thermal time (base 0 °C), using the NLIN procedure of SAS [
46] as in [
22] to estimate maximum leaf elongation rate.
For both PH and PGR, an analysis of variance was carried out using the GLM procedure in the SAS software package [
46] with the following model: Y
ij = μ + G
i + B
j + E
ij, where μ is the global mean, G
i is the effect of genotype
i, B
j is the effect of replication (four replications), and E
ij is the error term. The Kolmogorov–Smirnov test in the UNIVARIATE procedure was used to test the normality of the error term E
ij in order to detect potential aberrant data. The adjusted mean for each genotype, used for QTL analyses, was computed with LSMEANS in the GLM procedure. The genotype and error variances were estimated with the VARCOMP procedure in the SAS software package. Broad-sense heritabilities (H
2) were calculated as H
2 = σ
2g/(σ
2g + σ
2e) [
5], where σ
2g is the genetic variance and σ
2e is the error variance. Pearson correlation coefficients were calculated with the Statistica software [
47] for pair-wise combinations of mean data for each genotype.
Molecular markers allowed the detection of 32 genotypes for which the male parent was not present in the polycross and 21 plants obtained by self-fertilisation. These plants were discarded in the analyses. Moreover, eight genotypes died in the field. Finally, 191 genotypes were used in the analyses.
For each of the six parents included in the polycross, one genetic map was built with the Joinmap software [
48]. The Haldane distance was used. To increase the number of recombination events counted for each parent, the molecular data for Nemo A, Nemo B, and Nemo H from [
24] were used to construct the maps of these genotypes and to determine the phase between markers belonging to the same linkage group. For each map, the linkage groups were defined with a Logarithm of Odds (LOD score) higher than 3. For each parent, the phases between markers belonging to the same linkage group were determined with Joinmap. The maps were then combined with the “combine maps” option of Joinmap. The linkage map was drawn using MapChart 2.1 [
49].
The QTL were detected with the software MCQTL with the Outbred module [
50] as in [
24]. The multipopulation connected analysis was used [
38] to detect QTL in the six parents within a single model, taking into account additive effects. For each parent, the additive effect was calculated as half the difference between the averages of the two allelic classes.


