
The Effect of Anaerobic and Aerobic Fish Sludge Supernatant on Hydroponic Lettuce

 ,
,  ,
,  , ,
, , 

Abstract
:
1. Introduction
2. Materials and Methods
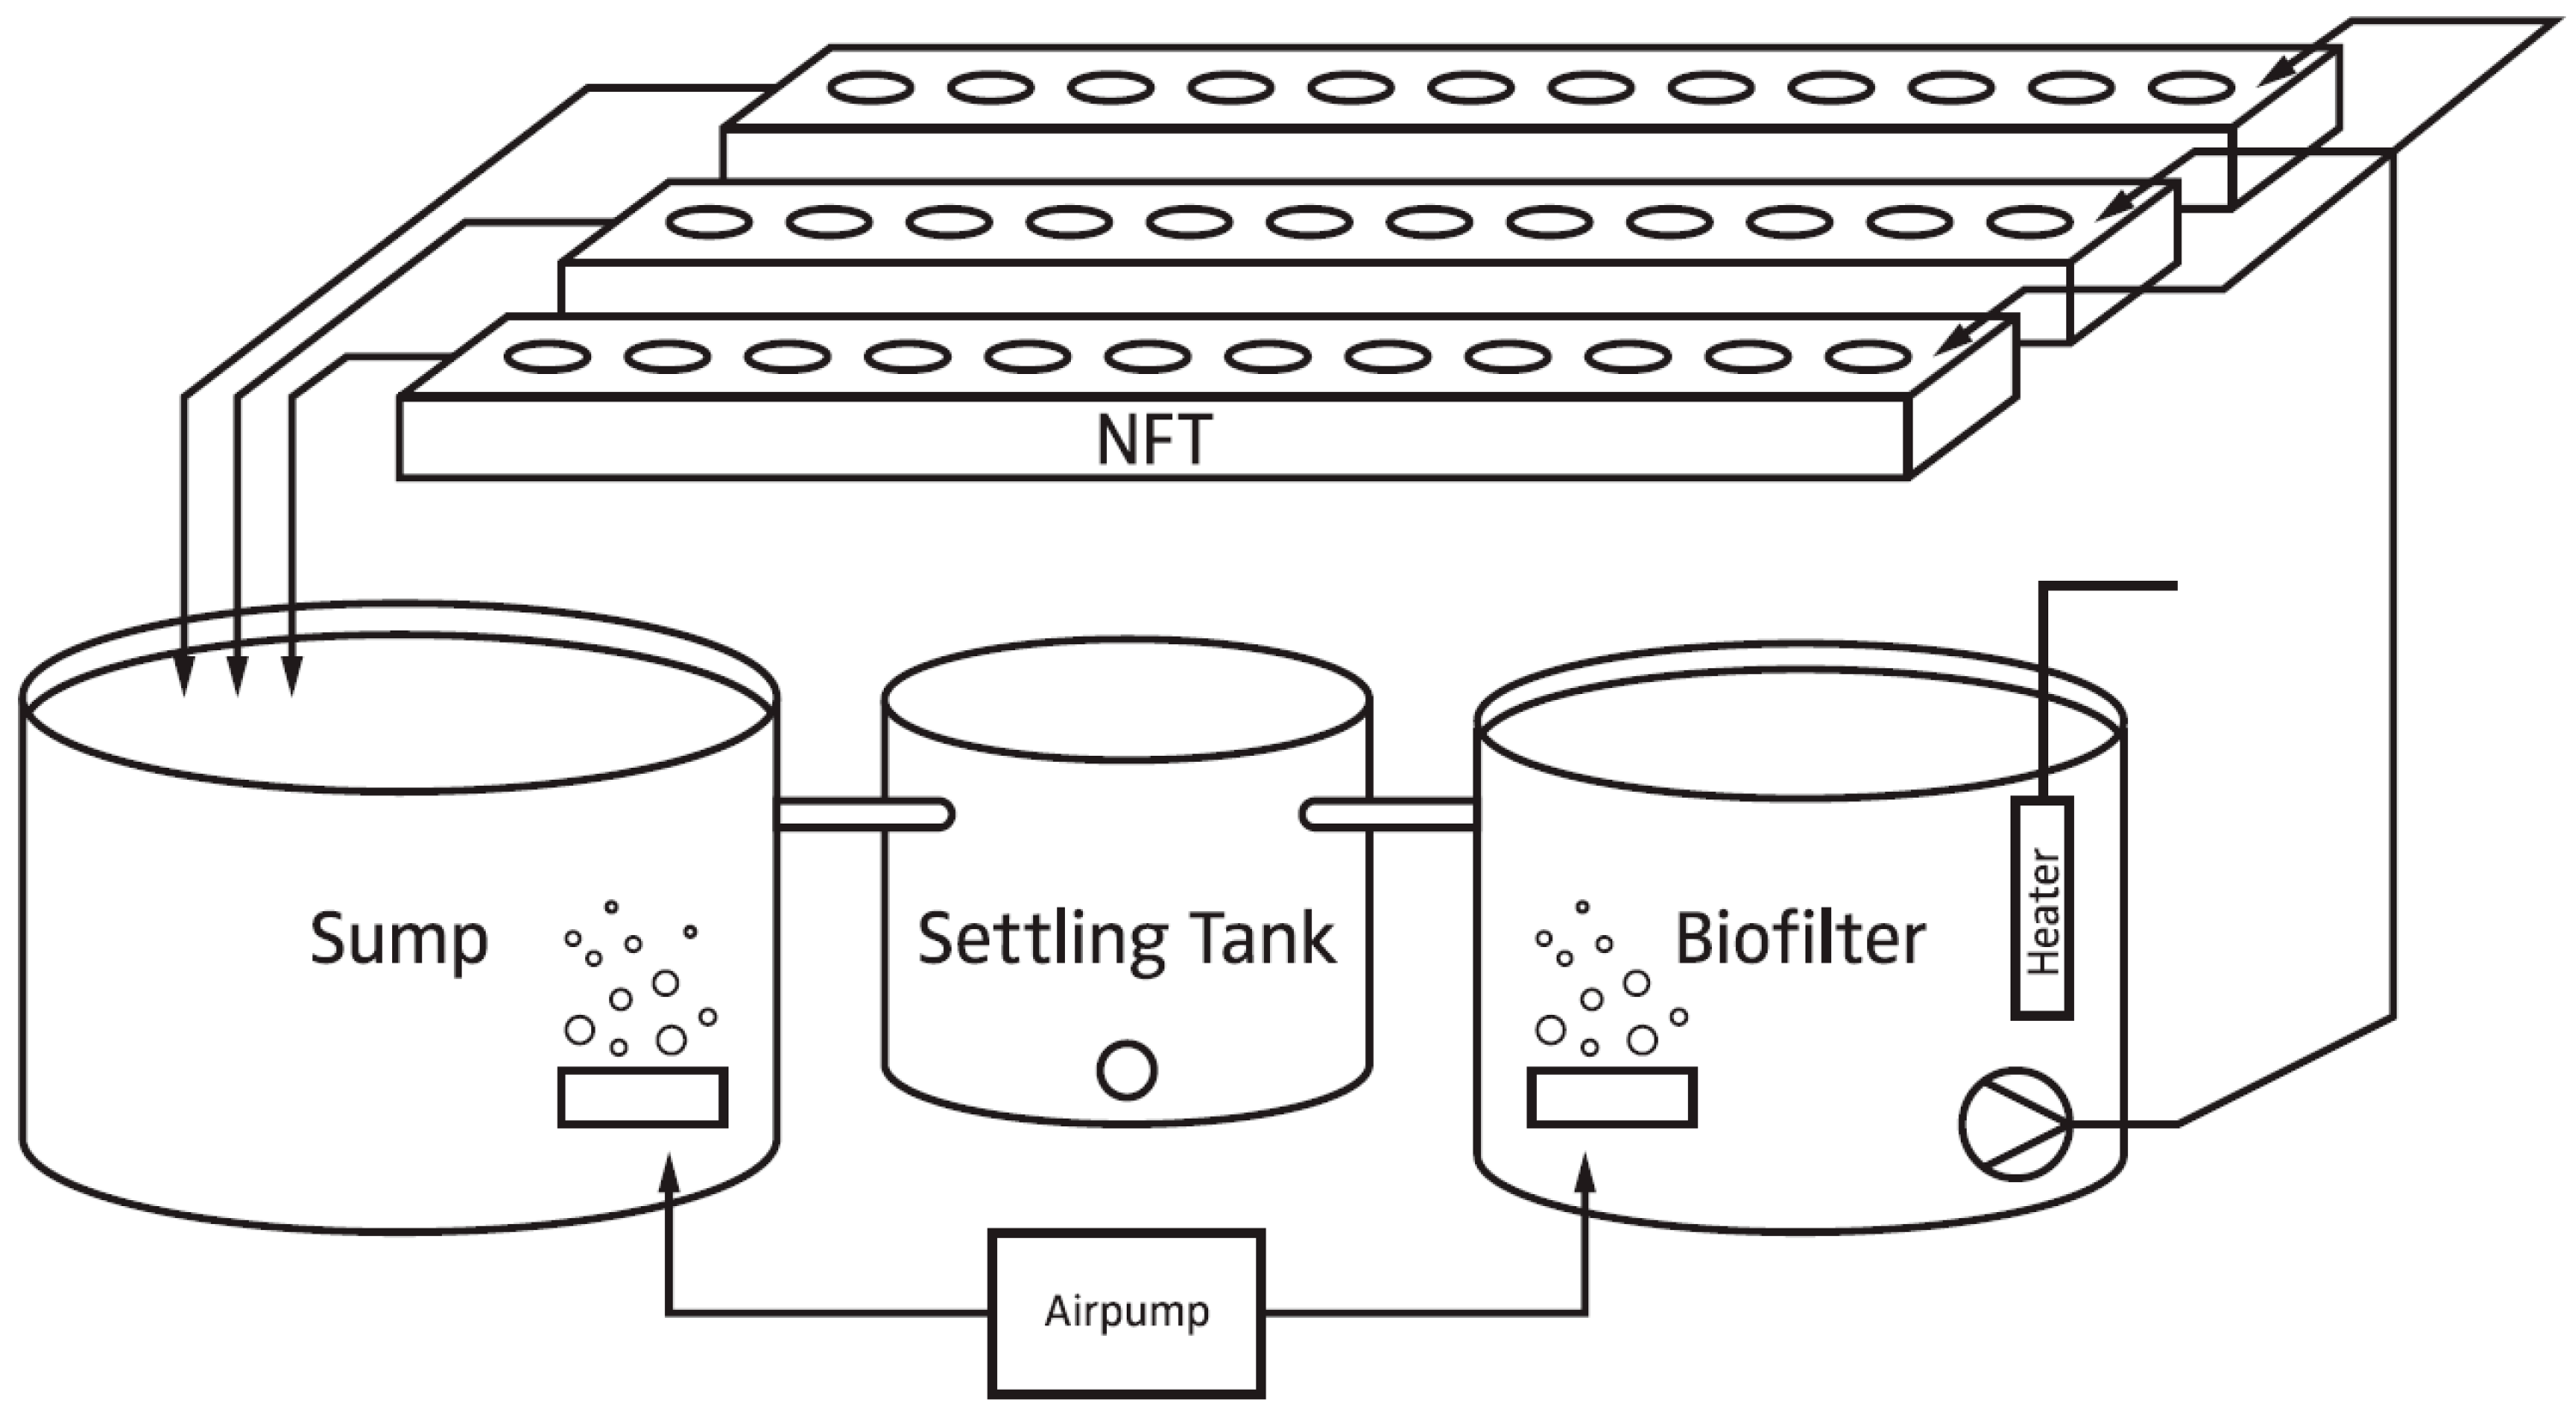
2.1. Experimental Setup
2.2. Supernatant and Water Analysis
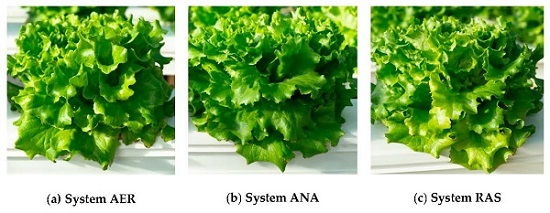
2.3. Lettuce
2.4. Statistical Analysis
3. Results & Discussion
4. Conclusions
Acknowledgments
Author Contributions
Conflicts of Interest
Appendix

| Macronutrient | System AER | System ANA | System RAS |
|---|---|---|---|
| N | 53.7 ± 0.1 a | 54.6 ± 0. 4 a | 56.7 ± 0.5 b |
| C | 345.8 ± 6.9 a | 338.8 ± 7.2 a | 361.0 ± 8.2 b |
| H | 42.9 ± 3.1 a | 42.9 ± 2.0 a | 40.0 ± 3.2 a |
| P | 201.3 ± 0.7 a | 329.5 ± 1.3 b | 191.7 ± 1.10 c |
| K | 1473.33 ± 4.5 a | 2134.67 ± 4.0 b | 1437.7 ± 4.16 c |
| Ca | 1757.00 ± 1.7 a | 2504.33 ± 2.3 b | 1878.7 ± 1.46 c |
| Mg | 324.20 ± 0.8 a | 502.20 ± 1.7 b | 395.6 ± 0.78 c |
| S | 202.47 ± 0.7 a | 215.73 ± 0.8 b | 199.5 ± 0.36 c |
| Na | 135.33 ± 0.3 a | 306.47 ± 0.9 b | 231.9 ± 0.46 c |

References
- Neto, R.M.; Ostrensky, A. Nutrient load estimation in the waste of Nile tilapia Oreochromis niloticus (L.) reared in cages in tropical climate conditions. Aquac. Res. 2013, 46, 1309–1322. [Google Scholar] [CrossRef]
- Goddek, S.; Espinal, C.; Delaide, B.; Jijakli, H.M.; Schmautz, Z.; Wuertz, S.; Keesman, K.J. Navigating towards Decoupled Aquaponic Systems: A System Dynamic Design Approach. 2016, unpublished work. [Google Scholar]
- Timmons, M.B.; Ebeling, J.M. Recirculating Aquaculture, 3rd ed.; Ithaca Publishing Company LLC: Ithaca, NY, USA, 2013. [Google Scholar]
- Rafiee, G.; Saad, C.R. Nutrient cycle and sludge production during different stages of red tilapia (Oreochromis sp.) growth in a recirculating aquaculture system. Aquaculture 2005, 244, 109–118. [Google Scholar] [CrossRef]
- Shnel, N.; Barak, Y.; Ezer, T.; Dafni, Z.; van Rijn, J. Design and performance of a zero-discharge tilapia recirculating system. Aquac. Eng. 2002, 26, 191–203. [Google Scholar] [CrossRef]
- Suzuki, Y.; Maruyama, T.; Numata, H.; Sato, H.; Asakawa, M. Performance of a closed recirculating system with foam separation, nitrification and denitrification units for intensive culture of eel: Towards zero emission. Aquac. Eng. 2003, 29, 165–182. [Google Scholar] [CrossRef]
- Monsees, H.; Keitel, J.; Kloas, W.; Wuertz, S. Potential reuse of aquacultural waste for nutrient solutions in aquaponics. In Oral presentation at Aquaculture Europe; Aquaculture Europe: Rotterdam, The Netherlands, 2015. [Google Scholar]
- Jijakli, M.H.; Delaide, B.; Gott, J. Plant production capacity and nutrient mass balance in the PAFF Box, an urban aquaponics module: Preliminary findings. 2016. submitted for publication. [Google Scholar]
- Krishnasamy, K.; Nair, J.; Bäuml, B. Hydroponic system for the treatment of anaerobic liquid. Water Sci. Technol. 2012, 65, 1164–1171. [Google Scholar] [CrossRef] [PubMed]
- Penetra, R.; Reali, M.; Foresti, E.; Campos, J. Post-treatment of effluents from anaerobic reactor treating domestic sewage by dissolved-air flotation. Water Sci. Technol. 1999, 40, 137–143. [Google Scholar] [CrossRef]
- Salminen, E.; Rintala, J.; Härkönen, J.; Kuitunen, M.; Högmander, H.; Oikari, A. Anaerobically digested poultry slaughterhouse wastes as fertiliser in agriculture. Bioresour. Technol. 2001, 78, 81–88. [Google Scholar] [CrossRef]
- De Lemos Chernicharo, C.A. Anaerobic Reactors, 4th ed.; IWA Publishing: New Delhi, India, 2007. [Google Scholar]
- R Core Team. R: A Language and Environment for Statistical Computing; R Foundation for Statistical Computing: Vienna, Austria, 2012. [Google Scholar]
- Resh, H.M. Hydroponic Food Production: A Definite Guidebook for the Advanced Home Gardener and the Commercial Hydroponic Grower, 7th ed.; CRC Press: London, UK, 2013. [Google Scholar]
- Mirzoyan, N.; McDonald, R.C.; Gross, A. Anaerobic Treatment of Brackishwater Aquaculture Sludge: An Alternative to Waste Stabilization Ponds. J. World Aquac. Soc. 2012, 43, 238–248. [Google Scholar] [CrossRef]
- Mirzoyan, N.; Gross, A. Use of UASB reactors for brackish aquaculture sludge digestion under different conditions. Water Res. 2013, 47, 2843–2850. [Google Scholar] [CrossRef] [PubMed]
- Suhr, K.I.; Letelier-Gordo, C.O.; Lund, I. Anaerobic digestion of solid waste in RAS: effect of reactor type on the biochemical acidogenic potential (BAP) and assessment of the biochemical methane potential (BMP) by a batch assay. Aquac. Eng. 2015, 65, 65–71. [Google Scholar] [CrossRef]
- Gangagni Rao, A.; Krishna Prasad, K.; Venkata Naidu, G.; Chandrashekar Rao, N.; Sarma, P.N. Removal of sulfide in integrated anaerobic?aerobic wastewater treatment system. Clean Technol. Environ. Policy 2003, 6, 66–72. [Google Scholar] [CrossRef]
- Krayzelova, L.; Bartacek, J.; Díaz, I.; Jeison, D.; Volcke, E.I.P.; Jenicek, P. Microaeration for hydrogen sulfide removal during anaerobic treatment: A review. Rev. Environ. Sci. Bio/Technol. 2015, 14, 703–725. [Google Scholar] [CrossRef]
- Lynch, J.; Marschner, P.; Rengel, Z. Effect of Internal and External Factors on Root Growth and Development. In Marschner’s Mineral Nutrition of Higher Plants; Marschner, P., Ed.; Elsevier Ltd: London, UK, 2012; pp. 331–346. [Google Scholar]
- Jones, B.J. Hydroponics—A Practical Guide for the Soilless Grower, 2nd ed.; CRC Press: Boca Raton, FL, USA, 2005. [Google Scholar]
- Sonneveld, C. Composition of nutrient solutions. In Hydroponic Production of Vegetables and Ornamentals; Embryo Publisher: Athens, Greece, 2002; pp. 179–2010. [Google Scholar]
- Marschner, H. Marschner’s Mineral Nutrition of Higher Plants; Elsevier: London, UK, 2012. [Google Scholar]
- Savvas, D.; Passam, H.C.; Olympios, C.; Nasi, E.; Moustaka, E.; Mantzos, N.; Barouchas, P. Effects of Ammonium Nitrogen on Lettuce Grown on Pumice in a Closed Hydroponic System. HortScience 2006, 41, 1667–1673. [Google Scholar]
- Stofberg, S.F.; Klimkowska, A.; Paulissen, M.P.C.P.; Witte, J.-P.M.; van der Zee, S.E.A.T.M. Effects of salinity on growth of plant species from terrestrializing fens. Aquat. Bot. 2015, 121, 83–90. [Google Scholar] [CrossRef]
- Hill, S.; Abaidoo, R.; Miyasaka, S. Sodium Chloride Concentration Affects Early Growth and Nutrient Accumulation in Taro. HortScience 1998, 33, 1153–1156. [Google Scholar]
- Neumann, G.; Römheld, V. Rhizosphere Chemistry in Relation to Plant Nutrition. In Marschner’s Mineral Nutrition of Higher Plants2; Marschner, P., Ed.; Elsevier Ltd.: London, UK, 2012; pp. 347–368. [Google Scholar]
- Dudal, R.; Roy, R.N. Integrated Plant Nutrition Systems: Report of an Expert Consultation, Rome, Italy, 13–15 December 1993; Food & Agriculture Org.: Roma, Italy, 1995. [Google Scholar]
- Silber, A.; Yones, L.B.; Dori, I. Rhizosphere pH as a result of nitrogen levels and NH4 /NO3 ratio and its effect on zinc availability and on growth of rice flower (Ozothamnus diosmifolius). Plant Soil 2004, 262, 205–213. [Google Scholar] [CrossRef]
- Marschner, H. Mineral Nutrition of Higher Plants; Academic Press: London, UK, 1986. [Google Scholar]
- Lucas, R.E.; Davis, J.F. Relationships between pH values of organic soils and availabilities of 12 plant nutrients. Soil Sci. 1961, 92, 177–182. [Google Scholar] [CrossRef]
- Polomski, R.F. South Carolina Master Gardener Training Manual; Clemson University: Clemson, SC, USA, 2007. [Google Scholar]
- Resh, H.M. Hydroponic Food Production: A Definitive Guidebook for the Advanced Home Gardener and the Commercial Hydroponic Grower; CRC Press: Boca Raton, FL, USA, 2012. [Google Scholar]
- Sonneveld, C.; Voogt, W. Nutrient Management in Substrate Systems. In Plant Nutrition of Greenhouse Crops; Springer Netherlands: Berlin, Germany, 2009; pp. 277–312. [Google Scholar]
- Pang, J.; Cuin, T.; Shabala, L.; Zhou, M.; Mendham, N.; Shabala, S. Effect of secondary metabolites associated with anaerobic soil conditions on ion fluxes and electrophysiology in barley roots. Plant Physiol. 2007, 145, 266–276. [Google Scholar] [CrossRef] [PubMed]
- Haghighi, M. The effect of humic and glutamic acids in nutrient solution on the N metabolism in lettuce. J. Sci. Food Agric. 2012, 92, 3023–3028. [Google Scholar] [CrossRef] [PubMed]
- Ruzzi, M.; Aroca, R. Plant growth-promoting rhizobacteria act as biostimulants in horticulture. Sci. Hortic. 2015, 196, 124–134. [Google Scholar] [CrossRef]


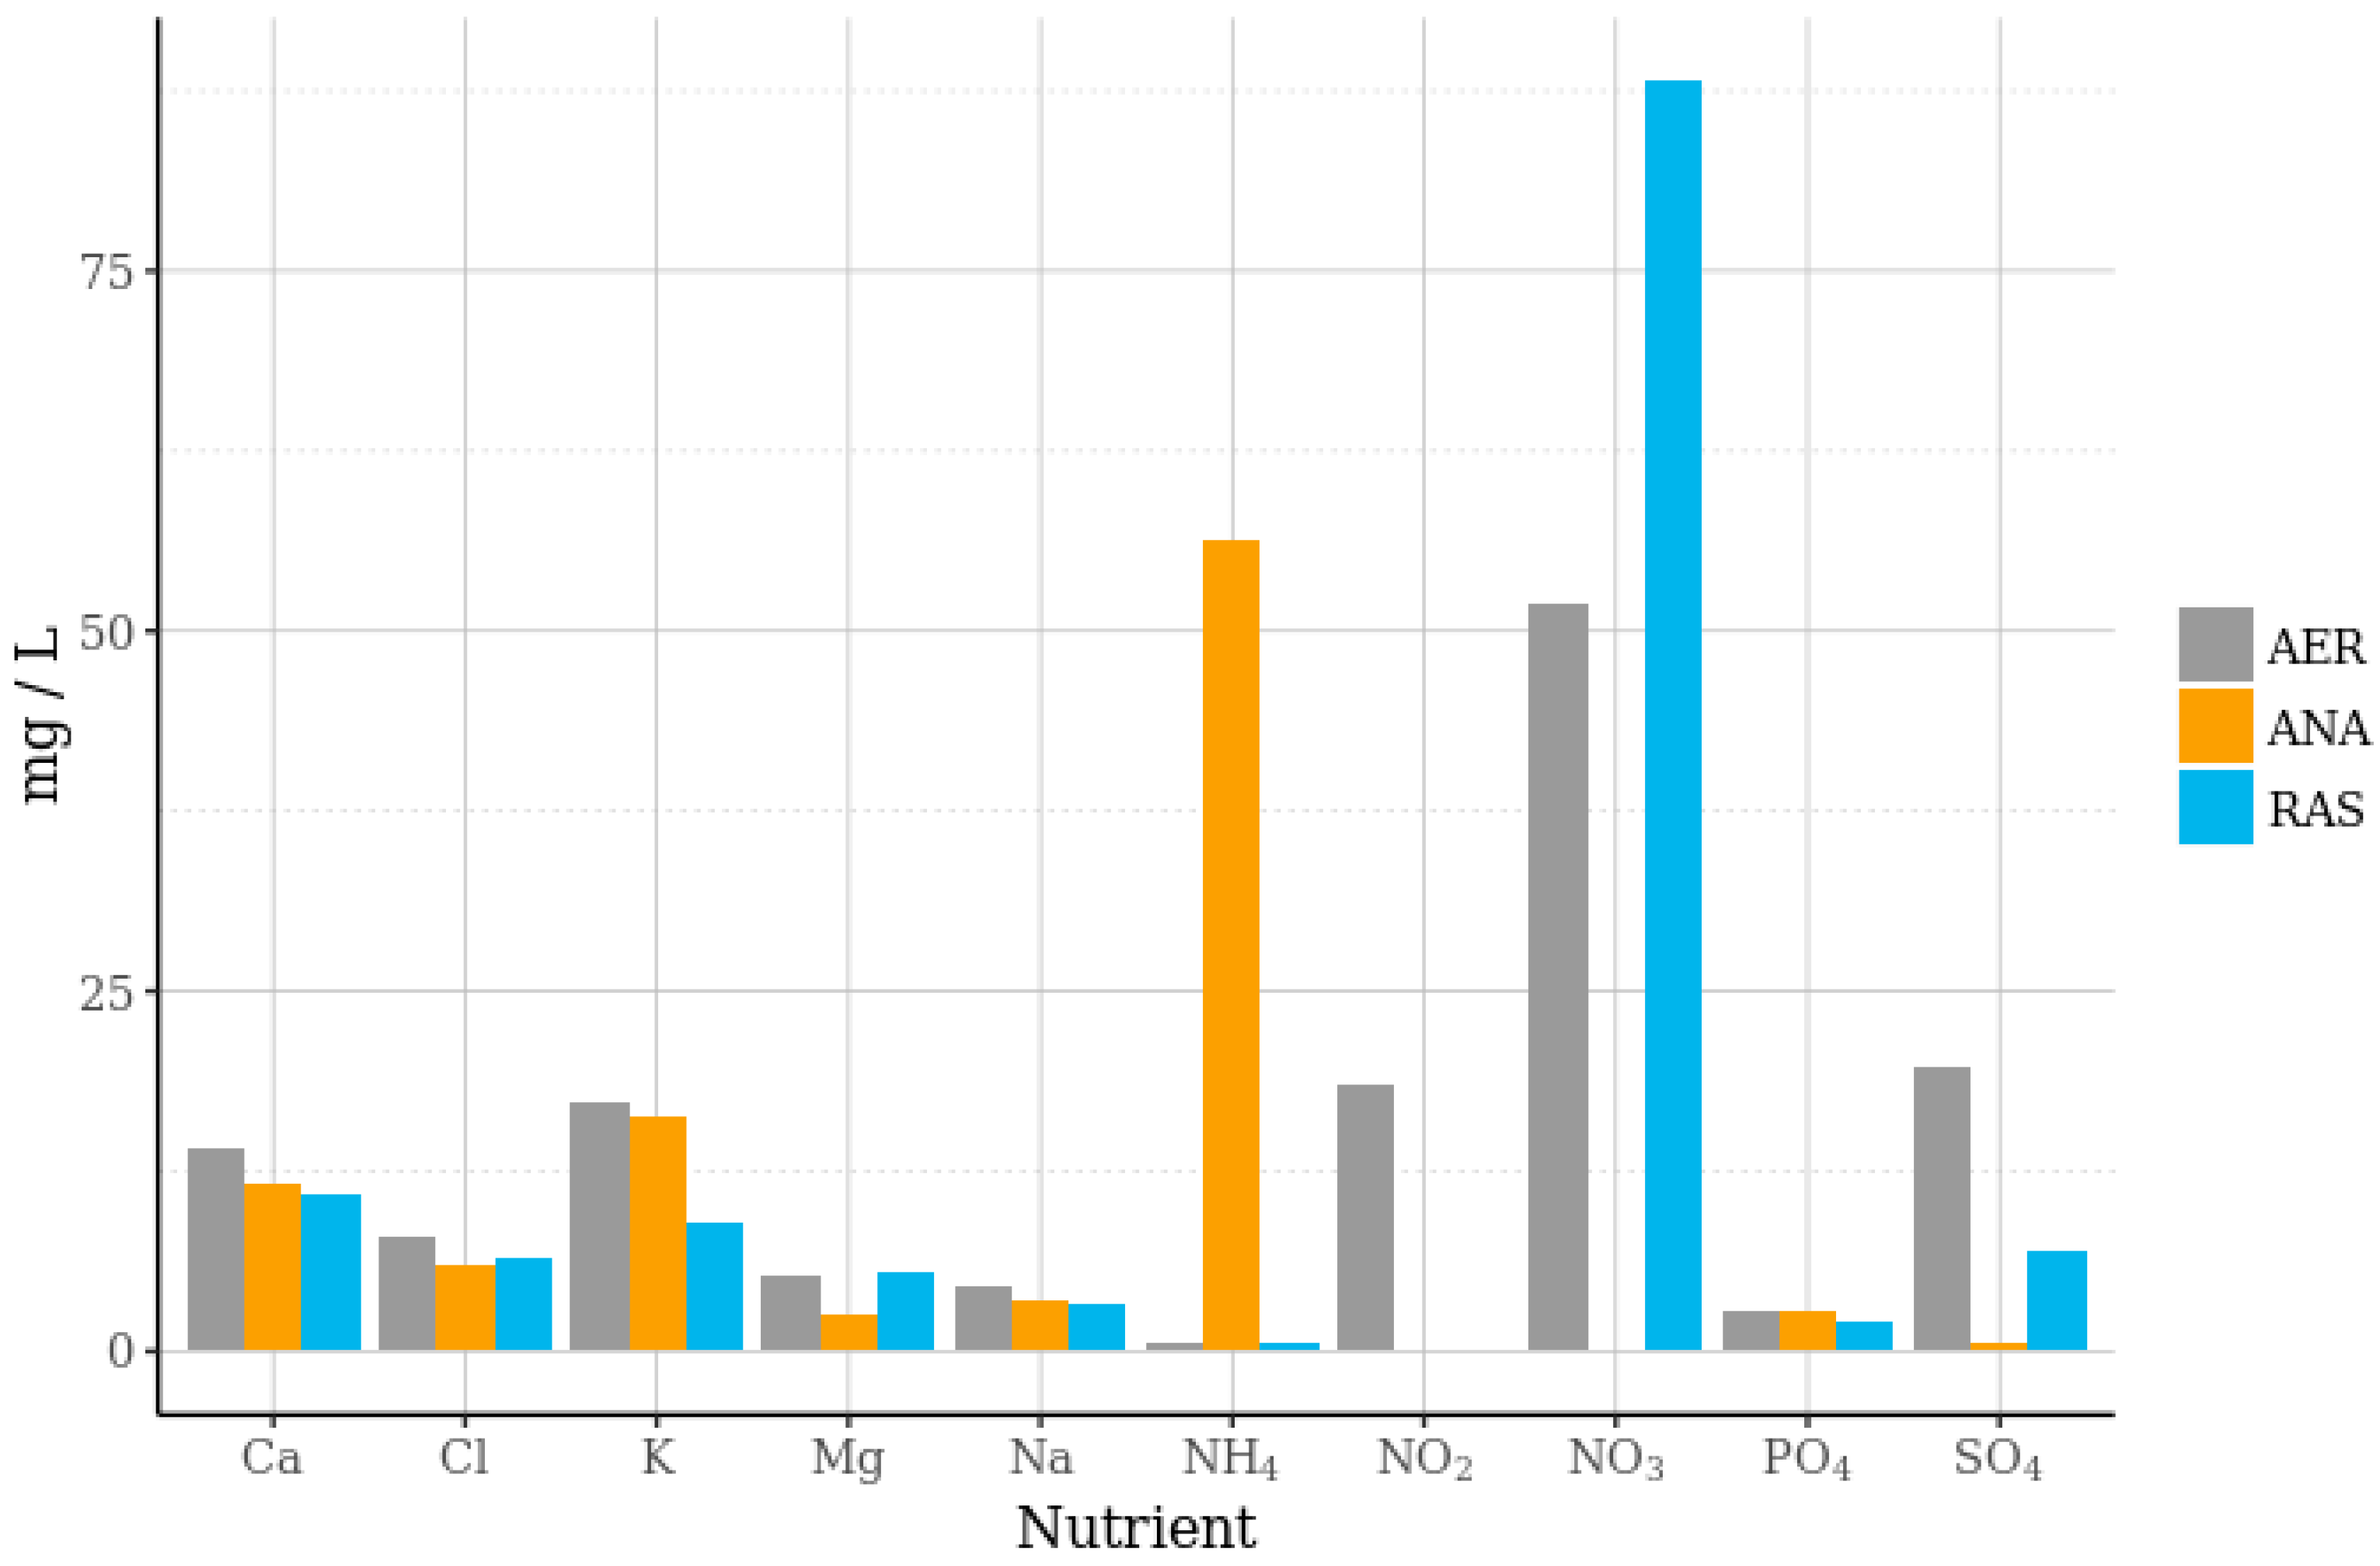
| Cl | NO2 | NO3 | PO4 | SO4 | Na | NH4 | K | Ca | Mg | |
|---|---|---|---|---|---|---|---|---|---|---|
| AER 1 Supernatant | 7.9 | 18.5 | 51.8 | 2.7 | 19.7 | 4.4 | 0.7 | 17.2 | 14.2 | 5.1 |
| ANA 2 Supernatant | 6.1 | 0.0 | 0.0 | 2.7 | 0.5 | 3.6 | 56.4 | 16.3 | 11.7 | 2.5 |
| Tap | 0.3 | 0.0 | 0.2 | 0.0 | 0.8 | 4.9 | 0.0 | 1.0 | 59.8 | 16.3 |
| RAS 3 | 6.4 | 0.2 | 88.2 | 2.0 | 6.9 | 3.4 | 0.5 | 9.0 | 10.8 | 5.6 |
| System AER 1 | System ANA 2 | System RAS 3 (Control) | |
|---|---|---|---|
| DO 4 (mg/L) | 8.5 ± 0.3 | 8.4 ± 0.3 | 8.6 ± 0.3 |
| Water Temperatures (°C) | 22.9 ± 1.3 | 22.6 ± 1.6 | 21.2 ± 1.6 |
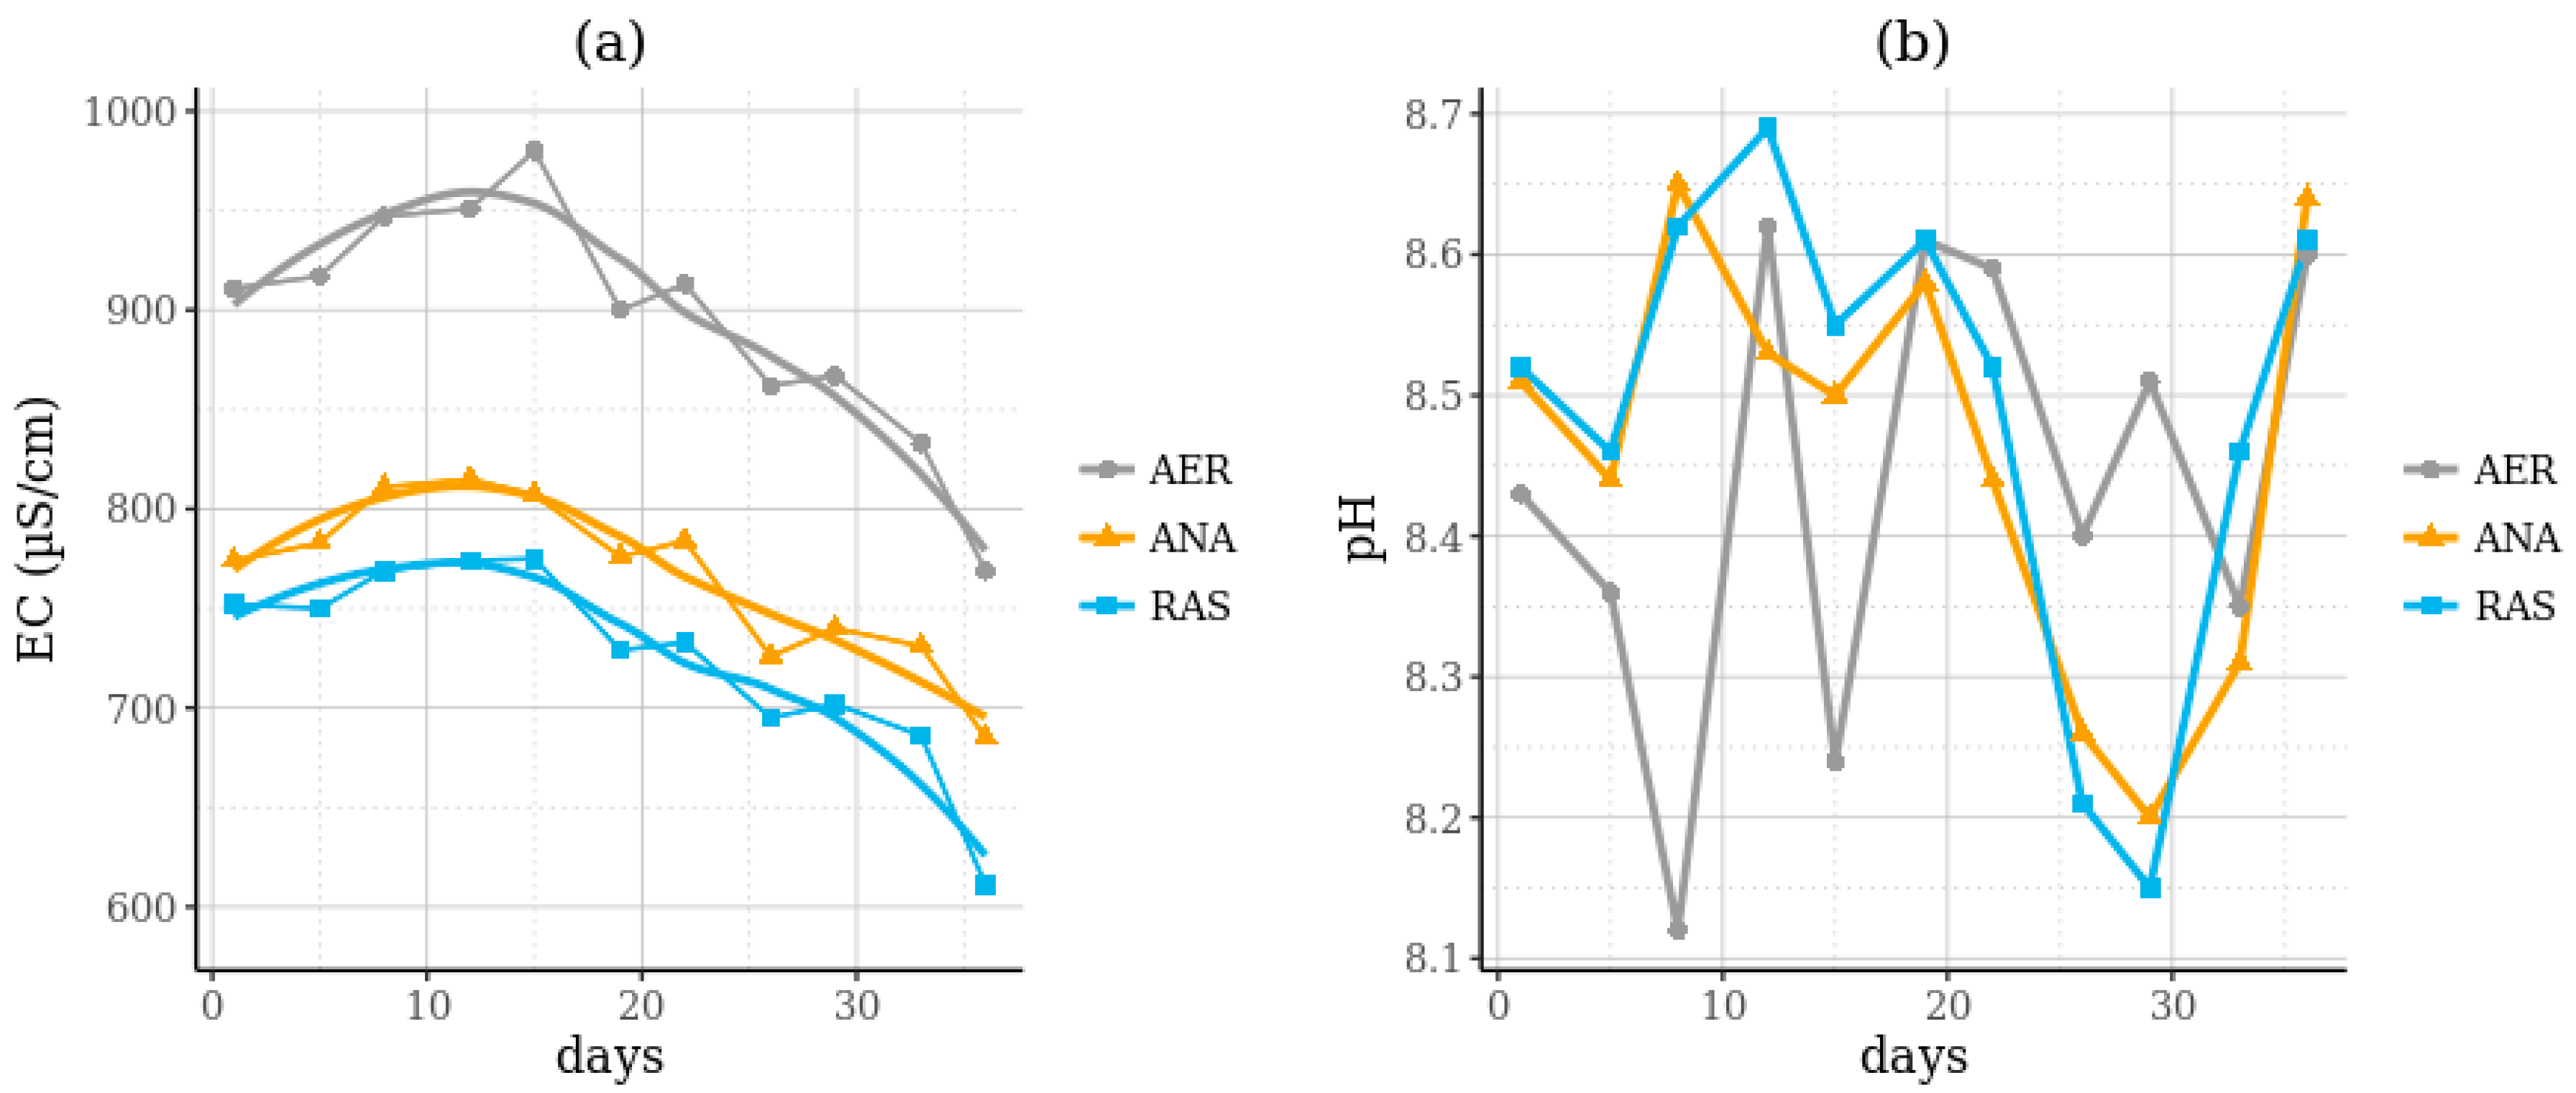
| EC 5 (μS/cm) | 895.5 ± 59.8 | 766.6 ± 41.2 | 725.1 ± 49.2 |
| pH | 8.4 ± 0.2 | 8.5 ± 0.2 | 8.5 ± 0.2 |
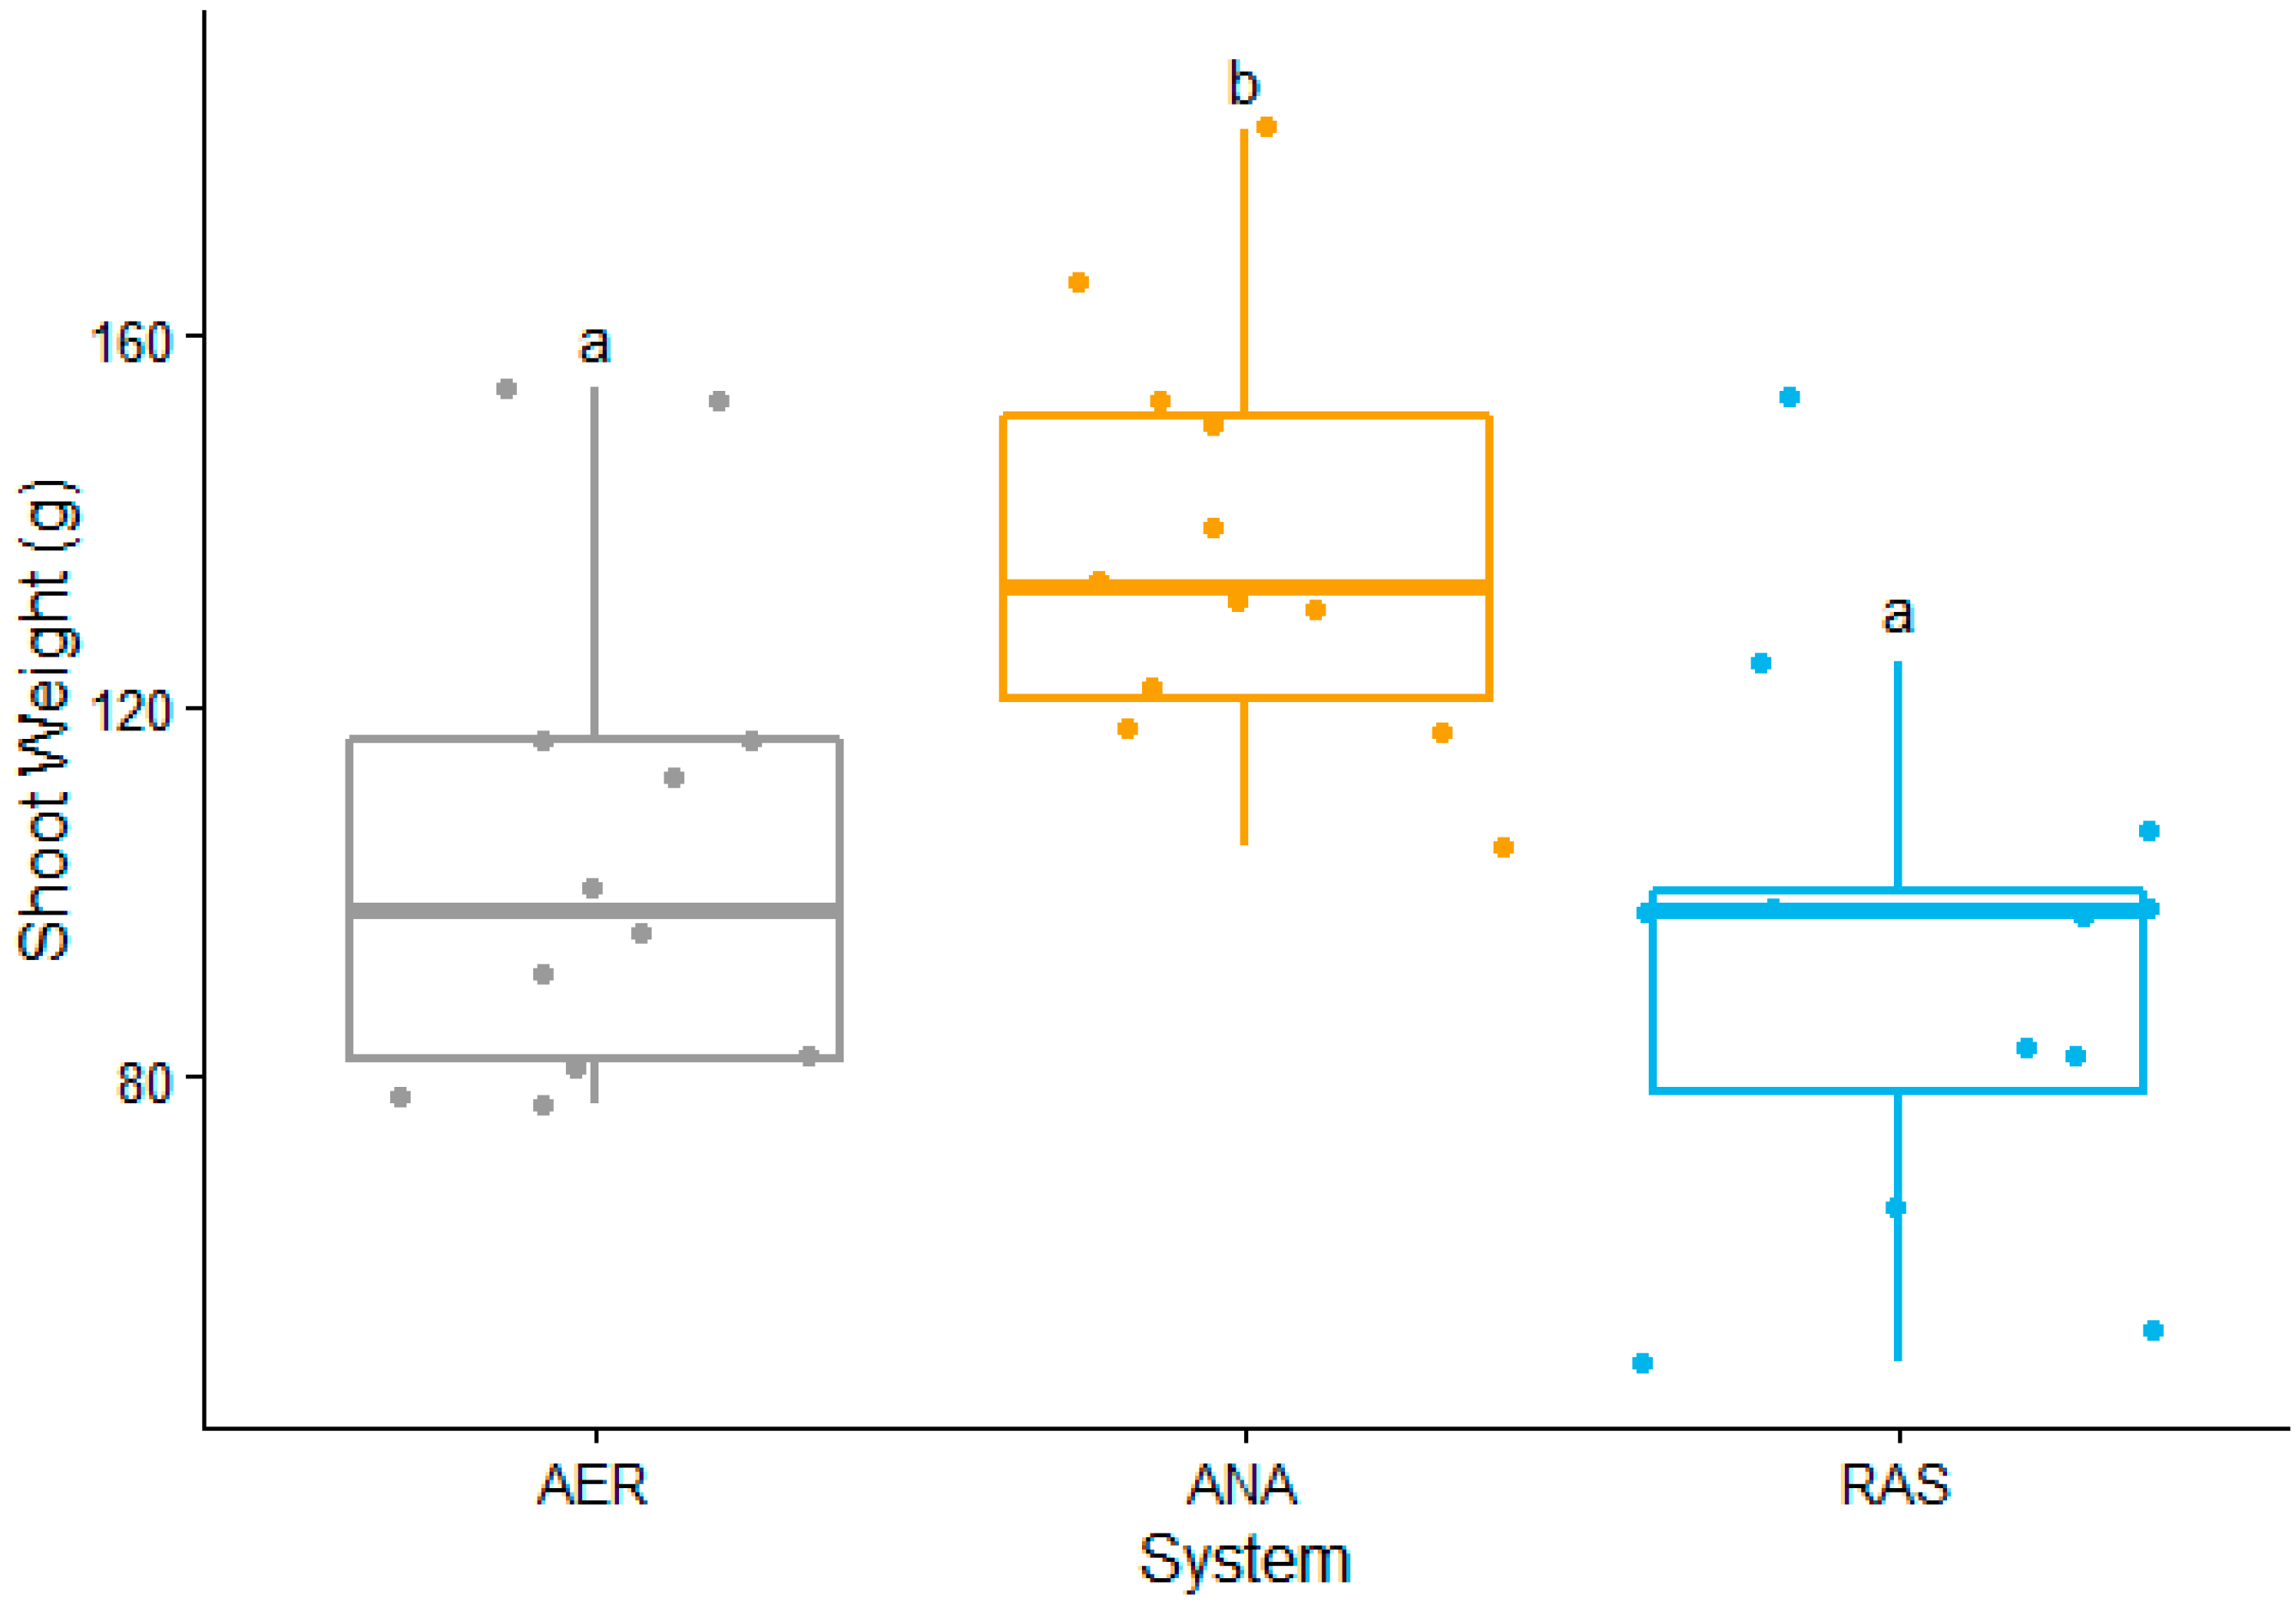
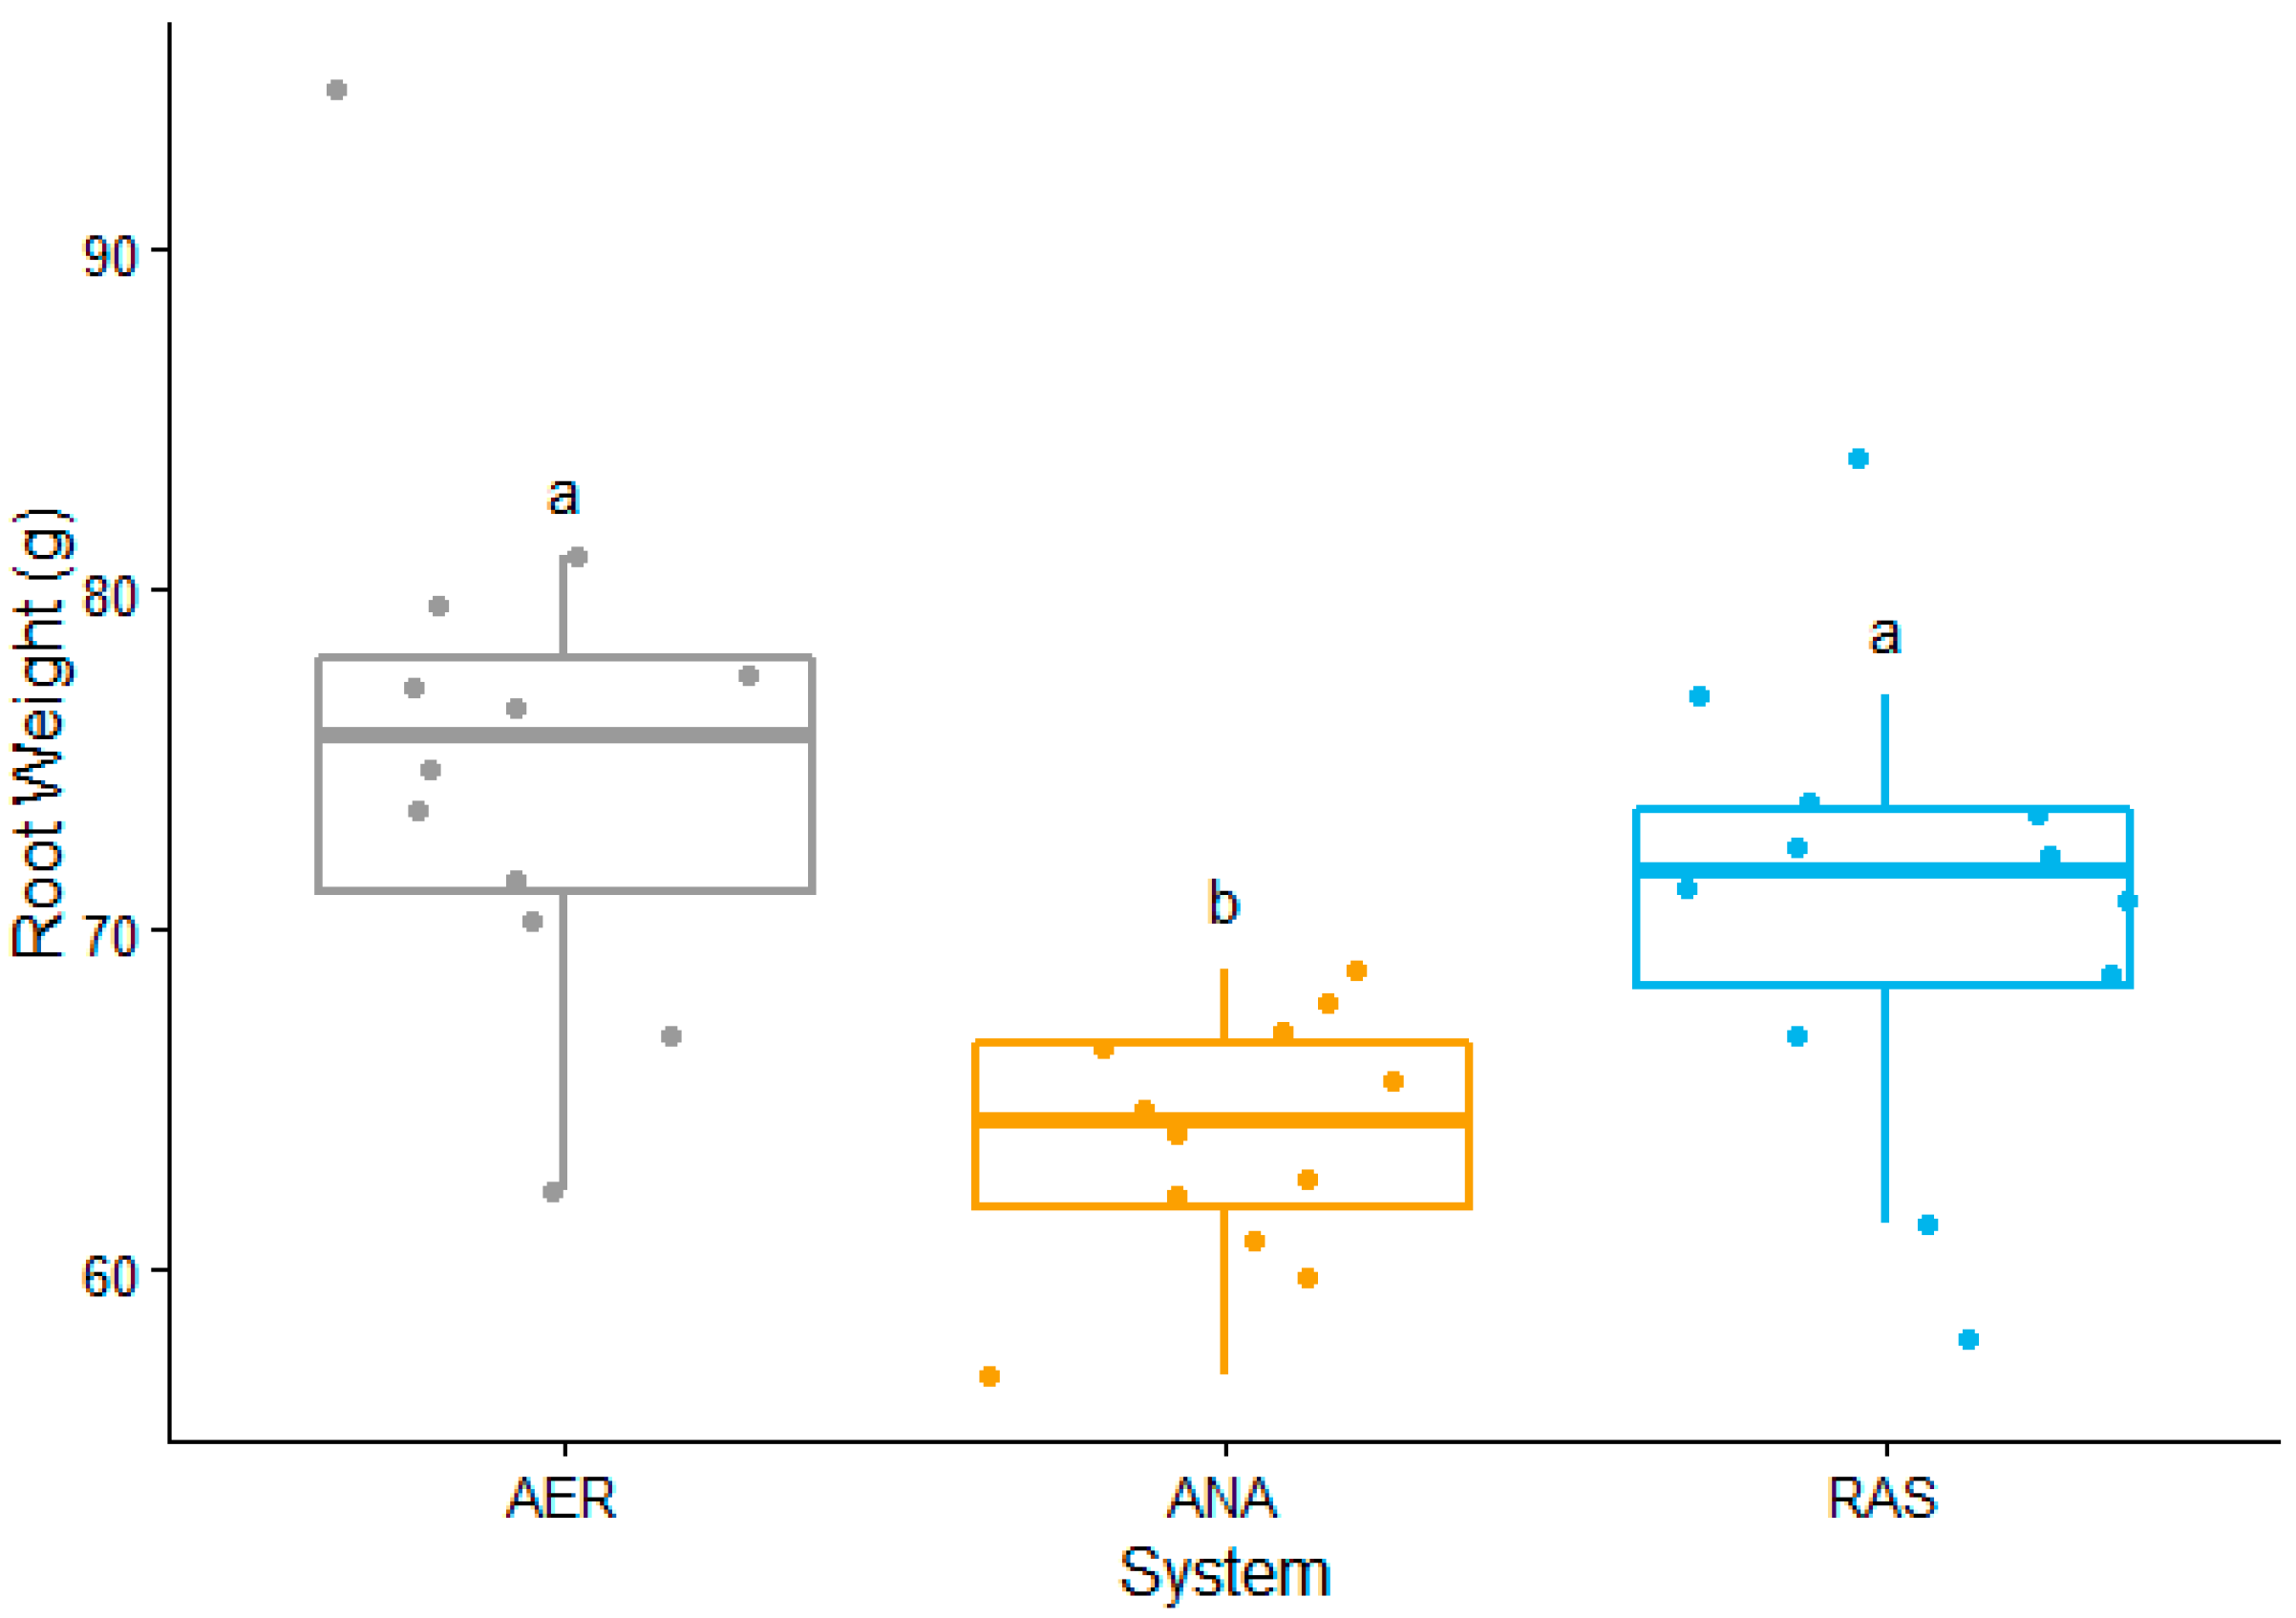
| Shoots | Roots | |||||
|---|---|---|---|---|---|---|
| System AER | System ANA | System RAS | System AER | System ANA | System RAS | |
| Min. | 77.1 | 105.0 | 49.0 | 62.3 | 56.9 | 58.0 |
| 1st Quantile | 81.8 | 120.9 | 78.2 | 71.1 | 61.9 | 68.3 |
| Median | 97.8 | 132.6 | 97.7 | 75.7 | 64.4 | 71.8 |
| Mean | 104.8 | 137.4 | 92.4 | 75.5 | 63.9 | 70.8 |
| 3rd Quantile | 116.4 | 151.1 | 100.2 | 78.0 | 66.6 | 73.5 |
| Max. | 154.4 | 182.5 | 153.5 | 94.7 | 68.8 | 83.9 |
© 2016 by the authors; licensee MDPI, Basel, Switzerland. This article is an open access article distributed under the terms and conditions of the Creative Commons Attribution (CC-BY) license (http://creativecommons.org/licenses/by/4.0/).
Share and Cite
Goddek, S.; Schmautz, Z.; Scott, B.; Delaide, B.; Keesman, K.J.; Wuertz, S.; Junge, R. The Effect of Anaerobic and Aerobic Fish Sludge Supernatant on Hydroponic Lettuce. Agronomy 2016, 6, 37. https://doi.org/10.3390/agronomy6020037
Goddek S, Schmautz Z, Scott B, Delaide B, Keesman KJ, Wuertz S, Junge R. The Effect of Anaerobic and Aerobic Fish Sludge Supernatant on Hydroponic Lettuce. Agronomy. 2016; 6(2):37. https://doi.org/10.3390/agronomy6020037
Chicago/Turabian StyleGoddek, Simon, Zala Schmautz, Ben Scott, Boris Delaide, Karel J. Keesman, Sven Wuertz, and Ranka Junge. 2016. "The Effect of Anaerobic and Aerobic Fish Sludge Supernatant on Hydroponic Lettuce" Agronomy 6, no. 2: 37. https://doi.org/10.3390/agronomy6020037
APA StyleGoddek, S., Schmautz, Z., Scott, B., Delaide, B., Keesman, K. J., Wuertz, S., & Junge, R. (2016). The Effect of Anaerobic and Aerobic Fish Sludge Supernatant on Hydroponic Lettuce. Agronomy, 6(2), 37. https://doi.org/10.3390/agronomy6020037