Article

Analysis of Temporal Variation of Soil Salinity during the Growing Season in a Flooded Rice Field of Thessaloniki Plain-Greece

1
ELGO-DIMITRA, Soil Science Institute of Thessaloniki, Thermi 57001, Greece
2
Department of Life Sciences and Biotechnology, University of Ferrara, Via L.Borsari 46, Ferrara 44121, Italy
3
Department of Hydraulics, Soil Science & Agricultural Engineering, School of Agriculture, Aristotle University of Thessaloniki, Thessaloniki 54124, Greece
*
Author to whom correspondence should be addressed.
Agronomy 2015, 5(1), 35-54; https://doi.org/10.3390/agronomy5010035
Submission received: 4 September 2014 / Revised: 14 January 2015 / Accepted: 2 February 2015 / Published: 5 February 2015

Abstract

:
The effects of regional water management practices (WMPs) on the soil salinity of a representative rice field under Mediterranean conditions (Thessaloniki plain, Greece) were investigated. The temporal variation of soil salinity parameters in the soil solution and in the exchangeable phase was monitored at and below the root zone (15–20 and 35–40 cm) during the growing season. The comparative analysis (ANOVA for p = 0.05) of the measurements before and after the growing season showed that: (a) for the soil solution of the 15–20 cm layer, Ca2+, Mg2+, K+, HCO3 and EC were significantly reduced, Na+ remained constant and Cl increased, while in the 35–40 cm layer no significant differences were detected to all parameters except for Cl which was increased; (b) for the exchangeable cations Ca2+, Mg2+ and K+ no significant differences were found, while exchangeable Na+ and ESP were significantly increased in both soil layers during the short period of soil drying before harvest. The final values of Na+ and ESP were quite low to indicate soil degradation hazard. Overall the results showed adequate performance of WMPs to preserve a good soil salinity status but with the cost of high water consumption, exceeding 2000 mm.

1. Introduction

More than 10% of irrigated lands worldwide are affected by salinity problems [1,2]. Soil degradation by salinity has become one of the major threats and it is expected to be intensified by the imminent climate change and the increase in irrigation demand [1,3,4,5]. One of the most interesting cases to investigate soil salinity components is the case of rice-fields. Rice cropping is often held responsible for soil sodification [6], while on the other hand irrigated rice cropping is practiced to reclaim saline-sodic soils in many parts of the world [7,8].
Continuous flooding conditions is the common practice for rice irrigation, especially in lowland plains [9], leading to increased water inflows for the attainment of an adequate ponding depth. The quality and amount of irrigation water, the evapotranspiration, the soil hydraulic properties and the drainage conditions of lowland fields are the main regulators of soil salinity.
Long-term submerged soils undergo physical changes which lead to the formation of a highly compacted layer below the root-zone [10], called “plow sole layer” and is considered as the major factor controlling infiltration rate and drainage in paddy rice fields [11,12,13,14]. Furthermore, infiltration can potentially be blocked by air entrapment due to surge flooding and shallow water table [15]. Boivin et al. [15] noted that if the downward water transfer is blocked under flooded conditions, then solutes supplied by the irrigation water may accumulate in the top soil. Wopereis et al. [16] demonstrated that the salinity level of the topsoil of rice-fields was decreased, because salts from the topsoil were gradually transferred downward by infiltration while infiltration blocked the upward transport of salts from the water table. Häfele et al. [17] indicated that the practice of wet soil-tillage (puddling), which is commonly used in Asian countries, leads to an increase of the puddled soil layer depth and new salts from the subsoil may be brought into the soil solution. Therefore, drainage control of rice fields is of primary significance in order to avoid soil salinization and sodification. In lowland plains with low permeable soils and high water table, drainage of rice soils is restricted and in many cases it is supported by controlled overland discharge [4]. In this case, any salt deposition-accumulation on soil surface is partially subjected to dissolution and flows out of the system by runoff.
There is a great number of studies dealing with the chemistry and physics of paddy rice in waterlogged soils [15,18,19,20,21,22,23,24], but there is still a lack of knowledge concerning solute dynamics under these conditions. The development and application of models which describe salinity components (anions-cations dynamics) in rice fields, remain a great challenge even though many have been developed to describe the water, nutrients (nitrogen, phosphorus) and pesticides transport under these conditions [12,25,26,27,28,29,30,31,32,33,34,35,36,37]. Methods based on water budget approaches in combination with the monitoring of salinity are common tools to analyze soil salinity components in rice fields [38,39,40,41].
The aim of this study is to investigate the changes of soil salinity during the growing season in a representative rice field of Thessaloniki plain in Greece, under the effects of regional water management practices (WMPs). To this aim, the temporal variation of salinity parameters at and below the root zone (15–20 and 35–40 cm) was monitored in the soil solution and in the exchangeable phase of the soil during one growing period. The comparative analysis of the measurements before and after the growing season was used to provide a discussion on the sustainability of water consumption in rice fields under Mediterranean conditions.

2. Materials and Methods

2.1. Study Site

Rice (Oryza sativa L.) was cultivated using the regional conventional practices under flooding conditions in an experimental field of 13 × 20 m during the growing season of 2011. The field is located at the southeastern region of Axios River plain (40°35′ N, 22°41′ E, 1 m above sea level) near Thessaloniki city in Northern Greece. This area is representative of the broader area of Axios River characterized by an extensive irrigation—drainage network, where rice is the dominant crop. Rice is being cultivated in the region for more than 50 years. A rotation program with three consecutive years of rice crop interrupted by one or two years of maize, fodder, or cotton, is the common practice in the area [5,10]. The soils in the region are mostly silty clay, poorly drained, classified as Typic Xerofluvents [42] under Mediterranean climate conditions, according to Soil Survey Staff [43]. A large part of the land is near and below the sea level with permanent high water table (1–1.5 m from the soil surface) controlled by the adjacent drainage ditches. Pumps are used to lead the drainage water to the sea. During the non-flooding period, the water level in the drainage ditches is approximately 1.2–1.5 m below the soil surface, while during flooding season, it is approximately 1.0–1.2 m below the soil surface [5,44].

2.2. Agricultural Practices

Soil treatment consisted of moldboard plowing at the end of November 2010 followed by land leveling at the end of April 2011 and harrowing for seedbed preparation simultaneously with basal fertilization. Sowing was performed on 16 May with seeding density at 200 kg·ha−1. The total fertilization rate was at 176 kg·N·ha−1. The amount of 96 kg·N·ha−1, in the form of urea, was incorporated in the soil before sowing on 12 May. Another two surface applications of 40 kg·N·ha−1 were performed on 17 June and 12 July (60.8 kg·N·ha−1 in the form of ammonium nitrogen and 19.2 kg·N·ha−1 in the form of nitrate nitrogen). The fertilizer consisted of 19% ammonium nitrogen in the form of ammonium sulfate and 6% nitrate nitrogen. Herbicide (active ingredients benzofenap and clomazone) was applied on 7 June. Irrigation water originates form River Axios and is transferred by gravity in the fields using open channels’ network. Irrigation in the experimental field started on the 14 May. The maximum ponding depth during the growing season of rice was approximately 10 cm with a few intermissions in irrigation water supply. Irrigation stopped on 8 September and flooding conditions ceased on 13 September. Rice was harvested on 13 October.

2.3. Water Balance Components

Water balance components were computed and analyzed in a previous study by Aschonitis et al. [37] using the GLEAMS-PADDY model [28], which was modified to include algae growth in rice fields. The model was applied for the same experimental field at the same growing season, in order to assess the uptake of major nutrients by algae in the floodwater, the inflow by irrigation and the losses by runoff of N, P, Ca, Mg, K, Na.
The rice crop evapotranspiration was determined using regional modified crop coefficients, which are functions of leaf area index LAI [45,46], multiplied by the reference crop evapotranspiration, estimated by the ASCE standardized Penman-Monteith method [47]. LAI measurements were performed using the destructive planimetric technique and meteorological data were obtained by the station at the experimental farm of the Aristotle University of Thessaloniki (40°32′ N, 23°00 E, 16 m above sea level). Measurements of irrigation water inflow, surface runoff and ponding depth were used for the calibration of the model. The water balance components of irrigation inflow, precipitation, surface runoff (above the bunds of 10 cm height), drainage below the root zone, and actual crop evapotranspiration, were estimated by the model at 2260, 158, 520, 432 and 1350 mm, respectively [37]. The daily variation of ponding depth, irrigation water amount and precipitation are given in Figure 1a, while the daily variation of surface runoff, drainage and actual crop evapotranspiration are given in Figure 1b.
Figure 1. (a) Daily variation of ponding depth—WD, irrigation water amount—IR, and precipitation—P; (b) daily variation of surface runoff—Q, drainage—D, and actual crop evapotranspiration—ETc as computed by the modified GLEAMS-PADDY model [37].
Agronomy 05 00035 g001

2.4. Measurements of Soil and Water Quality Parameters

For the collection of the soil solution at and below the root zone, three pairs of ceramic porous cups (SPS 200, SDEC France, ℘63 mm) were installed in the rice-field at two soil layers (15–20 cm and 35–40 cm), before the flooding season, on 10 May. Distance between the pairs of porous cups was 5 m. For the installation of the suction cups, a hole was opened to the intended sampling depth. The soil was collected from representative layers in the hole and it was preserved in order to measure the initial soil physicochemical characteristics of the experimental field. The soil physicochemical properties are given in Table 1.
Table 1. Soil physicochemical characteristics at 15–20 and 35–40 cm soil layers and mean water quality parameters of the experimental rice field during the irrigation season.
Soil ParametersSoil Layer (cm)
15–20 cm35–40 cm
Soil TextureSilty ClaySilty Clay Loam
CaCO3 (%)6.167.19
Organic Matter (%)2.091.73
1 CEC (cmolc·kg−1)40.5833.01
θs (cm3·cm−3)0.6550.538
θr (cm3·cm−3)0.0000.000
a (cm−1)0.00850.00196
n1.2001.129
m (m = 1 − 1/n)0.1670.114
ρb (g·cm−3)1.1231.223
Irrigation water parametersMean ± S.D.
pH8.1 ± 0.3
EC (μS·cm−1)429 ± 83
Ca2+ 3(mmolc·L−1)2.31 ± 0.54
Mg2+ (mmolc·L−1)1.04 ± 0.12
Na+ (mmolc·L−1)0.65 ± 0.08
K+ (mmolc·L−1)0.03 ± 0.01
Cl (mmolc·L−1)0.65 ± 0.48
HCO3 (mmolc·L−1)3.17 ± 0.61
2 SAR (mmolc·L−1)0.50.50 ± 0.05
1 Cation Exchange Capacity (CEC) is calculated as the sum of exchangeable cations; 2 SAR is calculated by the equation Na+/((Ca2+ + Mg2+)/2)0.5; 3 millimoles of charge per liter.
The remaining soil was used to form slurry, which was poured back into the hole to refill a section of 10–20 cm from the bottom. The suction cups were then gently pushed into the slurry to establish tight hydraulic contact between the saturated porous cups and the surrounding soil [48]. Prior to installation, the devices were placed in a container with 5% HCl and the solution was pumped three times through the porous cups. They were then rinsed with deionized water until electrical conductivity was equal to that of the deionized water [49]. The first soil solutions from the suction cups were obtained on 31 May and then they were obtained weekly until 26 September (a total of 15 samplings) in order to measure Electrical Conductivity (EC), pH, K+, Mg2+, Ca2+, Na+, HCO3 and Cl. At the same dates, three pairs of soil samples from the flooded soil, near the porous cups, were collected from the field at soil layers 15–20 and 35–40 cm. Soil samples were air dried and sieved through a 2 mm sieve. Measurements of EC, K+, Mg2+, Ca2+, Na+, HCO3 and Cl were also performed in the saturation extracts of the soil paste. Exchangeable K+, Mg2+, Ca2+ and Na+ were measured in the soil samples. Additional soil sampling was performed approximately 20 days after the end of the flooding season, on 6 October, when soil reached unsaturated conditions. This sampling was performed for comparison purposes between the final and the initial status of soil salinity parameters.
Triplicate floodwater and irrigation water samples were obtained weekly during the growing season to measure EC, pH, K+, Mg2+, Ca2+, Na+, HCO3 and Cl. Mean irrigation water quality parameters throughout the irrigation season are given in Table 1. Even though the quality of the applied irrigation water from Axios River is considered satisfactory for preventing any problems regarding salt built up in soil and element deficiencies in rice plants [50], the combination of EC and SAR (Sodium Adsorption Ratio) poses slight to moderate soil degradation risk, regarding infiltration problems, according to the international standards for the irrigation water [51].
Particle size analysis was performed by the hydrometer method [52]. Organic matter was determined by the wet oxidation method [53] and calcium carbonate (CaCO3) by the volumetric calcimeter method [54]. The concentrations of Ca2+, Mg2+, K+ and Na+ in the soil solution, the saturation extract, floodwater and irrigation water were determined using ICP [55]. EC was measured by a conductivimeter [55,56] and pH by a pH-meter (pH of the soil samples was measured in the saturated soil paste). Chloride was measured via colorimetric titration with silver nitrate using a chromate indicator [57]. Concentration of bicarbonate (HCO3) was determined by titration to a pH of 4.3 using diluted 0.05 N H2SO4 [55]. Extracted exchangeable cations Ca2+, Mg2+, Na+ and K+, by the ammonium acetate method, at pH 8.2 [58], were determined using ICP.
For the determination of the hydraulic properties, undisturbed soil samples were obtained from twelve positions in the field. Cores of 5 cm high and 5 cm diameter were collected in thin-walled metal rings from two depths of the soil profile (15–20 cm and 35–40 cm) before the flooding period. The soil cores were wetted from below to saturation and then equilibrated on ceramic tension plates at eleven successive suctions between 0−15,000 hPa, for the determination of the soil water retention curve [59] with the van Genuchten model [60]. The parameters of the van Genuchten model were calculated using the RETC code software [61]. Bulk densities, ρb, were measured at the same cores after drying at 105 °C (Table 1).

2.5. Analysis and Statistics

Changes in soil salinity were analyzed and discussed based upon the measurements in the soil solutions obtained from the suction cups. To compare the initial and final status of the soluble phase under unsaturated conditions before (5 May 2011) and after the growing season (6 October 2011), the saturation extracts were used. Comparative analysis was also performed for the case of exchangeable cations at the same dates. The measurements were statistically analyzed using the software package Statgraphics Centurion XV software. ANOVA with LSD test for level of significance p < 0.05 was used to identify significant differences between measurements.

3. Results and Discussion

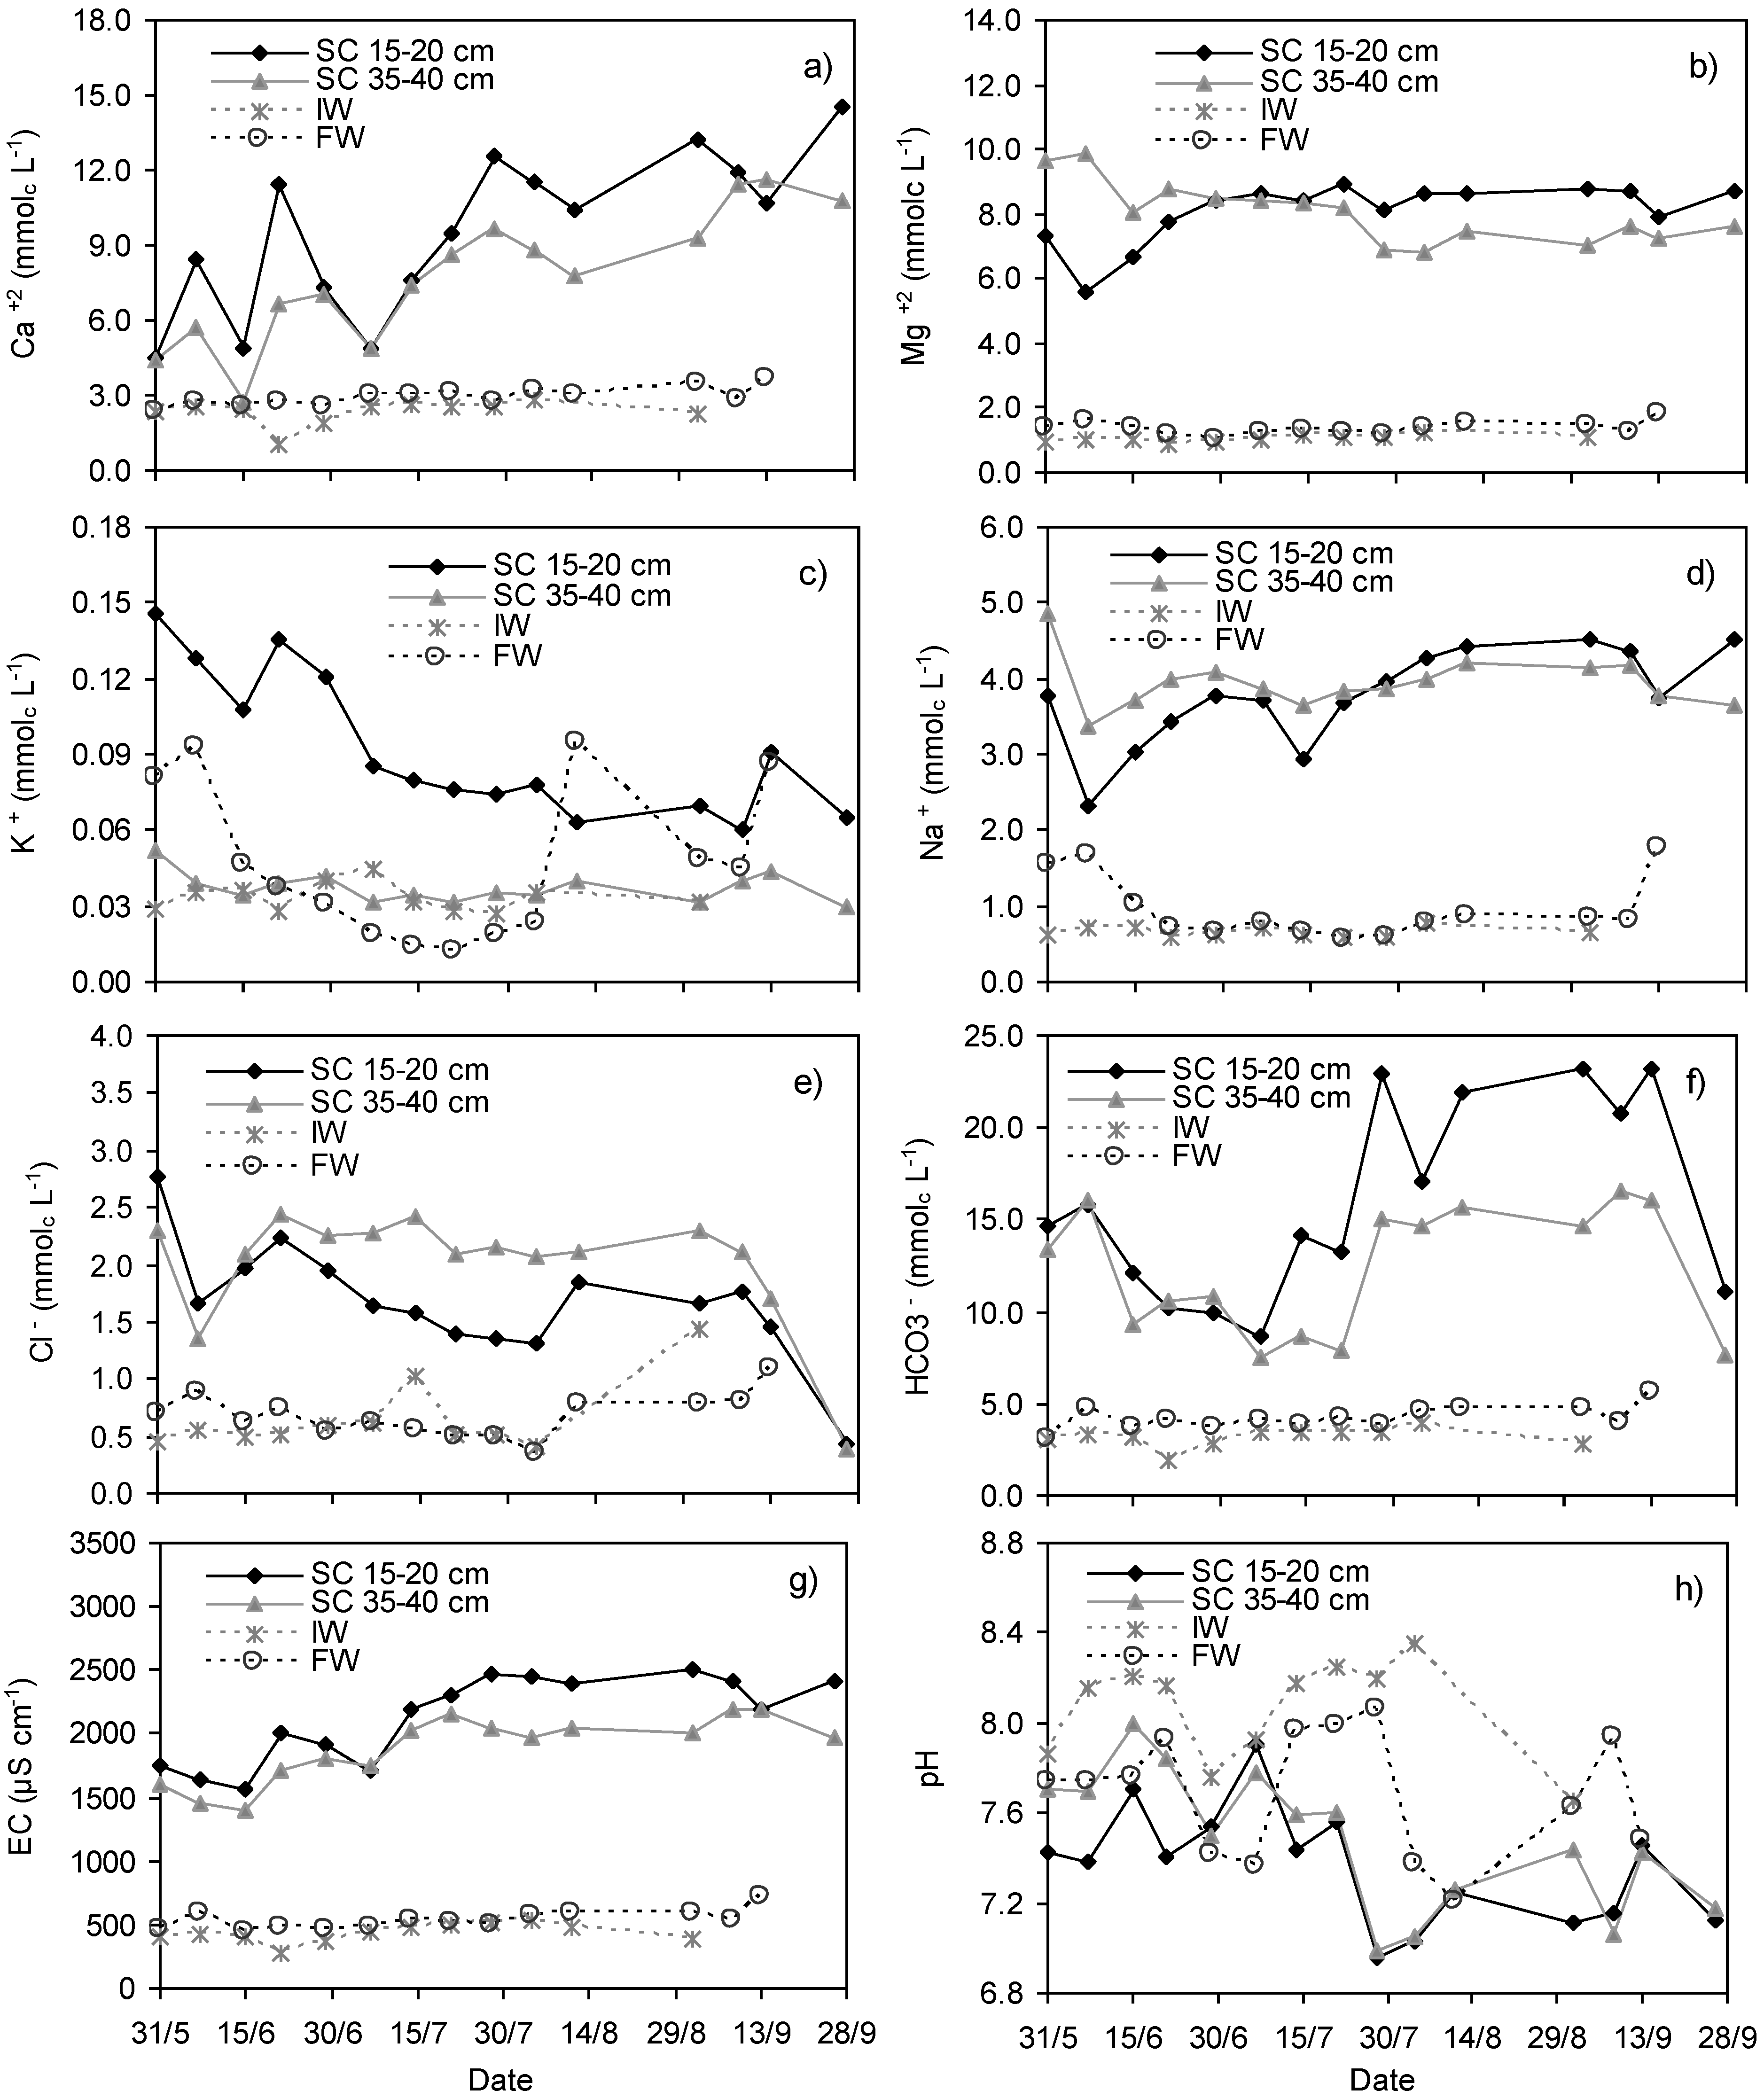
3.1. Variations in Ca2+, Mg2+, K+, Na+, Cl, HCO3, EC and pH in Soil Solution, Irrigation and Floodwater

The variation of Ca2+, Mg2+, K+, Na+, Cl, HCO3, EC and pH in the soil solution obtained from suction cups in the 15–20 and 35–40 cm layers, the irrigation water and floodwater during the flooding season, is presented in Figure 2.
The concentration of Ca2+ in the soil solution tended to increase in both soil layers (Figure 2a). That increase was followed by two interruptions during the growing season, which are mainly attributed to plant uptake. Possible source of Ca2+ may be the dissolution of carbonate minerals due to saturated conditions in the presence of H+ ions. The involvement of these H+ in chemical reactions occurring in the rhizosphere is of prime significance due to their implications in the acquisition of many mineral nutrients [62]. Ammonium sulfate fertilizer was applied on the surface on 17 June and 12 July, dates that coincide with the onset of high concentrations of Ca2+ in soil solution. Furthermore, ammonium sulfate dissolves some calcium carbonate in calcareous soils [63] and dissolution of insoluble carbonate and bicarbonate under reduced conditions contribute Ca2+ and Mg2+ in the soil solution [23]. These results are in accordance with results reported in the literature [20,21,23,64]. Larson et al. [65] found that water-logging of two calcareous Entisols increased the availability of cations such as Ca2+ and Mg2+ in the soluble phase. Also, pCO2 increases in the soil-rooting zone and pH decreases due to the decomposition of organic matter leading to calcite dissolution and increase of Ca2+ concentrations in the soil solution [66]. Ca2+ concentration in the floodwater and the irrigation water followed the same fluctuation during the irrigation period and remained relatively low with no significant differences (Figure 2a).
The concentration of Mg2+ in the soil solution slightly increased at the beginning of the growing season and remained almost constant afterwards in the 15–20 cm soil layer, while the opposite trend was observed in the underlying layer of the 35–40 cm (Figure 2b). There was no increase recorded in Mg2+ concentration resulting by dissolution as in the case of Ca2+. A possible explanation is that the calcareous parent material of the soil is mainly limestone, containing higher levels of Ca2+ in relation to Mg2+. The concentration of Mg2+ in the floodwater and the irrigation water remained relatively low and constant throughout the irrigation period (Figure 2b).
The concentration of K+ in the soil solution of the 15–20 cm decreased almost two-fold from a maximum value of 0.146 mmolc·L−1 to a minimum value of 0.065 mmolc·L−1 while in the layer of 35–40 cm remained relatively constant during the growing season (Figure 2c). The decrease of K+ in the upper layer can be attributed to crop uptake. It must be mentioned that the only source of K+ is the irrigation water where K+ concentration remained constant during the irrigation period (Figure 2c). The application of the modified GLEAMS-PADDY model by Aschonits et al. [37] showed that during the experimental period, the irrigation water provided 31.16 kg·ha−1 of K+ while algae uptake from the flooding water was estimated at 39.58 kg·ha−1. These results indicate that algae consumed more K+ than the estimated inflow. This is justified by the fact that the concentration of K+ in the flooding water was regulated mainly by its concentration in the irrigation water and in the upper muddy soil layer. The effects of algae uptake on the concentration of K+ in the flooding water are evident in Figure 2c where K+ decreased at the beginning until the middle of the flooding season. This period corresponds to the highest algae biomass production and growth rates estimated by the GLEAMS-PADDY model [37]. Later in the season, K+ increased again due to:
  • the decrease of algae growth and uptake because LAI exceeded the value of 2 and algal photosynthesis was restricted [37];
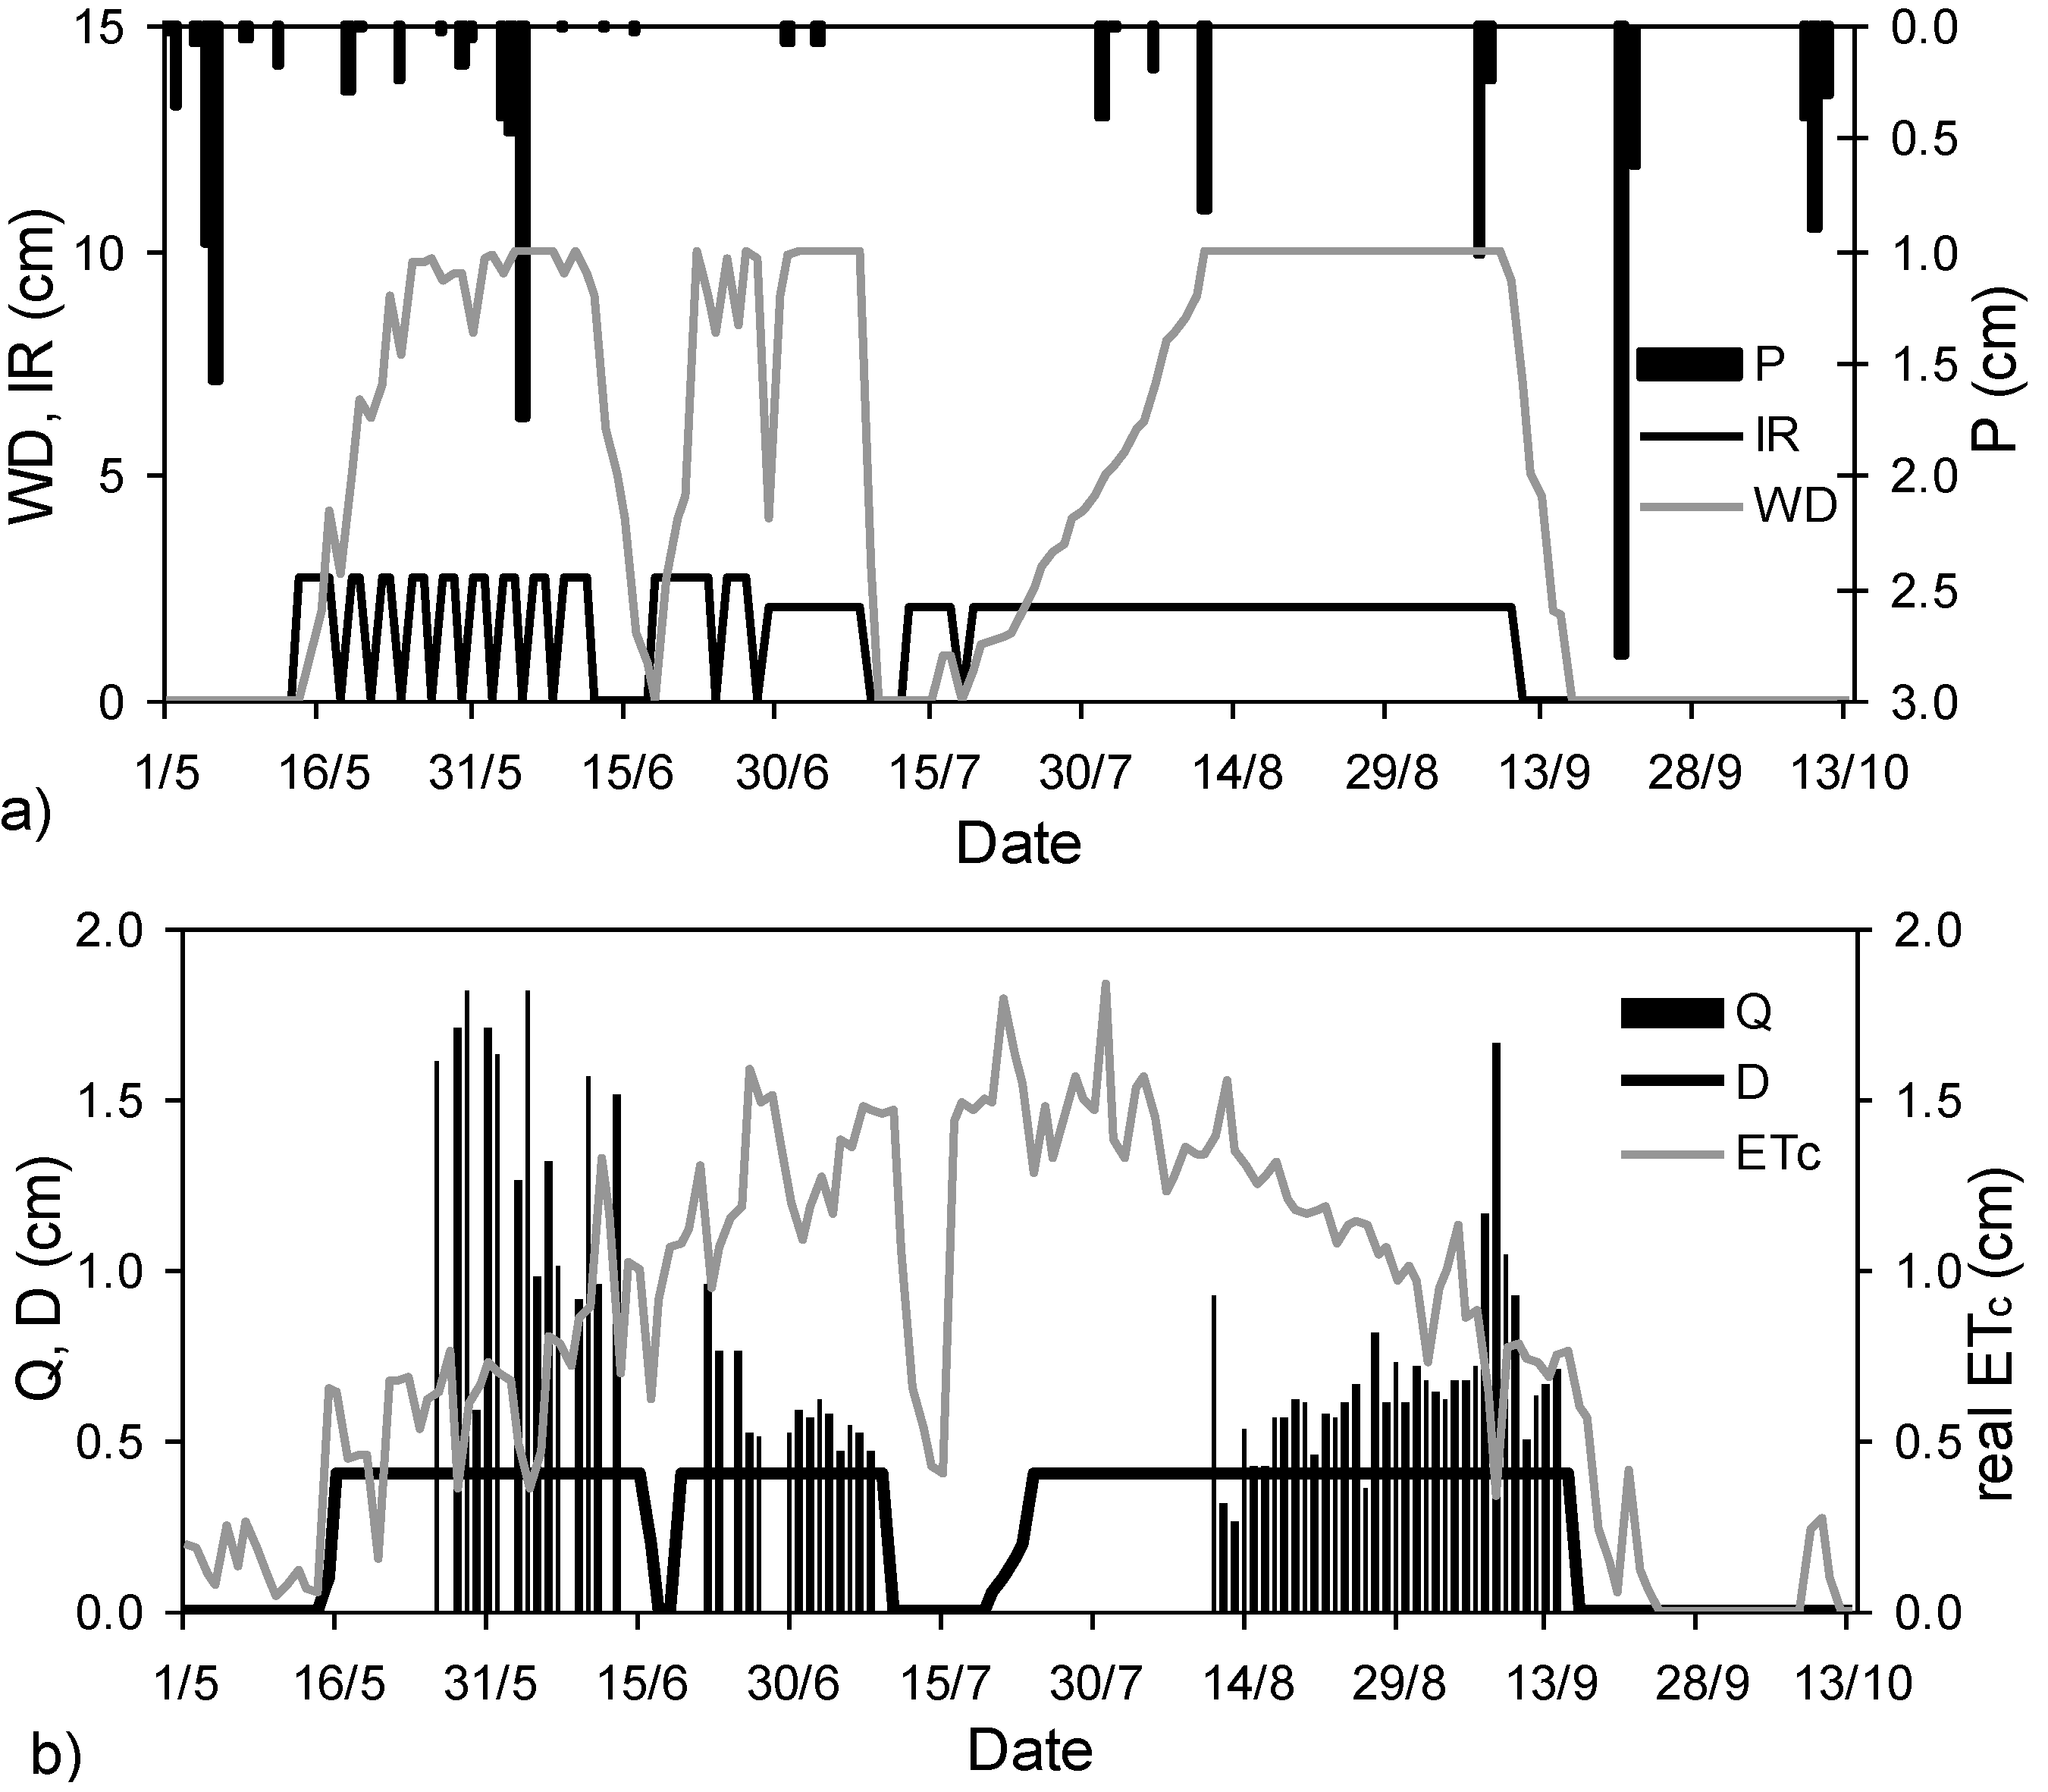
  • the continuous irrigation water inflow with no further intermissions by the middle of July (Figure 1a) which contributed to the increase of K+ in the flooding water; and
  • evapotranspiration reaching maximum values after the middle of July (Figure 1b), which enhanced evapoconcentration.
It is clear that flooding conditions together with the rice crop and algae biomass control the availability of K+ in the soil solution of the root zone and in the floodwater, respectively. Phillips and Greenway [20], Lu et al. [23] and Larson et al. [65] found that flooding increased the availability of soluble K+ in the soil solution and floodwater. However, their experiments were held in laboratory conditions and involved soil water logging without considering the effects of plants or algae, which could exploit this availability on their behalf. On the other hand, Boivin et al. [24] observed that K+ concentration decreased with time during flooding, in field experiments.
The concentration of Na+ in the soil solution, at both soil layers, remained relatively constant during the irrigation period (Figure 2d). Lu et al. [23] also reported no significant changes of water-soluble Na+ during a 12-week waterlogging period. Levels of Na+ in the floodwater and irrigation water remained low and constant throughout the irrigation period (Figure 2d).
Cl concentration in the soil solution of both soil layers (Figure 2e) remained relatively constant during the irrigation period but decreased significantly to a minimum value of approximately 0.4 mmolc·L−1, after irrigation ceased. These findings are in agreement with Boivin et al. [15] who explained this behavior by an unstable Cl-GR formation in the soil around the porous cups during solution collection, which leads to a decrease in pCO2. The researchers noted that Cl should not be used as a reference element for calculating concentration ratios of water when sampled under vacuum atmosphere in partly reduced soils. Control of Cl in soils with low pCO2 might occur without vacuum applied. Indeed, measured concentrations of Cl in saturation extracts from soil samples, at the same depths (results not shown), revealed a different tendency, with Cl concentration values increasing almost three-fold after the irrigation period (from approximately 1.1 to 2.9 mmolc·L−1). The concentration of Cl in irrigation water and floodwater remained almost constant throughout the irrigation season (Figure 2e).
Bicarbonate in the soil solution (Figure 2f) behaved like calcium, increasing over time from 16 to approximately 23 mmolc·L−1 in the 15–20 cm soil layer. The same fluctuation was observed in the 35–40 cm soil layer, while its concentration decreased back to the initial levels after the flooding season, in both soil layers. Bicarbonate increased in the soil solution particularly after the second surface fertilizer application. This behavior can be attributed to the production of HCO3 in the presence of high levels of calcium carbonate. Boivin et al. [15] also reported continuous increase in bicarbonate and further assumed that calcite precipitation did not occur during the irrigation period. van Asten et al. [8] mentioned that precipitation and dissolution of calcite control bicarbonate of the soil solution, as in this study. The decrease in bicarbonate at both soil layers at the end of the cropping period can be explained by desorption of exchangeable Ca2+ which leads to calcite precipitation and a subsequent decrease of bicarbonate in the soil solution [8]. When the soil profile dries up and reoxidizes, pCO2 drops and minerals like sepiolite, calcite and magnesite are probably crystallized and accumulated in the soil profile during the fallow period [15]. Bicarbonate in the floodwater and irrigation water remained low and constant throughout the irrigation period (Figure 2f).
Figure 2. Variation of salinity components in the soil solution obtained from suction cups of soil layers 15–20 and 35–40 cm, in the irrigation water and in the floodwater (SC: soil solution, IW: irrigation water, FW: floodwater) (a) Ca2+ concentration; (b) Mg2+ concentration; (c) K+ concentration; (d) Na+ concentration; (e) Cl concentration; (f) HCO3 concentration; (g) Electrical conductivity (EC) and (h) pH.
Agronomy 05 00035 g002
During the first six weeks after the initiation of flooding, EC in the soil solution gradually increased reaching peak values in both soil layers, while afterwards it remained almost constant until the end of the cropping season (Figure 2g). That increase was mainly regulated by the increase of Ca2+. The concentration of Ca2+ was highly correlated with the EC of the soil solution (R = 0.818, p < 0.05 at 15–20 cm and R = 0.786, p < 0.05 at 35–40 cm), while weaker correlations with Mg2+ (R = 0.602, p < 0.05 at 15–20 cm and R = −0.081, p > 0.05 at 35–40 cm), Na+ (R = 0.582, p < 0.05 at 15–20 cm and R = 0.592, p < 0.05 at 35–40 cm) and HCO3 (R = 0.418, p < 0.05 at 15–20 cm and R = 0.218, p > 0.05 at 35–40 cm) were found. An additional factor that may have contributed to the EC increase is the soluble SO42− originating from the two surface fertilizer applications of ammonium sulfate. The EC values of the flooding and irrigation water remained below 700 μS·cm−1 during the monitoring period (Figure 2g).
The pH of the soil solution (Figure 2h) remained relatively constant at the beginning of the flooding season while after 15 July a simultaneous reduction was observed in both soil layers probably because of the following reasons:
  • the continuous water inflow by irrigation enhanced oxygenation; and
  • when the plant reaches the tillering and internode elongation stages, the roots are at full development while stem aerenchyma starts to be fully active providing a low-resistance pathway for diffusion of O2 within the roots, enhancing soil oxygenation [67]. In flooded soils, where lowland rice is expected to rely solely on ammonium because of the ambient reducing conditions, it has been well established that the root-induced release of O2 in the rhizosphere, and the subsequent oxidation of the soil, can make a substantial, and sometimes major contribution to the observed rhizosphere acidification [68,69,70].
In addition, the root-induced precipitation of the so-called Fe plaque (Fe oxyhydroxides) in the rhizosphere of rice, promotes a significant part of the observed rhizosphere acidification [71]. Peak values of floodwater pH coincide with the ammonium sulfate surface applications. Ammonium sulfate may raise pH, especially in calcareous soils, because it dissolves some calcium carbonate [63]. Floodwater pH decreased again during August, because shading of the floodwater by the rice canopy lowered the photosynthetic activity of the aquatic biomass and thus reduced the degree of CO2 depletion [72]. Irrigation water pH remained relatively constant with time with an average value of 8.1 during the irrigation season (Figure 2h).
For the analysis of the effects of the WMPs on the soil salinity status, soil samples were obtained on 6 October (unsaturated conditions after flooding were established in the soil by early October) and saturation extracts were analyzed in order to be compared with the saturation extracts obtained on 10 May, prior to flooding. According to the results (Table 2), Ca2+, Mg2+, K+, HCO3 and EC of the 15–20 cm soil layer were significantly reduced, Na+ remained constant and Cl increased. In the 35–40 cm layer no significant differences were detected to all parameters except for Cl, which was increased. The above indicate a general reduction of soil salinity of the first layer while the conditions of the second layer remained relatively constant.
Table 2. Comparison of soluble ions Ca2+, Mg2+, K+, Na+, Cl, HCO3 and EC obtained from saturation extracts before (5 May) and after (6 October) the growing season.
ParameterSoil Layer5 May6 October
Ca2+ (mmolc·L−1)15–20 cm5.58 ± 0.18a 14.45 ± 0.25b
Ca2+ (mmolc·L−1)35–40 cm3.69 ± 0.23a3.61 ± 0.33a
Mg2+ (mmolc·L−1)15–20 cm2.35 ± 0.02a2.1 ± 0.07b
Mg2+ (mmolc·L−1)35–40 cm1.76 ± 0.17a1.83 ± 0.15a
K+ (mmolc·L−1)15–20 cm0.13 ± 0.01a0.08 ± 0.01b
K+ (mmolc·L−1)35–40 cm0.05 ± 0.01a0.04 ± 0.01a
Na+ (mmolc·L−1)15–20 cm1.66 ± 0.13a1.96 ± 0.13a
Na+ (mmolc·L−1)35–40 cm1.85 ± 0.22a2.09 ± 0.23a
Cl (mmolc·L−1)15–20 cm1.07 ± 0.13b2.40 ± 0.50a
Cl (mmolc·L−1)35–40 cm1.13 ± 0.07b3.33 ± 0.13a
HCO3 (mmolc·L−1)15–20 cm5.67 ± 0.53a3.34 ± 0.07b
HCO3 (mmolc·L−1)35–40 cm3.56 ± 0.23a3.20 ± 0.01a
EC (μS·cm−1)15–20 cm1010 ± 32a832 ± 28b
EC (μS·cm−1)35–40 cm736 ± 42a751 ± 72a
1 Mean ± Standard error and results of Anova. Different letters indicate statistically significant differences before and after the flooding season at 0.05 confidence level.

3.2. Variations in Exchangeable Cations Ca2+, Mg2+, K+, Na+ and ESP

The concentration of the exchangeable cations Ca2+, Mg2+, K+ and Na+ in the solid phase and ESP of soil layers 15–20 and 35–40 cm are presented in Figure 3. Exchangeable Ca2+, Mg2+ and K+ followed an increasing trend until the middle of the flooding season and were decreased afterwards in both soil layers, reaching approximately to the initial values, when flooding ceased (Figure 3a–c). These fluctuations were more evident for Ca2+ and to a lesser extend for K+ and Mg2+. The increase in exchangeable Ca2+ can be attributed (a) to the dissolution of insoluble calcium carbonate in the presence of H+ ions and (b) to the probable decomposition of organic matter which results in calcite dissolution and larger Ca2+ concentrations in the soil solution. The above suggestions also justify the Mg2+ fluctuations while K+ changes are considered negligible. De Datta [73] also mentioned that many soils under wet conditions may fix some NH4+ in a form that is slowly replaced by cations such as Ca2+, Mg2+ and Na+ but not by K+. Incorporation of urea in the soil as a basal fertilizer may have enhanced NH4+ fixing in the soil, which was later replaced mainly by Ca2+ at the beginning of flooding. Defixation occurs more rapidly under flooding in comparison to unsaturated soils [73]. Na+ concentration in the solid phase remained almost constant during the flooding season while after the removal of excess soil water, rapidly increased (Figure 3d). This is a possible indication that Na+ reoccupied exchange sites, leading to an increase of the ESP after the flooding season. The increase of Na+ concentration in the solid phase partly justifies the observed Cl increase in the saturation extract after irrigation ceased. As exchangeable Na+ increases, soluble Na+ is removed from the soil solution forcing to the right the equilibrium of NaCl ↔ Na+ + Cl, resulting to the maintenance of Na+ and the increase of Cl.
Figure 3. Fluctuation of exchangeable cations during the growing period: (a) for Ca2+; (b) for Mg2+; (c) for K+; (d) for Na+ and (e) for ESP.
Agronomy 05 00035 g003
The statistical differences of exchangeable Ca2+, Mg2+, K+ and Na+ concentrations, before and after the cropping period, are given in Table 3. It is evident from Table 3 that statistical differences are observed only for exchangeable Na+ and ESP. Despite the increase of these two parameters after the growing season, their final values are quite low to indicate soil degradation.
Table 3. Comparison of exchangeable cations concentrations and ESP before (5 May) and after (6 October) the growing season.
ParameterSoil Layer5 May6 October
Ca2+ (cmolc·kg−1)15–20 cm32.04 ± 1.46a 230.69 ± 0.95a
Ca2+ (cmolc·kg−1)35–40 cm26.35 ± 1.59a26.13 ± 1.63a
Mg2+ (cmolc·kg−1)15–20 cm6.95 ± 0.45a8.03 ± 0.21a
Mg2+ (cmolc·kg−1)35–40 cm5.34 ± 0.77a5.87 ± 0.79a
K+ (cmolc·kg−1)15–20 cm0.38 ± 0.04a0.42 ± 0.04a
K+ (cmolc·kg−1)35–40 cm0.16 ± 0.03a0.17 ± 0.02a
Na+ (cmolc·kg−1)15–20 cm1.21 ± 0.07b1.67 ± 0.05a
Na+ (cmolc·kg−1)35–40 cm1.16 ± 0.15b1.47 ± 0.16a
1 ESP (%)15–20 cm2.98 ± 0.07b4.09 ± 0.11a
1 ESP (%)35–40 cm3.51 ± 0.32b4.36 ± 0.13a
1 Exchangeable sodium percentage = 100 × Na+/CEC; CEC is calculated as the sum of exchangeable cations; 2 Mean ± Standard error and results of Anova. Different letters indicate statistically significant differences before and after the flooding season at 0.05 confidence level.

3.3. WMPs Effects on the Salinity of Rice Fields

One of the major reasons that motivated this study was the debate on water consumption between the farmers and the administrative units that manage the water supply in the irrigation channels of the study area. According to the administrative agencies, the local rice farmers exploit the fact that the water cost is based on field-area/crop attributes and not to water consumption and for this reason they use excessive water that leads to quite high surface drainage losses and low water use efficiency which approximates in general 50% [5,44]. Considering that the irrigation of the experimental field was applied accordingly to the common practices followed by the farmers, the results indicate that the observed surface runoff and the respective irrigation water consumption were adequate to prevent salt built up in the soil. According to FAO classification [74], the soil of the experimental rice field is considered neither saline nor sodic, in both layers, which indicates that the long-term rice cultivation under the specific WMPs has not degraded its quality in terms of soil salinity. This also indicates that the increase of exchangeable Na+ and ESP, which was observed in the experimental field during the short period of soil drying after flooding, may occur temporarily, but needs further investigation. Moreover, the farmers are well aware about the benefits of gypsum to prevent soil quality problems and for this reason they occasionally use it in this area when is needed.
According to the observations made by this analysis but also from other studies in the rice fields of the region, the prevention of salinity increase is not only ascribed to the adequate drainage but also to the excessive water use for surface runoff due to the following reasons:
  • the continuous irrigation water inflow prevents oxygen depletion from the floodwater enhancing algae production which seems to play a crucial role on ions uptake. In the parallel experiments which were performed in the same experimental field, Aschonitis et al. [37] estimated the total final produced dry algal biomass at 1047 kg·ha−1 whereas algae uptake of Ca2+, Mg2+, Na+ and K+ was estimated to 62.61, 3.24, 3.35 and 39.58 kg·ha−1, respectively. Apart from their implication in salinity components regulation, algae remove a significant part of nutrients (nitrogen and phosphorus) from the floodwater [35,37]. On the other hand, the surface runoff removed 296.3, 133.1, 87.7 and 13.2 kg·ha−1 of Ca2+, Mg2+, Na+ and K+, respectively [37]. Furthermore, due to the continuous flooding and runoff, the quality characteristics of the runoff water are such, that it could be reused for irrigation of rice fields in this area at least once [5]. The significant contribution of controlled surface runoff in semi-arid environments has also been verified by Chen et al. [75]; and
  • the continuous inflow of irrigation water and the attainment of a constant ponding depth in the rice-fields prevents further increase of the water temperature and evaporation [36], which lead to evapoconcentration and salt accumulation.
The generally good state of the soils in the region indicates that the regional agricultural practices are adequate to sustain the soil quality of rice-fields but with the cost of high water consumption. Amounts of water between 2000–2500 mm, depending on the drainage and the climatic conditions, are prerequisite to prevent soil degradation and to preserve rice yields. Until recently there were no significant limitations on the water supply from Axios River to support the current needs (apart from some isolated drought events), setting Thessaloniki plain one of the top regions of rice productivity ranging from 8.40–9.82 Mg·ha−1 grain yields [76]. Future challenges which may need to be considered in order to design better WMPs and to preserve soil quality of rice-fields are (a) the imminent climate change which may reduce the water supply of Axios River and (b) the potential expansion of rice-fields in the study area.

4. Conclusions

The comparative analysis of the measurements before and after the growing season indicated that the regional WMPs (inflows of 2260 mm irrigation plus 158 mm rainfall, continuous flooding with maximum of 10 cm ponding depth, surface runoff 520 mm, drainage below the root zone 432 mm and real crop evapotranspiration 1350 mm) significantly contributed to the removal of salts from the root zone preventing salt built up in the soil. The detailed analysis on the exchangeable cations showed that Na+ rapidly increased after the removal of excess soil water, possibly reoccupying exchange sites, leading to an increase in ESP. This finding is of extreme importance due to the long-term risk of increasing soil sodicity and to that aim the regional conventional management practices should additionally be followed by remediation actions (e.g., use of gypsum) in order to prevent future soil sodification.
The irrigation practice that is followed in the region is appropriate to sustain the soil quality of rice-fields but with the cost of high water consumption. The Mediterranean region is the major rice producer which covers the main rice-based food demands in Europe but the water needs to sustain this production (ranging between 2000–2500 mm) are considered extremely high. Actions to redesign and improve water management are mandatory in order to preserve rice yields. Future studies should focus on (a) the effects of the winter season to soil salinity between sequential rice growing seasons; (b) trial experiments to assess the minimum water consumption based on ratios of drainage versus runoff water to preserve or reduce soil salinity.

Acknowledgments

The authors wish to thank Professor Vissarion Keramidas for providing helpful comments that significantly improved this work.

Author Contributions

All authors contributed equally to this work.

Conflicts of Interest

The authors declare no conflict of interest.

References

  1. Rhoades, J.D. Sustainability of irrigation: An overview of salinity problems and control strategies. In Footprints of Humanity: Reflections on 50 Years of Water Resource Developments. In Proceedings of the Annual Conference of the Canadian Water Resources Association, Lethbridge, AB, Canada, 3–6 June 1997.
  2. Szabolcs, I. Prospects of soil salinity for the 21st Century. In Proceedings of the 15th World Congress of Soil Science (ISSS), Acapulco, Mexico City, 10–16 July 1994; Volume 1, pp. 123–141.
  3. Ghassemi, F.; Jakeman, A.J.; Nix, H.A. Salinisation of Land and Water Resources; University of New South Wales Press Ltd.: Canberra, Australia, 1995. [Google Scholar]
  4. Playán, E.; Pérez-Coveta, O.; Martínez-Cob, A.; Herrero, J.; García-Navarro, P.; Latorre, B.; Brufau, P.; Garcés, J. Overland water and salt flows in a set of rice paddies. Agric. Water Manag. 2008, 95, 645–658. [Google Scholar] [CrossRef]
  5. Litskas, V.D.; Aschonitis, V.G.; Lekakis, E.H.; Antonopoulos, V.Z. Effects of land use and irrigation practices on Ca, Mg, K, Na loads in rice-based agricultural systems. Agric. Water Manag. 2014, 132, 30–36. [Google Scholar] [CrossRef]
  6. Hammecker, C.; van Asten, P.; Marlet, S.; Maeght, J.L.; Poss, R. Simulating the evolution of soil solutions in irrigated rice soils in the Sahel. Geoderma 2009, 150, 129–140. [Google Scholar] [CrossRef]
  7. Ceuppens, J.; Wopereis, M.C.S.; Miézan, K.M. Soil salinization processes in rice irrigation schemes in the Senegal River Delta. Soil Sci. Soc. Am. J. 1996, 61, 1122–1130. [Google Scholar] [CrossRef]
  8. Van Asten, P.J.A.; van’t Zelfde, J.A.; van der Zee, S.E.A.T.M.; Hammecker, C. The effect of irrigated rice cropping on the alkalinity of two alkaline rice soils in the Sahel. Geoderma 2004, 119, 233–247. [Google Scholar]
  9. Sharma, P.K.; de Datta, S.K. Effects of puddling on soil physical properties and processes. In Soil Physics and Rice; IRRI: Los Baños, Philippines, 1985; pp. 217–234. [Google Scholar]
  10. Aschonitis, V.G.; Kostopoulou, S.K.; Antonopoulos, V.Z. Methodology to assess the effects of rice cultivation under flooded conditions on van Genuchten’s model parameters and pore size distribution. Transp. Porous Med. 2012, 91, 861–876. [Google Scholar] [CrossRef]
  11. Wopereis, M.C.S.; Wösten, J.H.M.; Bouma, J.; Woodhead, T. Hydraulic resistance in puddled rice soils: Measurement and effects on water movement. Soil Till. Res. 1992, 24, 199–209. [Google Scholar] [CrossRef]
  12. Wopereis, M.C.S.; Bouman, B.A.M.; Kropff, M.J.; Ten Berge, H.F.M.; Maligaya, A.R. Water use efficiency of flooded rice fields. I. Validation of the soil-water balance model SAWAH. Agric. Water Manag. 1994, 26, 277–289. [Google Scholar] [CrossRef]
  13. Chen, S.K.; Liu, C.W.; Huang, H.C. Analysis of water movement in paddy rice fields (II) simulation studies. J. Hydrol. 2002, 268, 259–271. [Google Scholar] [CrossRef]
  14. Chen, S.K.; Liu, C.W. Analysis of water movement in paddy rice fields (I) experimental studies. J. Hydrol. 2002, 260, 206–215. [Google Scholar] [CrossRef]
  15. Boivin, P.; Favre, F.; Hammecker, C.; Maeght, J.L.; Delariviére, J.; Poussin, J.C.; Wopereis, M.C.S. Processes driving soil solution chemistry in a flooded rice-cropped vertisol: Analysis of long-time monitoring data. Geoderma 2002, 110, 87–107. [Google Scholar] [CrossRef]
  16. Wopereis, M.C.S.; Ceuppens, J.; Boivin, P.; N’Diaye, A.M.; Kane, A. Preserving soil quality under irrigation in the Senegal River Valley. Roy. Neth. Soc. Agric. Sci. 1998, 46, 97–107. [Google Scholar]
  17. Häfele, S.; Wopereis, M.C.S.; Boivin, P.; Diaye, A.M.N. Effect of puddling on soil desalinization and rice seedling survival in the Senegal River Delta. Soil Till. Res. 1999, 51, 35–46. [Google Scholar] [CrossRef]
  18. Cass, A.; Gusli, S.; MacLeod, D.A. Sustainability of soil structure quality in rice paddy-soybeen cropping systems in South Sulawesi, Indonesia. Soil Till. Res. 1994, 31, 339–352. [Google Scholar] [CrossRef]
  19. Favre, F.; Boivin, P.; Wopereis, M. Water movement and soil swelling in a dry, cracked vertisol. Geoderma 1997, 78, 113–123. [Google Scholar] [CrossRef]
  20. Phillips, I.R.; Greenway, M. Changes in water soluble and exchangeable ions, cation exchange capacity, and phosphorusmax in soils under alternating waterlogged and drying conditions. Commun. Soil Sci. Plant Anal. 1998, 29, 51–65. [Google Scholar] [CrossRef]
  21. Narteh, L.T.; Sahrawat, K.L. Influence of flooding on electrochemical and chemical properties of West African soils. Geoderma 1999, 87, 179–207. [Google Scholar] [CrossRef]
  22. Favre, F.; Tessier, D.; Abdelmoula, M.; Génin, J.M.; Gates, W.P.; Boivin, P. Iron reduction and changes in cation exchange capacity in intermittently waterlogged soil. Eur. J. Soil Sci. 2002, 53, 175–183. [Google Scholar] [CrossRef]
  23. Lu, S.G.; Tang, C.; Rengel, Z. Combined effects of waterlogging and salinity on electrochemistry, water-soluble cations and water dispersible clay in soils with various salinity levels. Plant Soil 2004, 264, 231–245. [Google Scholar] [CrossRef]
  24. Boivin, P.; Saejiew, A.; Grunberger, O.; Arunin, S. Formation of soils with contrasting textures by translocation of clays rather ferrolysis in flooded rice fields in Northeast Thailand. Eur. J. Soil Sci. 2004, 55, 713–724. [Google Scholar] [CrossRef]
  25. Inao, K.; Kitamura, Y. Pesticide paddy field model (PADDY) for predicting pesticide concentrations in water and soil in paddy fields. Pest Sci. 1999, 55, 38–46. [Google Scholar] [CrossRef]
  26. Singh, K.B.; Gajri, P.R.; Arora, V.K. Modelling the effects of soil and water management practices on the water balance and performance of rice. Agric. Water Manag. 2001, 49, 77–95. [Google Scholar] [CrossRef]
  27. Liu, C.W.; Chen, S.K.; Jang, C.S. Modelling water infiltration in cracked paddy field soil. Hydrol. Process 2004, 18, 2503–2513. [Google Scholar] [CrossRef]
  28. Chung, S.O.; Kim, H.S.; Kim, J.S. Model development for nutrient loading from paddy rice fields. Agric. Water Manag. 2003, 62, 1–17. [Google Scholar] [CrossRef]
  29. Miao, Z.; Cheplick, M.J.; Williams, M.W.; Trevisan, M.; Padovani, L.; Gennari, M.; Ferrero, A.; Vidotto, F.; Capri, E. Simulating pesticide leaching and runoff in rice paddies with the RICEWQ-VADOFT model. J. Environ. Qual. 2003, 32, 2189–2199. [Google Scholar] [CrossRef] [PubMed]
  30. Chowdary, V.M.; Rao, N.H.; Sarma, P.B.S. A coupled soil water and nitrogen balance model for flooded rice fields in India. Agrc. Ecosyst. Environ. 2004, 103, 425–441. [Google Scholar] [CrossRef]
  31. Watanabe, H.; Takagi, K.; Vu, S.H. Simulation of mefenacet concentrations in paddy field by improved PCPF-1 model. Pest Manag. Sci. 2005, 62, 20–29. [Google Scholar] [CrossRef]
  32. Tournebize, J.; Watanabe, H.; Takagi, K.; Nishimura, T. The development of a coupled model (PCPF-SWMS) to simulate water flow and pollutant transport in Japanese paddy fields. Paddy Water Environ. 2006, 4, 39–51. [Google Scholar] [CrossRef]
  33. Jeon, J.H.; Yoon, C.G.; Ham, J.H.; Jung, K.W. Model development for surface drainage loading estimates from paddy rice fields. Paddy Water Environ. 2005, 3, 93–101. [Google Scholar] [CrossRef]
  34. Antonopoulos, V.Z. Modelling of water and nitrogen balance in the ponded water of rice fields. Paddy Water Environ. 2008, 6, 387–395. [Google Scholar] [CrossRef]
  35. Antonopoulos, V.Z. Modelling of water and nitrogen balances in the ponded water and soil profile of rice fields in Northern Greece. Agric. Water Manag. 2010, 98, 321–330. [Google Scholar] [CrossRef]
  36. Aschonitis, V.G.; Antonopoulos, V.Z. Evaluation of the water balance and the soil and ponding water temperature in paddy-rice fields with the modified GLEAMS model. In Proceedings of the Agricultural Engineering Conference, Crete, Greece, 23–25 June 2008.
  37. Aschonitis, V.G.; Lekakis, E.H.; Petridou, Ν.C.; Koukouli, S.G.; Pavlatou-Ve, A. Nutrients fixation by Algae and limiting factors of algal growth in flooded rice fields under semi-arid Mediterranean conditions—Case study in Thessaloniki Plain in Greece. Nutr. Cycl. Agroecosys. 2013, 96, 1–13. [Google Scholar] [CrossRef]
  38. Phogat, V.; Yadav, A.K.; Malik, R.S.; Kumar, S.; Cox, J. Simulation of salt and water movement and estimation of water productivity of rice crop irrigated with saline water. Paddy Water Environ. 2010, 8, 333–346. [Google Scholar] [CrossRef]
  39. Pochai, N.; Pongnoo, N. A numerical treatment of a mathematical model of ground water flow in rice field near marine shrimp aquaculture farm. Proc. Eng. 2012, 32, 1191–1197. [Google Scholar] [CrossRef]
  40. Singh, A.; Panda, S.N. Integrated salt and water balance modeling for the management of waterlogging and salinization. II: Application of SAHYSMOD. J. Irrig. Drain. Eng. ASCE 2012, 138, 964–971. [Google Scholar] [CrossRef]
  41. Wang, X.; Yang, J.; Yao, R.; Yu, S. Irrigation regime and salt dynamics for rice with brackish water irrigation in coastal region of North Jiangsu Province. Trans. Chin. Soc. Agric. Eng. 2014, 30, 54–63. [Google Scholar]
  42. N.AG.RE.F. (National Agriculture Research Foundation-Institute of Soil Science). Soil Map of Thessaloniki Region-Area of Gallikos and Axios Rivers; Institute of Soil Science: Thessaloniki, Greece, 2003; pp. 137–138. [Google Scholar]
  43. Soil Survey Staff. Soil Taxonomy: A Basic System of Soil Classification for Making and Interpreting Soil Surveys; US Department of Agriculture-Soil Conservation Service: Washington, DC, USA, 1975. [Google Scholar]
  44. Litskas, V.D.; Aschonitis, V.G.; Antonopoulos, V.Z. Water quality in irrigation and drainage networks of Thessaloniki plain in Greece related to land use, water management, and agroecosystem protection. Environ. Monit. Assess. 2010, 163, 347–359. [Google Scholar] [CrossRef] [PubMed]
  45. Aschonitis, V.G. Modeling of Evapotranspiration, Physical Soil Properties and Water, Nitrogen and Phosphorus Balance in Flooded Rice Fields. Ph.D. Thesis, Aristotle University, School of Agriculture, Thessaloniki, Greece, 2012. [Google Scholar]
  46. Aschonitis, V.G.; Papamichail, D.M.; Lithourgidis, A.; Fano, E.A. Estimation of leaf area index and foliage area index of rice using an indirect gravimetric method. Commun. Soil Sci. Plant Anal. 2014, 45, 1726–1740. [Google Scholar] [CrossRef]
  47. Allen, R.G.; Walter, I.A.; Elliott, R.; Howell, T.; Itenfisu, D.; Jensen, M.; Snyder, R.L. The ASCE Standardized Reference Evapotranspiration Equation; Final Report (ASCE-EWRI); ASCE: Columbus, OH, USA, 2005. [Google Scholar]
  48. Tuller, M.; Islam, M.R. Field methods for monitoring solute transport. In Soil-Water-Solute Process Characterization, an Integrated Approach; Benedí, A., Muñoz-Carpena, J.R., Eds.; CRC Press LLC: Boca Raton, FL, USA, 2005; pp. 309–355. [Google Scholar]
  49. McDonald, J.D.; Bélanger, N.; Sauvé, S.; Courchesne, F.; Hendershot, W.H. Collection and characterization of soil solutions. In Soil Sampling and Methods of Analysis, 2nd ed.; Canadian Society of Soil Science, Carter, M.R., Gregorich, E.G., Eds.; CRC Press LLC, Taylor & Francis Group: Boca Raton, FL, USA, 2008; pp. 179–196. [Google Scholar]
  50. Tacker, P.; Vories, E.; Wilson, C., Jr.; Slaton, N. Water management. In Rice Production Handbook; Miscellaneous Publication 192; Slaton, N.A., Ed.; Cooperative Extension Service, University of Arkansas: Little Rock, AR, USA, 2001; pp. 75–86. [Google Scholar]
  51. Ayers, R.S.; Westcot, D.W. Water Quality for Agriculture; Irrigation and Drainage Paper 29; FAO, U.N.: Rome, Italy, 1994. [Google Scholar]
  52. Bouyoucos, G.J. Hydrometer method improved for making particle size analysis of soils. Agron. J. 1962, 54, 464–465. [Google Scholar] [CrossRef]
  53. Walkley, A.; Black, I.A. An examination of the Degtjareff method for determining soil organic matter, and a proposed modification of the chromic acid titration method. Soil Sci. 1934, 37, 29–38. [Google Scholar] [CrossRef]
  54. Allison, L.E.; Moodie, C.D. Carbonates. In Methods of Soil Analysis. Part 2; Black, C.A., Ed.; Agronomy Monograph; American Society of Agronomy: Madison, WI, USA, 1965; pp. 1379–1400. [Google Scholar]
  55. APHA. Standard Methods for the Examination of Water and Wastewater, 21st ed.; Eaton, A.D., Clesceri, L.S., Rice, E.W., Greenberg, A.E., Eds.; APHA, AWWA, WEF: Washington, DC, USA, 2005. [Google Scholar]
  56. Rhoades, J.D. Salinity: Electrical conductivity and total dissolved solids. In Methods of Soil Analysis. Part 3. Chemical Methods; Soil Science Society of America Book Series 5.3; Sparks, D.L., Page, A.L., Helmke, P.A., Loeppert, R.H., Soltanpour, P.N., Tabatabai, M.A., Johnston, C.T., Sumner, M.E., Eds.; Soil Science Society of America, American Society of Agronomy: Madison, WI., USA, 1996; pp. 417–436. [Google Scholar]
  57. Chapman, H.D.; Pratt, P.F. Methods of Analysis for Soils, Plants and Waters; University of California Division of Agricultural Science: Riverside, CA, USA, 1961. [Google Scholar]
  58. Thomas, G.W. Exchangeable cations. In Methods of Soil Analysis. Part 2, Chemical and Microbiological Properties, 2nd ed.; Klute, A., Ed.; American Society of Agronomy, Soil Science Society of America: Madison, WI, USA, 1982; pp. 159–165. [Google Scholar]
  59. Dane, J.H.; Hopmans, J.W. Water retention and storage. In Methods of Soil Analysis. Part 1. Physical Methods, 3rd ed.; Dane, J.H., Topp, G.C., Eds.; Soil Science Society of America: Madison, WI, USA, 2002; pp. 671–720. [Google Scholar]
  60. Van Genuchten, M.T. A closed-form equation for predicting the hydraulic conductivity of unsaturated soils. Soil Sci. Soc. Am. J. 1980, 44, 892–898. [Google Scholar] [CrossRef]
  61. Van Genuchten, M.T.; Leij, F.J.; Yates, S.R.M. The RETC Code for Quantifying the Hydraulic Functions of Unsaturated Soils; USDA, Agricultural Research Service: Riverside, CA, USA, 1991. [Google Scholar]
  62. Hinsinger, P.; Plassard, C.; Tang, C.; Jaillard, B. Origins of root-induced pH changes in the rhizosphere and their responses to environmental constraints: A review. Plant Soil 2003, 248, 43–59. [Google Scholar] [CrossRef]
  63. Jones, C.; Brown, B.D.; Engel, R.; Horneck, D.; Orson-Rutz, K. Factors Affecting Nitrogen Fertilizer Volatilization; USDA, Montana State University and Montana State University Extension Bulletin: Bozeman, MT, USA, 2013; p. 8. [Google Scholar]
  64. Mahrous, F.N.; Mikkelsen, D.S.; Hafez, A.A. Effect of soil salinity on the electro-chemical and chemical kinetics of some plant nutrients in submerged soils. Plant Soil 1983, 75, 455–472. [Google Scholar] [CrossRef]
  65. Larson, K.D.; Graetz, D.A.; Schaffer, B. Flood-induced chemical transformations in calcareous agricultural soils of South Florida. Soil Sci. 1991, 152, 33–40. [Google Scholar] [CrossRef]
  66. Chorom, M.; Rengasamy, P. Carbonate chemistry, pH, and physical properties of an alkaline sodic soil as affected by various amendments. Austral. J. Soil Res. 1997, 35, 149–162. [Google Scholar] [CrossRef]
  67. Armstrong, W. Aeration in higher plants. Adv. Botan. Res. 1979, 7, 225–232. [Google Scholar]
  68. Begg, C.B.M.; Kirk, G.J.D.; MacKenzie, A.F.; Neue, H.U. Root-induced iron oxidation and pH changes in the lowland rice rhizosphere. New Phytol. 1994, 128, 469–477. [Google Scholar] [CrossRef]
  69. Kirk, G.J.D.; van Du, L.E. Changes in rice root architecture, porosity, and oxygen and proton release under phosphorus deficiency. New Phytol. 1997, 135, 191–200. [Google Scholar] [CrossRef]
  70. Kirk, G. The Biogeochemistry of Submerged Soils; John Wiley and Sons Ltd.: Chichester, West Sussex, UK, 2004; p. 297. [Google Scholar]
  71. Hinsinger, P. Plant-induced changes in soil processes and properties. In Soil Conditions and Plant Growth; Gregory, P.J., Nortcliff, S., Eds.; John Wiley and Sons Ltd.: Chichester, West Sussex, UK, 2013; pp. 323–365. [Google Scholar]
  72. Fillery, I.R.P.; Simpson, J.R.; de Datta, S.K. Influence of field environment and fertilizer management on ammonia loss from flooded rice. Soil Sci. Soc. Am. J. 1984, 48, 914–920. [Google Scholar] [CrossRef]
  73. De Datta, S.K. Principles and Practices of Rice Production; John Wiley and Sons, Inc.: Singapore, Singapore, 1981; p. 640. [Google Scholar]
  74. Abrol, I.P.; Yadav, J.S.P.; Massoud, F.I. Salt-Affected Soils and Their Management; FAO Soils Bulletin: Rome, Italy, 1988. [Google Scholar]
  75. Chen, Y.; Zhang, G.; Xu, Y.J.; Huang, Z. Influence of irrigation water discharge frequency on soil salt removal and rice yield in a semi-arid and saline-sodic area. Water 2013, 5, 578–592. [Google Scholar] [CrossRef]
  76. Ntanos, D.A. Strategies for rice production and research in Greece. Cah. Opt. Méditerr. 2001, 50, 115–122. [Google Scholar]

