No Effect Level of Co-Composted Biochar on Plant Growth and Soil Properties in a Greenhouse Experiment


Abstract
:1. Introduction
2. Materials and Methods
2.1. Soil Substrates

| Al | Ca | K | Mg | Na | P | Biochar | TOC | N | C/N | Ash | NO3 | NH4 | BET ± se | |
|---|---|---|---|---|---|---|---|---|---|---|---|---|---|---|
| [g kg−1] | [g kg−1] | [g kg−1] | [g kg−1] | [g kg−1] | [g kg−1] | [g kg−1] | [g kg−1] | [g kg−1] | [g kg−1] | [g kg−1] | [m2 g−1] | |||
| Sand | 0.068 | 0.118 | 0.008 | 0.025 | 0.007 | 0.008 | 0 | 0.96 | n.a. | n.a. | n.a. | n.a. | n.a. | n.a. |
| Loam | 0.683 | 2.511 | 0.202 | 0.333 | 0.030 | 0.091 | 0 | 16.09 | n.a. | n.a. | n.a. | n.a. | n.a. | n.a. |
| CO | 11.0 | 3390 | 302 | 103 | 45.4 | 24.7 | 0 | 112.83 | 9.46 | 13.41 | 78.40 | 0.25 | 0.06 | 2.3 ± 0.3 |
| BC-03 | 7.9 | 3610 | 312 | 103 | 46.7 | 22.0 | 3 | 120.52 | 9.85 | 13.63 | 77.80 | 0.32 | 0.04 | 11.6 ± 0.8 |
| BC-05 | 8.0 | 3510 | 292 | 100 | 44.4 | 25.3 | 5 | 117.36 | 9.69 | 13.48 | 77.40 | 0.34 | 0.03 | 12.7 ± 0.1 |
| BC-10 | 7.8 | 3590 | 325 | 107 | 51.0 | 23.9 | 10 | 122.11 | 9.43 | 14.31 | 76.20 | 0.36 | 0.06 | 12.9 ± 0.7 |
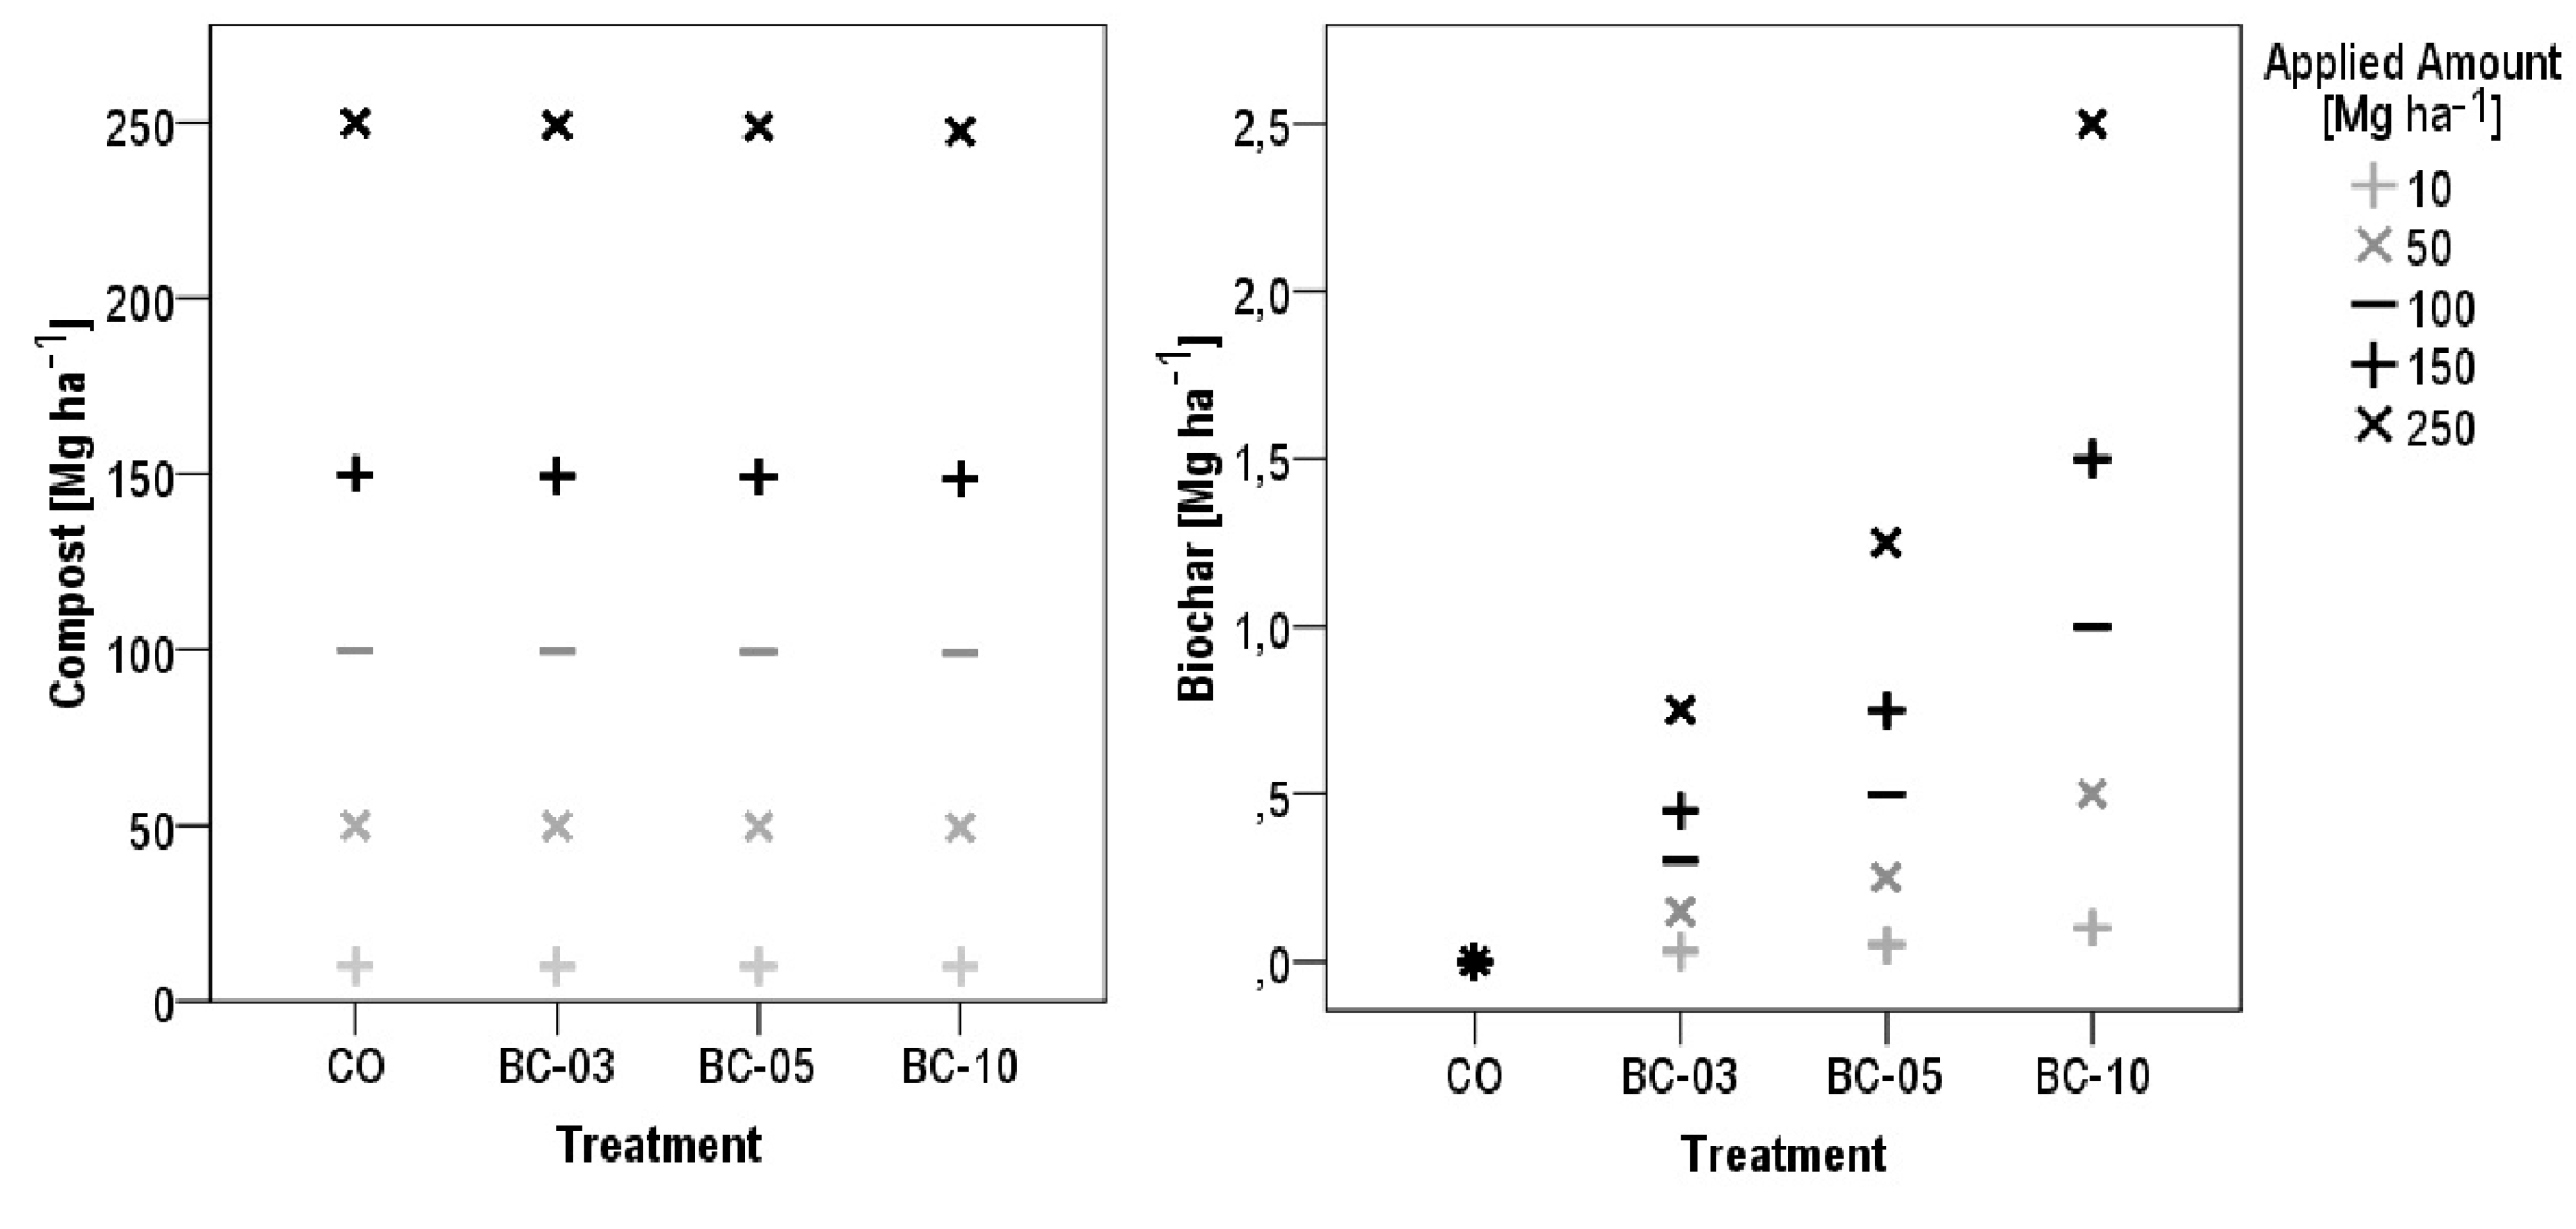
2.2. Biochar Composts
2.3. Greenhouse Experiment
2.4. Soil and Plant Analyses
2.5. Statistical Analysis
3. Results
3.1. Plant Growth
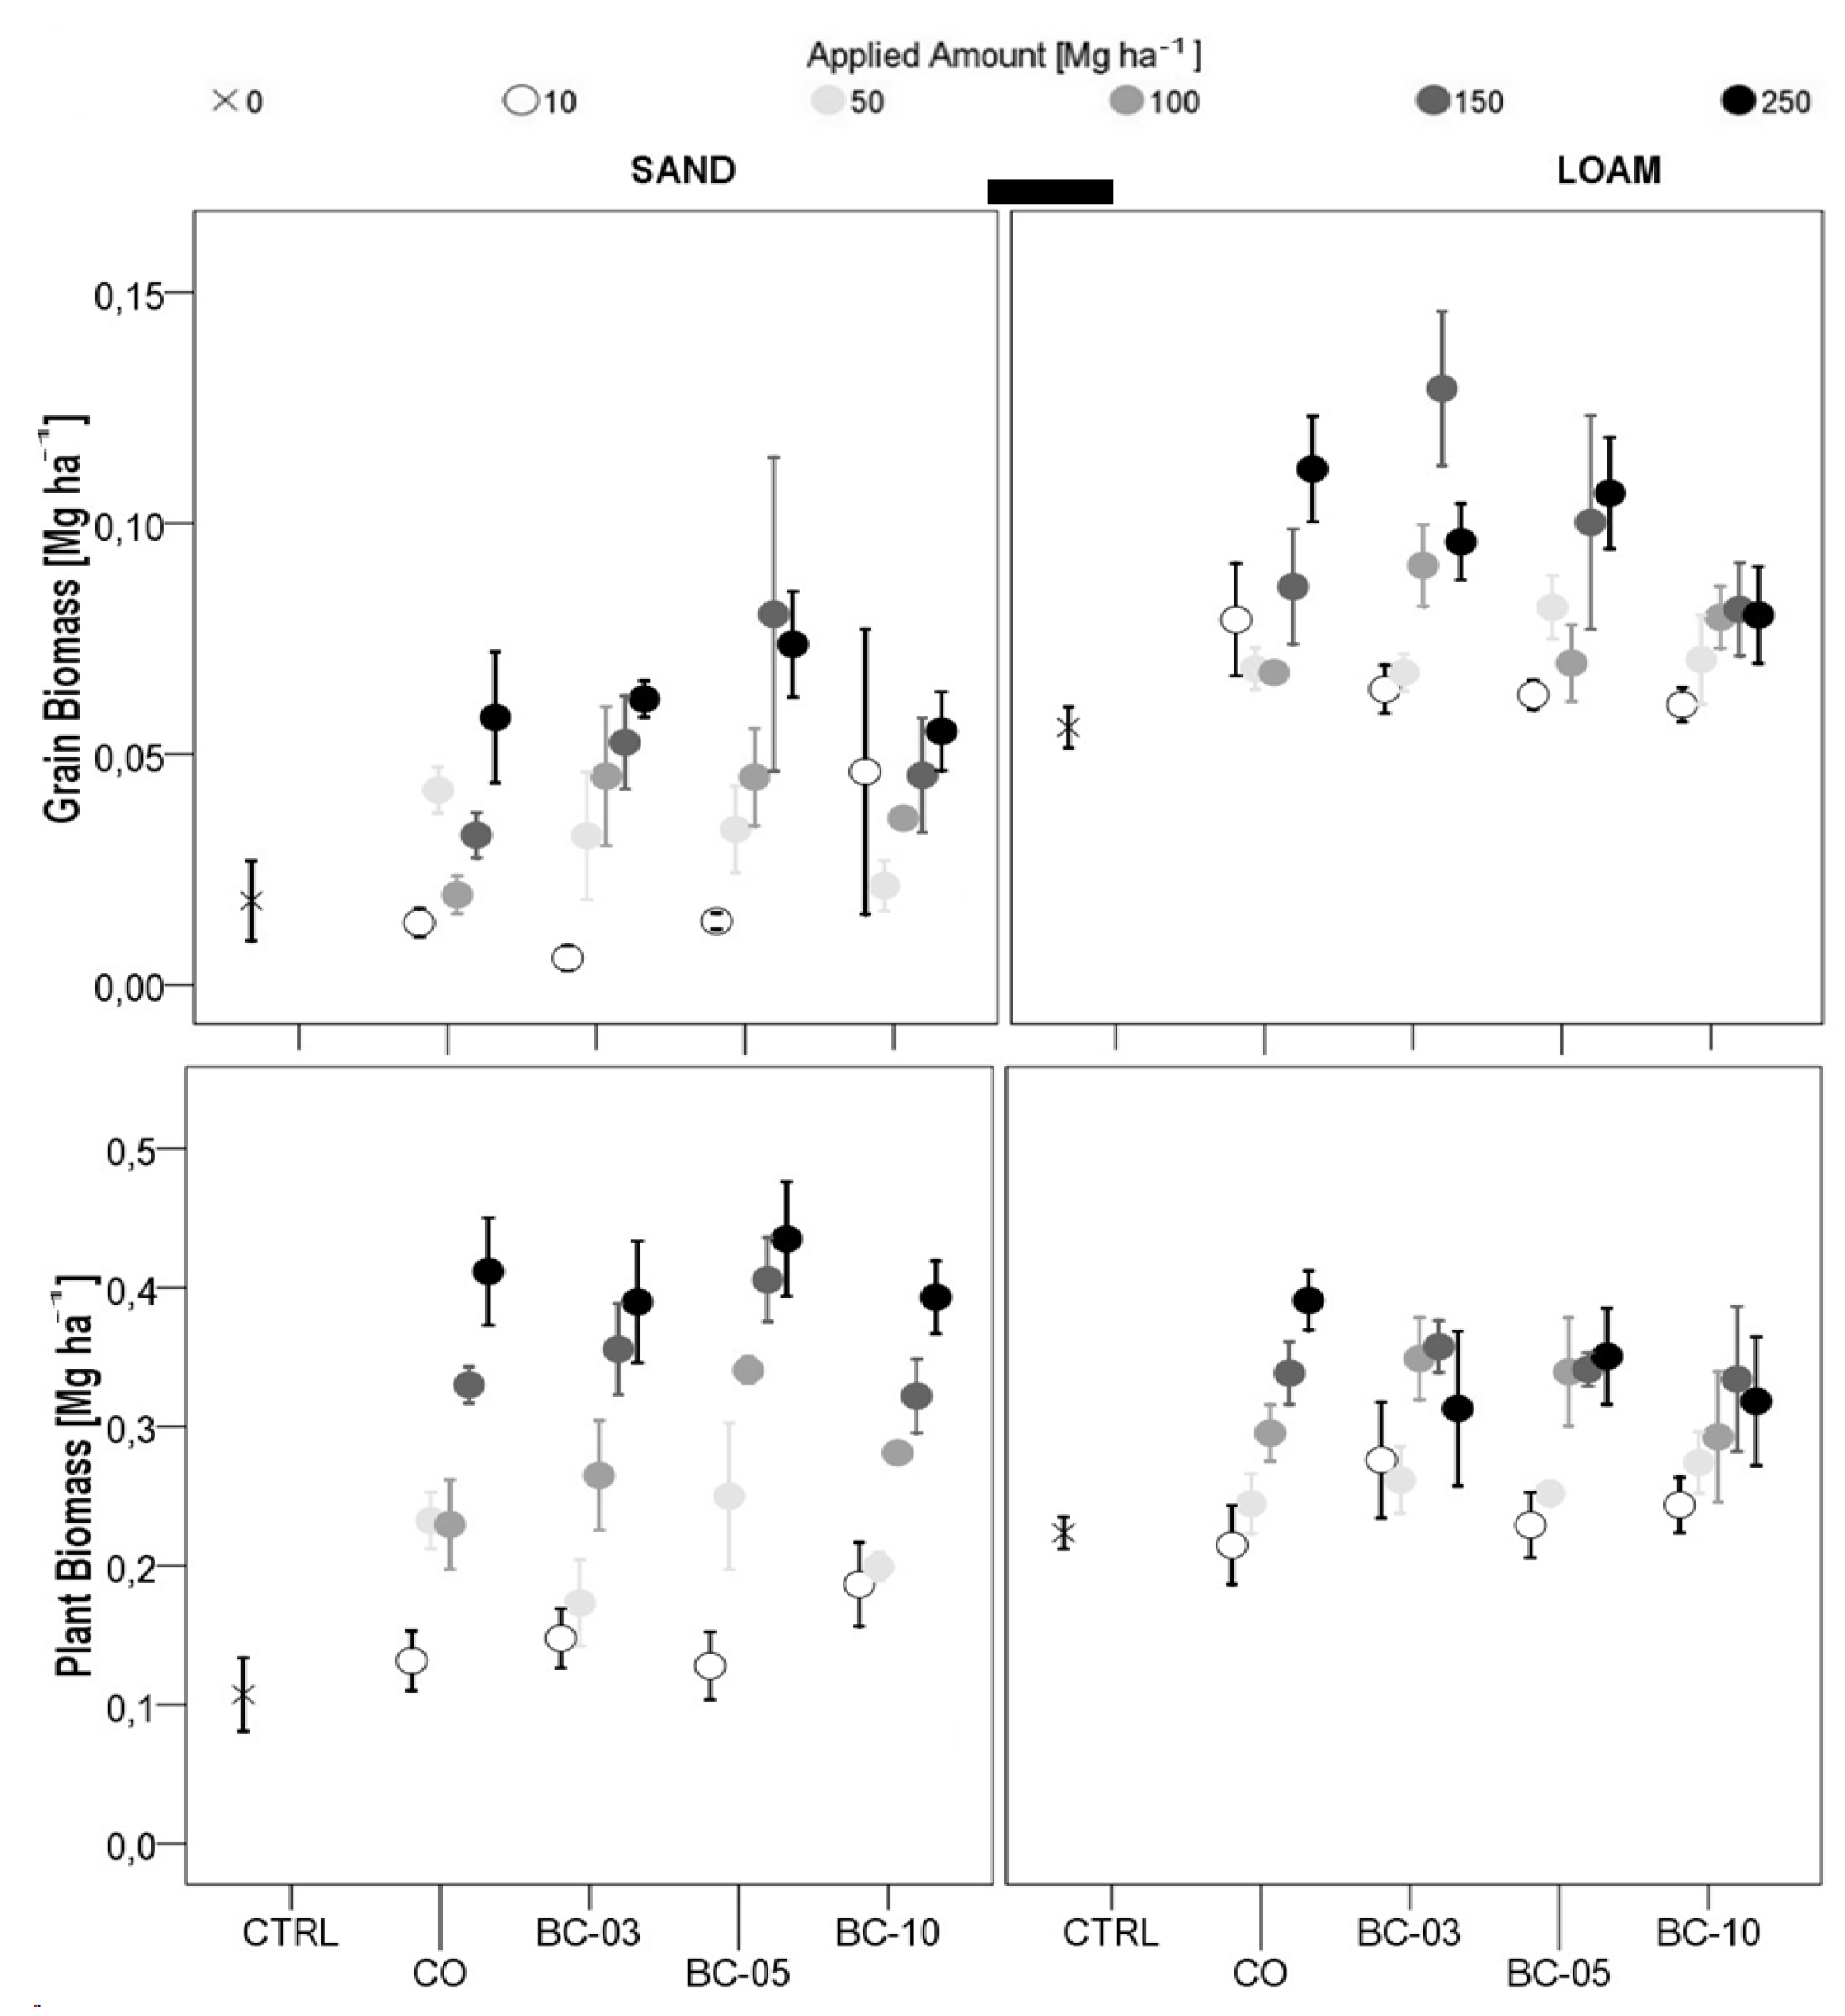
3.1.1. Oat Grain Yield

| Substrate | Variable | Regression (CO) | Regression (BC) | ||
|---|---|---|---|---|---|
| Sand | Seed yield | 1.85 + 0.02 × CO | *** | n.s | |
| Biomass | 16.48 + 0.10 × CO | *** | n.s. | ||
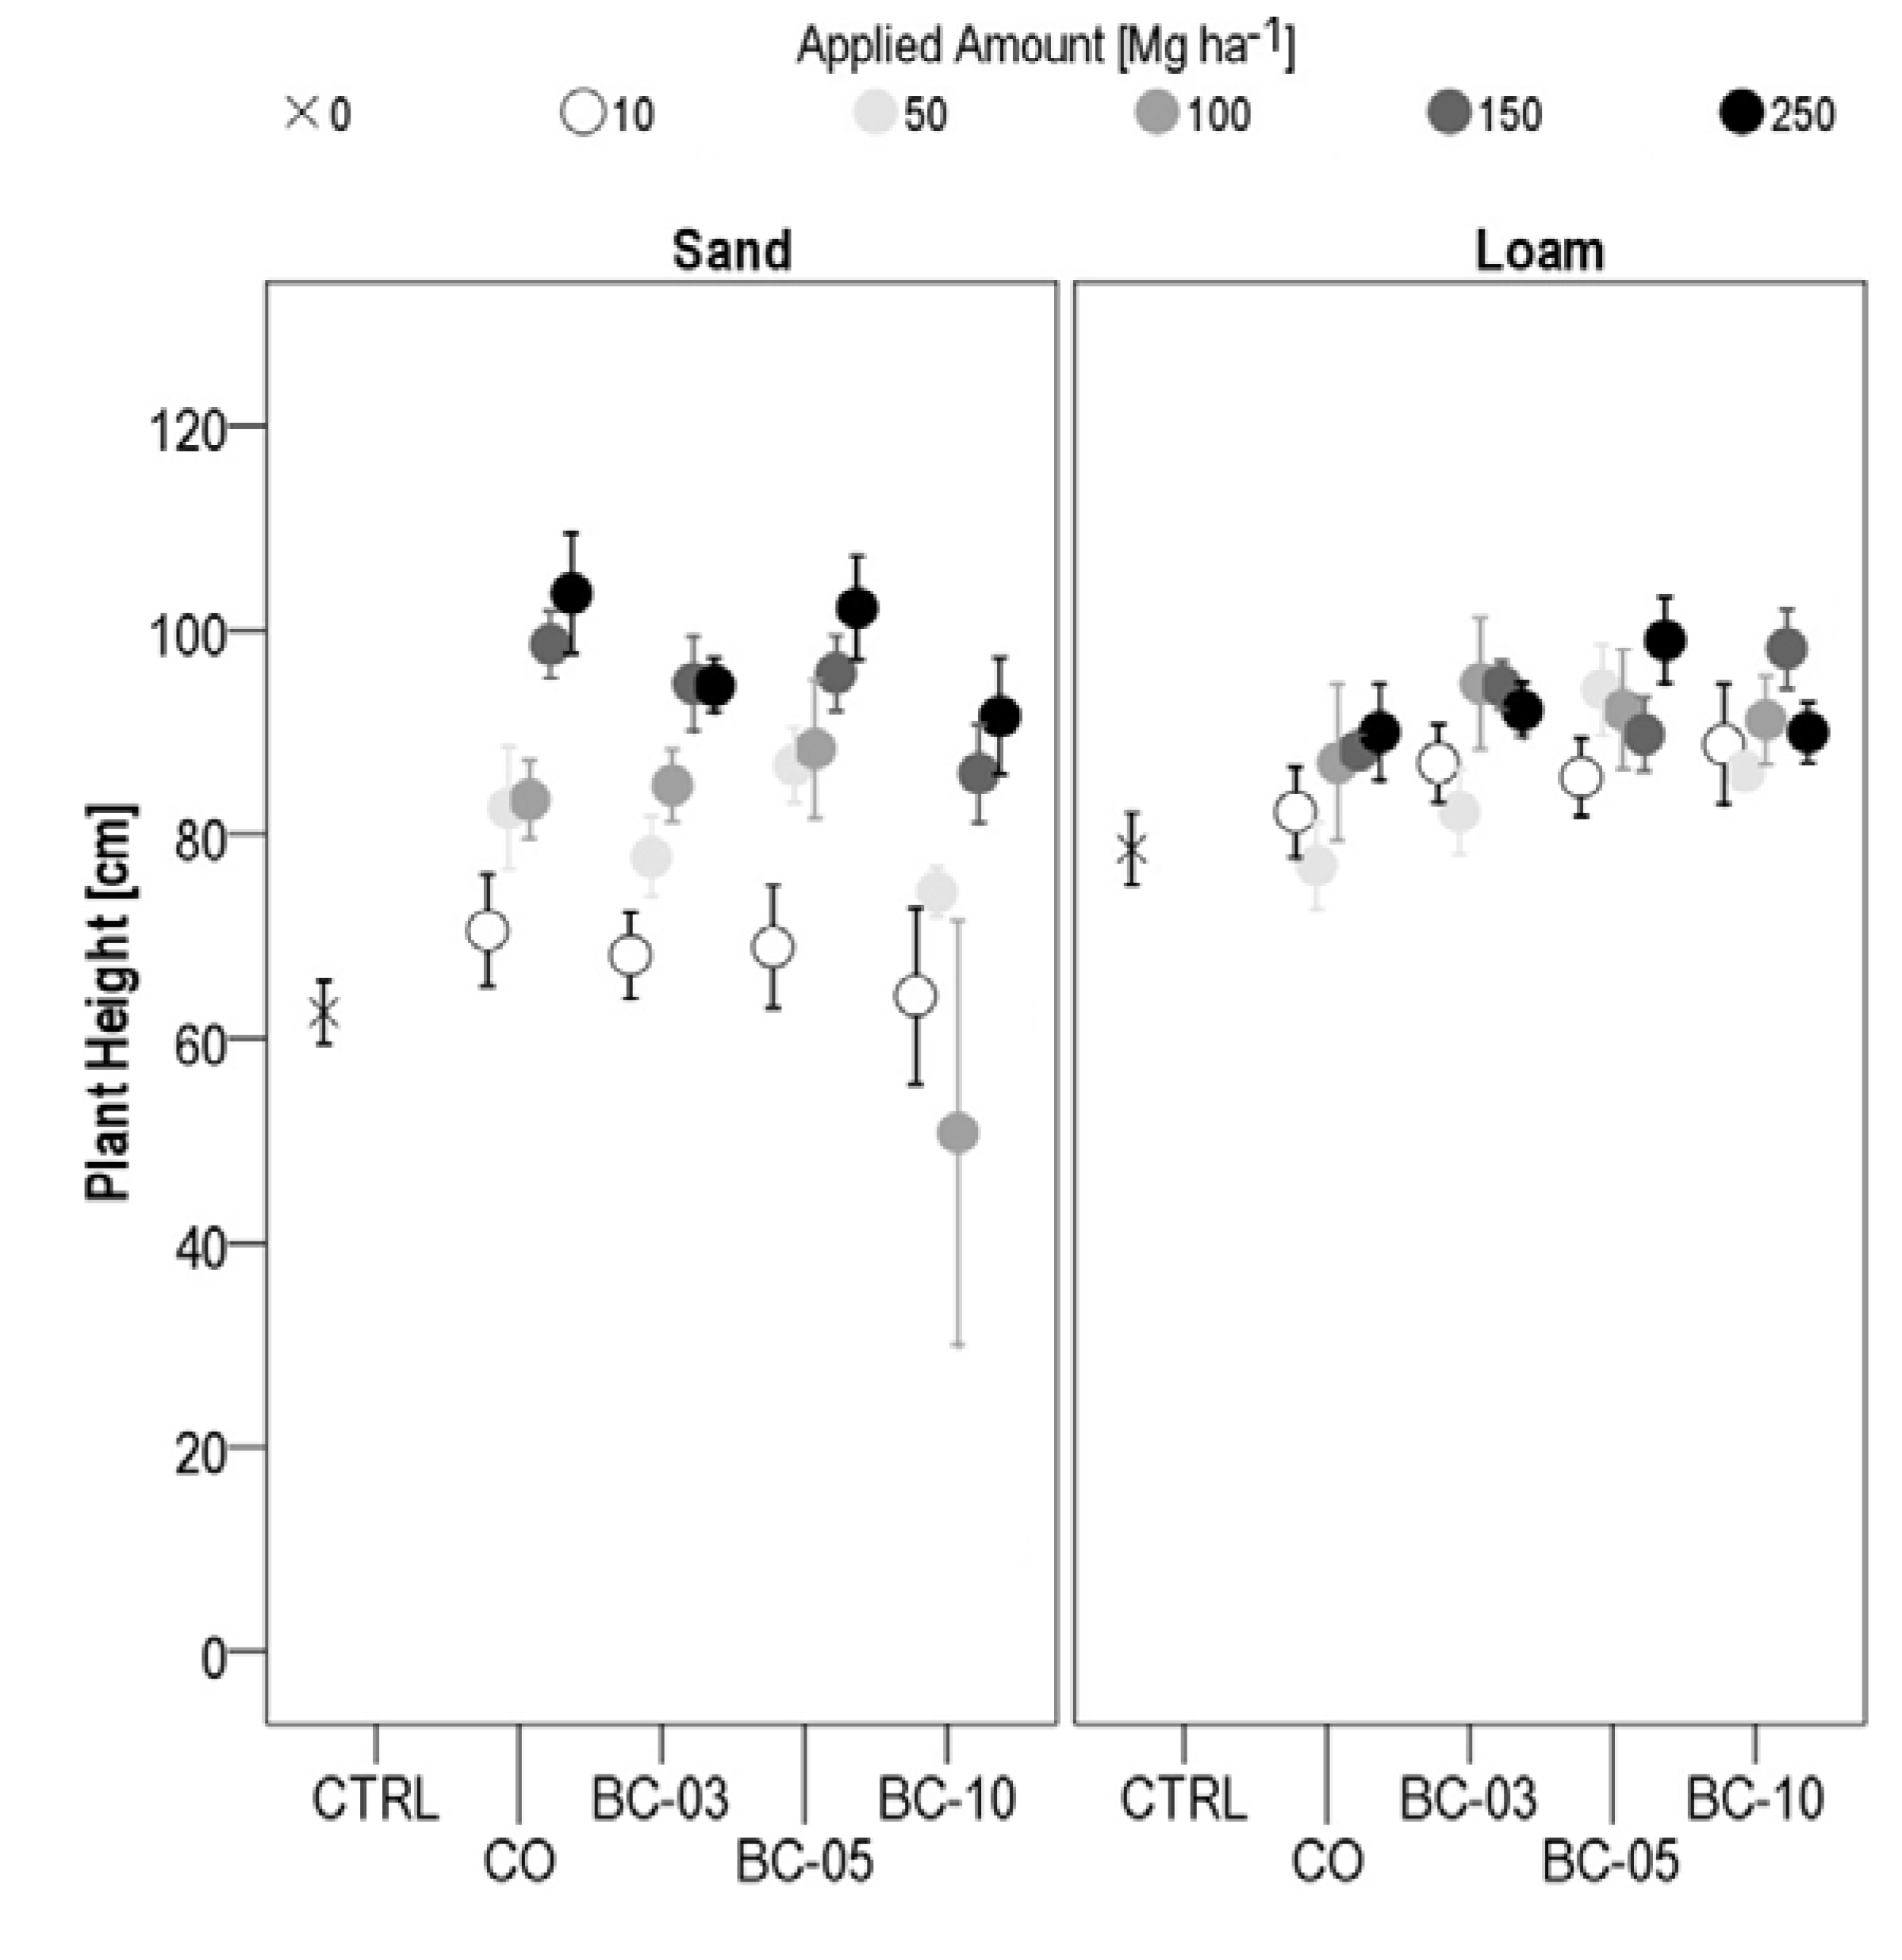
| Plant height | 73.00 + 0.11 × CO | *** | 101.31 − 8.11 × BC150 | * | |
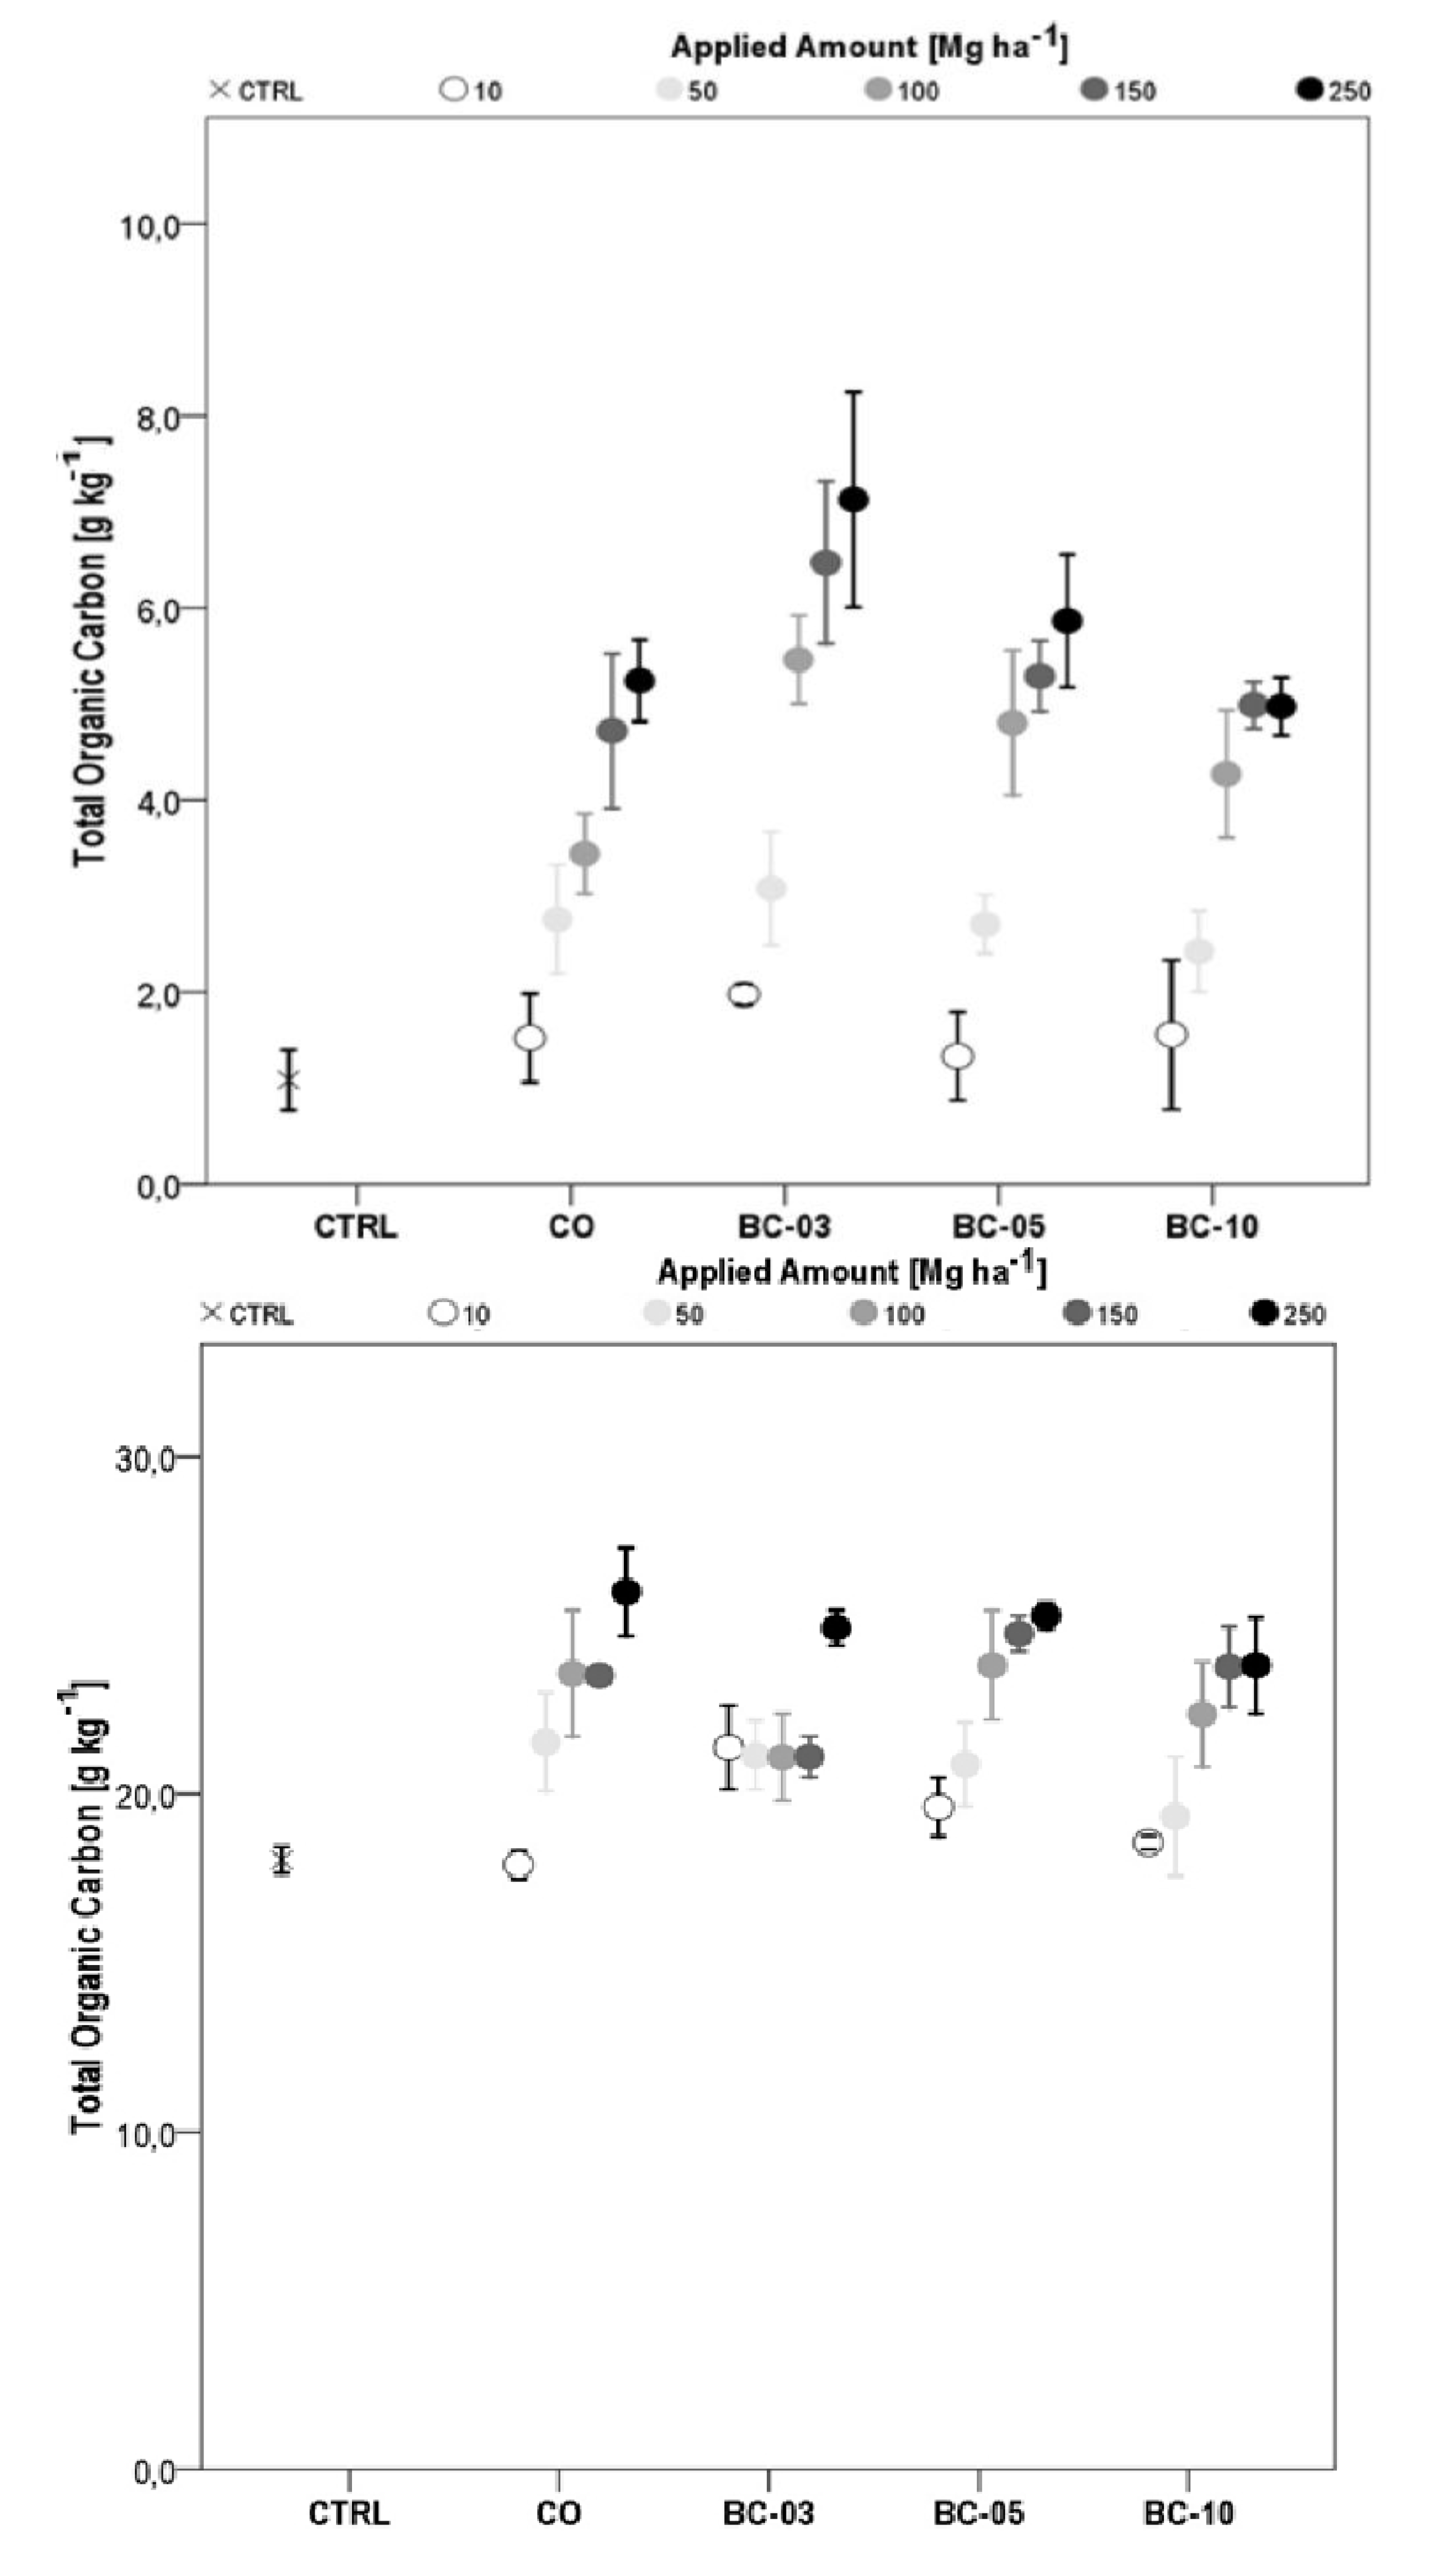
| TOC | 2.71 + 0.01 × CO | *** | 0.97 + 33.50 × BC10 | ** | |
| TN | 0.22 + 0.00 × CO | *** | n.s. | ||
| pH | 8.54 + 0.00 × CO | *** | n.s. | ||
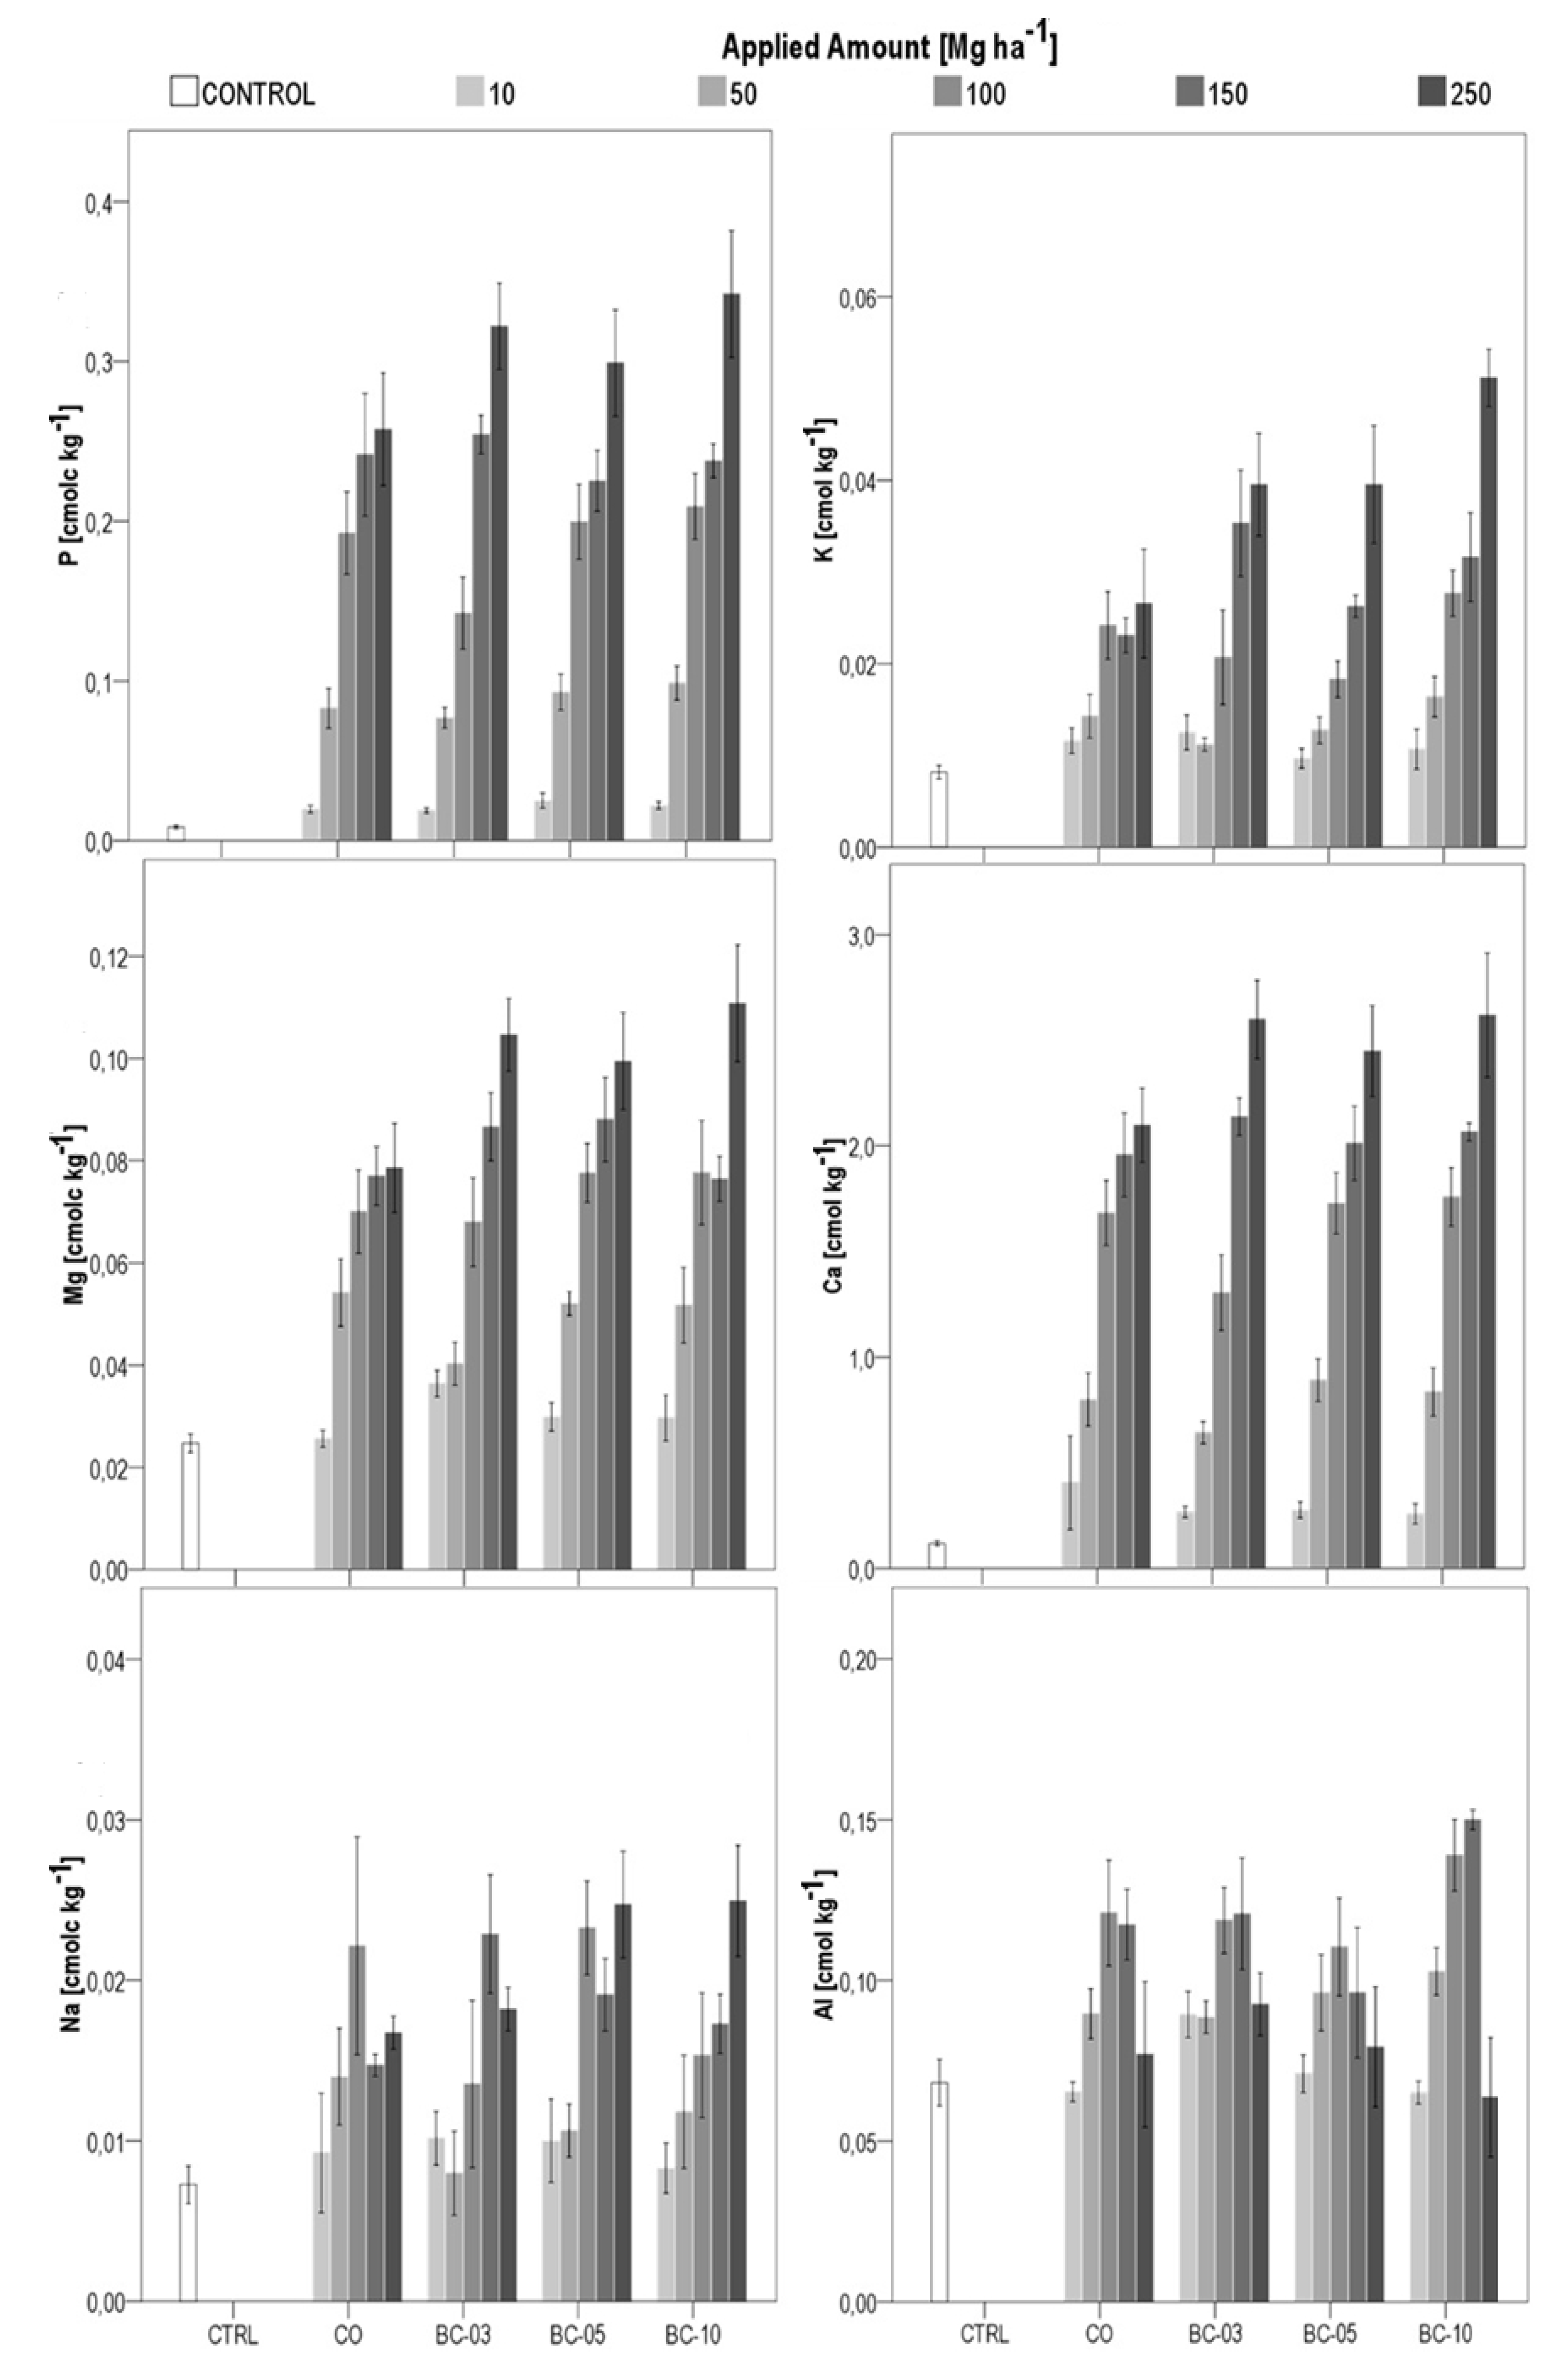
| P | 0.056 + 0.001 × CO | *** | n.s. | ||
| K | 0.009 + 0.000 × CO | *** | 0.018 − 0.130 × BC10 | * | |
| 0.011 + 0.011 × BC50 | * | ||||
| 0.030 + 0.008 × BC250 | * | ||||
| Mg | 0.043 + 0.000 × CO | *** | 0.079 + 0.015 × BC250 | * | |
| Ca | 0.574 + 0.008 × CO | *** | n.s. | ||
| Na | 0.011 + 0.000 × CO | *** | n.s. | ||
| Al | 0.105 − 0.000 × CO | n.s. | n.s. | ||
| Loam | Seed yield | 6.66 + 0.01 × CO | ** | n.s | |
| Biomass | 26.18 + 0.04 × CO | *** | 41.04 − 4.69 × BC250 | * | |
| Plant height | 87.49 + 0.02 × CO | n.s. | n.s. | ||
| TOC | 18.99 + 0.03 × CO | *** | 25.19 − 9.79 × BC100 | * | |
| TN | 1.66 + 0.00 × CO | *** | n.s. | ||
| pH | 7.21 + 0.00 × CO | *** | n.s. | ||
| P | 0.131 + 0.001 × CO | *** | n.s. | ||
| K | 0.193 + 0.000 × CO | *** | 0.240 − 0.662 × BC50 | ** | |
| Mg | 0.345 + 0.000 × CO | *** | n.s. | ||
| Ca | 2.942 + 0.009 × CO | *** | 3.105 + 0.897 × BC50 | * | |
| Na | 0.04 + 0.000 × CO | *** | 0.043 − 0.174 × BC10 | ** | |
| Al | 0.668 − 0.000 × CO | *** | n.s. |
3.1.2. Plant Biomass
3.1.3. Plant Height

3.2. Changes in Soil Properties
3.2.1. Total Organic Carbon (TOC)
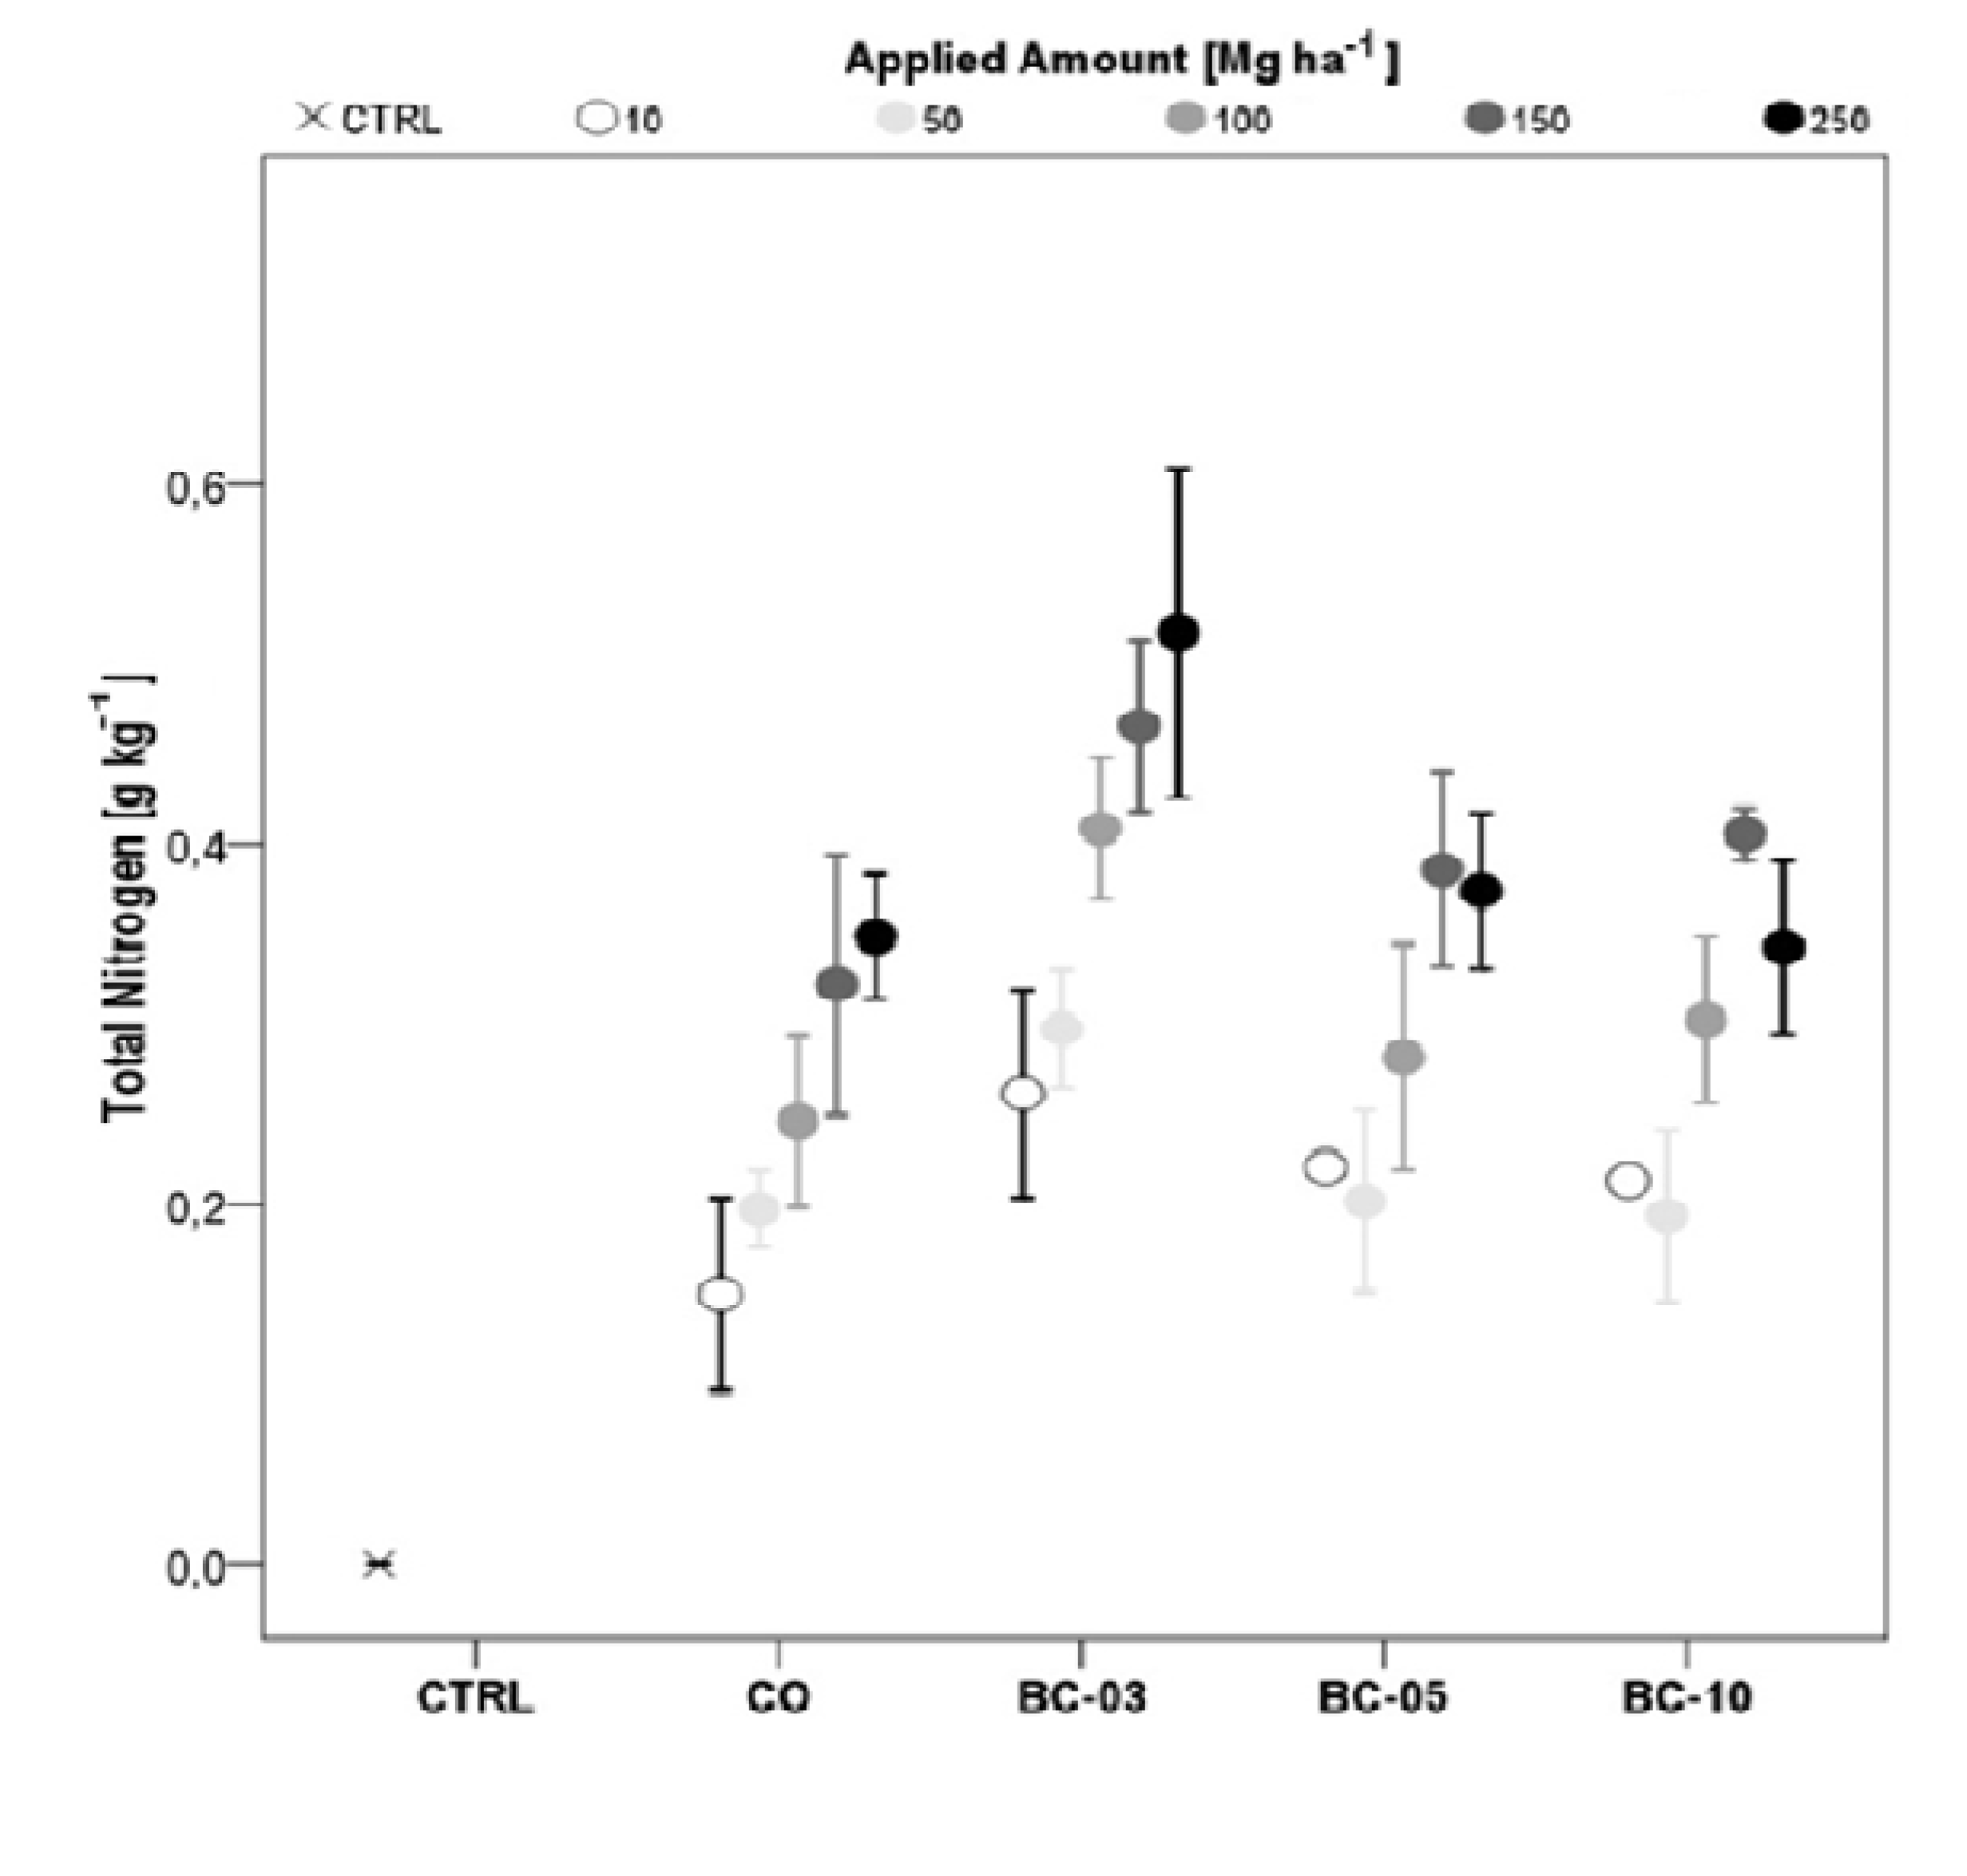
3.2.2. Total Nitrogen (Ntot)

3.2.3. Soil Reaction (pH)
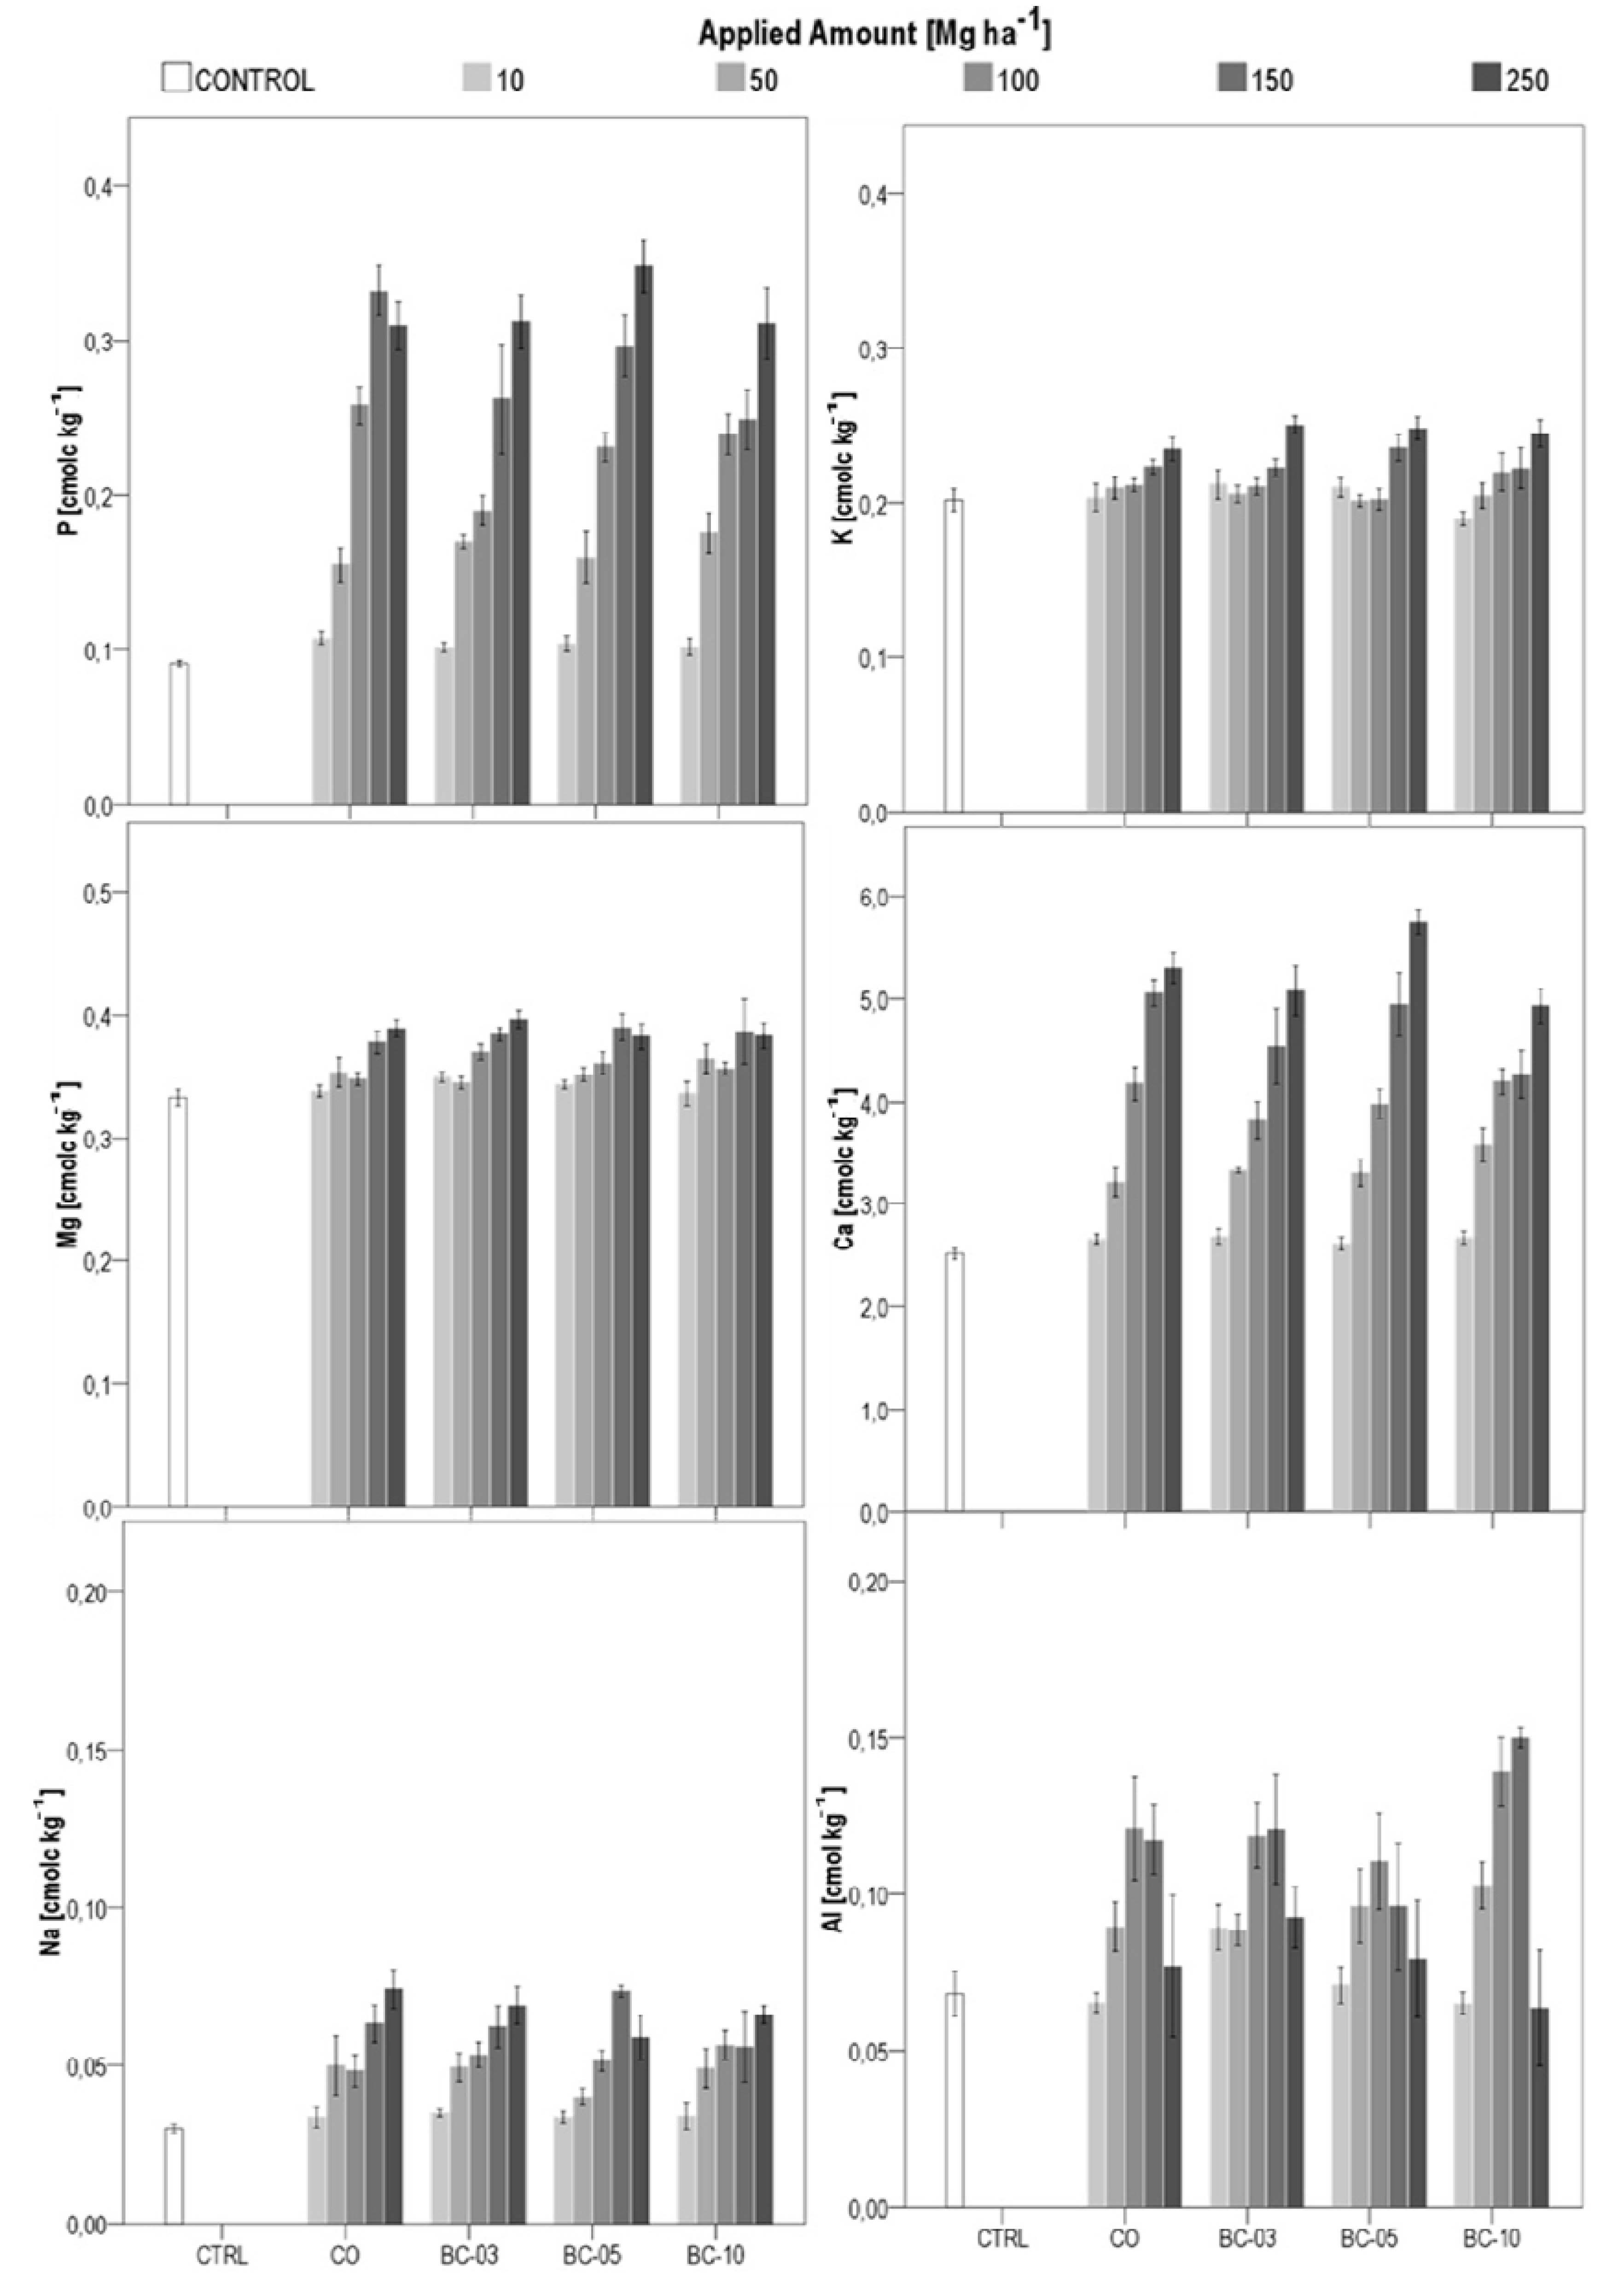
3.2.4. Plant-Available Nutrients and Aluminum

4. Discussion
5. Conclusions
Acknowledgments
Conflicts of Interest
References
- Glaser, B.; Lehmann, J.; Zech, W. Ameliorating physical and chemical properties of highly weathered soils in the tropics with charcoal—A review. Biol. Fertil. Soils 2002, 35, 219–230. [Google Scholar] [CrossRef]
- Sohi, S.P.; Krull, E.; Lopez-Capel, E.; Bol, R. A review of biochar and its use and function in soil. Adv. Agron. 2010, 105, 47–82. [Google Scholar] [CrossRef]
- Waters, D.; Zwieten, L.; Singh, B.; Downie, A.; Cowie, A.; Lehmann, J. Biochar in Soil for Climate Change Mitigation and Adaptation. In Soil Health and Climate Change; Singh, B.P., Cowie, A.L., Chan, K.Y., Eds.; Springer: Berlin/Heidelberg, Germany, 2011; pp. 345–368. [Google Scholar]
- Jeffery, S.; Verheijen, F.G.A.; van der Velde, M.; Bastos, A.C. A quantitative review of the effects of biochar application to soils on crop productivity using meta-analysis. Agric. Ecosyst. Environ. 2011, 144, 175–187. [Google Scholar] [CrossRef]
- Chan, K.Y.; Xu, Z. Biochar: Nutrient Properties and Their Enhancement. In Biochar for Environmental Management: Science and Technology; Lehmann, J., Joseph, S., Eds.; Earthscan: London, UK, 2009; pp. 67–84. [Google Scholar]
- Singh, B.; Singh, B.P.; Cowie, A.L. Characterisation and evaluation of biochars for their application as a soil amendment. Soil Res. 2010, 48, 516–525. [Google Scholar] [CrossRef]
- Schulz, H.; Glaser, B. Effects of biochar compared to organic and inorganic fertilizers on soil quality and plant growth in a greenhouse experiment. J. Plant Nutr. Soil Sci. 2012, 175, 410–422. [Google Scholar] [CrossRef]
- Fischer, D.; Glaser, B. Synergisms between Compost and Biochar for Sustainable Soil Amelioration. In Management of Organic Waste; Kumar, S., Bharti, A., Eds.; Intech: Shanghai, China, 2012. [Google Scholar]
- Schulz, H.; Dunst, G.; Glaser, B. Positive effects of composted biochar on plant growth and soil fertility. Agron. Sustain. Dev. 2013, 33, 817–827. [Google Scholar] [CrossRef]
- Wiedner, K.; Baumgartl, M.-L.; Favilli, F.; Criscuoli, I.; Walther, S.; Fischer, D.; Miglietta, F.; Glaser, B. Surface Oxidation of Modern and Fossil Biochars. In Proceedings of the Eurosoil, Bari, Italy, 2–6 July 2012.
- Wiedner, K.; Naisse, C.; Rumpel, C.; Pozzi, A.; Wieczorek, P.; Glaser, B. Chemical modification of biomass residues during hydrothermal carbonization—What makes the difference, temperature or feedstock? Org. Geochem. 2013, 54, 91–100. [Google Scholar] [CrossRef]
- Blackwell, P.; Krull, E.; Butler, G.; Herbert, A.; Solaiman, Z. Effect of banded biochar on dryland wheat production and fertiliser use in south-western Australia: An agronomic and economic perspective. Soil Res. 2010, 48, 531–545. [Google Scholar] [CrossRef]
- Mehlich, A. Mehlich 3 soil test extractant: A modification of Mehlich 2 extractant. Commun. Soil Sci. Plant Anal. 1984, 15, 1409–1416. [Google Scholar] [CrossRef]
- Ding, W.-C.; Zeng, X.-L.; Wang, Y.-F.; Du, Y.; Zhu, Q.-X. Characteristics and performances of biofilm carrier prepared from agro-based biochar. China Environ. Sci. 2011, 31, 451–1455. [Google Scholar]
- Nguyen, B.T.; Lehmann, J.; Hockaday, W.C.; Joseph, S.; Masiello, C.A. Temperature sensitivity of black carbon decomposition and oxidation. Env. Sci. Tec. 2010, 44, 3324–3331. [Google Scholar] [CrossRef]
- Cheng, C.-H.; Lehmann, J.; Engelhard, M.H. Natural oxidation of black carbon in soils: Changes in molecular form and surface charge along a climosequence. Geochimica et Cosmochimica Acta 2005, 72, 1598–1610. [Google Scholar]
- Glaser, B.; Birk, J.J. State of the scientific knowledge on properties and genesis of Anthropogenic Dark Earths in Central Amazonia (terra preta de Índio). Geochim. Cosmochim. Acta 2012, 82, 39–51. [Google Scholar] [CrossRef]
- Lehmann, J.; Pereira da Silva, J.; Steiner, C.; Nehls, T.; Zech, W.; Glaser, B. Nutrient availability and leaching in an archaeological Anthrosol and a Ferralsol of the Central Amazon basin: Fertilizer, manure and charcoal amendments. Plant Soil 2003, 249, 343–357. [Google Scholar] [CrossRef]
- Marris, E. Putting the carbon back: Black is the new green. Nature 2006, 442, 624–626. [Google Scholar] [CrossRef]
- Blackwell, P.; Riethmuller, G.; Collins, M. Biochar Application to Soil. In Biochar for Environmental Management: Science and Technology; Lehmann, J., Joseph, S., Eds.; Earthscan: London, UK, 2009; pp. 67–84. [Google Scholar]
- Steiner, C.; Teixeira, W.; Lehmann, J.; Nehls, T.; de Macêdo, J.; Blum, W.; Zech, W. Long term effects of manure, charcoal and mineral fertilization on crop production and fertility on a highly weathered Central Amazonian upland soil. Plant Soil 2007, 291, 275–290. [Google Scholar] [CrossRef]
- Kimetu, J.M.; Lehmann, J.; Ngoze, S.O.; Mugendi, D.N.; Kinyangi, J.M.; Riha, S.; Verchot, L.; Recha, J.W.; Pell, A.N. Reversibility of soil productivity decline with organic matter of differing quality along a degradation gradient. Ecosystems 2008, 11, 726–739. [Google Scholar] [CrossRef]
- Lehmann, J.; da Silva, J.P., Jr.; Rondon, M.; Cravo, M.S.; Greenwood, J.; Nehls, T.; Steiner, C. Slash-and-char—A Feasible Alternative for Soil Fertility Management in the Central Amazon. In Proceedings of the 17th World Congress of Soil Science, Bangkok, Thailand, 14–21 August 2002.
- Iswaran, V.; Jauhri, K.S.; Sen, A. Effect of charcoal, coal and peat on the yield of moong, soybean and pea. Soil Biol. Biochem. 1980, 12, 191–192. [Google Scholar] [CrossRef]
- Yamato, M.; Okimori, Y.; Wibowo, I.; Anshori, S.; Ogawa, M. Effects of the application of charred bark of Acacia mangium on the yield of maize, cowpea and peanut, and soil chemical properties in South Sumatra, Indonesia. J. Soil Sci. Plant Nutr. 2006, 52, 489–495. [Google Scholar]
- DeLuca, T.H.; MacKenzie, M.D.; Gundale, M.J. Biochar Effects on Soil Nutrient Transformations. In Biochar for Environmental Management: Science and Technology; Lehmann, J., Joseph, S., Eds.; Earthscan: London, UK, 2009; pp. 251–270. [Google Scholar]
- Topoliantz, S.; Ponge, J.; Ballof, S. Manioc peel and charcoal: A potential organic amendment for sustainable soil fertility in the tropics. Biol. Fertil. Soils 2005, 41, 15–21. [Google Scholar] [CrossRef]
- Oguntunde, P.G.; Fosu, M.; Ajayi, A.E.; Giesen, N. Effects of charcoal production on maize yield, chemical properties and texture of soil. Biol Fertil Soils 2004, 39, 295–299. [Google Scholar] [CrossRef]
- Hua, L.; Wu, W.X.; Liu, Y.X.; McBride, M.; Chen, Y.X. Reduction of nitrogen loss and Cu and Zn mobility during sludge composting with bamboo charcoal amendment. Environ. Sci. Pollut. R. 2009, 16, 1–9. [Google Scholar]
- Amlinger, F.; Peyr, S.; Geszti, J.; Dreher, P.; Karlheinz, W.; Nortcliff, S. Beneficial Effects of Compost Application on Fertility and Productivity of Soils. In Federal Ministry for Agricultural and Forestry, Environment and Water Management; Lebensministerium: Vienna, Austria, 2007. [Google Scholar]
- Diacono, M.; Montemurro, F. Long-term effects of organic amendments on soil fertility. J. Sustain. Agric. 2011, 2, 761–786. [Google Scholar]
- Blackwell, P.; Shea, S.; Storer, P.; Solaiman, Z.; Kerkmans, M.; Stanley, I. Improving Wheat Production with Deep Banded Oil Mallee Charcoal in Western Australia. In Proceedings of the First Asia Pacific Biochar Conference, Terrigal, Australia, 29 April–2 May 2007.
© 2014 by the authors; licensee MDPI, Basel, Switzerland. This article is an open access article distributed under the terms and conditions of the Creative Commons Attribution license (http://creativecommons.org/licenses/by/3.0/).
Share and Cite
Schulz, H.; Dunst, G.; Glaser, B. No Effect Level of Co-Composted Biochar on Plant Growth and Soil Properties in a Greenhouse Experiment. Agronomy 2014, 4, 34-51. https://doi.org/10.3390/agronomy4010034
Schulz H, Dunst G, Glaser B. No Effect Level of Co-Composted Biochar on Plant Growth and Soil Properties in a Greenhouse Experiment. Agronomy. 2014; 4(1):34-51. https://doi.org/10.3390/agronomy4010034
Chicago/Turabian StyleSchulz, Hardy, Gerald Dunst, and Bruno Glaser. 2014. "No Effect Level of Co-Composted Biochar on Plant Growth and Soil Properties in a Greenhouse Experiment" Agronomy 4, no. 1: 34-51. https://doi.org/10.3390/agronomy4010034