Article

The Effect of Mean Daily Temperature and Relative Humidity on Pollen, Fruit Set and Yield of Tomato Grown in Commercial Protected Cultivation

1
Negev R & D Center M.P.O Negev 4, Negev 8544100, Israel
2
Vegetable Department, Extension Services-Ministry of Agriculture, Bet-Dagan 5020000, Israel
3
NaanDanJain Irrigation Company, Naan 7682900, Israel
*
Author to whom correspondence should be addressed.
Agronomy 2014, 4(1), 167-177; https://doi.org/10.3390/agronomy4010167
Submission received: 29 December 2013 / Revised: 11 March 2014 / Accepted: 12 March 2014 / Published: 21 March 2014

Abstract

:
The research trial was carried out in the Mediterranean region where high summer temperatures have been proved to have a detrimental effect on the delicate tomato fruitset process. The flower to fruit set process was simultaneously monitored in fogged and unfogged shelters during the three-month Mediterranean summer season. Comparisons of pollen quality, fruit set rates and fruit yield revealed that mean daily temperatures of 25–26 °C are the upper limit for proper fruit set and fruit yield for tomatoes grown in protected cultivation during the hot Mediterranean summer period. A moderate reduction of 1–1.5 °C in mean daily temperatures together with the increased RH (relative humidity) from 50% to 70% during day time improved the pollen grain’s viability. Suggestions concerning more efficient controls on the fogging system considering those findings are discussed.

1. Introduction

Mean daily temperature plays an important role with regard to proper anther and pollen development and their function in tomato (Solanum lycopersicum L.) flowers. Studies that tested the relationship between mean daily temperatures and the reproductive stage of tomato plants, found that at daily mean temperatures of 29 °C, fruit number, percentage fruit set and fruit weight per plant decreases in comparison with those at 25 °C. This reduction in yield is mainly due to impaired pollen and anther development and reduced pollen viability [1,2]. Sensitivity of the reproductive stage of the flower to above optimal air temperature can cause a reduction in percentage fruit set and thus decrease the fruit yield during commercial tomato growth [3]. Another climatic factor that might influence pollen viability is relative humidity in the air. Pollen grains of different species exhibit diverse reactions to changes in relative humidity. For example, the viability of Cucurbita pepo pollen is extended under high RH conditions in comparison to low RH while Petunia hybrida pollen did not exhibit the same sensitivity to the change in RH [4]. Relative humidity between the range of 50%–70% is generally considered to be optimal for tomato pollination [5]. Trials that tested tomato pollen quality and fruit set at several air humidity levels found that increased humidity (60%–70% RH) improved pollen and fertilization in comparison with 30%–40% RH. [6]. However, increasing humidity to 90% may increase pollen susceptibility to heat stress [5].
Most of the data regarding the response of tomato fertilization and yield to heat stress and different rates of humidity, originates from trials that were conducted in controlled environments and growth chambers along relatively short time periods. Less is known about these variable’s influence on the tomato plant and yield under commercial growth conditions, where climatic variables are less stable and the growth period of the plants is long (5–12 months). In many cases tomato is planted under protected cultivation including regions where the summer is hot and arid. Insufficient ventilation inside the shelters during summer leads to above optimal air temperature and continuous moderate heat stress [7]. These conditions damage the fertilization process which leads to a reduction in fruit yield and in the grower’s profits.
One way to cope with sub optimal conditions during commercial growth is to use an inexpensive low pressure fogging system in the shelters during the hot season [8,9,10,11]. Operation of low pressure foggers during tomato growth under suboptimal conditions (high temperatures), succeeded in reducing the daily mean air temperature by 1–1.5 °C, which resulted in improved pollen viability and fruit set ratio [8]. Nevertheless, information is still limited concerning the efficient operation of these systems under commercial conditions.
In this study we used a low pressure fogging system during commercial tomato growth throughout the summers of 2012–2013 in order to evaluate its influence on fertilization and yield in comparison with an unfogged treatment. The data that was collected from this bi-annual field trial was analyzed with regard to the findings described in literature from trials conducted in controlled environments. In addition, suggestions concerning more efficient controls in the fogging system are discussed.

2. Results and Discussion

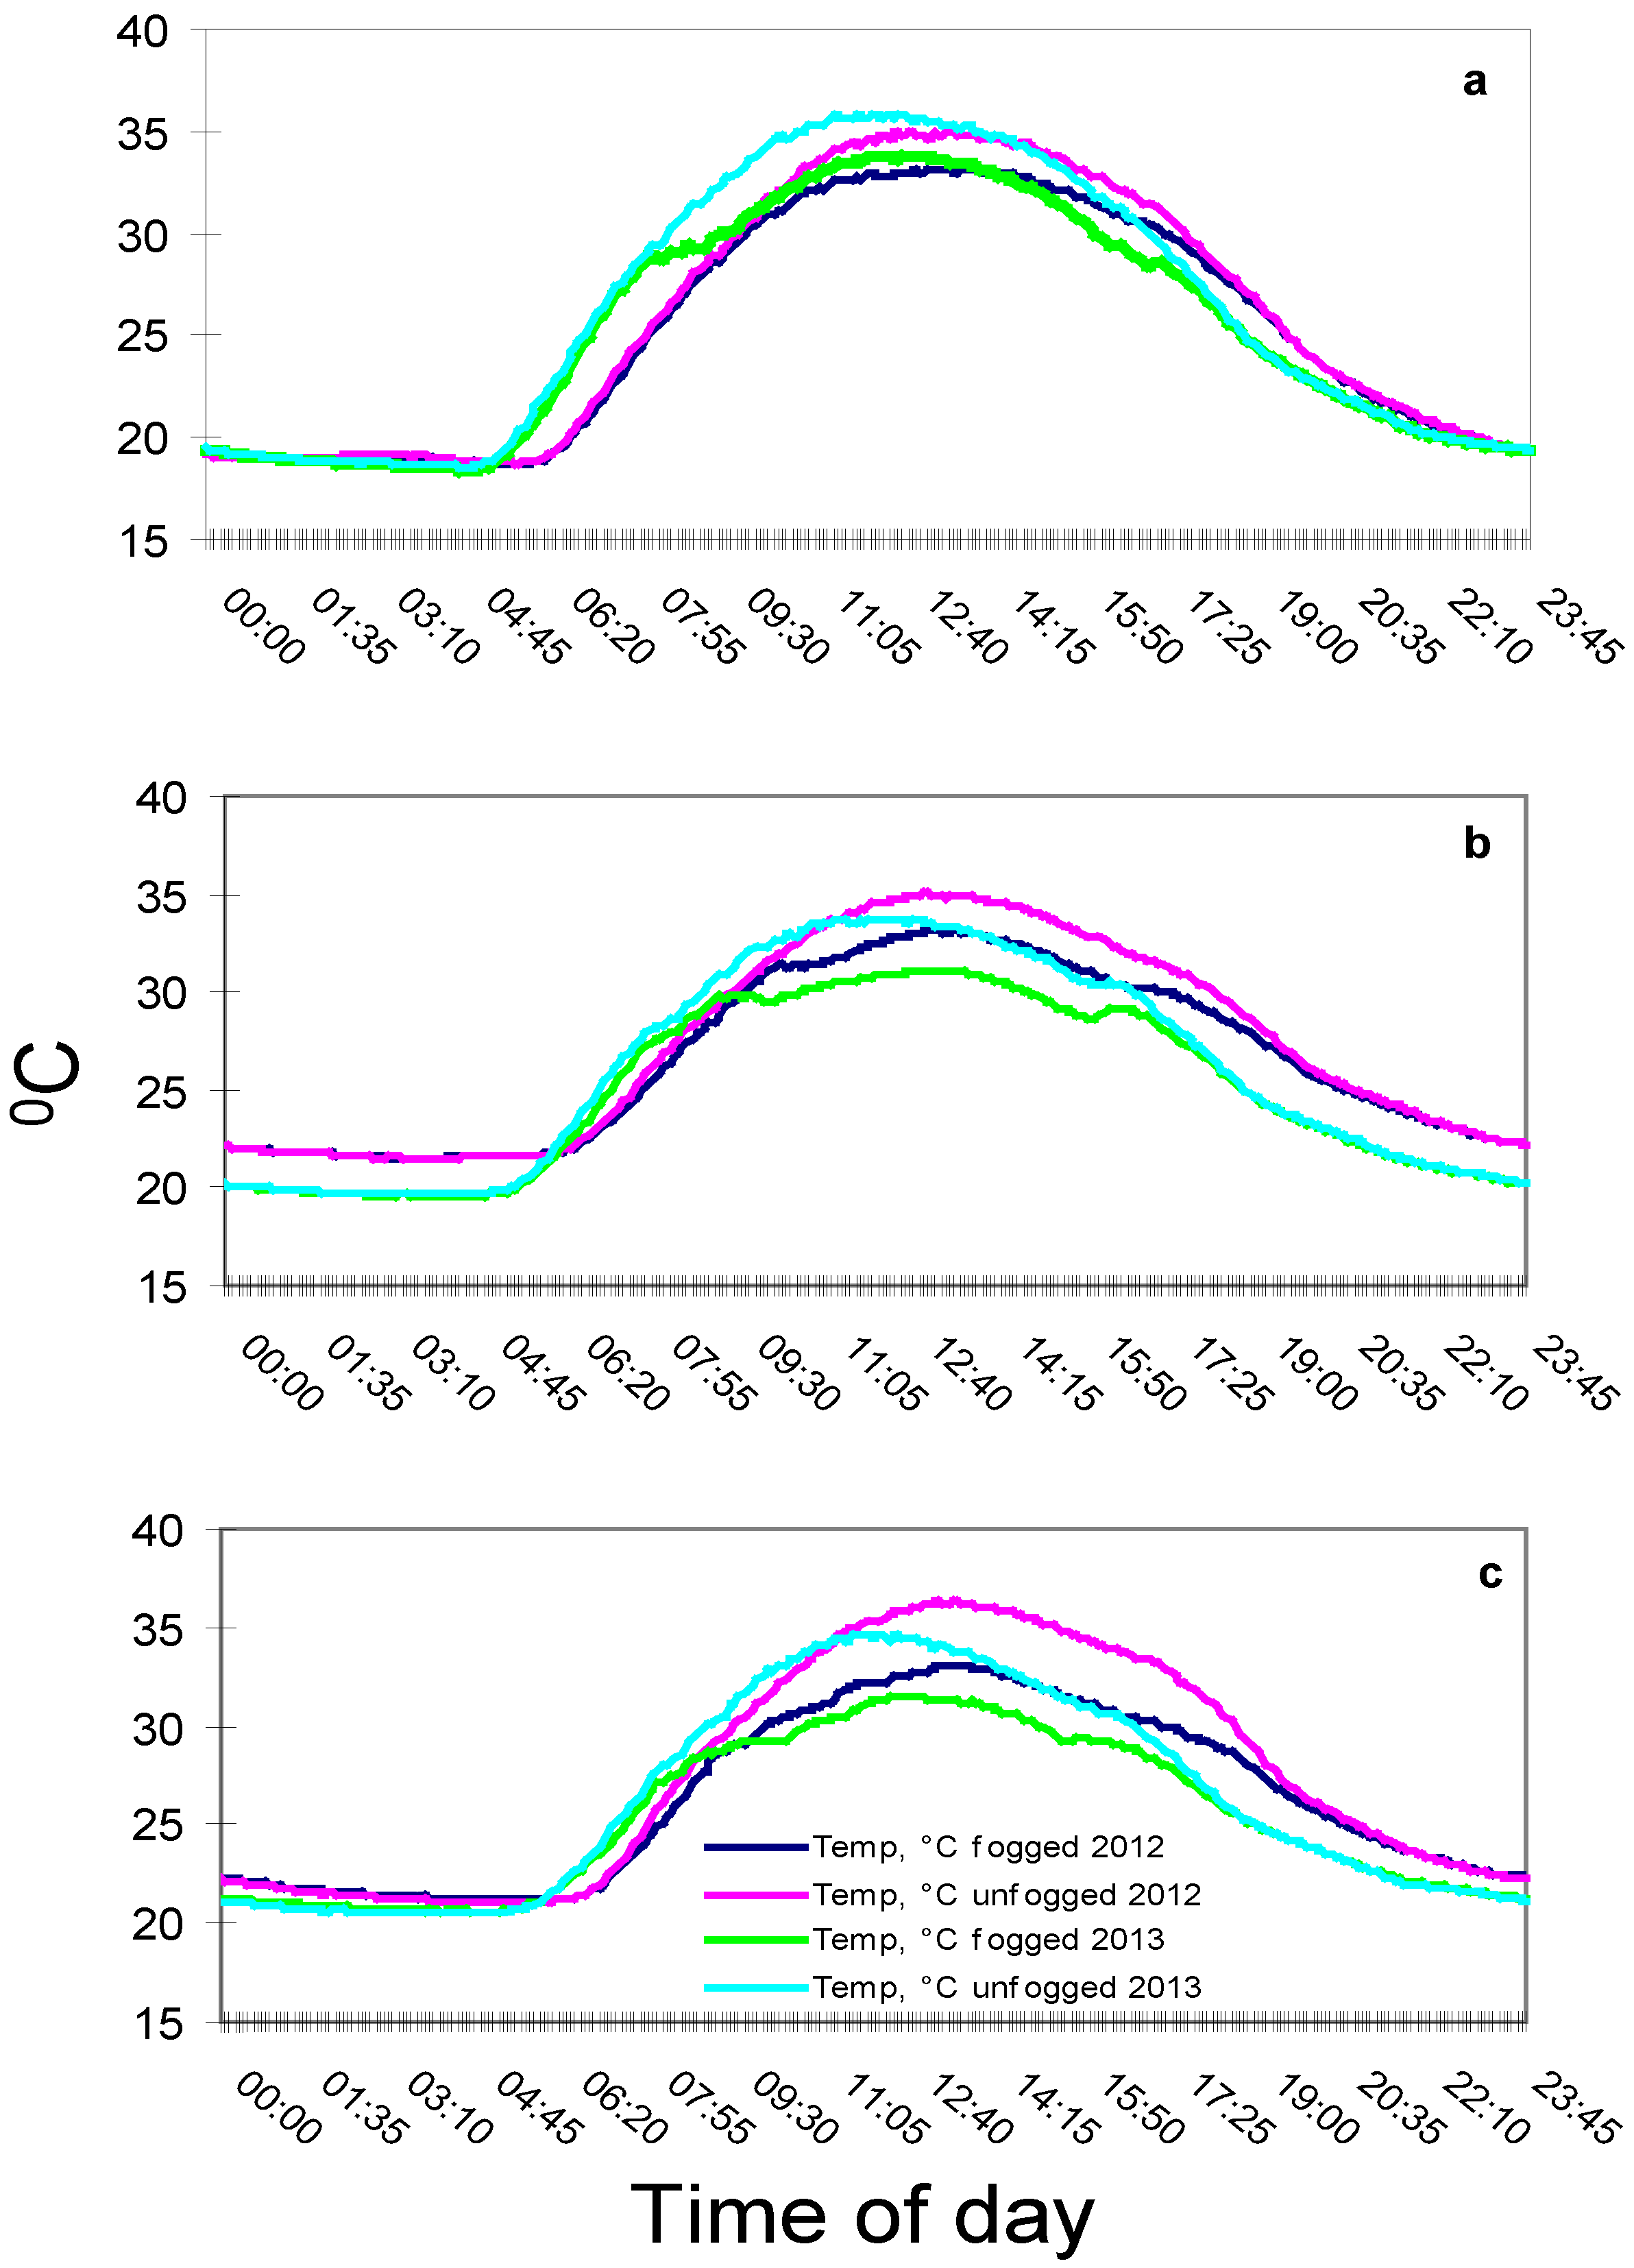
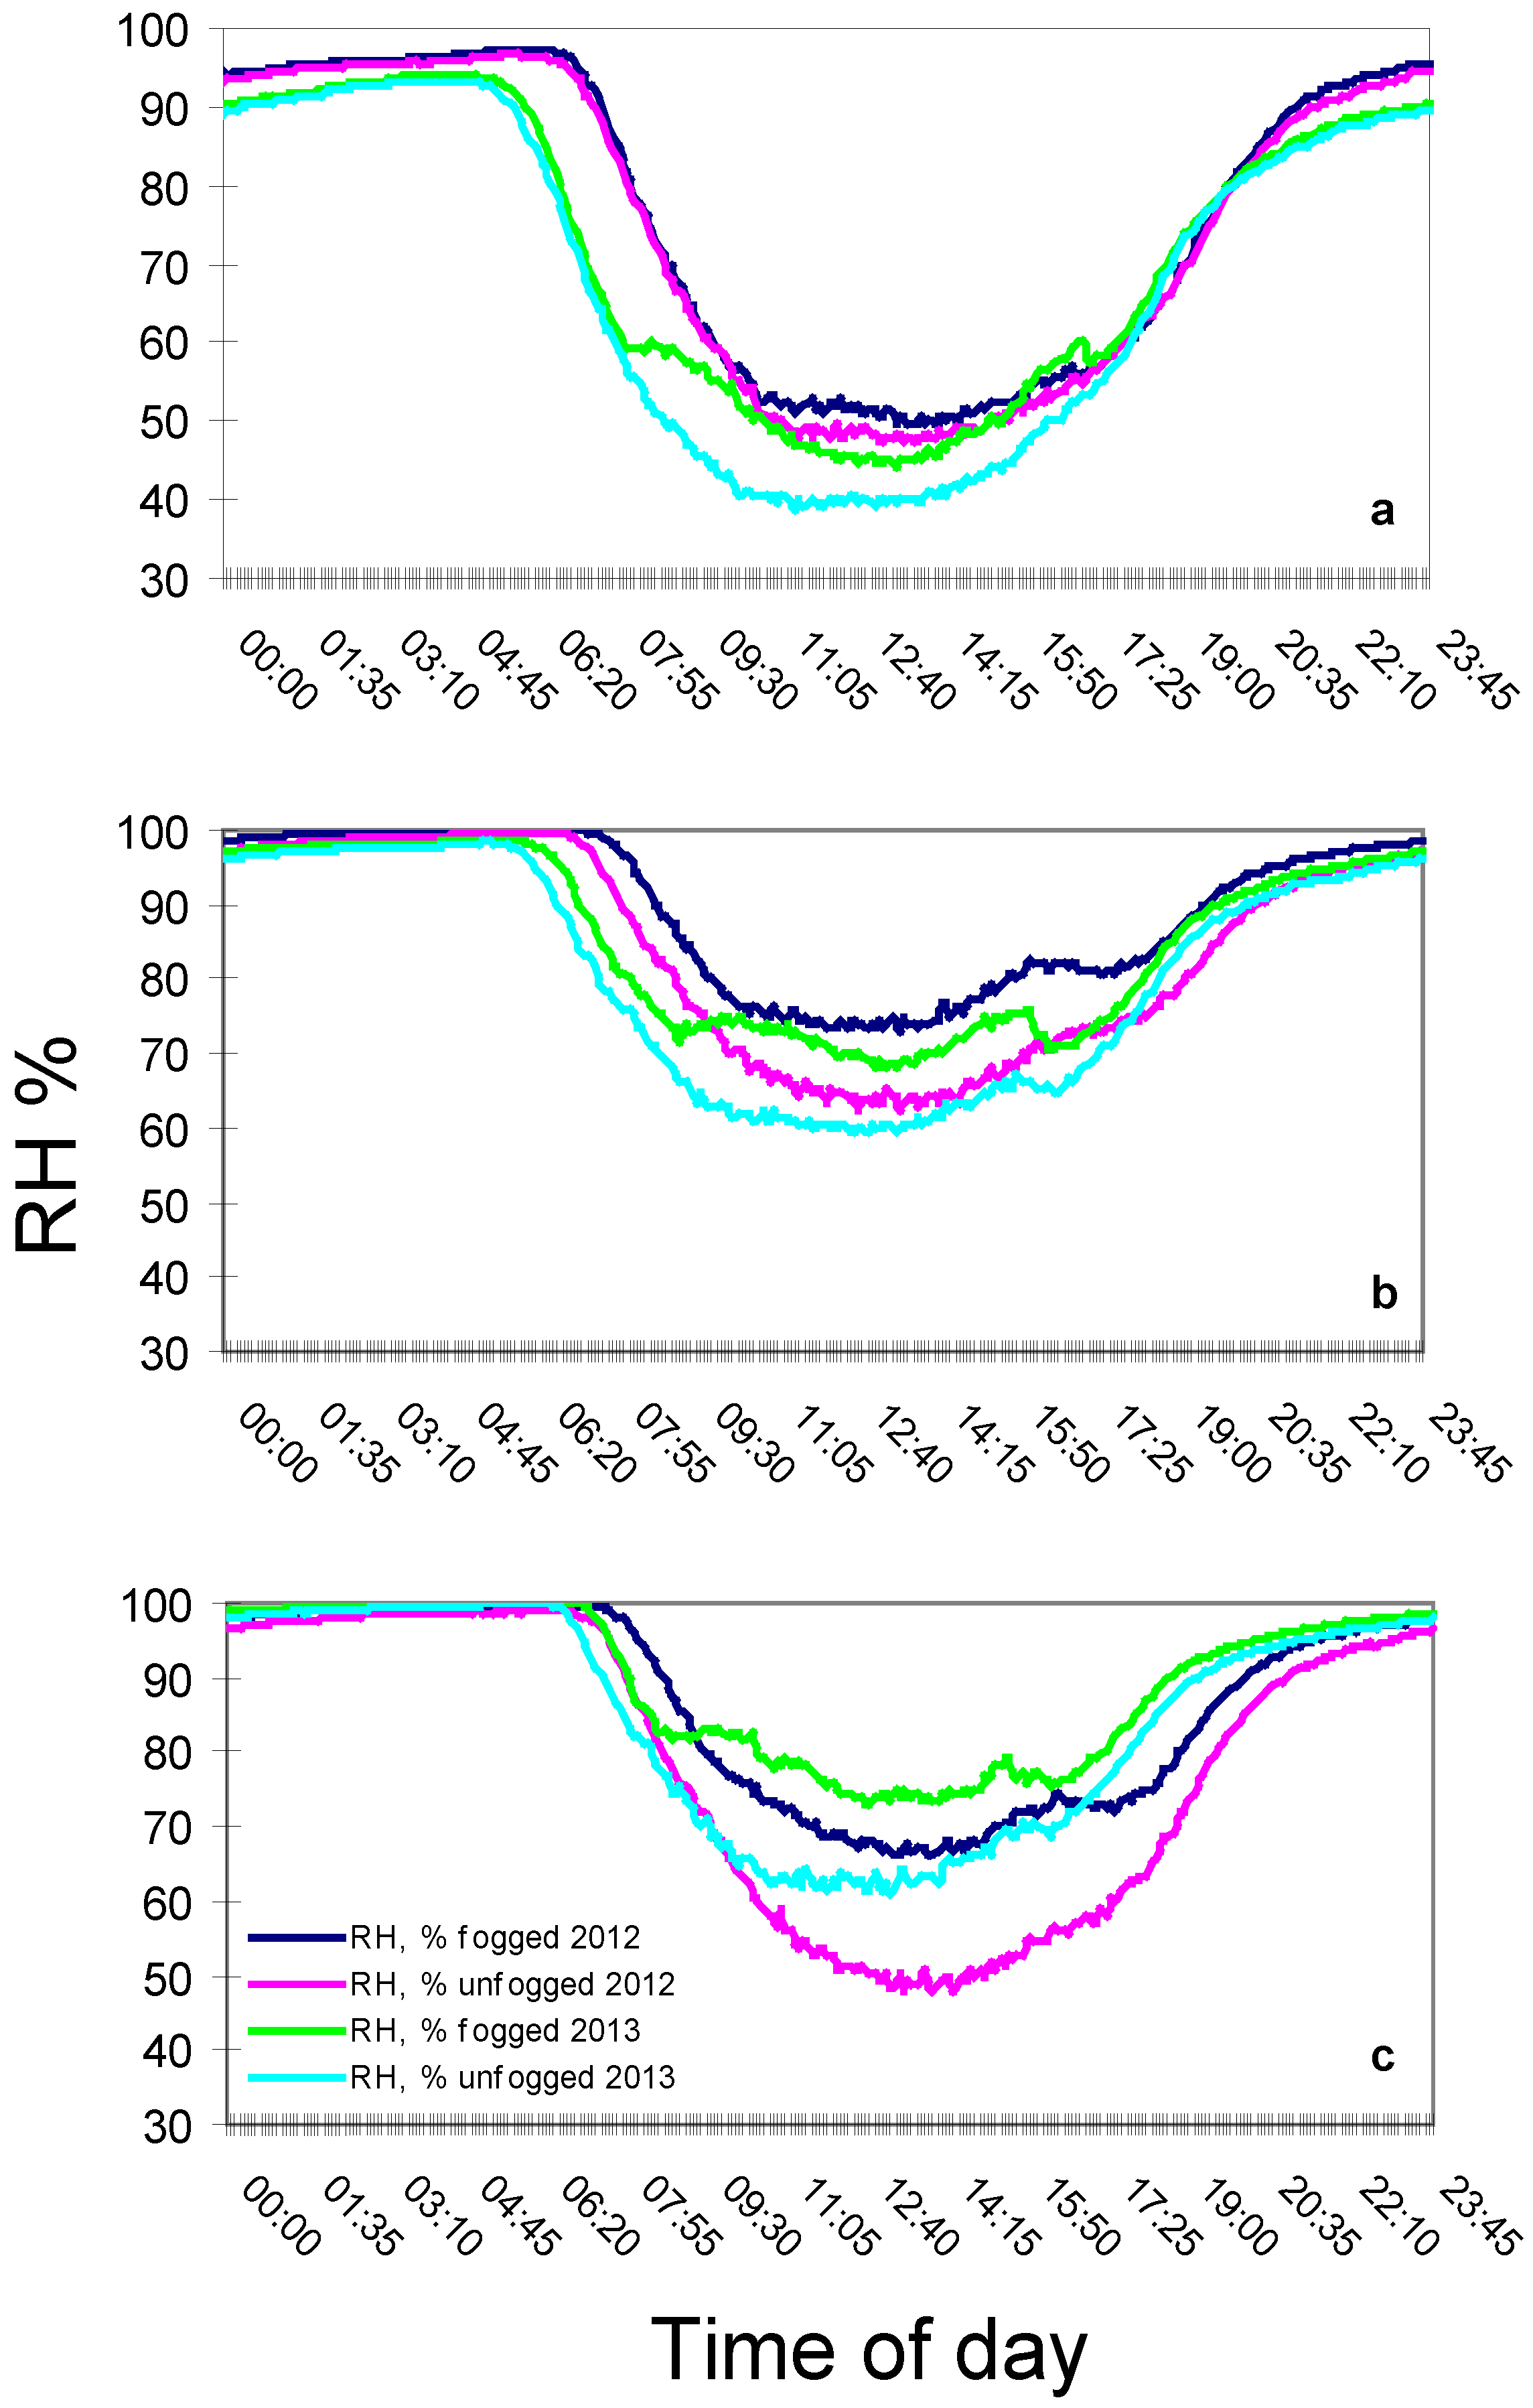
2.1. Daily Mean Air Temperature and Relative Humidity

Mean daily air temperatures plotted along a 24 h period axis in both treatments (fogged and unfogged) are presented in Figure 1. Each figure represents the mean values of one month during the summers of 2012 and 2013: (a) June (b) July and (c) August. Comparing day temperatures in both treatments shows a 2–4 °C reduction obtained by the fogging system during the measurement period. Night temperatures were identical along the whole period in both treatments.
Figure 1. Mean daily air temperature inside the net house in both treatments during the summer months of 2012 and 2013: (a) June (b) July and (c) August.
Agronomy 04 00167 g001
Figure 2 shows the mean daily air relative humidity plotted along a 24 h period axis in both treatments-fogged and unfogged in the years 2012 and 2013: (a) June (b) July and (c) August. Under fogging conditions, daytime relative humidity increased by about 10% in June and by about 30% in August in comparison with the unfogged plots (control treatments).
Figure 2. Mean daily relative air humidity (RH) inside the net house in both treatments during the summer months of 2012 and 2013: (a) June (b) July and (c) August.
Agronomy 04 00167 g002

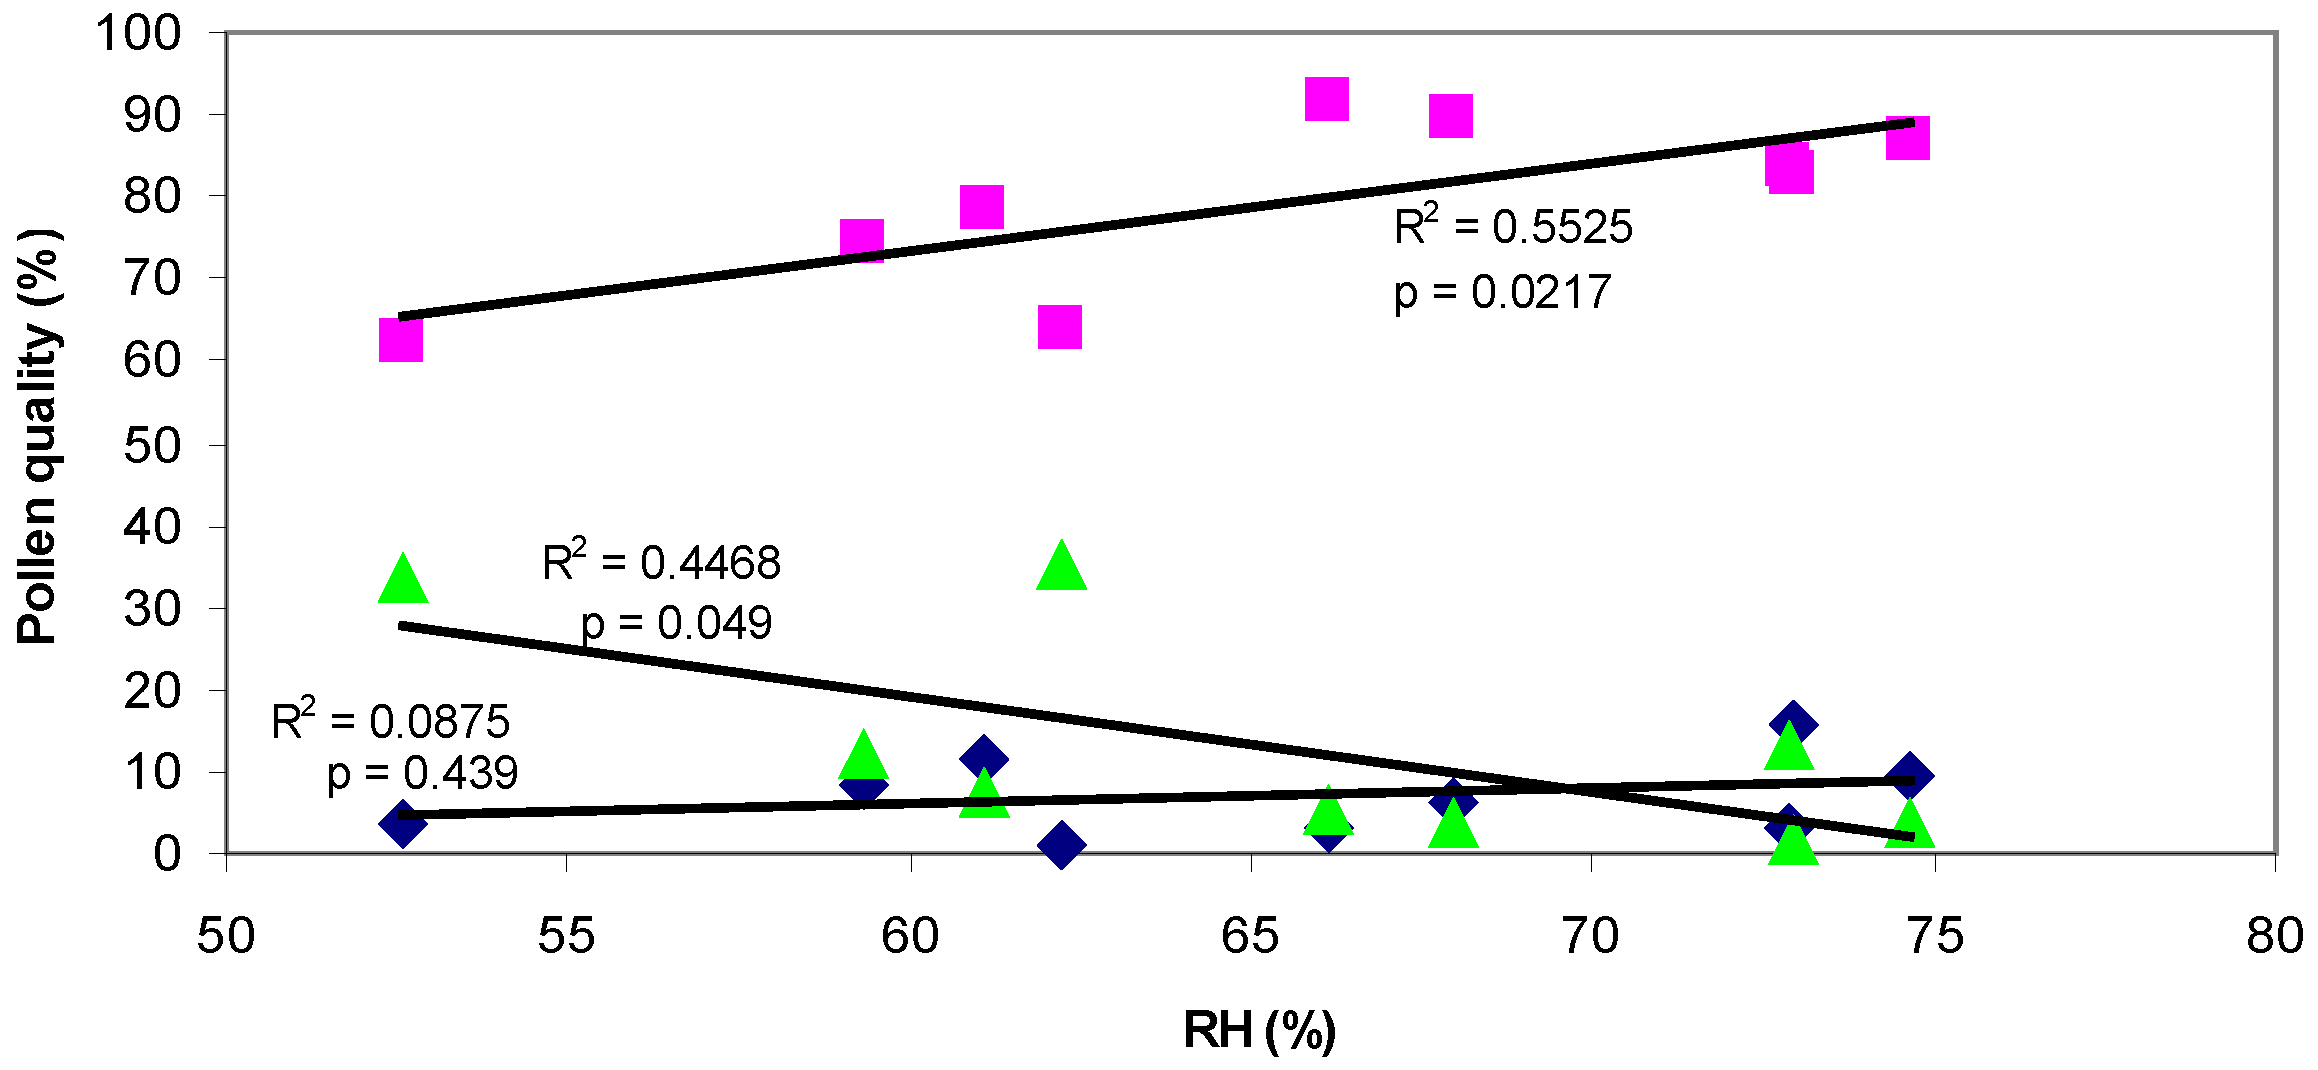
2.2. Pollen Quality in Relation to Mean Daily Temperatures and RH

Pollen grains in the collected samples were divided into three groups, germinated pollen (cells that had produced a pollen tube), viable pollen (live cells that could potentially germinate) and non viable pollen (dead cells). Pollen quality tests results are shown in Table 1. Under fogged cooling conditions pollen viability increased significantly in comparison with the unfogged plots in samples collected in July 2012 (t = 3.66; p = 0.0018), August 2012 (t = 4.6; p = 0.0002), September 2012 (t = 5.63; p = 0.0001) and July 2013 (t = 3.11; p = 0.0057). The fraction of the non viable pollen grains decreased under fogging conditions parallel with improved viability. In most cases the germination percentage of the pollen was not affected by the fogging treatment.
Table 1. Results of pollen quality tests: The pollen was collected from each treatment in five different sampling dates during the years 2012–2013. Different letters represent significant difference (t test, p > 0.05).
TreatmentSampling dateMean daily temp. (°C)Germinated (%)Viable (%)Non-viable (%)
UnfoggedJuly 201227.31.24 ± 0.963.68 ± 4.6a35.08 ± 4.5a
Fogged26.53.14 ± 1.483.65 ± 2.8b13.21 ± 3.1b
UnfoggedAugust 201227.55.47 ± 1.759.58 ± 6.8a34.95 ± 7.1a
Fogged26.33.12 ± 0.591.46 ± 1.5b5.42 ± 1.8b
UnfoggedSeptember 201226.33.79 ± 0.7a62.5 ± 4.3a33.71 ± 4.1a
Fogged25.29.33 ± 0.8b86.92 ± 1b3.75 ± 1b
UnfoggedJuly 201325.913.58 ± 3.474.33 ± 4.3a12.09 ± 2.3a
Fogged2512.84 ± 1.583.45 ± 1.9b3.71 ± 0.9b
UnfoggedAugust 201326.314.35 ± 3.478.33 ± 4.17.32 ± 1.9a
Fogged25.315.55 ± 2.382.7 ± 1.81.75 ± 0.6b
Pollen grain germinability and viability data from both treatments that were collected during July, August and September of 2012/2013 were linearly correlated to values of minimum relative humidity throughout the day time inside the net house during the pollen sampling period (Figure 3). Relative humidity values ranged between 52.5%–72.9% (Figure 3), with day time temperatures in the range of 30–33 °C. Those conditions represented vapor pressure deficits (VPD) ranging from 1.1 to 2.4 kPa during the day. Due to the structured attributes of field experiments it is difficult to unambiguously disconnect variables such as relative humidity and air temperature. In order to confirm the influence of RH on pollen grain properties, the relevant RH and air temperatures were correlated and the relationship was found to be not significant (F = 0.2144; p = 0.0721) regarding the data sets presented in Figure 3. This non significant relationship can be explained by considering the climatic conditions in the region were the trial was conducted. During the summer, air temperatures are more or less constant while air humidity content can vary drastically when humid air arrives from north-west (Mediterranean sea) or dry air coming from south-east (the Negev desert). The findings were that increased RH (from 50% to 75%) was found to be positively correlated to pollen viability but pollen germinability was not affected.
Figure 3. Correlation between pollen germination (blue diamonds), pollen viability (pink squares), non-viable pollen (green triangles) and minimum relative humidity during day time inside the net house. Statistical analysis results (F test) and regression coefficient of the first order regression equation for each data set are presented in the figure.
Agronomy 04 00167 g003

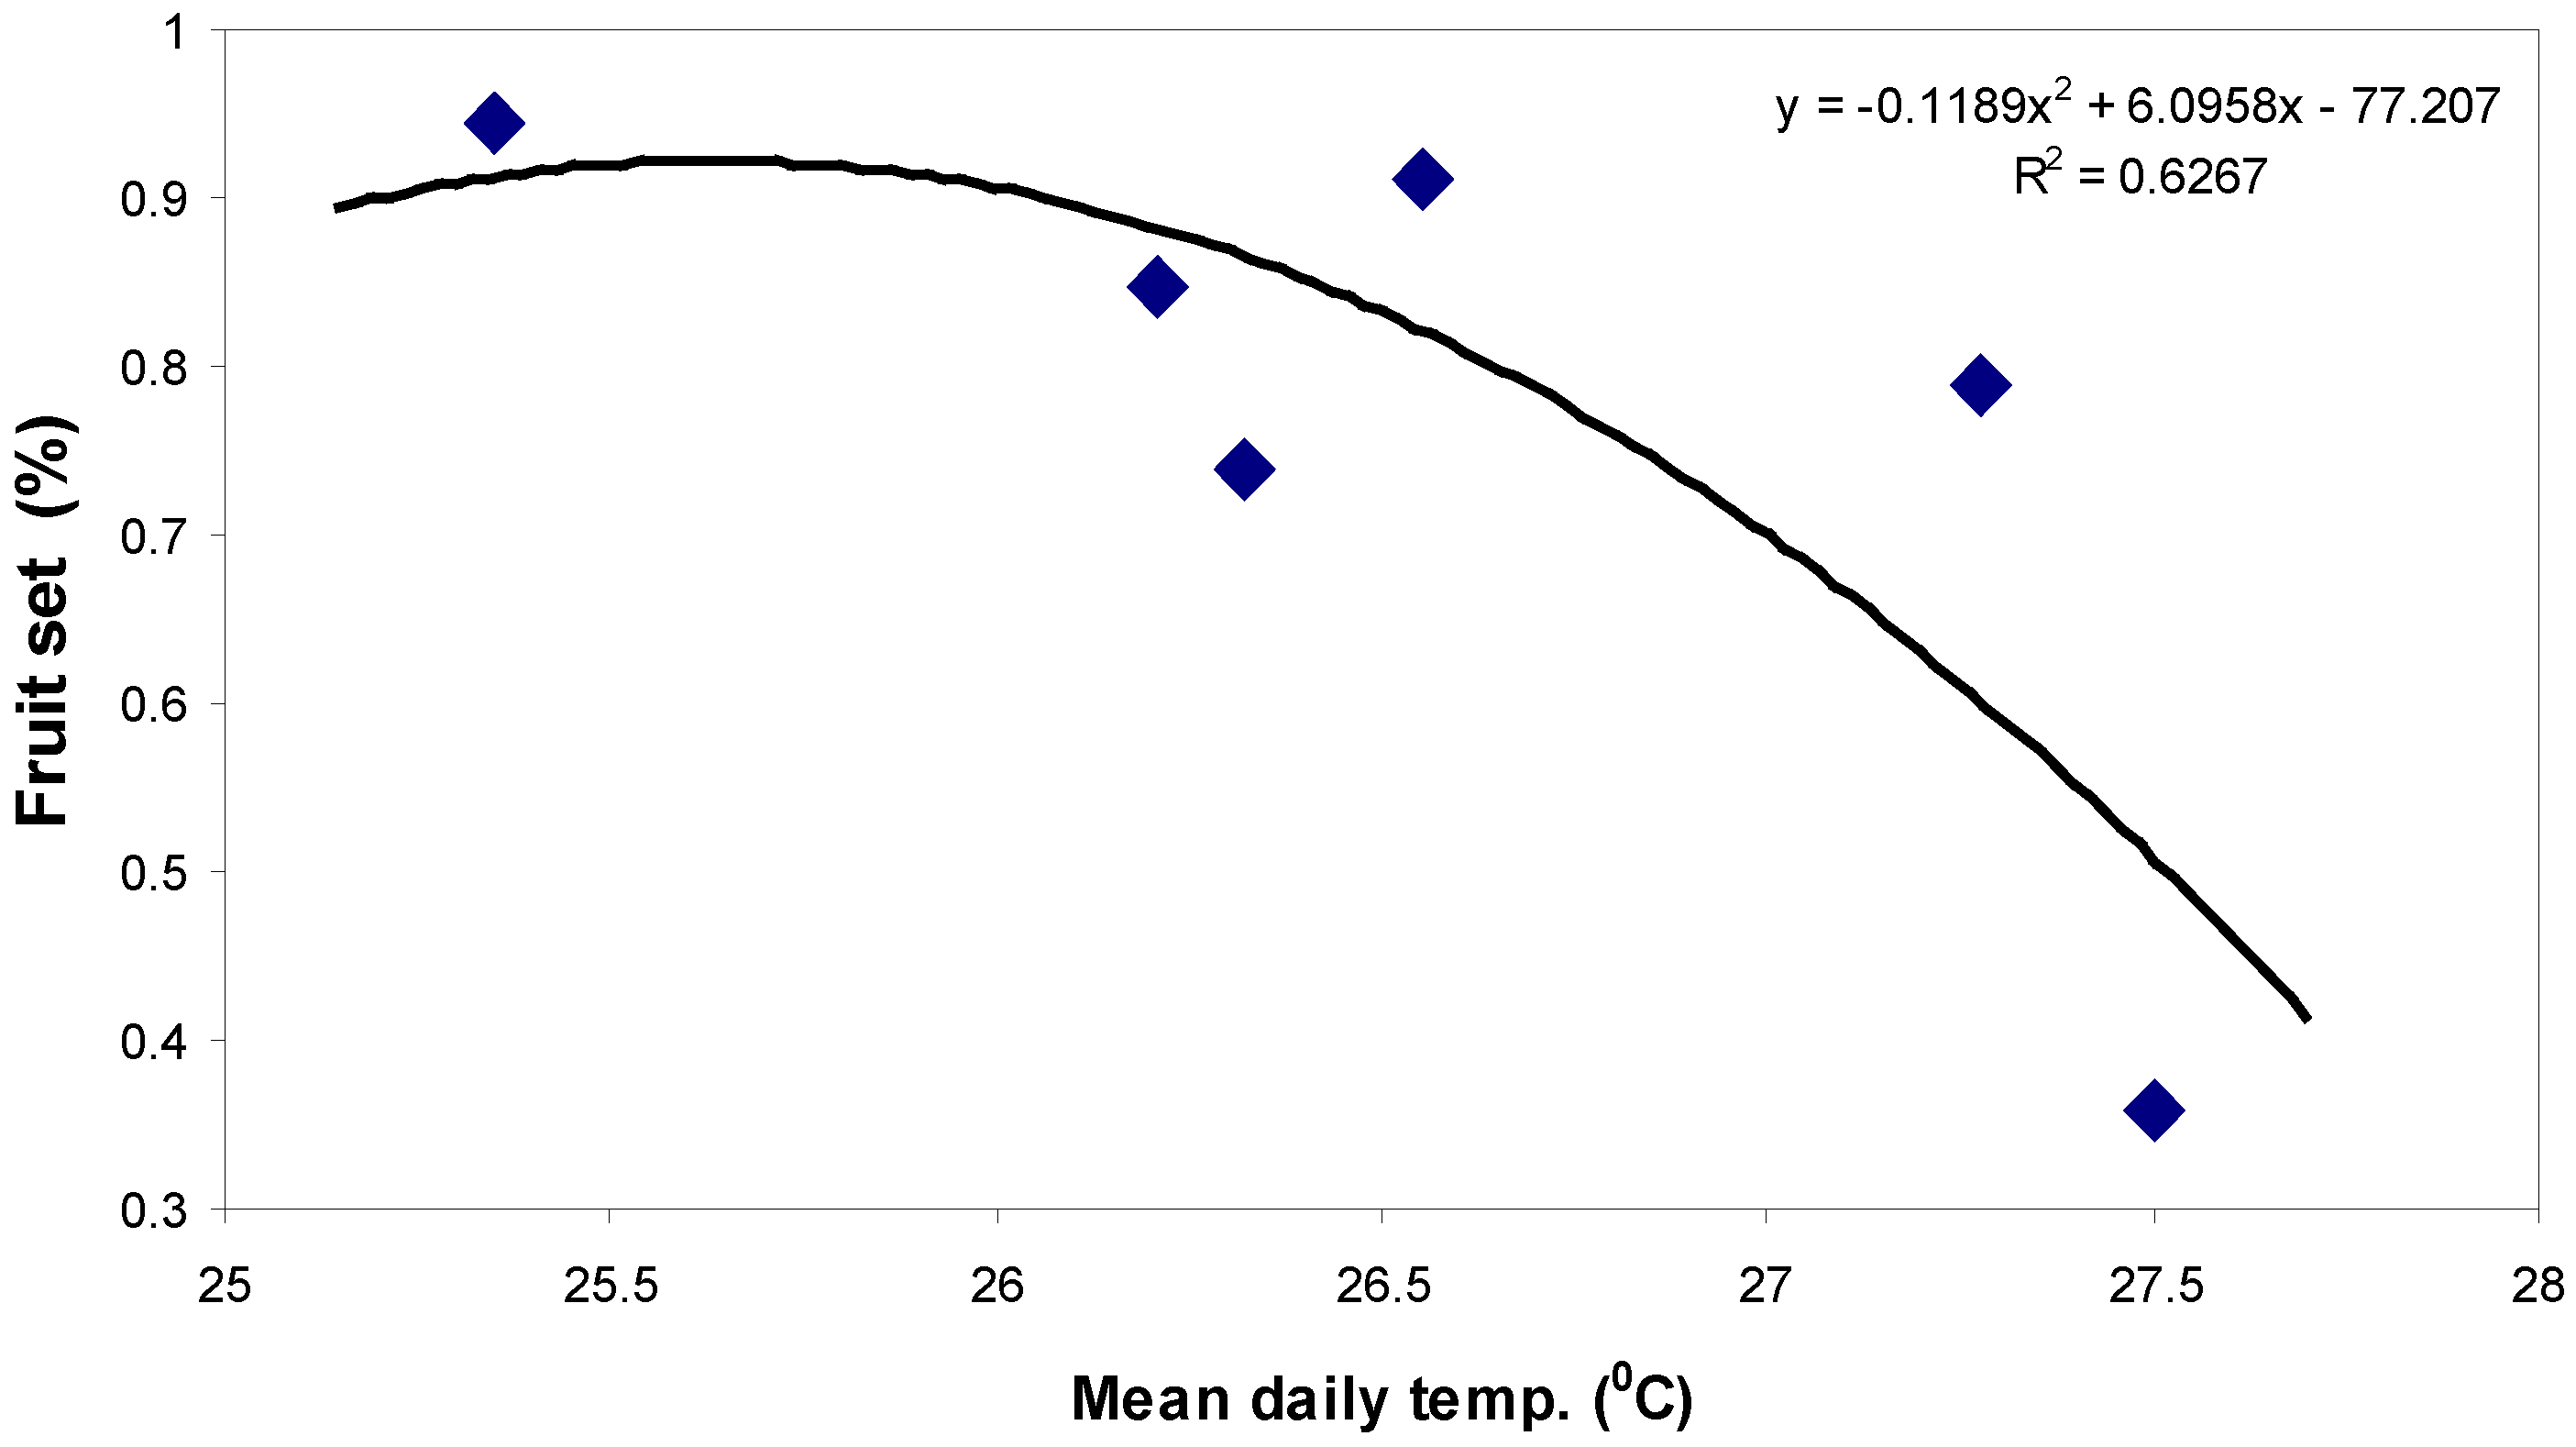
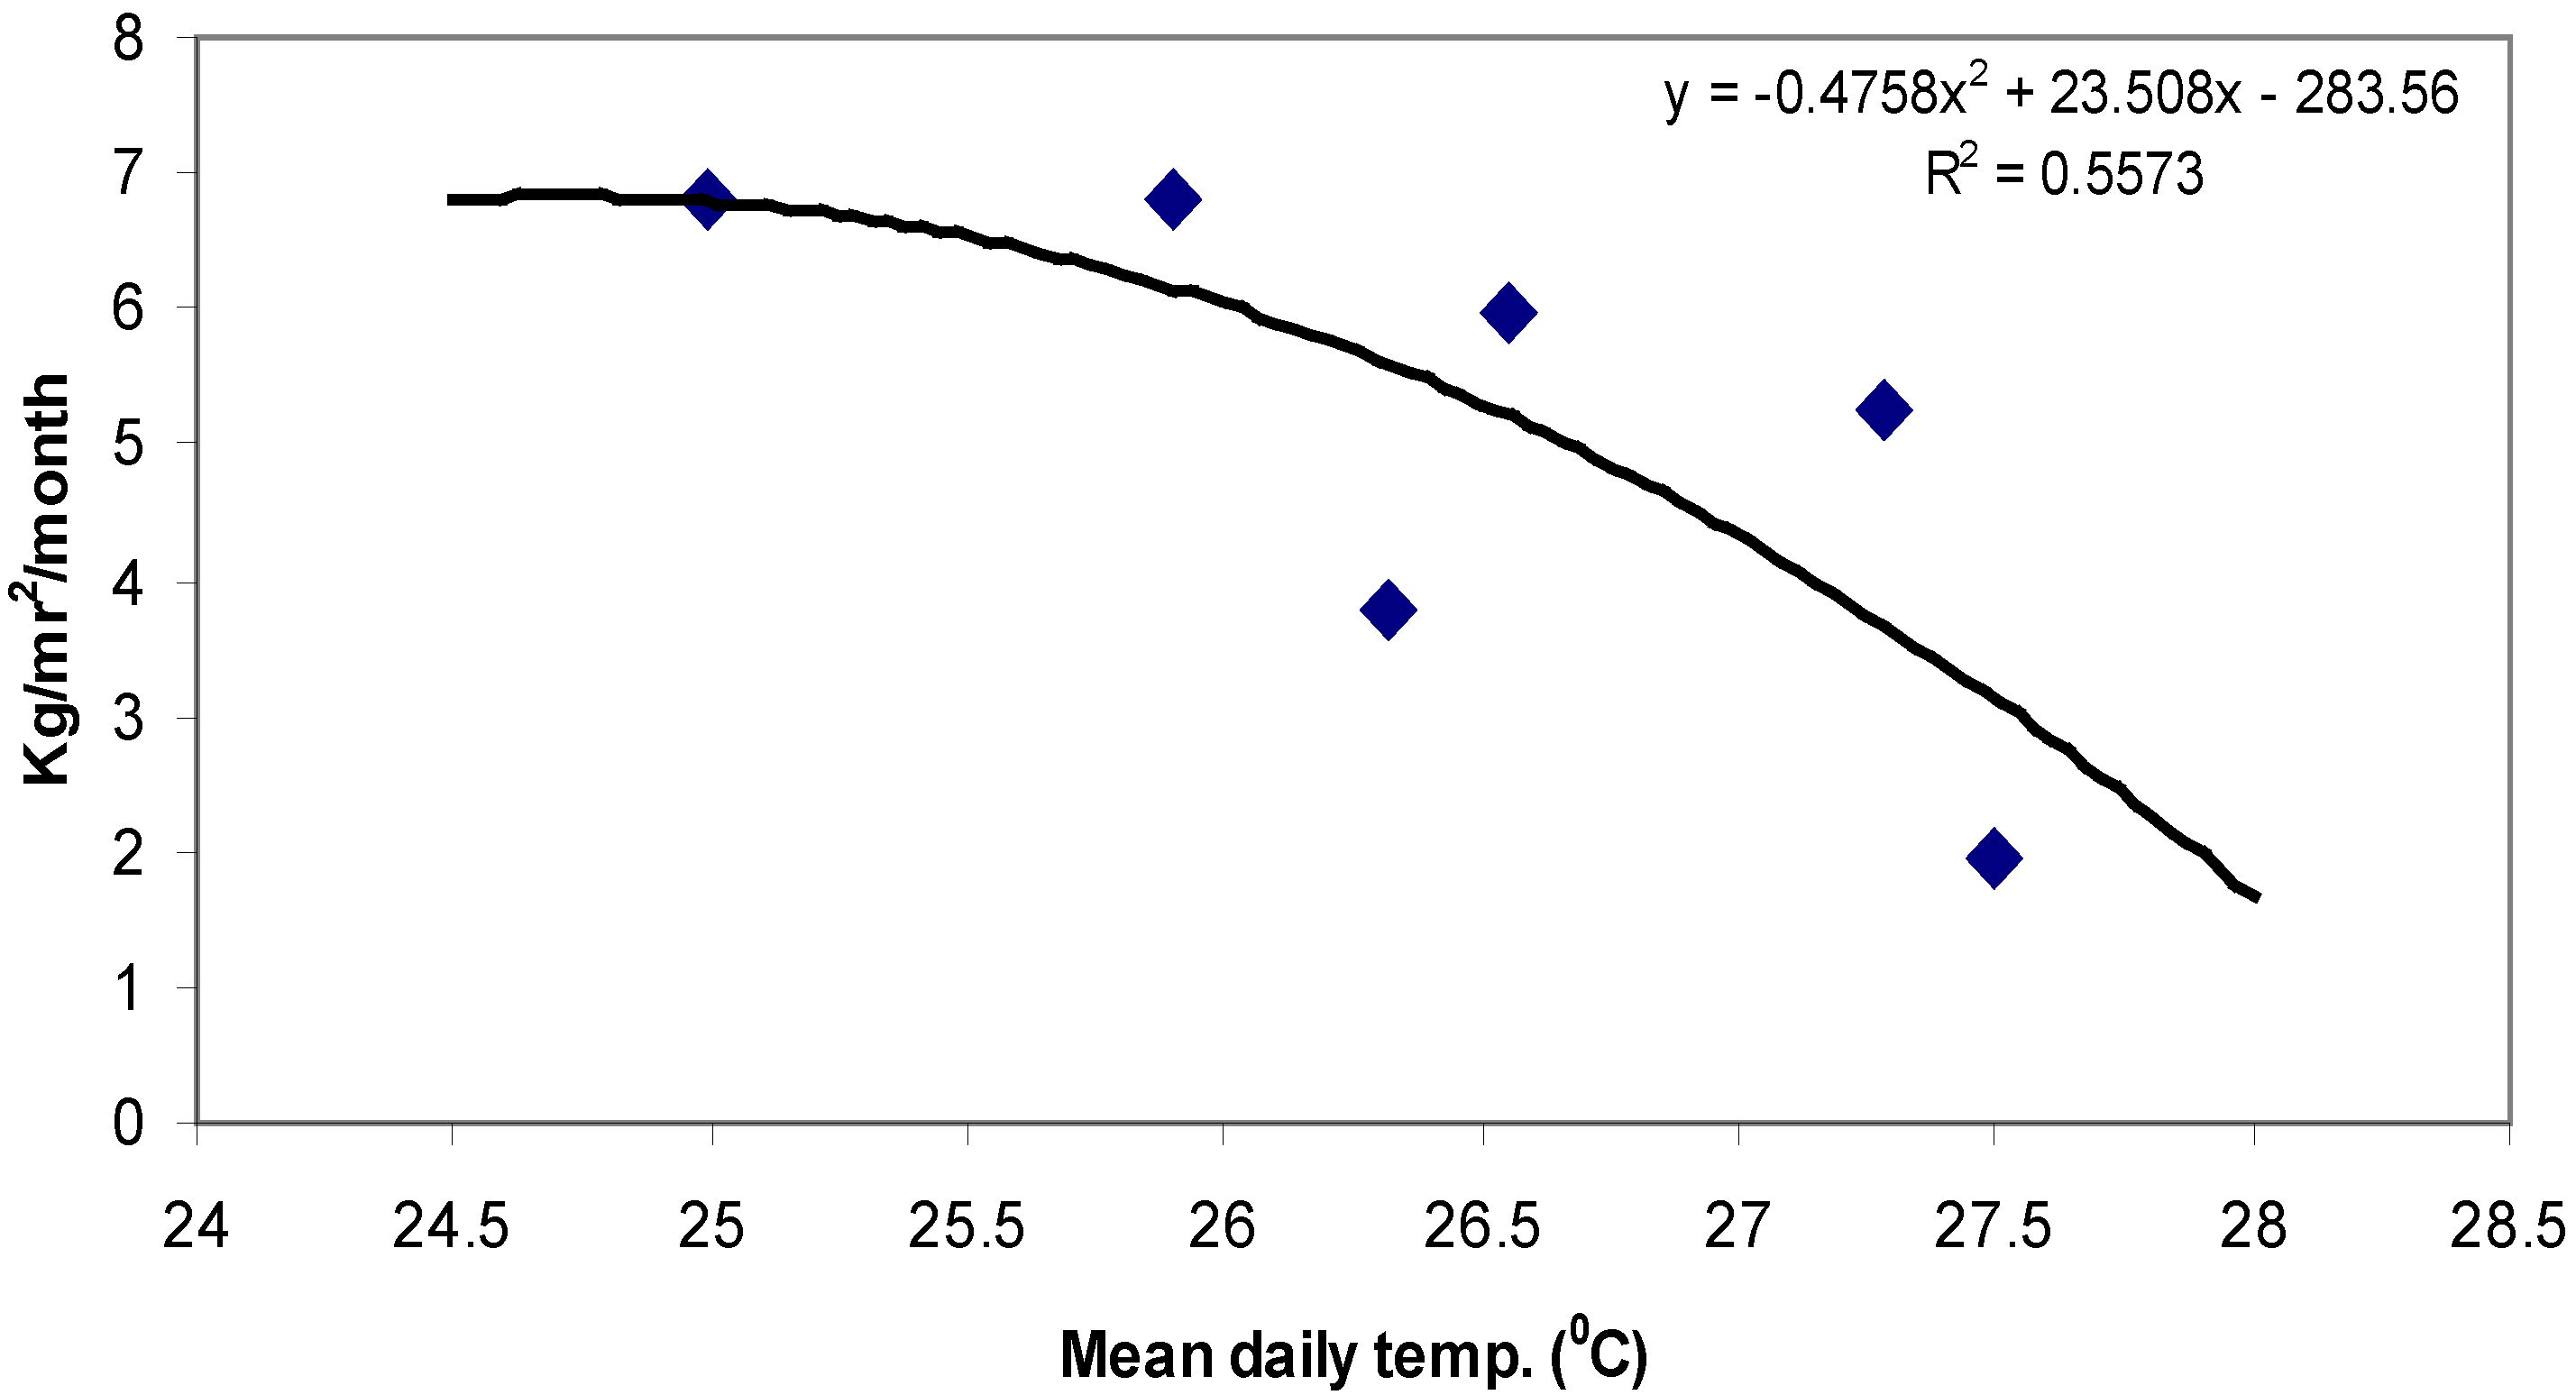
2.3. Fruit Set and Fruit Yield in Relation to Mean Daily Air Temperature

Figure 4 shows the percentage of flowers that turned into fruit. The data presented in this figure consists of the fruit set and mean daily temperatures data that was collected from both treatments during the 2012 and 2013 growth seasons and were combined into one continuous data set. The sampled flowers were marked and monitored until fruition, a process that lasted two weeks. The ratio of flowers to fruit was calculated and the percentage value plotted against the average temperature at the time of fruit set.
Figure 4. Relationship between mean daily air temperature and fruit set percentage. A second order equation that describes the relationship and regression coefficient is presented in the figure.
Agronomy 04 00167 g004
The fruit set is at its peak >90% at 25 °C. At 26 °C the fruit set rate ranges between 70% and 90% but at 27.5% the fruit set rate drops to 50%. This would suggest that temperatures of 2.5 °C above the optimal mean daily temperature reduce the ability of the plant to reach its potential fruit set by up to 40%.
Figure 5 shows the amount of fruit as the number of kilos that were picked per square Meter per month. As in the previous figure the data presented in Figure 5 is composed of data collected from both treatments during the 2012 and 2013 growth seasons. Each point represent total yield from flowers that were pollinated during July and August of 2012 and 2013, in both treatments-fogged and unfogged. This number was plotted against the average daily temperature of the summer months when pollination occurs, in order to evaluate its affect on the yield of that period. At 25 °C, the tomato yield is at its peak at 7 kg/m2/month and remains there until temperatures exceed 26.5 °C when they drop to 5 kg/m2/month. This diminishing yield mirrors the 40% fruit set reduction in Figure 4.
Figure 5. Relationship between mean daily air temperature and monthly fruit yield in kg/m2. A second order equation that describes the relationship and regression coefficient is presented in the figure.
Agronomy 04 00167 g005

2.4. Discussion

Mean daily temperatures of 25–26 °C were found to be the upper limit for proper fruit set and fruit yield for tomatoes grown in protected cultivation during the hot Mediterranean summer period (June–August). These findings concur with the conclusions from previous works that investigated the same topic. [1,2]. In most cases the data for these research projects was collected from tomato plants that were grown in a controlled environment where the ratio of day to night temperatures is more or less constant. Eventhough this field trial calculated the value of the mean daily temperatures from the daily amplitude of the air temperature inside the growth shelter, the effect on the reproductive stages of the flowers was similar to the findings in the controlled environment trials mentioned above.
With regard to the operation of low pressure foggers during tomato production under suboptimal conditions (high temperatures), the findings from the 2013 summer were similar to those of the summer of 2012 reported in Harel et al. [8]. In that year, air temperature also decreased during the day time by 2–3 °C in comparison with the unfogged treatment and the RH increased by 10%–30%. This moderate reduction in heat stress together with the elevated RH improved the pollen grain’s viability. This improvement in tomato pollen quality under reduced heat stress and elevated RH is compatible with previous findings [1,5,12]. With regard to the conclusions of this study that in field conditions, even relatively small increases of 2 °C in the mean daily temperature can cause a yield reduction of up to 60% should be acknowledged, taking into consideration the global warming process. It is generally accepted that a modest climate change of around a 2 °C global mean temperature rise is inevitable [13]. This prediction emphasizes the need for efficient and technologically proven horticultural practices in order to adapt to climate change which with its imminent increase in extreme heat stress conditions, especially in hot regions such as the Mediterranean.
The importance of the data presented here is in its applicative aspects for tomato growers in regions where tomatoes are grown in protected cultivation during hot seasons which often causes sub optimal conditions inside the shelter (i.e., moderate continuous heat stress). There are several ways to try and improve those sub optimal conditions in commercial tomato growing systems. One way is to use an inexpensive low pressure fogging system within the shelters during the hot season as described in this article. There are a number of parameters that can be used for the control algorithm of the fogging systems. Li and Willtis [10] described an algorithm based on a combination of maximum RH or VPD and minimum radiation intensity while Meca et al. [9] used only the VPD value for the system set point operation. Although VPD, RH and radiation are important parameters with regard to vegetative growth, photosynthetic efficiency and fruit development, optimal air temperature appears to be the key factor that limits proper pollen development and fruit set in tomato growth. This is the reason why we used air temperatures measured inside the shelter within the plant canopy in order to determine an operation threshold for the fogging system based on previous knowledge about desirable temperatures [1,2,3,8]. In most trials including this one, set points for the cooling system are determined and fixed into the control system at the beginning of the growing season. In many cases these levels stay fixed until the end of the cooling operation which matches the end of the hot summer season. This fixed cooling threshold may reduce the efficiency of the system as there are peaks and troughs in the daily temperature during the growth period. We propose that a daily adjustable threshold value for the fogging control system will be calculated by basing the mean daily temperature of 26 °C as the optimal target condition, for achieving the most efficient operation of the system in commercial tomato growth. Based on the findings in this bi-annual trail we recommend this flexible method of controlling protected tomato cultivation in order to enhance pollen viability and fruit yield. The proper daily set point temperature can be calculated when the mean (or minimum) night temperature of previous night is known. Of course, in parallel to this temperature set point, a maximum RH value (>90% for example) should be fixed into the control system. This kind of calculation can be implemented into relatively low cost Programmable Logic Controllers (PLC) that operate the fogging system (or any other cooling system) in a more accurate and efficient manner resulting in a reduction of water amounts sprayed by the fogging system into the growth shelter.

3. Experimental Section

3.1. Plant Cultivation

The experiment was conducted at the Negev R & D Center located in the southern part of the Israeli coastal plain (34°23′ N, 31°16′ E, 104 m above sea level). The climate in the region is Mediterranean with rainy winters (October–April) and prolonged dry hot summers. Four weeks old transplants of round tomato (cv 1125) were hand-transplanted into the sandy loam soil beds. Planting stand was 2.2 plants/m2. Drip irrigation with complete chemical fertilizers in the irrigation water (fertigation) was used during the growth. Two weeks after transplanting plants were trained following the high-wire system with the wire at 2.5 m. The 2012 season starts on 15 May 2012. Fruit picking started on 21 July 2012, 65 days after planting (DAP) and ended on 11 November 2012. The second season during 2013 was planted on 26 May 2013 and ended on 2 November 2013. The time between the fruit set and fruit picking was approximately 40–45 days in both seasons.

3.2. Net House, Fogging System and Climate Data Collection

Technical details of experiment are as described in Harel et al. [8]. In brief, a naturally ventilated, north/south oriented net-house with a gutter height of 4m, a ridge height of 4.5 m and a double slope roof was used. The net house was covered (roof and walls) with 50 mesh insect proof net. A commercially available low pressure fogging system (NaanDanJain, Naan, Israel) was installed in the net house on a 700 m2 area. The system consisted of nozzles (Super fogger 13 L/h, NaanDanJain, Naan, Israel) with average droplets sizes of 60–70 μm configured in rows. The nozzle rows were stabilized by the net house steel framework 3.5 m from the ground. A water reservoir and a booster pump maintained the line pressure at 405 kPa. Anti drip devices at every nozzle prevented dripping once the line pressure dropped below 253 kPa. A simple automatic control (Dan Fogger controller, Talgil, Israel) controlled the system operation through one solenoid valve. The control was set to operate the fogging system when the air temperature inside the net house at the plant canopy height rose above the threshold of 30 °C during the first season and 32 °C during the second season. The system operation was stopped when air temperature reached 28 °C. Fog intervals were set by trial and error to minimize excessive wetting while trying to maximize the cooling effect. After several attempts, a fog interval was set at 5 s with 20 s break between the intervals during the 2012 season and 3 s with 12 s break between the intervals during the 2013 season.
Un-fogged (control treatment) plots were grown in a separated 700 m2 area net house under identical conditions apart from the absence of fogging system.
The temperatures and relative humidity (RH) inside the net house within or just above the plant canopy (1.5 m from ground) were monitored with Hobo ZW-003 RH/Temp data loggers (Onset Computer Corporation, Bourne, MA, USA). The sensors were shielded in order to avoid direct sun light.

3.3. Mature Pollen Quality

Mature pollen was extracted, stained and counted according to Pressman et al. [14] 10 flowers at the first day of anthesis were collected from both treatments. One anther was removed from each flower and placed in a microfuge tube containing 0.5 mL of germinating solution that contained 100 g L−1 sucrose, 2 mM boric acid, 2 mM calcium nitrate, 2 mM magnesium sulfate and 1 mM potassium nitrate. Pollen grains were released from the anthers by shaking the tubes well. Tubes were then placed in an incubator at 20 °C for 4 h, after which a drop of Alexander dye [15] was added to the solution. Numbers of germinated, non germinated but viable (stained purple), and non viable (stained green) pollen grains were recorded for each flower. The procedure was repeated five times during growth seasons, and average results were calculated.

3.4. Data Analysis

Student’s t test was used to determined Statistical significance differences between the fogged and unfogged treatments in pollen grain quality. Fisher F-test was used to determined Statistical significance differences of the regression analysis. The analyses were conducted using the statistical package JMP 8 (SAS Institute Inc., Cary, NC, USA).

4. Conclusions

It can be concluded that in the hot Mediterranean summer months, the mean daily (day/night) temperature of up to 26 °C and 70 RH% during day time should be achieved when using evaporative cooling such as low pressure fogging systems in shelters. Pollen quality and fruit sets benefit under such growing conditions, which in turn increases the yield of tomatoes.

Acknowledgments

The authors would wish to thank the vegetable committee of Israel for their financial support and to NaanDanJain for their technical support.

Conflicts of Interest

The authors declare no conflict of interest.

References

  1. Sato, S.; Peet, M.M.; Thomas, J.F. Determining critical pre-and post-anthesis periods and physiological processes in Lycopersicon esculentum Mill. exposed to moderately elevated temperatures. J. Exp. Bot. 2002, 53, 1187–1195. [Google Scholar]
  2. Sato, S.; Kamiyama, M.; Iwata, T.; Makita, N.; Furukawa, H.; Ikeda, H. Moderate increase of mean daily temperature adversely affects fruit set of Lycopersicon esculentum by disrupting specific physiological processes in male reproductive development. Ann. Bot. 2006, 97, 731–738. [Google Scholar] [CrossRef]
  3. Pressman, E.; Peet, M.M.; Pharr, D.M. The effect of heat stress on tomato pollen characteristics is associated with changes in carbohydrate concentration in the developing anthers. Ann. Bot. 2002, 90, 631–636. [Google Scholar] [CrossRef]
  4. Nepi, M.; Cresti, L.; Guarnieri, M.; Pacini, E. Effect of relative humidity on water content, viability and carbohydrate profile of Petunia hybrida and Cucurbita pepo pollen. Plant Syst. Evol. 2010, 284, 57–64. [Google Scholar] [CrossRef]
  5. Peet, M.; Sato, S.; Clément, C.; Pressman, E. Heat stress increases sensitivity of pollen, fruit and seed production in tomatoes (Lycopersicon esculentum Mill.) to non-optimal vapor pressure deficits. Int. Hortic. Congr.: Environ. Stress Hortic. Crop. 2002, 618, 209–215. [Google Scholar]
  6. Huang, Y.; Li, Y.; Wen, X. The effect of relative humidity on pollen vigor and fruit setting rate of greenhouse tomato under high temperature condition. Acta Agric. Boreali-Occident. Sin. 2011, 11, 1–20. [Google Scholar]
  7. Baille, A. Overview of greenhouse climate control in the mediterranean regions. Cahiers Op. 1999. Available online: http://om.ciheam.org/om/pdf/c31/CI020831.pdf (accessed on 26 February 2014).
  8. Harel, D.; Fadida, H.; Gantz, S.; Shilo, K.; Yasuor, H. Evaluation of low pressure fogging system for improving crop yield of tomato (Lycopersicon esculentum Mill.): Grown under heat stress conditions. Agronomy 2013, 3, 497–507. [Google Scholar] [CrossRef]
  9. Meca, D.; López, J.C.; Gázquez, J.C.; Baeza, E.; Pérez Parra, J.; Zaragoza, G. Comparison of three different cooling systems in parral type greenhouses in Almería. Span. J. Agric. Res. 2007, 5, 285–292. [Google Scholar] [CrossRef]
  10. Li, S.; Willits, D.H. Comparing low-pressure and high-pressure fogging systems in naturally ventilated greenhouses. Bios. Eng. 2008, 101, 69–77. [Google Scholar] [CrossRef]
  11. Li, S.; Willits, D.H.; Yunker, C.A. Experimental Study of Low Pressure Fogging System in Naturally Ventilated Greenhouses; American Society of Agricultural and Biological Engineers: St. Joseph, MI, USA, 2005. [Google Scholar]
  12. Peet, M.M.; Willits, D.H.; Gardner, R. Response of development and post-pollen production processes in sterile tomatoes to chronic sub-acute high temperature stress. J. Exp. Bot. 1997, 48, 101–111. [Google Scholar] [CrossRef]
  13. Beddington, J.; Asaduzzaman, M.; Clark, M. Achieving Food Security in the Face of Climate Change, final report from the Commission on Sustainable Agriculture and Climate Change; CGIAR Research Program on Climate Change, Agriculture and Food Security (CCAFS): Copenhagen, Denmark, 2012. [Google Scholar]
  14. Pressman, E.; Moshkovitch, H.; Rosenfeld, K.; Shaked, R.; Gamliel, B.; Aloni, B. Influence of low night temperatures on sweet pepper flower quality and the effect of repeated pollinations, with viable pollen, on fruit setting. J. Hortic. Sci. Biol. 1998, 73, 131–136. [Google Scholar]
  15. Alexander, M.P. A versatile stain for pollen fungi, yeast and bacteria. Biotech. Histochem. 1980, 55, 13–18. [Google Scholar] [CrossRef]

