Article

Identification of Water Stress in Citrus Leaves Using Sensing Technologies

1
Department of Chemical Engineering and Material Science, University of California, Davis, CA 95616, USA
2
Department of Biological Systems Engineering, Washington State University, Pullman, WA 99164, USA
3
Citrus Research and Extension Center, IFAS/University of Florida, Lake Alfred, FL 33850, USA
*
Author to whom correspondence should be addressed.
Agronomy 2013, 3(4), 747-756; https://doi.org/10.3390/agronomy3040747
Submission received: 3 September 2013 / Revised: 15 October 2013 / Accepted: 5 November 2013 / Published: 13 November 2013
(This article belongs to the Special Issue Field Phenotyping for Yield and Environmental Stress Tolerance Traits)

Abstract

:
Water stress is a serious concern in the citrus industry due to its effect on citrus quality and yield. A sensor system for early detection will allow rapid implementation of control measures and management decisions to reduce any adverse effects. Laser-induced breakdown spectroscopy (LIBS) presents a potentially suitable technique for early stress detection through elemental profile analysis of the citrus leaves. It is anticipated that the physiological change in plants due to stress will induce changes in the element profile. The major goal of this study was to evaluate the performance of laser-induced breakdown spectroscopy as a method of water stress detection for potential use in the citrus industry. In this work, two levels of water stress were applied to Cleopatra (Cleo) mandarin, Carrizo citrange, and Shekwasha seedlings under the controlled conditions of a greenhouse. Leaves collected from the healthy and stressed plants were analyzed using LIBS, as well as with a spectroradiometer (visible-near infrared spectroscopy) and a thermal camera (thermal infrared). Statistical classification of healthy and stressed samples revealed that the LIBS data could be classified with an overall accuracy of 80% using a Naïve-Bayes and bagged decision tree-based classifiers. These accuracies were lower than the classification accuracies acquired from visible-near infrared spectra. An accuracy of 93% and higher was achieved using a bagged decision tree with visible-near infrared spectral reflectance data.

1. Introduction

Water stress can decline citrus quality and yield, and is an important issue to be addressed [1]. With early detection of water stress, effective control measures and management decisions can be implemented to reduce its adverse effects. Ideally, water stress should be detected prior to the appearance of visible symptoms of stress in the plant. Currently available techniques are not sufficiently sensitive to detect water stress at early stages. Laser-induced breakdown spectroscopy (LIBS) presents a potentially suitable technique for not only water stress, but also other types of stress detection (e.g. nutrient deficiencies) in the field conditions.
LIBS determines the nutrient profile of a sample by creating a plasma plume that emits light at wavelengths unique to elements within the sample [2,3,4]. Nutrient profile analysis has expanded the applications of LIBS systems in agriculture. In addition to success in the detection of pesticide contamination in plants [5], LIBS has been used to evaluate heavy metal pollution [6]. The detection limits of nutrients such as magnesium, calcium, sodium and potassium in spinach and rice plants were estimated using LIBS system. Moreover, the study [6] found that the pesticide contaminated spinach could be identified with an error of 2% using LIBS system. The LIBS have also been used in soil analysis [2]. In this study, the LIBS was used to evaluate the nutrient profile in order to estimate the changes in the nutrient profile, which can be an indicator to water stress. The nutrient uptake in the plants can be affected by water stress [7].
The visible-near infrared (VNIR) reflectance spectrometry has also been used to detect water stress in plants, resulting from change in reflectance of plant leaves due to loss of water [8,9]. Spectrometry can be used in the large-scale management of crops when used with unmanned aerial vehicles (UAVs) [10]. In water-stressed plants, transpiration rate reduces, allowing the temperature of leaves to increase [10]. For this reason, thermal infrared cameras can be used for water stress detection as well. Therefore, in this work, three different sensing techniques, LIBS, VNIR spectrometry and thermal imaging were evaluated for water stress detection in citrus cultivars.

2. Results and Discussion

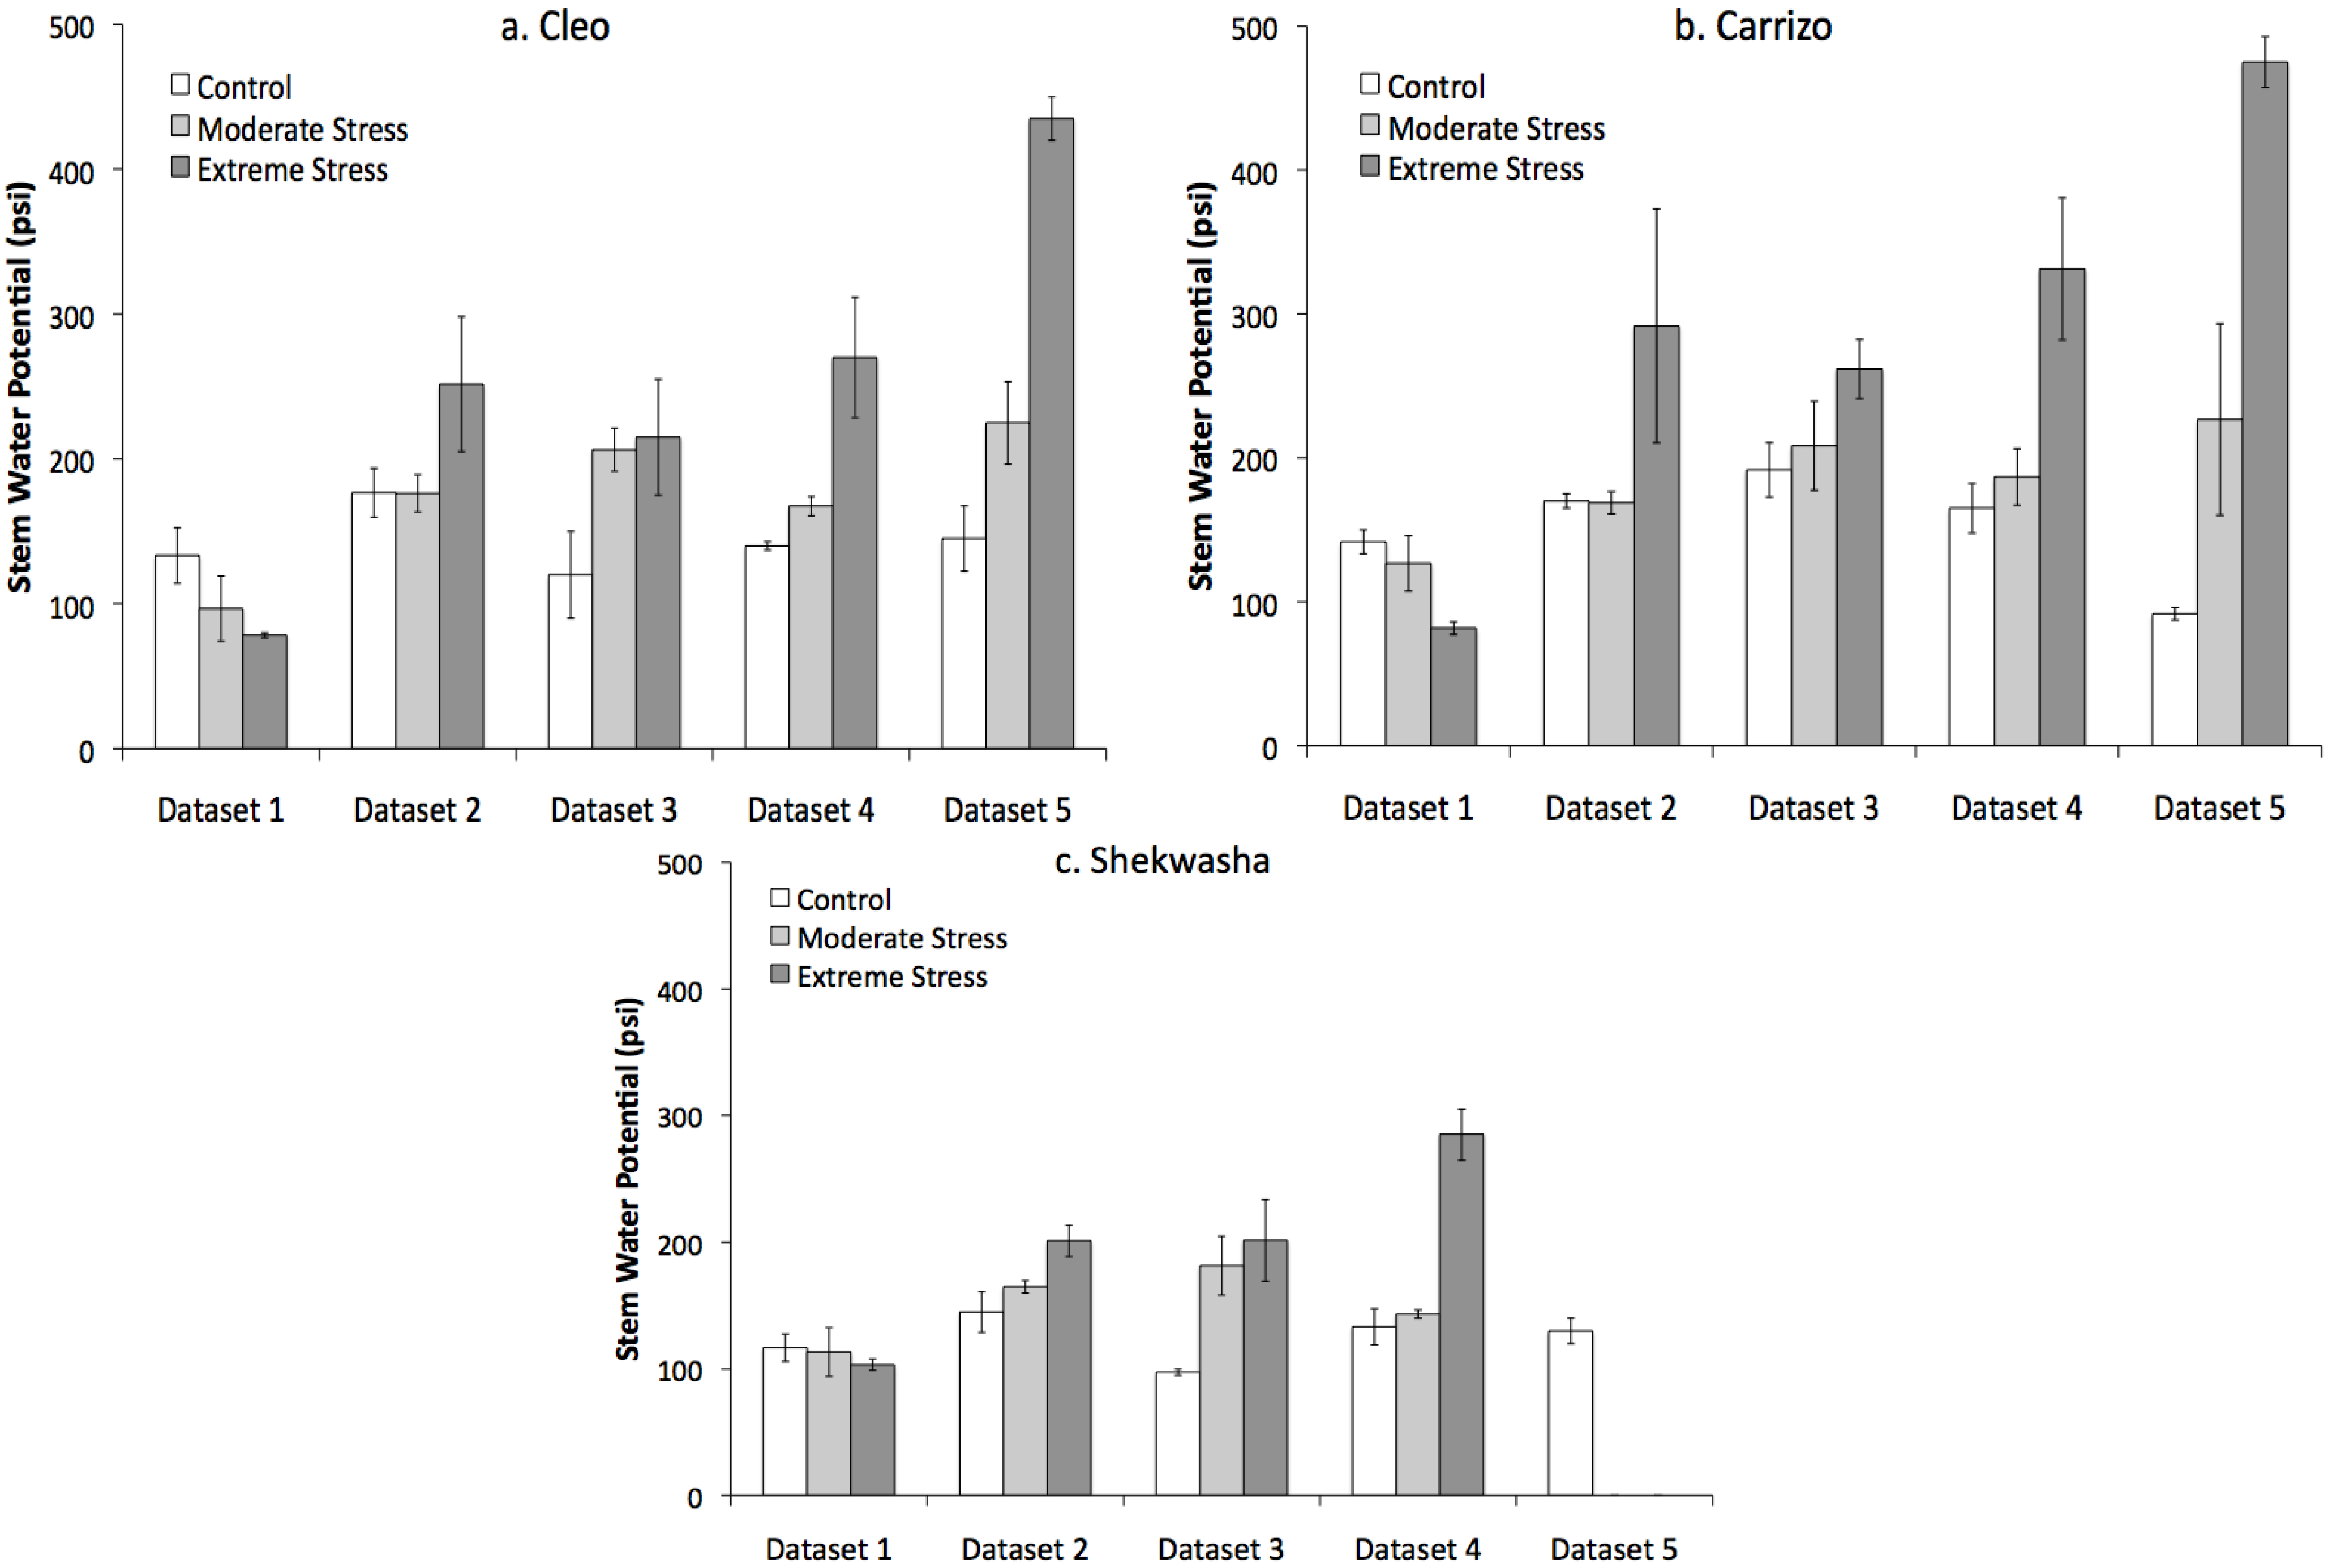
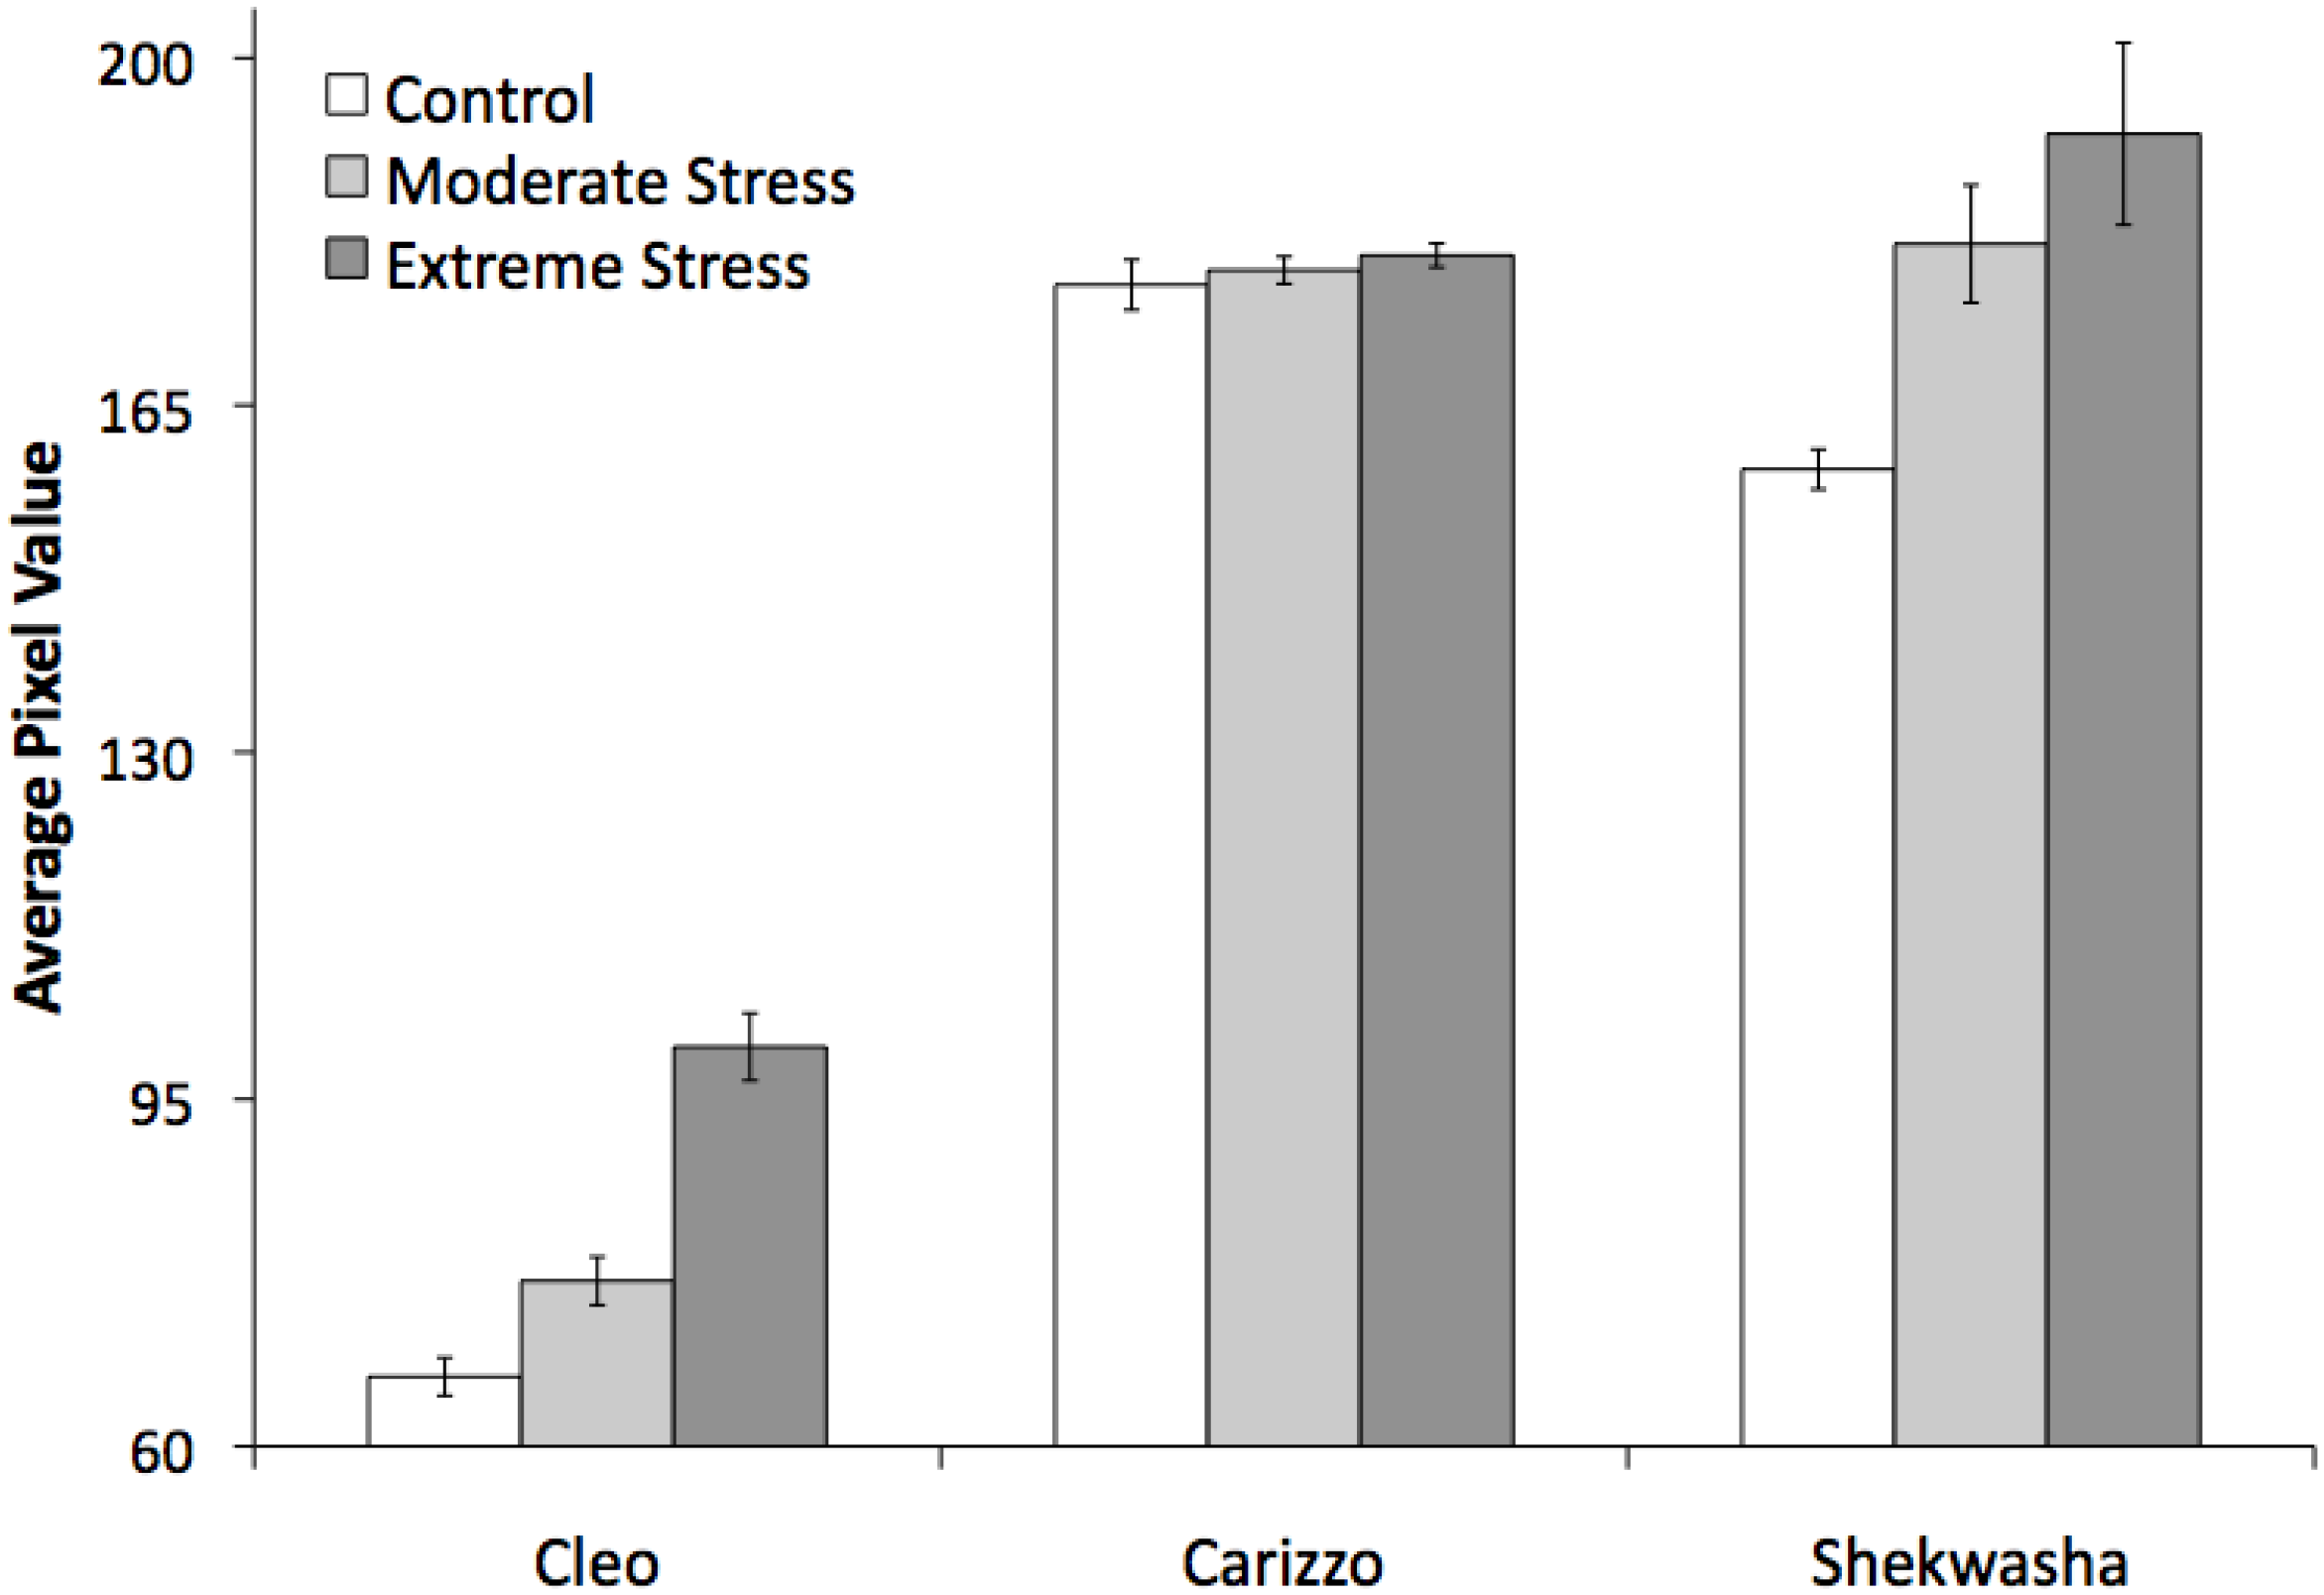
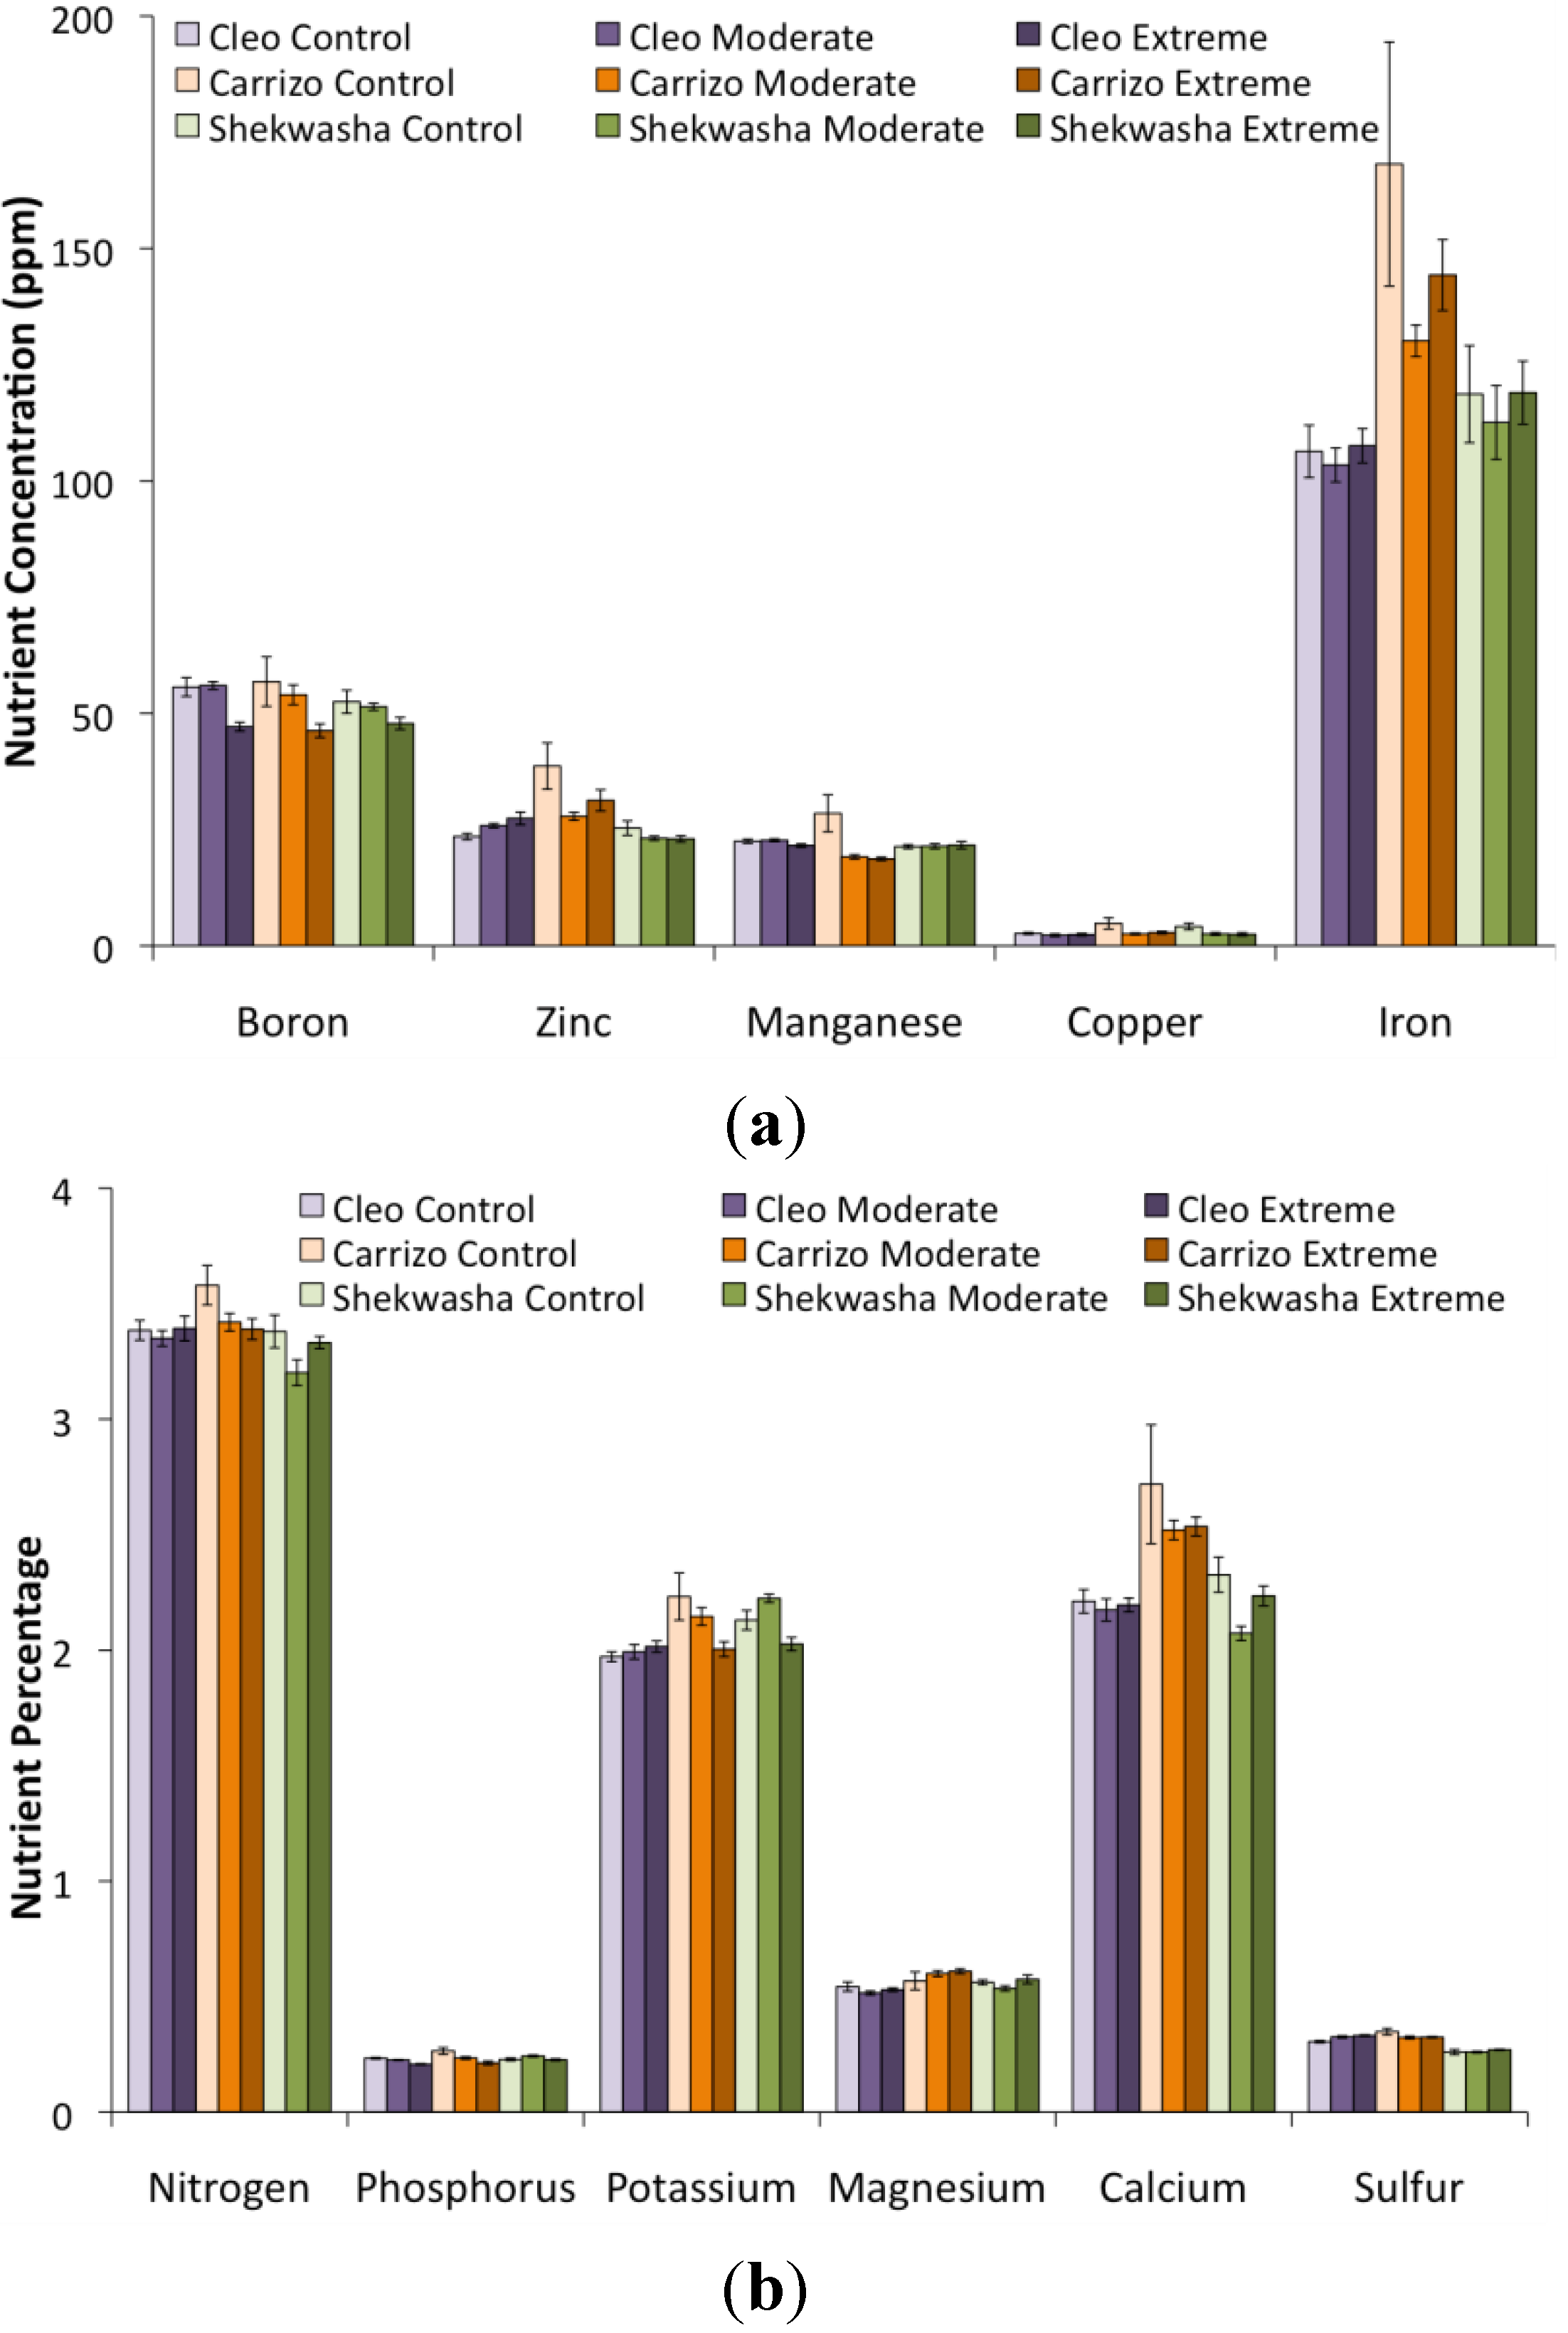
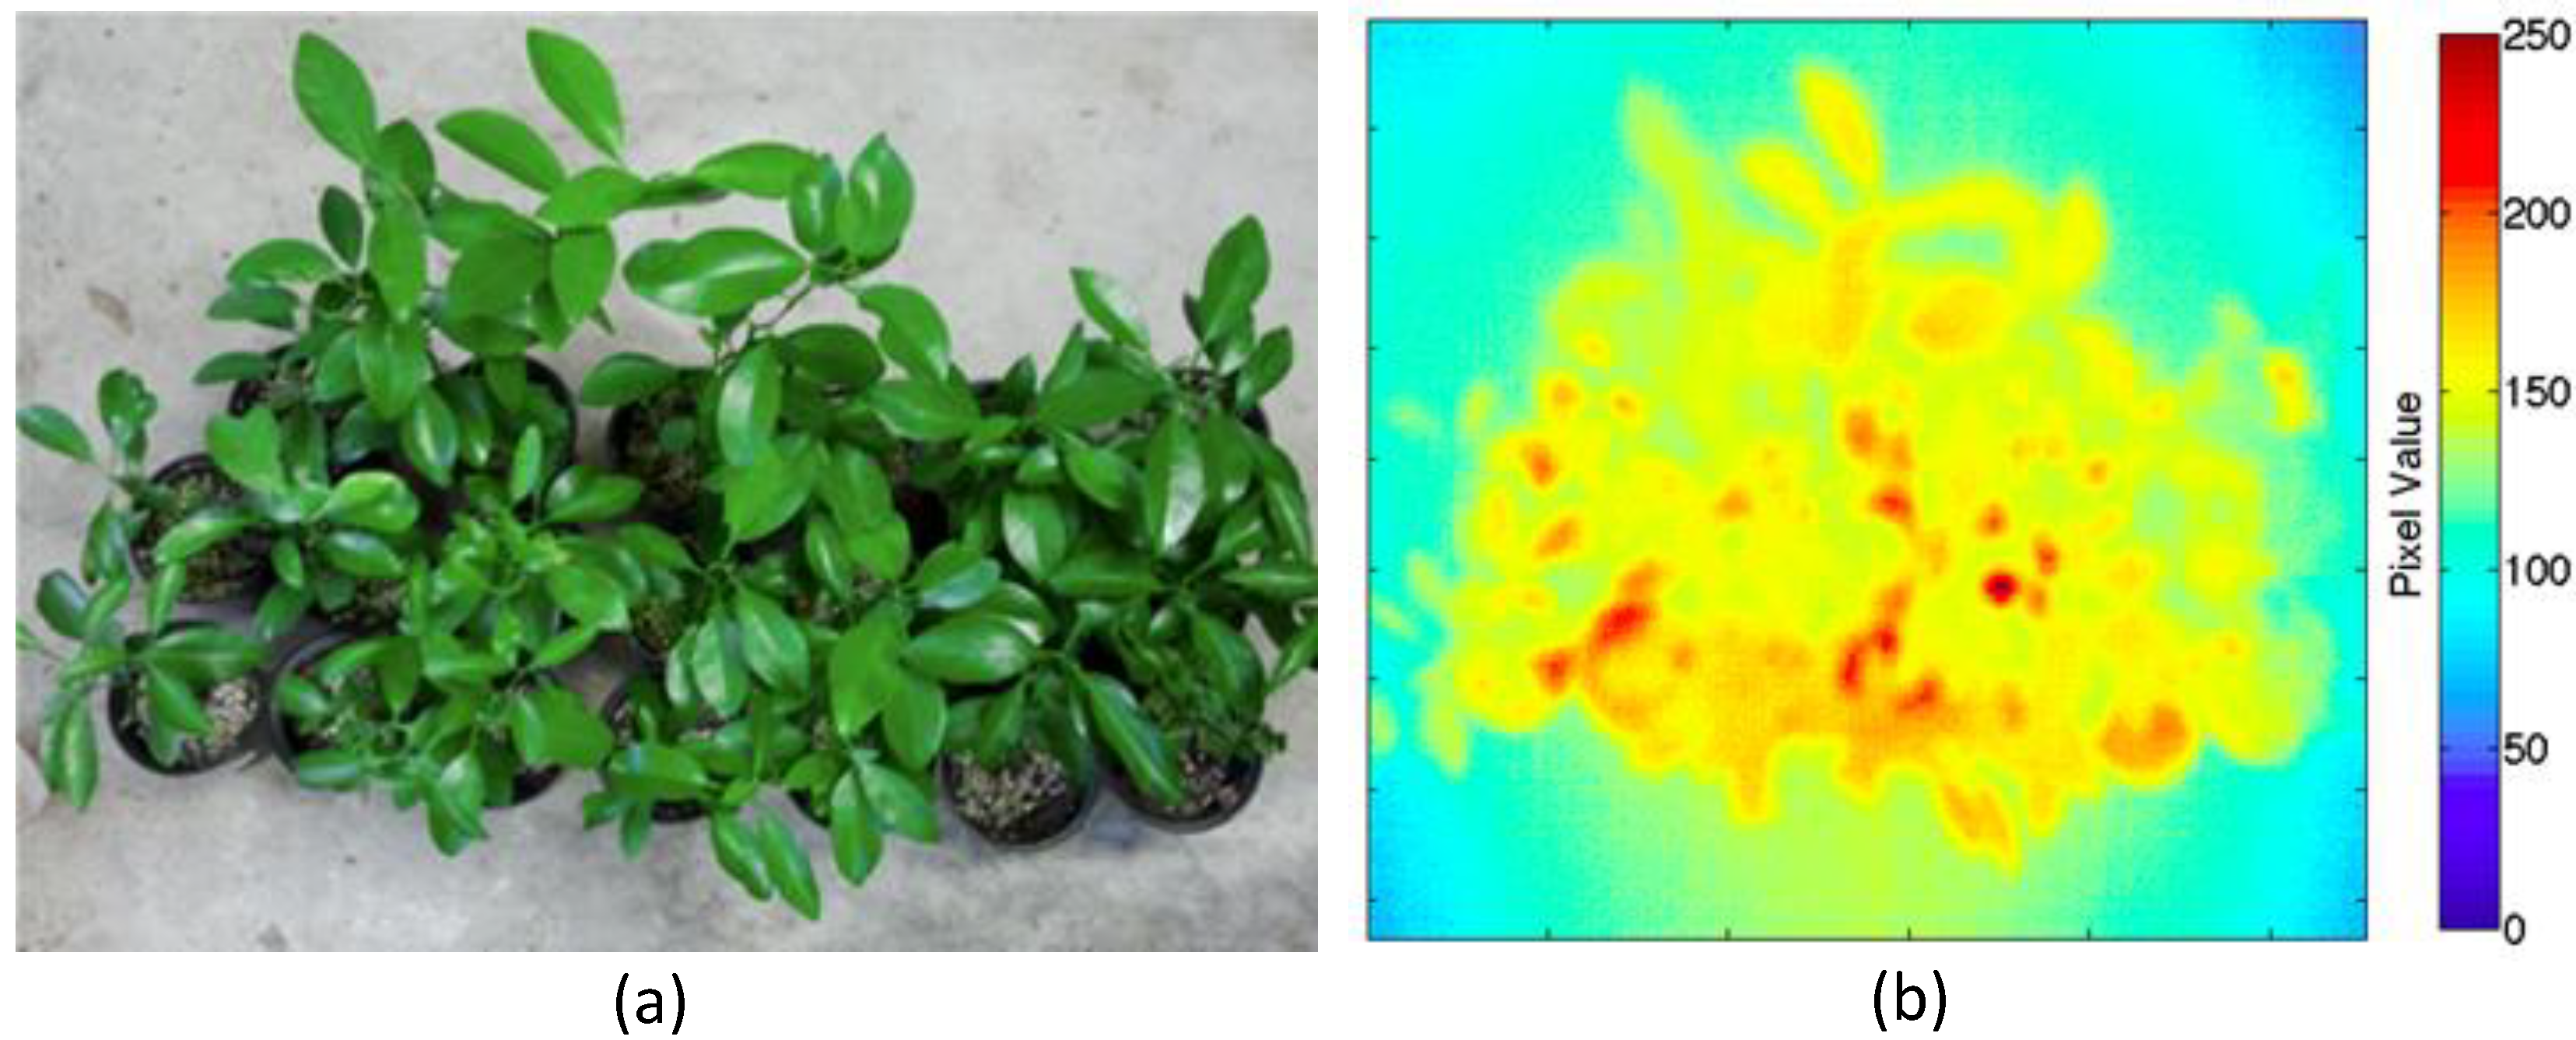
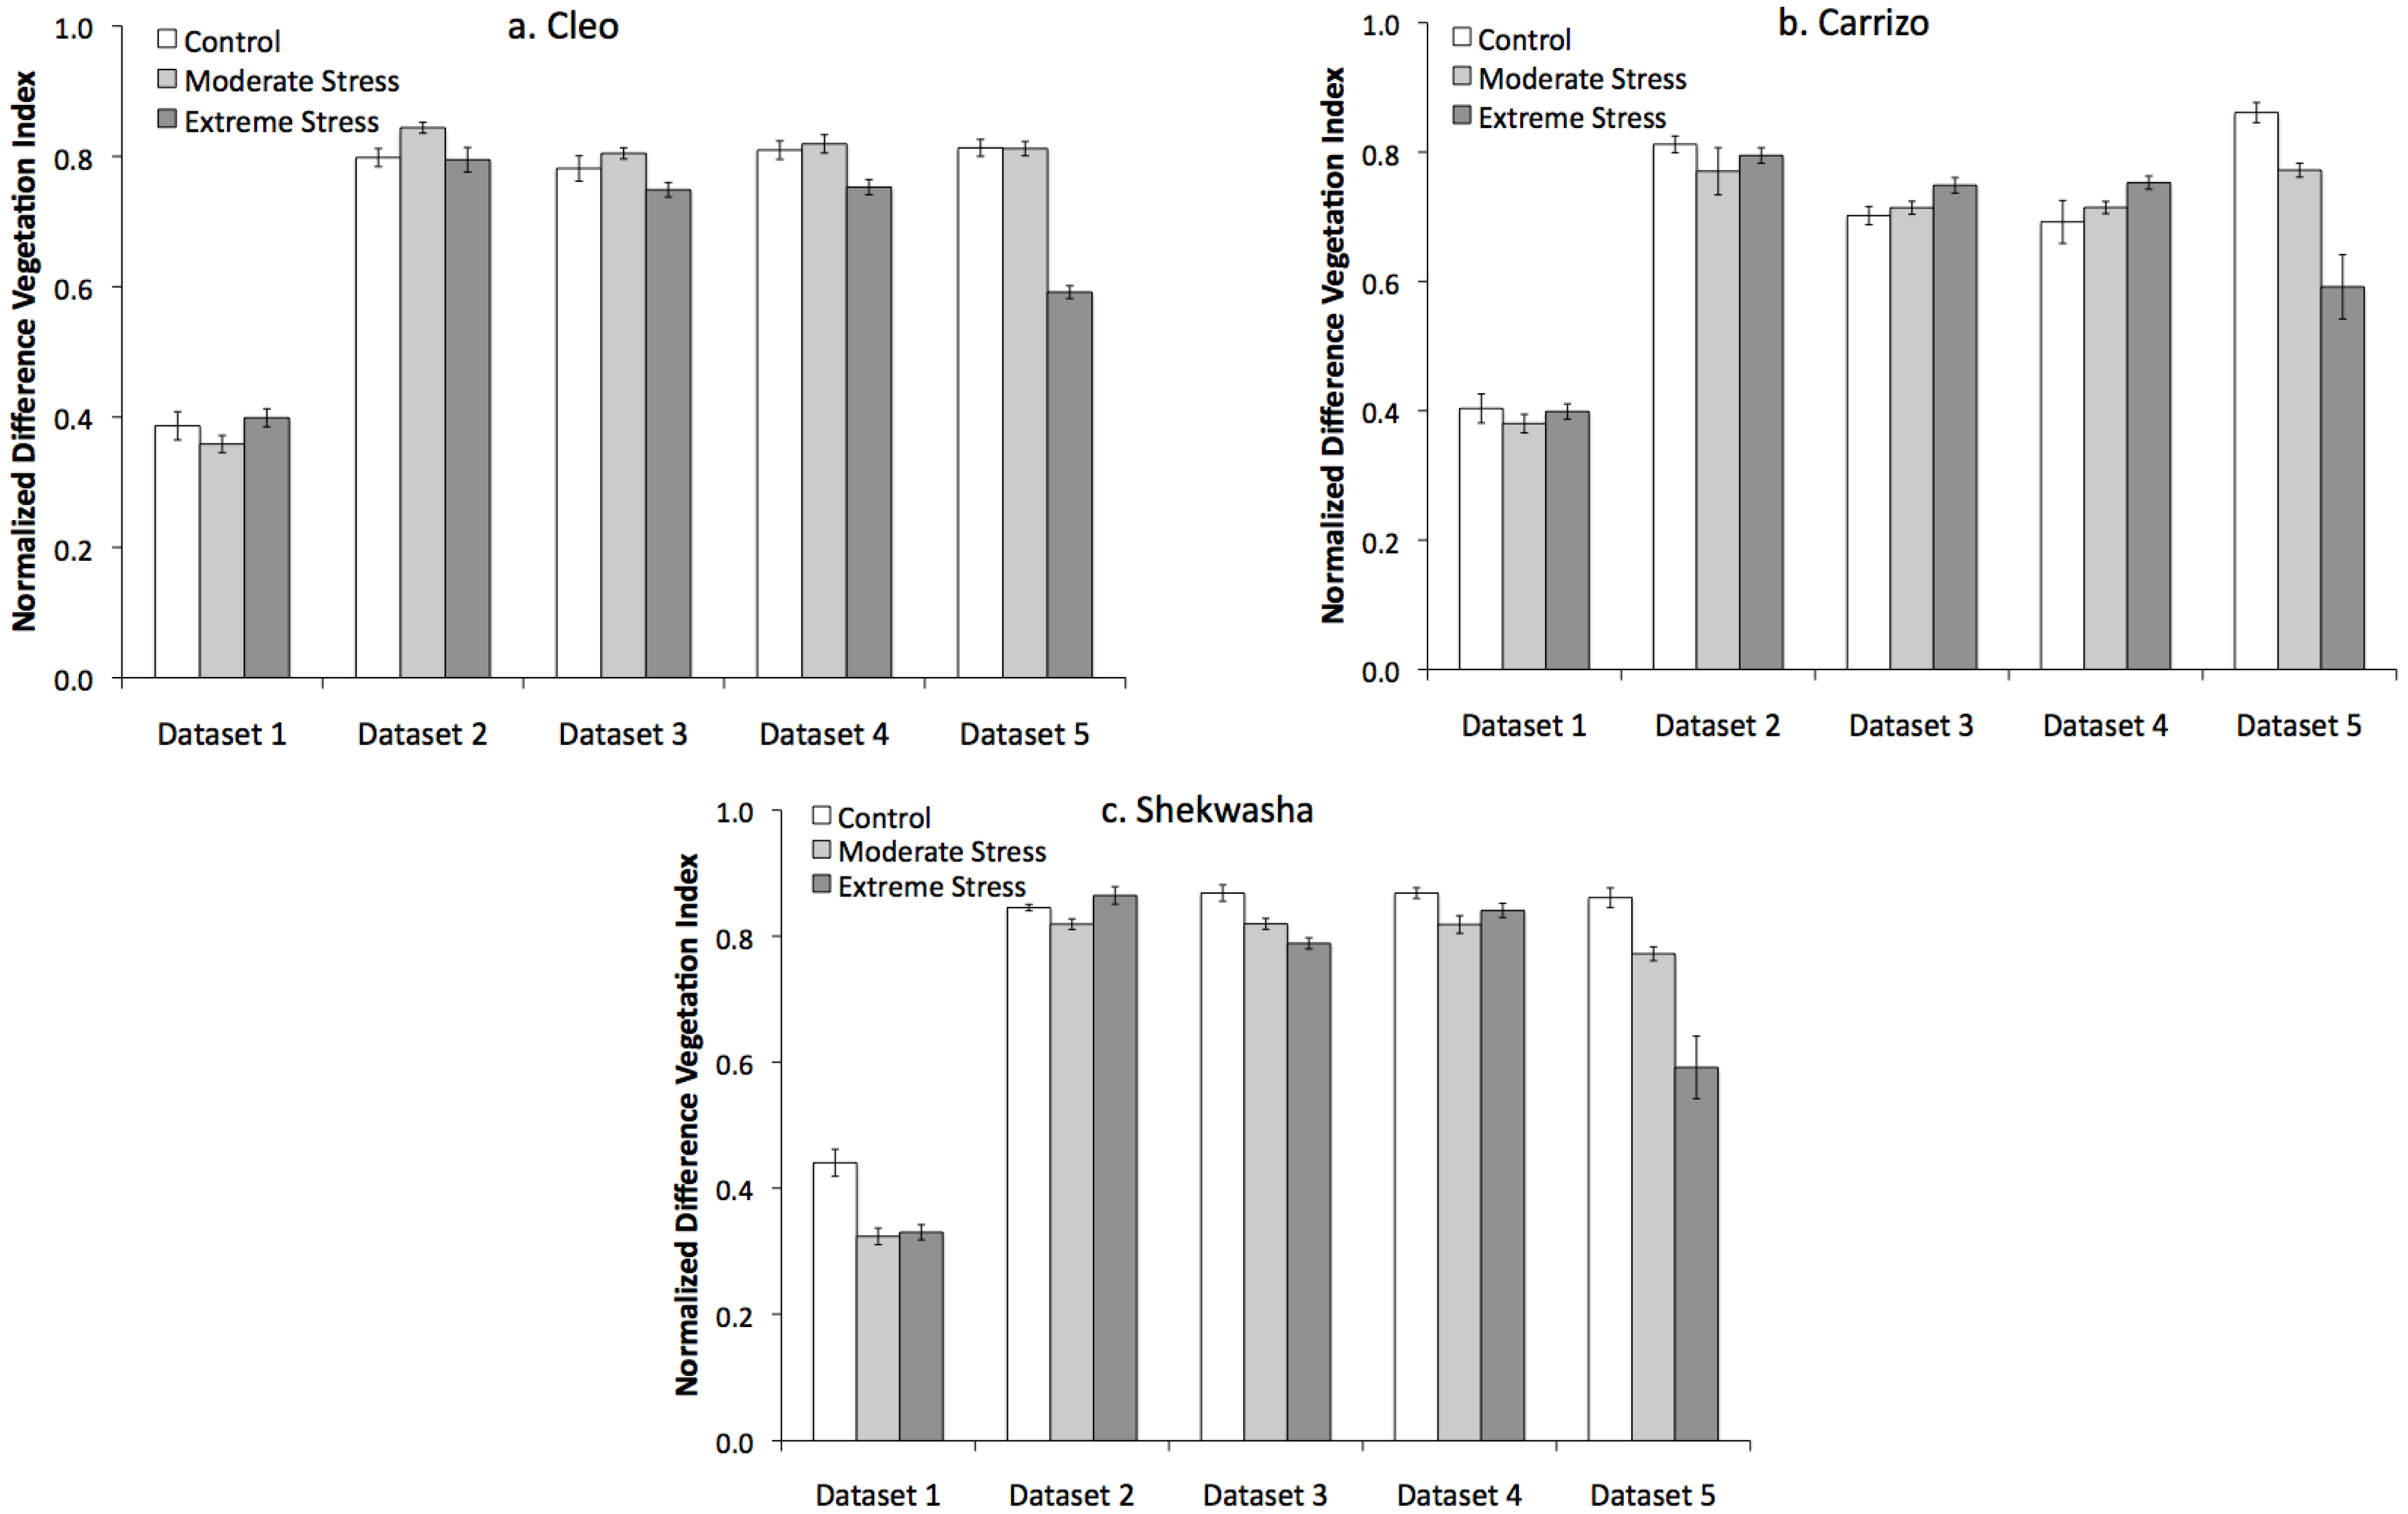
2.1. Water Stress Monitoring and Characterization

The stem water potential of the seedlings was used as reference for monitoring water stress in the seedlings. There were three treatments (control/healthy, moderate stress, extreme stress) induced on replicate seedlings of three cultivars, Cleopatra (Cleo) mandarin, Carrizo citrange, and Shekwasha. Five sets of data on stem water potential and spectral signatures using LIBS and VNIR technique were collected from the seedlings. As Figure 1 illustrates, all cultivars had a higher stem water potential values in the extreme stress conditions, beginning with the second dataset, indicating the onset of water stress. Stem water potential data could not be collected from the moderately and extremely stressed Shekwasha seedlings during final data collection as no water droplets were apparent within the applied pressure range using the water stress test unit. The stem water potential results correlated well with the physical observations made for each cultivar, with the Shekwasha seedlings having more severe physical stress symptoms (leaf wilting and curling) during fourth and fifth dataset collection and the Cleo seedlings with least apparent physical symptoms. Initial stem water potential trends (first dataset) were different, which may be attributed to the shock experienced by the seedlings due to repotting prior to the start of water stress experiments.
Figure 1. Stem water potential measurements collected throughout the experiment for the (a) Cleo; (b) Carrizo; and (c) Shekwasha seedlings.
Agronomy 03 00747 g001
Thermal infrared imaging showed potential in the detection of water stress. However, the high ground and soil temperatures, and variations in lighting produced many challenges during the data collection [11]. A sample thermal image of the Shekwasha seedlings is shown in Figure 2. The configuration of the plants in the image allowed for the distinction between the stressed and control plants. The control group is represented in the top row; while bottom plants showed the extremely stressed seedlings. The higher pixel values correlated with higher temperatures. When the average pixel value of multiple seedlings for each stress level within the cultivars was measured, there was a variation between the values (Figure 3). The Cleo and Shekwasha showed larger differences in the average pixel values related to each level of stress in comparison with the Carrizo seedlings. One of the possible reasons could be the leaf shape (narrow three lobed leaf of the Carrizo) that made the distinction between the leaf and background difficult.
Figure 2. (a) RGB and (b) thermal images of Shekwasha seedlings with varying degree of stress.
Agronomy 03 00747 g002
Figure 3. Average pixel value estimated with thermal image data.
Agronomy 03 00747 g003
The results of the nutrient analysis completed on dried plants following the final dataset collection are displayed in Figure 4. Nutrient concentration trends between stress levels for each cultivar were analyzed for statistical significance using analysis of variance (ANOVA) with a confidence level of 95%. In Cleo plants, phosphorus, sulfur, boron, and zinc concentrations varied with stress levels. However, in Carrizo plants, only phosphorus and manganese were found to be significant. Potassium, calcium, sulfur, and copper concentrations in the Shekwasha seedlings were also found to be statistically significant. Due to small data size, conclusive results could not be made.
Figure 4. Nutrient concentrations of seedlings following the conclusion of the experiments. (a) Concentrations of boron, zinc, manganese, copper and iron in ppm, and (b) concentrations of nitrogen, phosphorous, potassium, magnesium, calcium, and sulfur in percent.
Agronomy 03 00747 g004
Prior to data classification, Normalized Difference Vegetation Index (NDVI) was calculated for the samples to observe the temporal change in NDVI pattern for each cultivar (Figure 5). The first dataset showed very low NDVI values for all three conditions and cultivars, which could be due to plant adaptation to repotting. However, the exact reason for this observation is unknown. From datasets 2 to 4, the NDVI values between the three treatments were comparable. Only in the dataset 5, the NDVI values decreased significantly with increase in stress conditions, especially for Carrizo and Shekwasha. For Cleo, the NDVI values of the moderately stress conditions was comparable to the healthy plants, which could be due to the absence of any visible stress symptoms.
Figure 5. Normalized Difference Vegetation Index (NDVI) values of (a) Cleo; (b) Carrizo; and (c) Shekwasha seedlings.
Agronomy 03 00747 g005

2.2. LIBS and VNIR Classification

Table 1 summarizes the classification results using multiple algorithms using LIBS and VNIR sensing techniques. The algorithms tested were Linear Discriminant Analysis (LDA), Naïve-Bayes (NB) classifier, and Bagged Decision Tree (BDT). As indicated by Table 1, the three algorithms used in the LIBS spectral data classification were unsuccessful in accurately identifying stress levels in the Cleo seedlings. Overall accuracy values for the first week of testing, prior to any evidence of stress in the plants through stem water potential, began at values over 50% and continued to fluctuate throughout the study. In the fourth dataset the LDA, NB, and BDT algorithms resulted in overall accuracy values of 70% or higher. The classification accuracy for Shekwasha seedlings were about 80% in datasets 3 and 4 using bagged decision tree.
Table 1. Overall accuracy (%) of classification algorithms on data collected using laser-induced breakdown spectroscopy (LIBS); LDA: Linear Discriminant Analysis, NB: Naïve Bayes classifier, BDT: Bagged Decision Tree
DatasetCleoCarrizoShekwasha
LDANBBDTLDANBBDTLDANBBDT
167586720010362736
2505026113322442222
3606070222244565678
4707060708080708080
5453050605060353530
Comparing the nutrient profiles and stress levels, the Carrizo seedlings displayed significant trends in two of eleven nutrients measured, while four were significant in the Cleo and Shekwasha seedlings. The lower classification accuracy values of Cleo seedlings could be related to the cultivar’s leaf water-use efficiency, which is higher than the Carrizo and was the least symptomatic of the three cultivars [12]. The Shekwasha seedlings that resulted in the higher classification accuracy were the most sensitive to water stress with highly symptomatic physical characteristics. The low accuracy achieved in the fifth dataset for all cultivars is most likely related to the highly symptomatic leaves observed in the moderately and extremely stressed seedlings in the final week of the study.
For the VNIR spectroscopy classification accuracies given in Table 2, the BDT algorithm was the most accurate for all three cultivars in the final dataset. In the fourth dataset, the point at which physical stress symptoms started to appear, LDA showed the highest overall classification accuracy for Shekwasha. Differences between the cultivars in the classification accuracy related to the VNIR spectroscopy method can likely be attributed the variance in leaf shape and configuration as these parameters are known to affect the VNIR reflectance data [13,14].
Table 2. Overall accuracy (%) of classification algorithms on data collected through visible-near infrared (VNIR) spectroscopy.
DatasetCleoCarrizoShekwasha
LDANBBDTLDANBBDTLDANBBDT
1476067403360678073
2406067406067648686
3364357476067715779
4674773337367866471
56777100576393587397

3. Experimental Section

3.1. Citrus Rootstock Seedlings

Three cultivars of citrus rootstocks were utilized in this study: Cleopatra (Cleo) mandarin, Carrizo citrange, and Shekwasha. A total of twenty seedlings of each cultivar were monitored with two levels of water stress having seven replicates each and six replicates of non-stressed control. After an initial week of watering every two days, “control” seedlings were watered every one to two days, “moderate” stressed plants were watered every three to four days, and “extreme” stressed plants were watered every one to two weeks. Each seedling received 200 mL of water applied to the soil directly below the leaves on the designated watering day. All seedlings were given 4.7% iron chelate and a fertilizer solution of nitrate, phosphate, and potash in a 7:2:7 ratio once a week. The seedlings were grown in controlled-environmental conditions of a greenhouse.

3.2. Sensors and Data Collection

The LIBS and VNIR reflectance data were collected using PORTA-LIBS-2000 system (StellarNet, Inc., Tampa, FL, USA) and Field Portable Spectroradiometer (SVC HR-1024, Spectra Vista Corp., Poughkeepsie, NY, USA). A total of five datasets were collected throughout the study with the first four sets being collected every 1–2 weeks and a final dataset 8 weeks following the start of the experiment. Week 1 data were collected prior to water stress application in order to monitor the condition of the seedlings prior to the start of stress experiments. One Shekwasha seedling was excluded from the test following the first dataset collection due to presence of disease in the seedling.
For data collection, leaves were removed from the seedlings in order to measure the stem water potential. These leaves were gently cleaned with water, and the LIBS and VNIR systems were used to collect the spectral data within four hours of initial removal from the plant. The sampling frequency and the number of LIBS and VNIR spectra collected are summarized in Table 3. Using the LIBS system, two replicate spectra from two different spots were collected from each leaf. Similarly, three replicates of reflectance spectra were recorded for every leaf using the VNIR system in the laboratory.
Table 3. Sampling period and spectral data collected using the LIBS and VNIR systems.
DatasetSampling DateLIBSVNIR
1Week 1142185
2Week 2117177
3Week 4116180
4Week 5118177
5Week 8120180
The stem water potential was determined using a Portable Plant Water Stress Console (Soil Moisture Equipment Corp., Santa Barbara, CA, USA). Thermal infrared images were collected to monitor changes in plant transpiration levels using a compact thermal camera (Tau 640, FLIR Systems, Goleta, CA, USA). Due to several challenges such as high ground and soil temperatures, variations in lighting and shadow effects, all the thermal images were not used for analysis. Therefore, Figure 3 represents three thermal images (one for each cultivar).
Physical symptoms of stress were recorded every week in addition to the leaf count and plant height recorded during the start and end of the study. A nutrient analysis was completed following the conclusion of the experiment through Waters Agricultural Laboratories, Inc. (Camilla, GA, USA).

3.3. Data Analysis

Spectral data from LIBS and VNIR systems were processed and analyzed using MATLAB (MathWorks, Natick, MA, USA). Raw LIBS data were denoised using wavelets followed by data normalization prior to the use of principal component analysis to reduce redundancy. The number of principal components with a variance of 99.9% was used as input data. The dataset was randomized and separated to training (75%) and testing (25%) datasets for classification. LDA, NB and BDT algorithms were used for classification.
Similarly, prior to principal component analysis and classification, VNIR spectral data were normalized and the wavelength data were averaged for every 10 nm. Principal components were used such that the variance was at least 90.0%. The data were divided into training and test datasets, similar to LIBS data. LDA, NB, and BDT algorithms were tested with the VNIR data.

4. Conclusions

Overall, VNIR spectroscopy showed higher accuracy in the classification of stress levels. Despite this, there was variability in performance of algorithm for each cultivar, indicating the need for cultivar-specific classification methods. The LIBS classification accuracy for all cultivars reduced significantly after the appearance of physical water stress symptoms. Comparing the two spectroscopic methods with drought sensitive and resistant citrus cultivars could be an area of future research.

Acknowledgments

The authors would like to thank the National Science Foundation (NSF) for funding through the University of Florida, Department of Agricultural and Biological Engineering Water Resources Research Experience for Undergraduates (REU) Program, Citrus Research and Development Foundation (CRDF) and US Department of Agriculture-Specialty Crop Research Initiative (USDA-SCRI) for their funding for this research. Additional thanks go to Dr. Wije Bandaranayake and James Syvertsen, Citrus Research and Education Center, University of Florida for their assistance and guidance.

Conflicts of Interest

The authors declare no conflict of interest.

References

  1. Ballester, C.; Castel, J.; Intrigliolo, D.D.; Castel, J.R. Response of clementina de nules citrus trees to summer deficit irrigation yield components and fruit composition. Agric. Water Manag. 2011, 98, 1027–1032. [Google Scholar] [CrossRef]
  2. Radziemski, L.; Cremers, D. A brief history of laser-induced breakdown spectroscopy: From the concept of atoms to LIBS 2012. Spectrochim. Acta Part B 2013, 87, 3–10. [Google Scholar] [CrossRef]
  3. Trevizan, L.C.; Santos, D., Jr.; Samad, R.E.; Vieira, N.D., Jr.; Nomura, C.S.; Nunes, L.C.; Rufini, I.A.; Krug, F.J. Evaluation of laser induced spectroscopy for the determination of macronutrients in plant materials. Spectrochim. Acta Part B 2008, 63, 1151–1158. [Google Scholar] [CrossRef]
  4. Trevizan, L.C.; Santos, D., Jr.; Samad, R.E.; Nunes, L.C.; Rufini, I.A.; Krug, F.J. Evaluation of laser induced spectroscopy for the determination of micronutrients in plant materials. Spectrochim. Acta Part B 2009, 64, 369–377. [Google Scholar] [CrossRef]
  5. Kim, G.; Kwak, J.; Choi, J.; Park, K. Detection of nutrient elements and contamination by pesticides in spinach and rice samples using Laser-Induced Breakdown Spectroscopy (LIBS). J. Agric. Food Chem. 2012, 60, 718–724. [Google Scholar] [CrossRef]
  6. Yao, M.; Huang, L.; Zheng, J.; Fan, S.; Liu, M. Assessment of feasibility in determining of Cr in gannan navel orange treated in controlled conditions by Laser Induced Breakdown Spectroscopy. Opt. Laser Technol. 2013, 52, 70–74. [Google Scholar] [CrossRef]
  7. Chapin, F.S., III. Integrated response of plants to stress. Bioscience 1991, 41, 29–36. [Google Scholar] [CrossRef]
  8. Carter, G.A. Primary and secondary effects of water content on the spectral reflectance of leaves. Am. J. Bot. 1991, 78, 916–924. [Google Scholar] [CrossRef]
  9. Kriston-Vizi, J.; Umeda, M.; Miyamoto, K. Assessment of water status of mandarin and peach canopies using visible multispectral imagery. Precis. Agric. 2008, 100, 338–345. [Google Scholar]
  10. Pinter, P.J., Jr.; Hatfield, J.L.; Schepers, J.S.; Barnes, E.M.; Moran, M.S.; Daughtry, C.S.T.; Upchurch, D.R. Remote sensing for crop management. Photogramm. Eng. Rem. Sens. 2003, 69, 647–664. [Google Scholar]
  11. Ballester, C.; Castel, J.; Jimenez-Bello, M.A.; Castel, J.R.; Intrigliolo, D.S. Thermographic measurement of canopy temperature is a useful tool for predicting water deficit effects on fruit weight in citrus trees. Agric. Water Manag. 2013, 122, 1–6. [Google Scholar] [CrossRef]
  12. Garcia-Sanchez, F.; Syvertsen, J.P.; Gimeno, V.; Botia, P.; Perez-Perez, J.G. Responses to flooding and drought stress by two citrus rootstock seedlings with different water-use efficiency. Physiol. Plant. 2007, 130, 532–542. [Google Scholar] [CrossRef]
  13. Slaton, M.R.; Hunt, E.R., Jr.; Smith, W.K. Estimating near-infrared leaf reflectance from leaf structural characteristics. Am. J. Bot. 2001, 88, 278–284. [Google Scholar] [CrossRef]
  14. Usha, K.; Singh, B. Potential applications of remote sensing in horticulture. Sci. Hortic.-Amst. 2013, 153, 71–83. [Google Scholar] [CrossRef]

