Article

Measuring Maize Seedling Drought Response in Search of Tolerant Germplasm

Department of Soil and Crop Sciences, Texas A&M University, College Station, Texas 77843, USA
*
Author to whom correspondence should be addressed.
Agronomy 2013, 3(1), 135-147; https://doi.org/10.3390/agronomy3010135
Submission received: 3 October 2012 / Revised: 25 January 2013 / Accepted: 29 January 2013 / Published: 7 February 2013

Abstract

:
To identify and develop drought tolerant maize (Zea mays L.), high-throughput and cost-effective screening methods are needed. In dicot crops, measuring survival and recovery of seedlings has been successful in predicting drought tolerance but has not been reported in C4 grasses such as maize. Seedlings of sixty-two diverse maize inbred lines and their hybrid testcross progeny were evaluated for germination, survival and recovery after a series of drought cycles. Genotypic differences among inbred lines and hybrid testcrosses were best explained approximately 13 and 18 days after planting, respectively. Genotypic effects were significant and explained over 6% of experimental variance. Specifically three inbred lines had significant survival, and 14 hybrids had significant recovery. However, no significant correlation was observed between hybrids and inbreds (R2 = 0.03), indicating seedling stress response is more useful as a secondary screening parameter in hybrids than in inbred lines per se. Field yield data under full and limited irrigation indicated that seedling drought mechanisms were independent of drought responses at flowering in this study.

Graphical Abstract

1. Introduction

Expanding populations with greater food and energy needs are increasing demand for greater global maize (Zea mays L.) production. Unfortunately, environmental limitations such as temperature and drought continue to restrain maize production levels as they have in earlier decades and in many areas this is predicted to worsen with changing climates [1,2,3]. Developing cultivars of maize that can perform well under heat and drought is an important goal throughout the world. Unfortunately, maize researchers and breeders have found that drought tolerance is a complex trait making the search for appropriate selection traits, breeding and screening methods difficult [4,5,6,7]. An initial focus solely on yield stability under time points of water stress has so far resulted in incremental progress [8]. Consequently, this has led to a search for secondary traits. In the case of maize these would ideally be identifiable in inbred lines and inherited to good yielding hybrids. These traits include but are not limited to, shortened anthesis-silking interval (ASI) [9,10], delayed leaf senescence [9], increased rooting depth and density [11], hydraulic lift [12], high leaf number and short plant height [13], performance with limited available nitrogen [14], seedling vigor [15], and epicuticular wax [16,17]. Many secondary trait screening methods are still costly when evaluating large numbers of genotypes in a breeding program. Technologies such as molecular markers for marker assisted selection and transgenic lines have been developed and provide another avenue to improve drought tolerance [4,8]. However, for a trait as complex as drought, using the few identified genes—mostly with small effects—are unlikely to be a single solution in the near future [18].
Additional traits and methods that can help identify drought tolerant genotypes at different stages of growth would be extremely useful for plant breeders, physiologists and agronomists to use in the development of new cultivars [8]. While it is widely recognized that flowering is the most critical time for drought stress to impact maize yield [10], drought can damage a field anytime throughout the season and the seedling stage has received little attention [19]. One useful method that has been used to develop drought tolerant varieties of dicot crops such as cowpea [15,20] and cotton [21] is the use of seedling drought screens, where young seedlings undergo cycles of water stress in the greenhouse. This method has also been successful in discriminating cultivars of wheat [22].This is an attractive approach because it is a high-throughput, low cost and low space method with fast turnaround time; however, to our knowledge a controlled method of seedling drought tolerance screening has never been reported in maize [8]. While seedling survival has been briefly reported on for a single tropical population in a field context [23] the author suggests more controlled studies would be useful [19]. The aim of this research was to develop and evaluate a fast and resource efficient, repeatable seedling screening method adapted to maize. The specific objectives of this study were to: (1) determine the number of days seedlings can undergo drought stress that best discriminate between genotypes; (2) identify individual genotype level of drought tolerance; (3) estimate the heritability of seedling tolerance in both inbreds and hybrids; and (4) evaluate impact of seedling screening for later stages of drought tolerance by correlating inbred and hybrid seedling performance in the greenhouse with grain yield data in field environments.

2. Results and Discussion

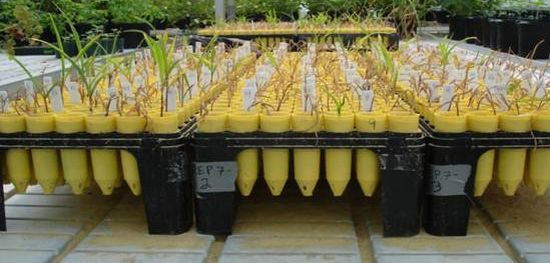
2.1. Seedling Germination

The overall average for the inbred lines in the sand was 83% germination (Table 1). Germination was only significantly different for eight inbred lines with lower germination (Table 2). The overall average for the hybrid testcross lines was 87% germination. None of the hybrid testcross lines were found to be significantly different (P > 0.05). Seedling germination percentage is important for statistical control of survival and recovery of seedlings.
Table 1. Inbred line and hybrid testcross germination percentage, overall survival percentage at the end of each replication, and the end date of each replication.
Reps12345678Mean
InbredGermination %588092888692----83
Overall Survival %220000----1
End Date4/54/55/135/135/135/13------
HybridGermination %908890918882858187
Overall Survival %001313422
End Date2/172/172/172/173/173/173/173/17--

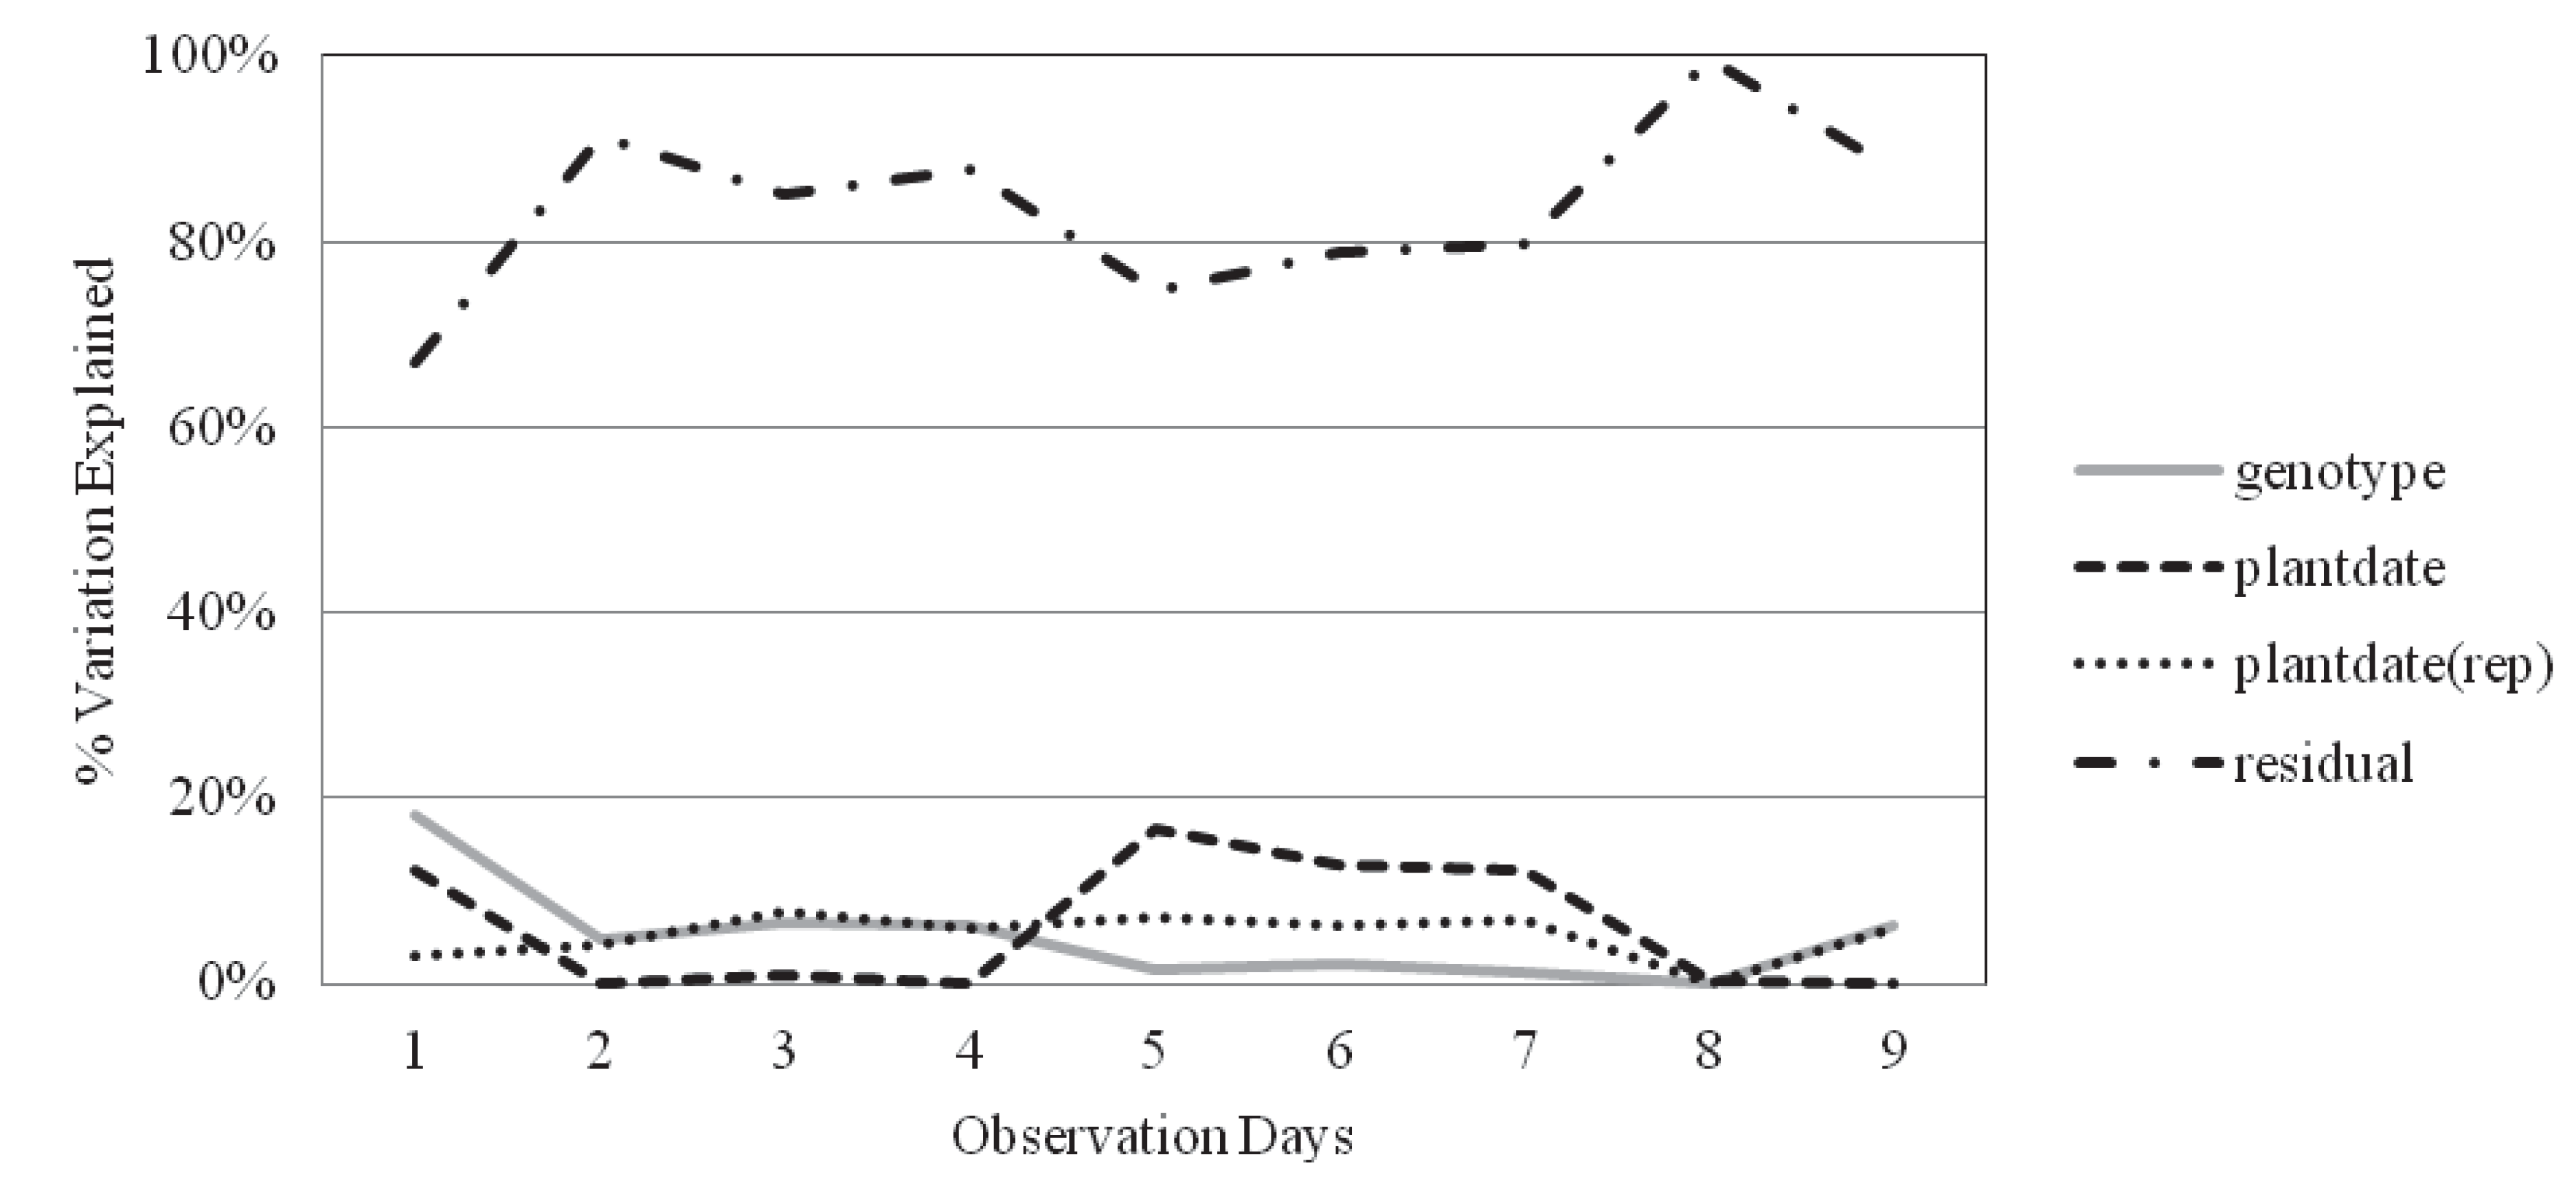
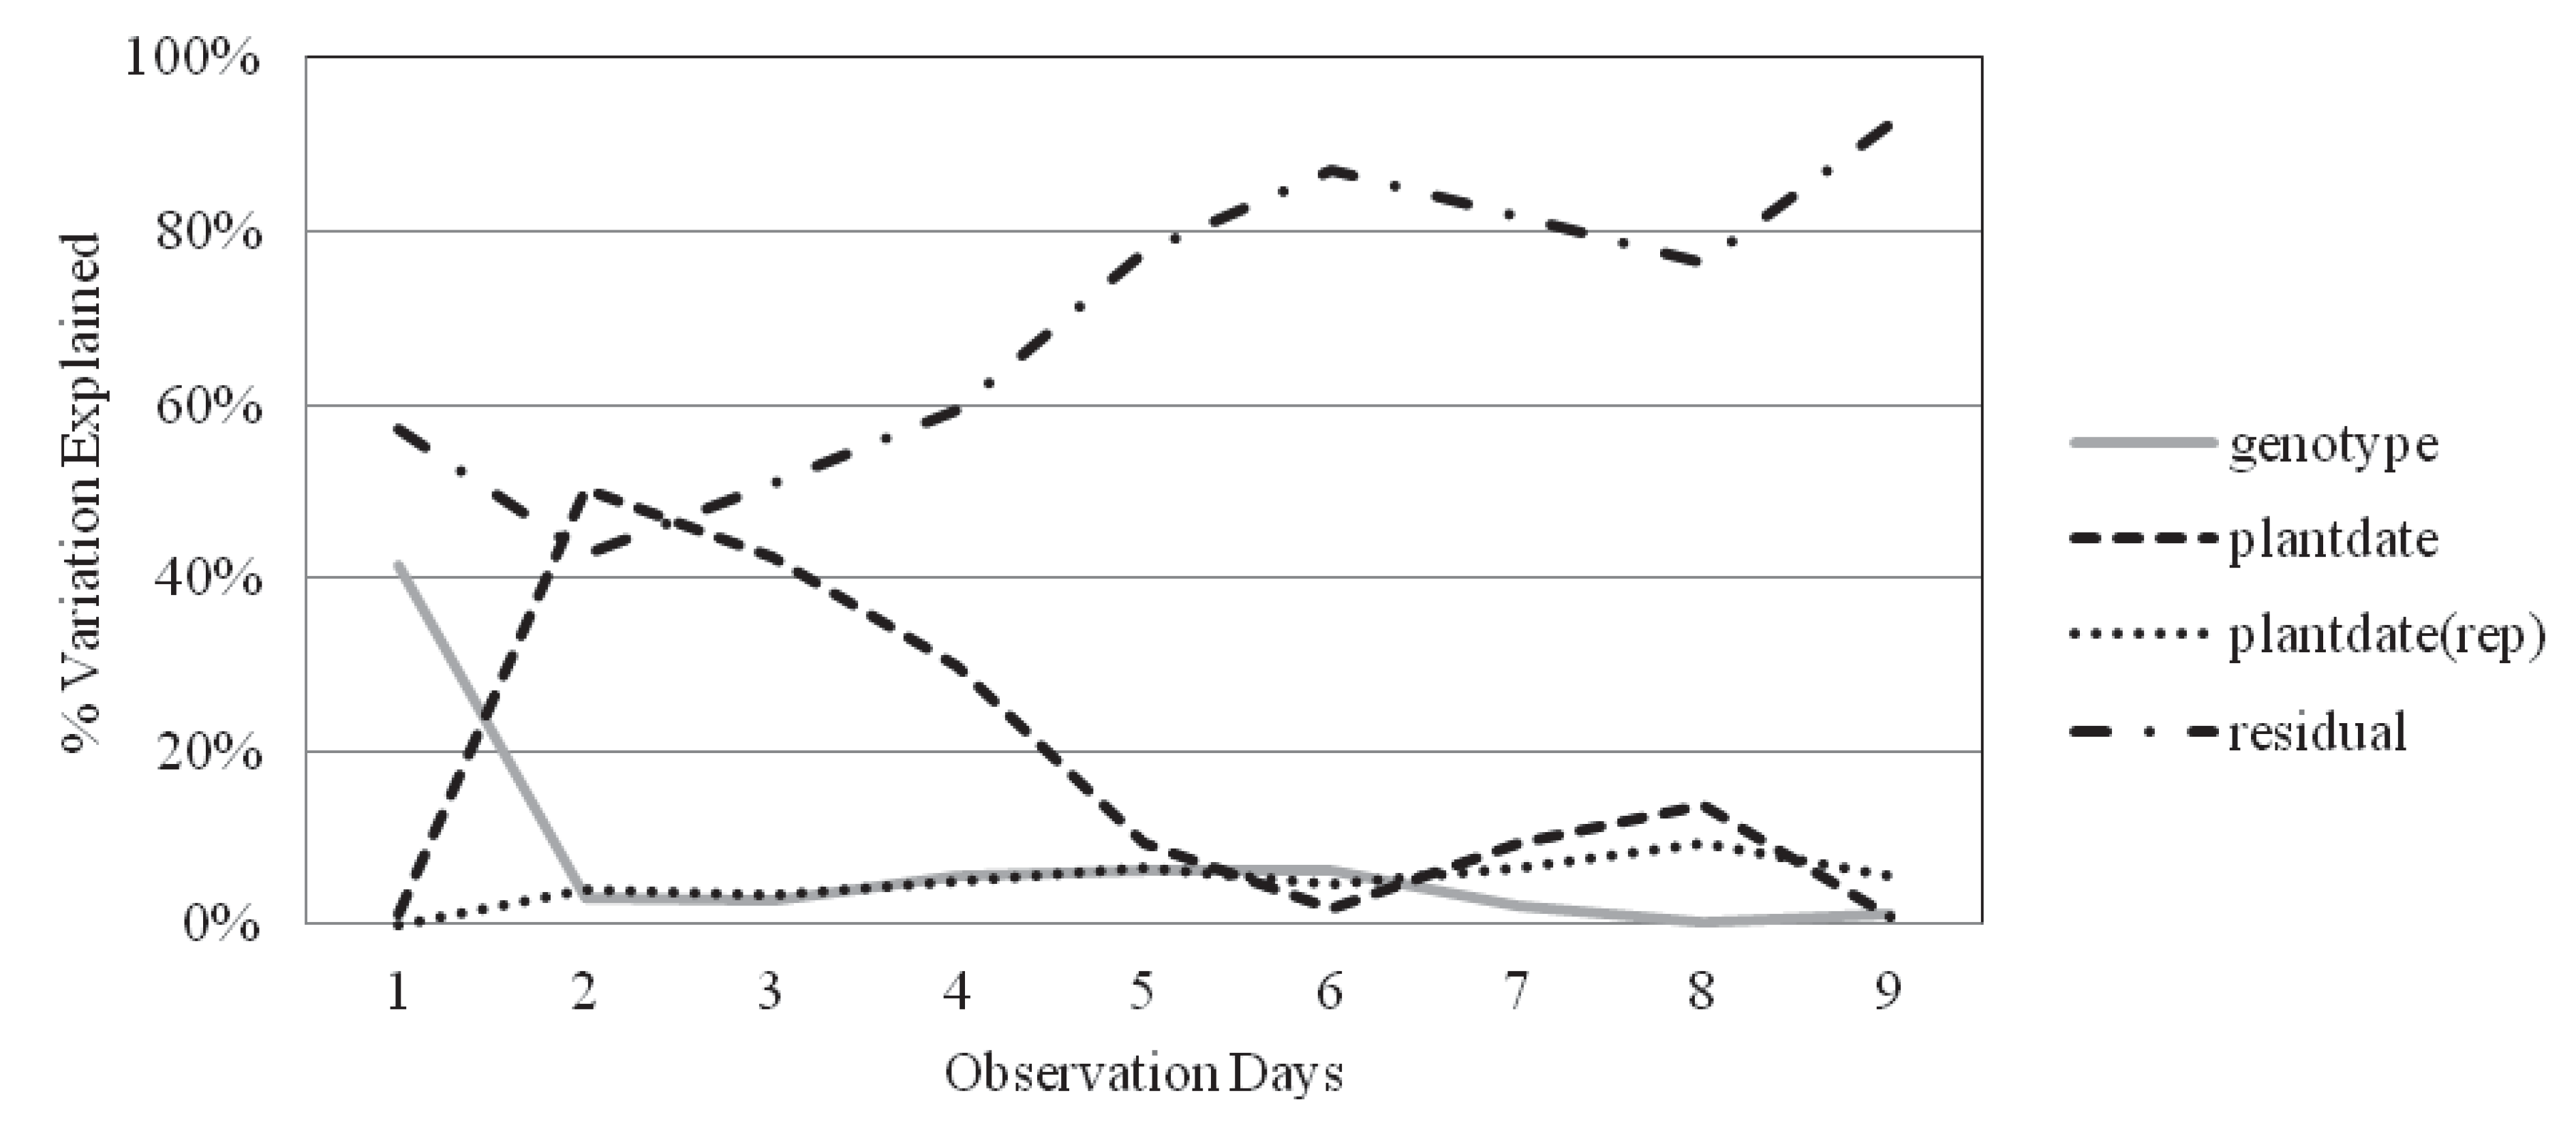
2.2. Survival and Recovery

As day length and temperatures progressed into summer, the total number of observation days to measure drought susceptibility decreased. Germination of inbred lines plateaued 11 days after planting, three days longer than hybrid testcrosses. Survival percentages were recorded on observation days one to four, and recovery percentages on days five to nine. Because observations were generally taken every other day, the survival cycle lasted 14 (inbred) and 11 (hybrid) average calendar days, while the recovery cycle lasted 10 (inbred) and 9 (hybrid) average calendar days following a re-watering at the end of the survival cycle.
The third observation day, five calendar days after the first observation, best explained genetic variation among inbred genotypes where the percentage of observed variation for genotype was maximized at 6.56% of the total experimental variation (Figure 1). Experimental error (residual) accounted for the largest source of variation for all days (Table 2) and therefore broad-sense heritability of inbred seedling drought tolerance was low (H2 = 0.32). This genetic variation differed enough that three inbred lines were identified as having significant (P < 0.05) above average percent survival (Table 3).
Table 2. Variance components, the percentage of observed variation they explain, and the broad-sense heritability estimates for inbred and hybrid genotypes on the observation day where the percent variation was highest for genotype.
Obs. dayGenotypePlantdatePlantdate(rep)Residual errorH2
Inbred36.56%0.80%7.68%84.96%0.32
Hybrid66.25%1.99%4.79%86.98%0.37
Table 3. Inbred line genotypes with significant (P < 0.05) percent survival on the 3rd observation day, the day with highest genetic variance.
GenotypePedigree% Survival
1((B104/CML285-B-2-B-B-B-B-B) 53
7((B104/NC300)-B-1-B-1-B-B-B-B)53
23(CML78 × CML269-B-B-B-B-B))54
Mean29
Figure 1. Inbred line performance across observation days depicting percent variation explained by genotype, planting date, replication within planting date and residual error for all 6 replications. The 3rd observation day had the highest percentage of variation among genotypes.
Agronomy 03 00135 g001
The sixth observation day best explained variation among hybrid genotypes where the percentage of observed variation for genotype was maximized at 6.25% of the total experimental variation (Figure 2, Table 2). As the cycles progressed, the effect of planting date explained less variation while residual error increased. The effect of replicate variation nested within planting date remained relatively constant throughout both cycles. Fourteen hybrid testcross combinations were identified as having significantly (P < 0.05) above average percent recovery (Table 4). Among these was a testcross with Tx204, a released inbred line documented for having excellent drought tolerance [24]. Variance components were similar to those seen in the inbred lines (Table 3) and heritability of hybrid seedling drought tolerance was also low (H2 = 0.37).
Figure 2. Hybrid testcross performance across observation days depicting percent variation explained by genotype, planting date, replication in planting date and residual error. The 6th observation day had the highest percentage of variation for genotype.
Agronomy 03 00135 g002
Table 4. Hybrid testcross genotypes significantly different for percent recovery on the 6th observation day, the day with the highest genetic variance.
GenotypeInbred pedigree testcrossed to LH195 × LH287 % RecoverySignificance
2Tx770/CML288-B-3-B-B-B-B-B29*
13(Tx601 × B104-B/FR2128 × Unknown)-2-2-B-B-B-B-B25*
18((Tx772 × T246) × Tx772)-1-5-B-B-B-B-B-B28*
28CML269/TX130-B-B-B-1-3-B-B-B-B-B25*
31Ethiopia12-B-3-3-B-B2-B1-2-B(blue)44***
38CML325-B-B-B-B-B-B-B-B-B25*
39NC280-B-B-B-B-B-B26*
42B73-B-B-B-B-B-B-B-B28*
47Tx760-B-B-B-B-B-B-B34**
50FR2128-B-B-B-B-B-B-B25*
54S2B73BC25*
57C3S1B73-3-329*
58C3S1B73-3-136**
61Tx20424*
Mean16
* P < 0.05; ** P < 0.01; *** P < 0.001.

2.5. Inbred-Hybrid Correlation

Low broad-sense heritability numbers for both inbred lines and hybrids suggest that there is low genetic variance in the population for this trait. However, inbred lines and hybrids with significantly improved variation were identifiable suggesting that there is unique seedling drought tolerant variation present in some lines. When compared to cowpea, cotton, and wheat measurements similar numbers of significantly different genotypes were identified [15,20,21,22]. However, these authors did not report experimental error variance or heritability so it is not possible to compare these estimates.
Since the first year progeny of hybrid testcrosses were products of each of the original 62 inbred line genotypes, we hoped drought tolerance in the inbred line trial would predict hybrid testcross performance. However, the data does not support this hypothesis. No genotype was significantly different as both an inbred line and a hybrid testcross and no relationship was found between inbred lines and hybrids (R2 = 0.03) (Figure 3). In comparing the performance of LH195 × LH287 to each of its inbred line parents, it demonstrated similar germination and survival percentages to its female parent, LH195. Studies using seedling screening in cowpea, cotton and wheat have only looked at lines per se and not the inheritance to hybrids as these crops are not traditionally grown as hybrids [15,21,22,25].
Figure 3. Inbred-hybrid correlation between the 3rd and 6th observation days for inbred lines and hybrid testcrosses respectively.
Agronomy 03 00135 g003

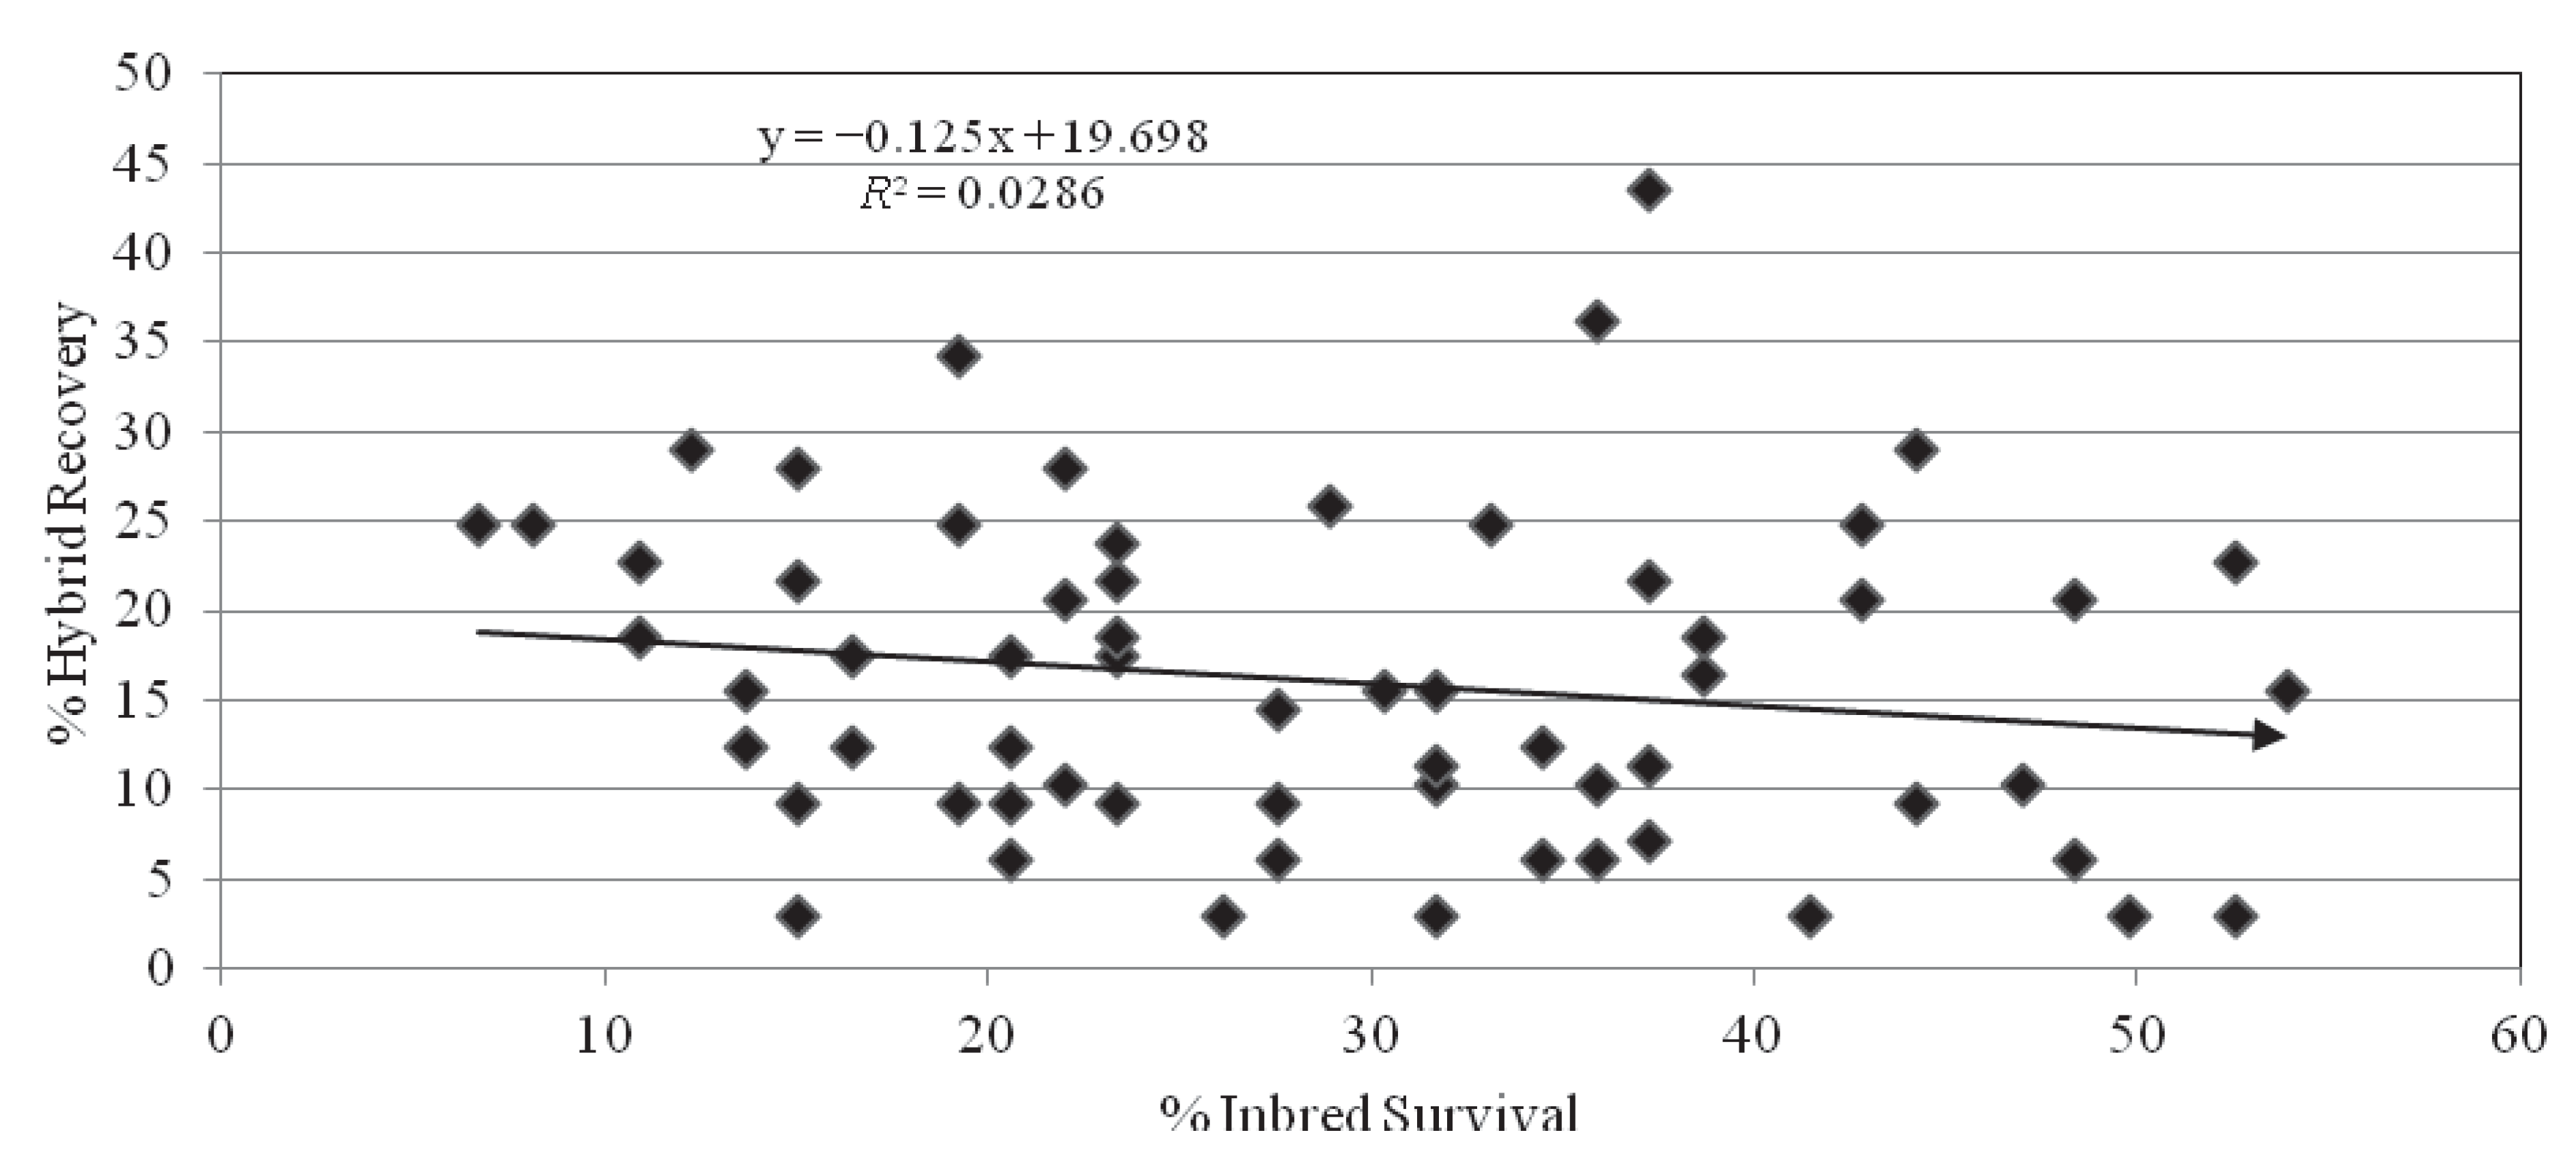
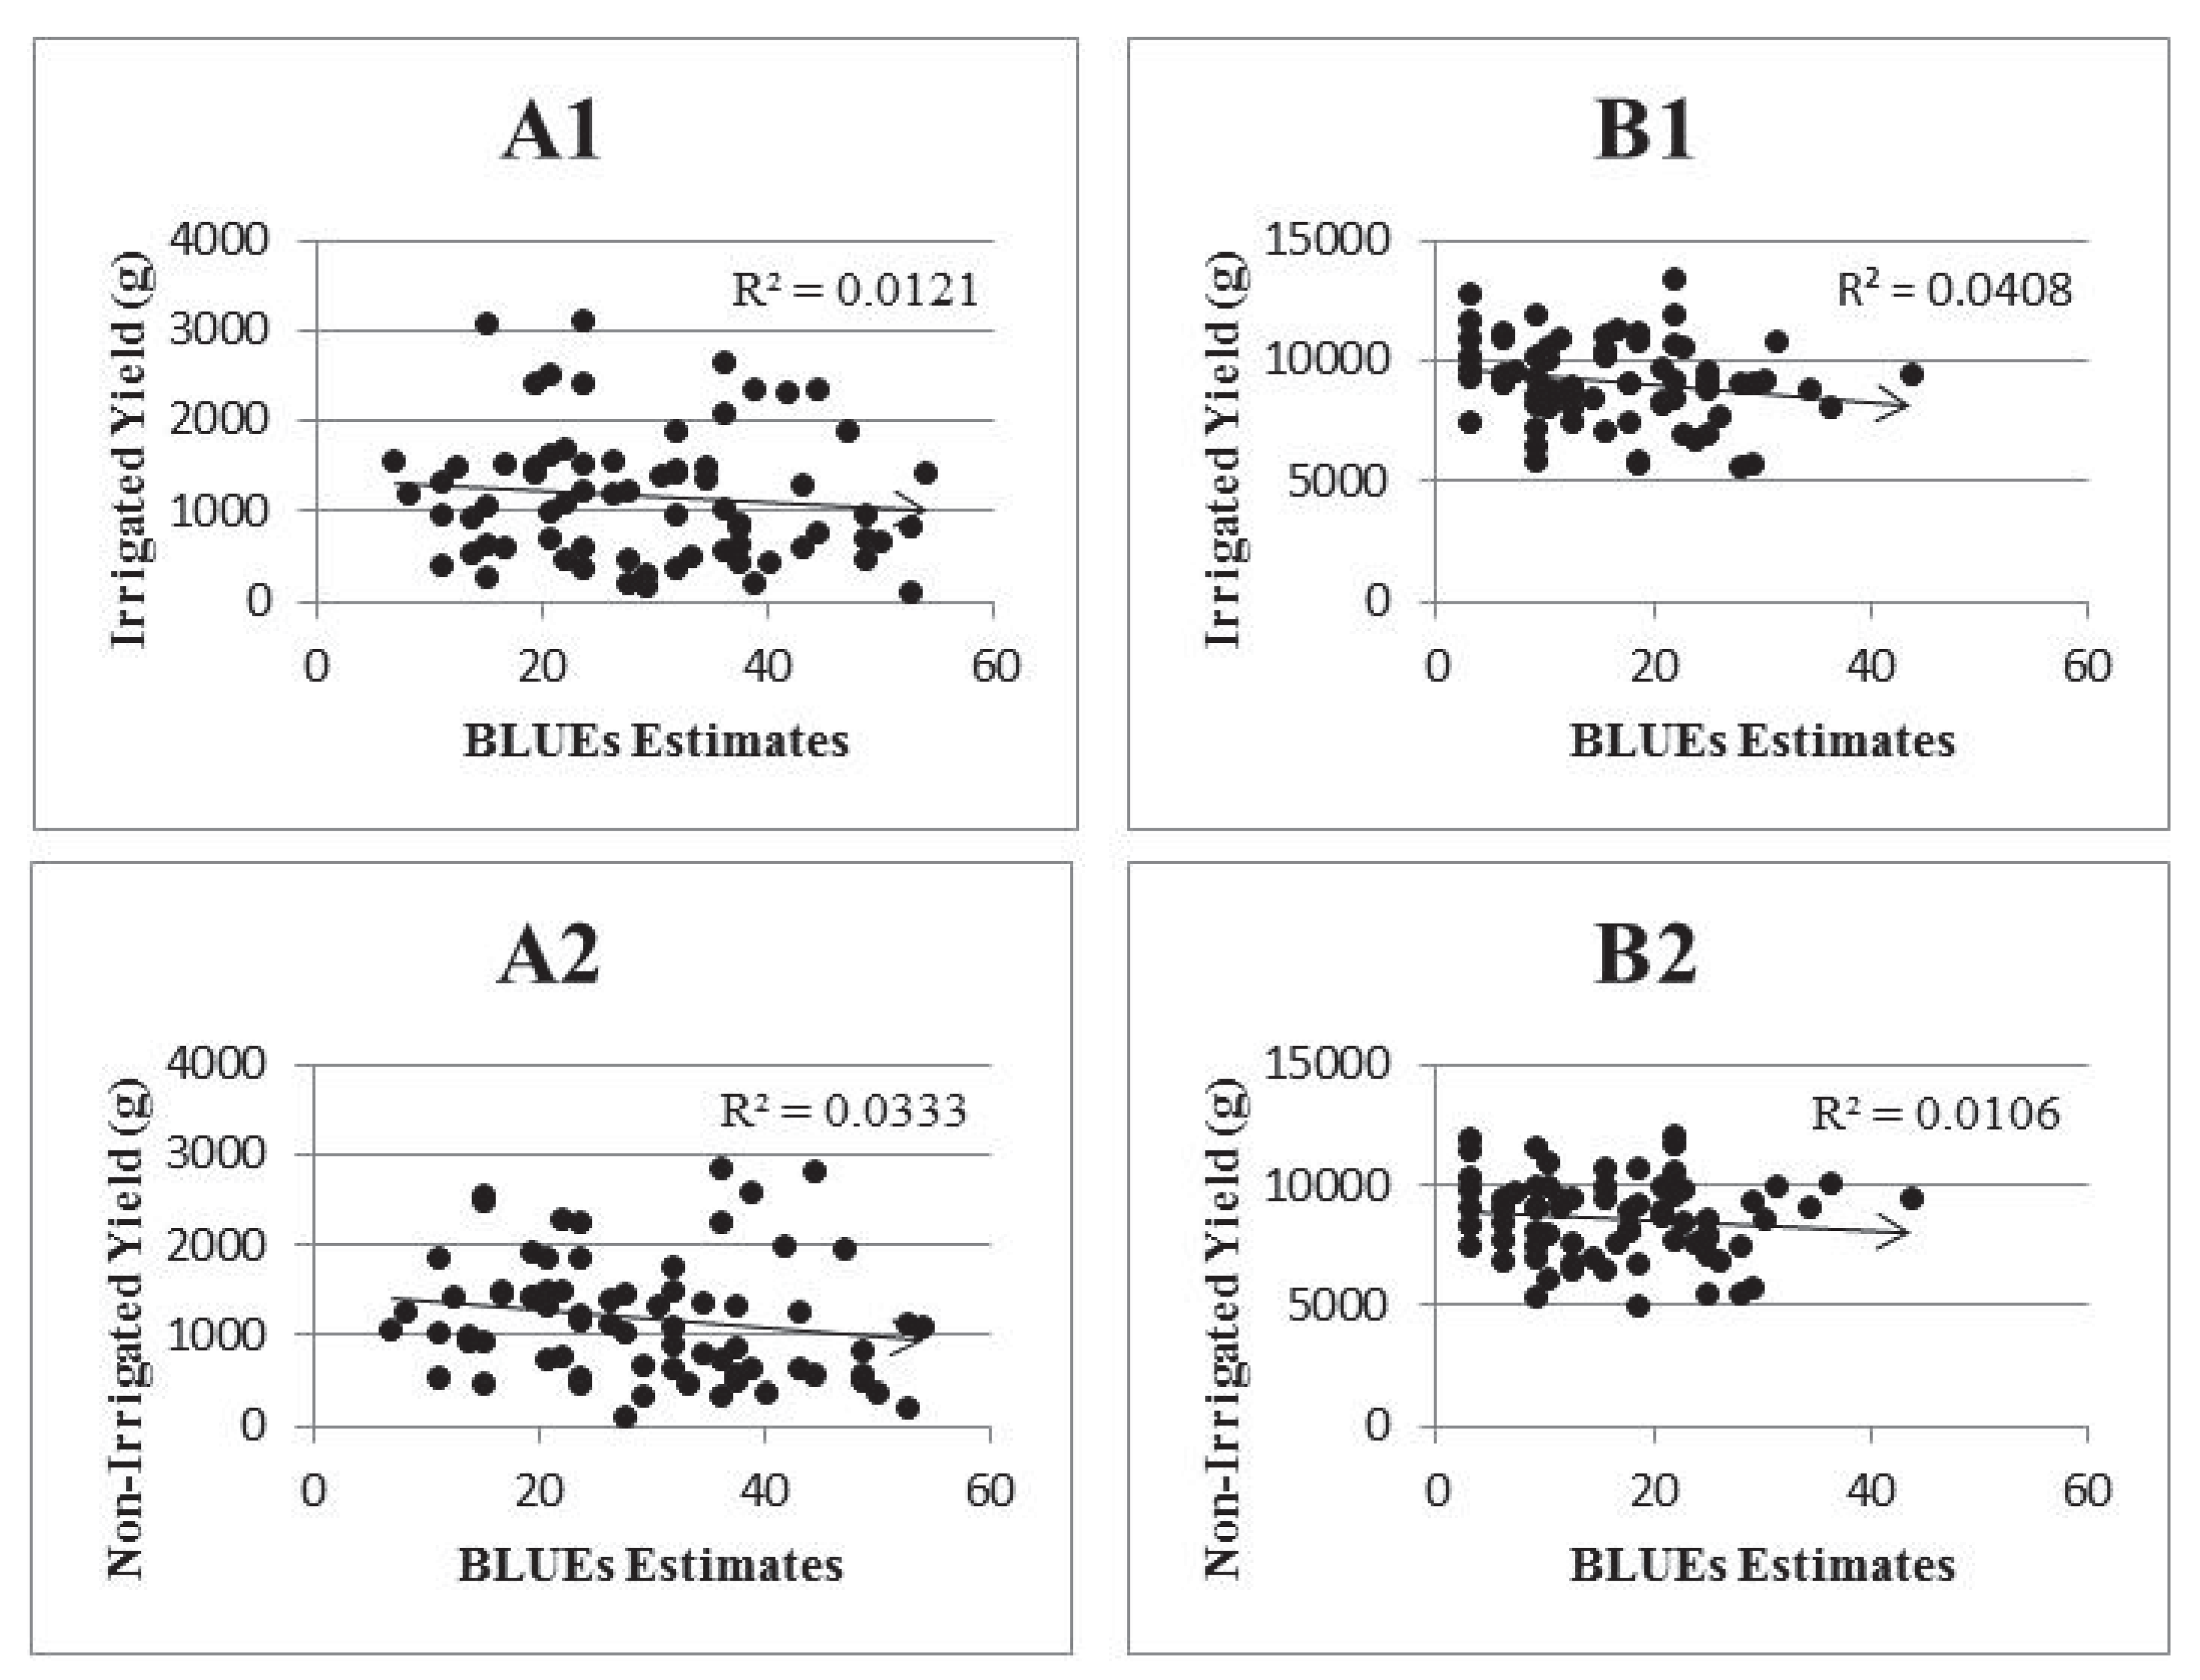
2.6. Correlation with Field Results

The environmental conditions for screening the inbred lines in 2009 for both College Station and Weslaco, Texas were very dry due to a drought, however, both were less dry in 2010 and neither had drought stress at the seedling level. While the inbred lines performed poorly in 2009, the inbred line checks, selected from the 2009 extremes and used in 2010, were outperformed by the hybrid plants in overall plant survival. In comparing the unbiased estimates (BLUEs) from both the inbred and hybrid seedling results with their respective yield data from the field study conducted by [17], both plant types had non-significant, negative correlations for the irrigated, non-irrigated (Figure 4) and overall (Table 5) yield comparisons. This suggests that mechanisms controlling variation for seedling stress response did not significantly affect yield loss at later stages. Therefore seedling drought tolerance may involve novel mechanisms and pathways that have not previously been explored.
Table 5. Inbred and hybrid overall grain yield correlations when plotted against the BLUEs estimates for each genotype, their confidence intervals, and respective p-values.
rR2Upper 95%Lower 95%P-value
Inbred−0.150.02−0.370.090.21
Hybrid−0.170.03−0.390.070.19
Figure 4. Correlations for each (A) inbred and (B) hybrid genotype between the BLUEs estimates produced from seedling results and irrigated yield (A1, B1), non-irrigated yield (A2, B2), from field experiments.
Agronomy 03 00135 g004
Seedling drought tolerance was able to be directly associated with increased yield under drought for cowpea [15,20] and there are three primary explanations for why we did not seen this in maize. First, drought screening yield trial environments can be very different depending on onset of stress, humidity, residual soil moisture, etc. [4,6,18]. It is possible that this field study simply did not have the right type of drought stress or intense enough stress to correlate seedling drought tolerance with yield. Second, in cowpea this response appears to be qualitative, controlled by a single large effect gene, while in maize it appears to be a quantitative trait with small effects which are more difficult to correlate [15,20]. Third and similarly, yield under drought stress is a highly quantitative trait in part because there are many contributing mechanisms and secondary traits. Lines with high genetic diversity were intentionally selected for this panel to determine if genetic variance for seedling drought tolerance existed. Genetic variance for additional traits expected to be segregating in the panel, such as ASI [9,10], adult plant rooting depth [11], hydraulic lift [12] and others, may have played a greater role in drought yield than drought tolerance conditioned at the seedling stage. As important secondary traits such as ASI are fixed in a population, other secondary traits will then play a more important role [5]. Therefore, we hypothesize that if a biparental population segregating for seedling drought tolerance but with few other secondary traits was screened, that the effect conditioning yield in the progeny would be more measurable.

3. Experimental Section

Germplasm seedlings were evaluated under greenhouse conditions at the Institute for Plant Genomics and Biotechnology at Texas A&M University from January–May 2009 and during the same months in 2010. The first year of the experiment evaluated inbred lines under simulated drought conditions while the second year’s experiment evaluated hybrid testcross progeny under a similar limited water irrigation regime.

3.1. Germplasm

Germplasm was comprised of 62 diverse maize inbred lines and two inbred line commercial checks (Supplementary Table S1). Plant breeders at Texas AgriLife Research stations in College Station and Lubbock, TX developed 55 of the inbred lines from diverse germplasm sources. Six of the Texas AgriLife lines have been released [26,27,28,29,30] with the rest being “elite” inbreds from other programs, only some of which have been formally released [30,31]. Overall, germplasm consisted of a wide array of grain colors and genetic backgrounds, including yellow, white, red and blue grain types derived from tropical, Argentine and temperate origins. Each of these 62 inbred lines were testcrossed in a College Station, TX, USA field nursery in 2009 to a single-cross stiff-stalk × non-stiff-stalk hybrid parent (LH195 × LH287) [32,33]. This hybrid was chosen as a parent because the various inbred lines are of diverse stiff stalk, non-stiff-stalk, and tropical heterotic patterns and this allowed the use of a common tester. In 2010, testcross progeny were evaluated as well as additional checks that included two of the extreme inbred lines from 2009 and the hybrid parent.

3.2. Experimental Design

The method was initially based on Singh et al.’s (1999) method for cowpea [15] and Longenberger et al.’s (2006) method for cotton [21], with modifications to fit the unique growth and development habits of maize. Multiple soil media were tested to determine which was the most appropriate for simulating drought. Soil moisture was too difficult to control in Metro-Mix 300 potting soil and a Texas river bottom soil (Ships clay loam Vertisol) used in the field study; the plants outgrew the containers with both soils before showing signs of stress. Washed river sand proved the only practical growth medium tested for the study. Washed river sand was placed in RLC7 stubby cell (3.8 cm diameter) UV-stabilized cone-tainers™ (Stuewe and Sons, Inc., Tangent, OR, USA) in trays with a cotton ball at the base of each cone-tainer™. The experiment was a completely randomized design with 70 entries per replication including four replications of two checks.
Four seeds were planted for each entry (genotype) into individual cone-tainers™, one seed each at a depth of 2.5cm. An equivalent volume of sand was included in each cone-tainer™. Cone-tainers for each entry were grouped in a square block. Individual containers eliminated interplant competition for water resources, and grouping them allowed a quantitative measurement of survival. The inbred line trial in 2009 and testcross hybrid trial in 2010 had two planting dates each, with six and eight replications, respectively (Table 6). Sets of replications were staggered over weeks to disperse labor requirements. Cone-tainers™ were irrigated to field capacity before covering with plastic wrap to aid germination. The plastic wrap was removed when germination plateaued. Seedlings were irrigated to capacity to initiate the first cycle and again when the majority of plants withered to begin each successive cycle. Seedling survival was quantified every other day during the first seven calendar days, for a total of four observation days. Two days after re-watering, recovery percentages were calculated every other day for nine days, for a total of five observation days. There were a total of nine observation days.
Table 6. Plant type, replications, planting dates, and irrigation events.
Year (Plant Type)ReplicationPlanting Date1st Irrigation2nd Irrigation
2009 (Inbred)1 & 23/123/223/29
3, 4, 5 & 64/174/275/2
2010 (Hybrid)1, 2, 3 & 41/221/302/7
5, 6, 7 & 82/192/273/5

3.2. Germination Percentage

Emerging seedlings were enumerated daily with a maximum of four plants per genotype in each replication. For example, three seedlings germinated out of four equates to 75%. This percentage was then averaged across all replications each year to determine the average germination percentage per genotype.

3.3. Survival and Recovery Percentages

Plant survival was initiated when most seedlings in the replicate were at approximately the second leaf stage. Subjective ratings were made on a binomial scale of “tolerant” or “susceptible” by the same investigator (M. Meeks). While initially treated as separate states, wilting, curling, discoloration and death observations were combined and denoted as “susceptible”. When the majority of the seedlings in the replicate had succumbed to one or more of these symptoms, irrigation was provided to induce the recovery cycle. Measurements for recovery began two days later. Recovery was measured using the same criteria as survival, where only turgid plants were recorded as “tolerant”. Survival and recovery percentages were derived by dividing the number of tolerant plants for each genotype each observation day by its recorded total number germinated. These quantitative data were used for statistical analysis.

3.4. Field Study

In a separate field study using the same genotypes [17], explained here in brief, these same entries were planted in two locations College Station, TX, USA and Weslaco, TX, USA in 2009 and 2010. The experiments were laid out in a randomized complete block design with all seventy entries. In both locations, all entries were randomized in each of two replications and two irrigation blocks giving a total of four data points per location. In each plot twenty-five seed were sown every five meters. Treatments were full and limited irrigation blocks irrigated by furrow irrigation with approximately 7.6 cm of water at each irrigation event. Full irrigation blocks received water at least once more than limited irrigation blocks. Water was withheld throughout the lifecycle of plants but with special attention at flowering in the limited irrigation blocks to induce a stress response. The exception was when plants exhibited signs of severe stress and would not survive without water. Measurement of plot water status is presented in [17]. Although the main objective of [17] was to use epicuticular wax as a drought tolerance identifier, grain yield was also measured. Ears were hand harvested and shelled to give total plot yield.

3.5. Statistical Analysis

The greenhouse trials in 2009 (inbred) and 2010 (hybrid) were analyzed separately. Models for analysis used genotype, planting date (plantdate), and replication nested within planting date (plantdate(rep)) as random effects for obtaining variance components calculated at each observation day. The percentage of observed variation explained was calculated by dividing variance component estimates by total variance. Broad-sense heritability was calculated on an entry mean basis. For the observation days in which the maximum variation in genotypes was explained, genotypes were treated as fixed effects to obtain best linear unbiased estimates (BLUEs). These observation days were also used to determine which genotypes were significantly tolerant by least square means. The SAS 9.2 (SAS Institute, Inc. SAS 9.2. Cary, NC, USA) PROC MIXED procedure was used for these analyses. Correlations between seedling unbiased estimates and grain yield data were analyzed using the multivariate method in JMP® Pro (SAS Institute Inc. 2011).

4. Conclusions

To be considered drought tolerant, plants need to sustain themselves through periods of drought and produce sufficient grain at season’s end. The materials and methods used for the seedling screening provided high-throughput evaluation of genotypes that might assist with this and had not been previously reported. Growing maize in sand allowed quick drainage and visualization of drought effects while providing enough moisture for seedling development. This study demonstrates that maize seedling drought tolerance has enough obvious and significant quantitative genetic variation in diverse germplasm to allow statistical separation in means for both inbred lines and testcrossed hybrids. Maize breeders generally perform initial field selection on inbred lines based on important easily selected and transmitted phenotypes; these inbred lines are then crossed to a tester genotype to evaluate their combining ability in hybrids and the best hybrid combinations will eventually be grown by farmers. This seedling screening method however is not practically useful in predicting hybrid performance from inbred lines and should be used as a secondary screening measure on hybrids themselves. Like many traits involved in drought tolerance, seedling drought tolerance conditions quantitative variation with small effects. The effect of seedling drought tolerance on grain yield in the field was not significant in this study possibly due to the sample of screening environments used and the high genetic diversity that segregated for other traits conditioning drought tolerance. Additional experiments are needed to determine how well seedling drought tolerance can predict stability of yield under drought in different environments and genetic backgrounds.
Maize breeders may use this method as a replicated screening procedure to expedite single-cross hybrid selection, confirm a response to field drought stress in the off-season before planting yield trials, or screen germplasm in phenomics studies for drought tolerance genes/alleles to better understand these genetic and biochemical pathways.

Conflict of Interest

The authors declare no conflict of interest.

Acknowledgments

We thank the many colleagues and student workers who graciously helped make this research possible. We thank Beto Garza and the Weslaco Center with assistance in field trials. Funding for this research was provided by the Texas A & M Department of Soil and Crop Sciences and the Texas Corn Producers Board.

References

  1. Battisti, D.S.; Naylor, R.L. Historical warnings of future food insecurity with unprecedented seasonal heat. Science 2009, 323, 240–244. [Google Scholar] [CrossRef]
  2. Lobell, D.B.; Schlenker, W.; Costa-Roberts, J. Climate trends and global crop production since 1980. Science 2011, 333, 616. [Google Scholar] [CrossRef]
  3. Mishra, V.; Cherkauer, K.A. Retrospective droughts in the crop growing season: Implications to corn and soybean yield in the midwestern united states. Agric. For. Meteorol. 2010, 150, 1030–1045. [Google Scholar] [CrossRef]
  4. Campos, H.; Cooper, M.; Habben, J.; Edmeades, G.; Schussler, J. Improving drought tolerance in maize: A view from industry. Field Crops Res. 2004, 90, 19–34. [Google Scholar] [CrossRef]
  5. Ribaut, J.M.; Betran, J.; Monneveux, P.; Setter, T. Drought tolerance in maize. In Handbook of Maize: Its Biology; Bennetzen, J.L., Hake, S.C., Eds.; Springer: New York, NY, USA, 2009; pp. 311–344. [Google Scholar]
  6. Richards, R. Defining selection criteria to improve yield under drought. Plant Growth Regul. 1996, 20, 157–166. [Google Scholar] [CrossRef]
  7. Obeng-Bio, E.; Bonsu, M.; Obeng-Antwi, K.; Akromah, R. Establishing the basis for drought tolerance in maize (Zea mays l.) using some secondary traits in the field. Afr. J. Plant Sci. 2011, 5, 702–709. [Google Scholar]
  8. Bruce, W.B.; Edmeades, G.O.; Barker, T.C. Molecular and physiological approaches to maize improvement for drought tolerance. J. Exp. Bot. 2002, 53, 13–25. [Google Scholar] [CrossRef]
  9. Betran, F.; Beck, D.; Bänziger, M.; Edmeades, G. Secondary traits in parental inbreds and hybrids under stress and non-stress environments in tropical maize. Field Crops Res. 2003, 83, 51–65. [Google Scholar] [CrossRef]
  10. Bolanos, J.; Edmeades, G. The importance of the anthesis-silking interval in breeding for drought tolerance in tropical maize. Field Crops Res. 1996, 48, 65–80. [Google Scholar] [CrossRef]
  11. Ludlow, M.; Muchow, R. A critical evaluation of traits for improving crop yields in water-limited environments. Adv. Agron. 1990, 43, 107–153. [Google Scholar] [CrossRef]
  12. Wan, C.; Xu, W.; Sosebee, R.E.; Machado, S.; Archer, T. Hydraulic lift in drought-tolerant and-susceptible maize hybrids. Plant Soil 2000, 219, 117–126. [Google Scholar] [CrossRef]
  13. Muenchrath, D.A. Morphological and physiological characterization of a desert adapted traditional native american maize (zea mays l.) cultivar. Ph.D. thesis, Iowa State University, Ames, IA, USA, 1995. [Google Scholar]
  14. Bänziger, M.; Setimela, P.; Hodson, D.; Vivek, B. Breeding for improved drought tolerance in maize adapted to southern africa. Agric. Water Manage. 2006, 80, 212–214. [Google Scholar] [CrossRef]
  15. Singh, B.; Mai-Kodomi, Y.; Terao, T. A simple screening method for drought tolerance in cowpea. Indian J. Genet. Plant Breed. 1999, 59, 211–220. [Google Scholar]
  16. Ristic, Z.; Jenks, M.A. Leaf cuticle and water loss in maize lines differing in dehydration avoidance. J. Plant Physiol. 2002, 159, 645–651. [Google Scholar] [CrossRef]
  17. Meeks, M.; Murray, S.; Hague, S.; Hays, D.; Ibrahim, A. Genetic variation for maize epicuticular wax response to drought stress at flowering. J. Agron. Crop Sci. 2012, 198, 161–172. [Google Scholar] [CrossRef]
  18. Collins, N.C.; Tardieu, F.; Tuberosa, R. Quantitative trait loci and crop performance under abiotic stress: Where do we stand? Plant Physiol. 2008, 147, 469–486. [Google Scholar] [CrossRef]
  19. Bänziger, M.; Araus, J.L. Recent advances in breeding maize for drought and salinity stress tolerance. In Advances in Molecular Breeding toward Drought and Salt Tolerant Crops; Jenks, M.A., Hasegawa, P.M., Jain, S.M., Eds.; Springer: Dordrecht, Netherlands, 2007; pp. 587–601. [Google Scholar]
  20. Singh, B.B.; Matsui, T. Cowpea varieties for drought tolerance. In Challenges and Opportunities for Enhancing Sustainable Cowpea Production, Proceedings of the World Cowpea Conference III Held at the International Institute of Tropical Agriculture (IITA), Ibadan, Nigeria, 4–8 September 2000; Fatokun, C.A., Tarawali, S.A., Singh, B.B., Kormawa, P.M., Tamò, M., Eds.; IITA: Ibadan, Nigeria, 2002; pp. 287–300. [Google Scholar]
  21. Longenberger, P.S.; Smith, C.; Thaxton, P.; McMichael, B. Development of a screening method for drought tolerance in cotton seedlings. Crop Sci. 2006, 46, 2104–2110. [Google Scholar] [CrossRef]
  22. Tomar, S.; Kumar, G. Seedling survivability as a selection criterion for drought tolerance in wheat. Plant Breed. 2004, 123, 392–394. [Google Scholar] [CrossRef]
  23. Banziger, M.; Edmeades, G.; Quarrie, S. Drought stress at seedling stage-are there genetic solutions? In Proceedings of a Symposium, El Batan, Mexico, 25–29 March 1996; CIMMYT: El Batan, Mexico, 1997. [Google Scholar]
  24. Xu, W.; Odvody, G.; Williams, W.P. Tx204 and Tx205 inbred lines. Germplasm Enhancement of Maize (GEM); Annual Report. USDA-ARS: Lubbock, TX, USA, 2004. Available online: http://www.public.iastate.edu/~usda-gem/GEM_Annual_Reports/GEM_AR_04.htm#SCA (accessed on 6 February 2013).
  25. Singh, B.; Matsui, T. Cowpea varieties for drought tolerance. In Challenges and Opportunities for Enhancing Sustainable Cowpea Production; IITA: Ibadan, Nigeria, 2002; pp. 287–300. [Google Scholar]
  26. Betrán, F.; Fojt, A.; Mayfield, F.; K Pietsch, D. Registration of Tx714 maize germplasm line. Crop Sci. 2004, 44, 1028. [Google Scholar] [CrossRef]
  27. Betrán, F.J.; Bockholt, A.; Fojt, F.; Mayfield, K. Registration of Tx732 maize germplasm line. Crop Sci. 2004, 44, 1028–1029. [Google Scholar] [CrossRef]
  28. Betrán, F.J.; Bockholt, A.; Fojt, F.; Mayfield, K. Registration of Tx770 maize germplasm line. Crop Sci. 2004, 44, 1029–1030. [Google Scholar] [CrossRef]
  29. Llorente, C.; Fojt, F.; Bockholt, A.; Betrán, F. Registration of Tx772 maize. Crop Sci. 2004, 44, 1036–1037. [Google Scholar] [CrossRef]
  30. Hallauer, A.R.; Lamkey, K.R.; White, P.R. Registration of five inbred lines of maize: B102, B103, B104, B105, and B106. Crop Sci. 1997, 37, 1405–1406. [Google Scholar] [CrossRef]
  31. Russell, W. Registration of B70 and B73 parental lines of maize (reg. Nos. Pl16 and pl17). Crop Sci. 1972, 12, 721–721. [Google Scholar] [CrossRef]
  32. Foley, T.J. Inbred corn line LH195. U.S. Patent No. 5,059,745, 22 October 1991. [Google Scholar]
  33. Foley, T.J. Inbred corn line LH287. U.S. Patent No. 6,281,414, 28 August 2001. [Google Scholar]

