Review

Pea (Pisum sativum L.) in the Genomic Era

1
Agritec Plant Research Ltd., Šumperk 787 01, Czech Republic
2
Department of Botany, Palacký University, Olomouc 783 71, Czech Republic
3
INRA-UMRLEG, Dijon 21065, France
4
Western Regional Plant Introduction Station, USDA, Pullman, WA 99164-6402, USA
5
Institute of Biological, Environmental & Rural Sciences, Aberystwyth University, SY23 3DA, UK
6
Division of Plant Sciences, University of Dundee at SCRI, Invergowrie, Dundee DD3 6HG, UK
7
Department of Agriculture and Food Systems, The University of Melbourne, Victoria 3010, Australia
8
Biology Centre ASCR, Institute of Plant Molecular Biology, České Budějovice 370 05, Czech Republic
9
North Dakota State University, Department of Plant Sciences, Fargo, ND 58105, USA
10
Australian Temperate Field Crops Collection, Horsham 3401, Australia
11
Institute for Sustainable Agriculture, CSIC, Córdoba 14080, Spain
12
School of Plant Science, University of Tasmania, Hobart, Tasmania 7001, Australia
13
Crop Development Centre, University of Saskatchewan, Saskatoon S7N 5A8, Canada
*
Author to whom correspondence should be addressed.
Agronomy 2012, 2(2), 74-115; https://doi.org/10.3390/agronomy2020074
Submission received: 13 December 2011 / Revised: 29 February 2012 / Accepted: 18 March 2012 / Published: 4 April 2012
(This article belongs to the Special Issue Impact of Genomics Technologies on Crop Breeding Strategies)

Abstract

:
Pea (Pisum sativum L.) was the original model organism used in Mendel’s discovery (1866) of the laws of inheritance, making it the foundation of modern plant genetics. However, subsequent progress in pea genomics has lagged behind many other plant species. Although the size and repetitive nature of the pea genome has so far restricted its sequencing, comprehensive genomic and post genomic resources already exist. These include BAC libraries, several types of molecular marker sets, both transcriptome and proteome datasets and mutant populations for reverse genetics. The availability of the full genome sequences of three legume species has offered significant opportunities for genome wide comparison revealing synteny and co-linearity to pea. A combination of a candidate gene and colinearity approach has successfully led to the identification of genes underlying agronomically important traits including virus resistances and plant architecture. Some of this knowledge has already been applied to marker assisted selection (MAS) programs, increasing precision and shortening the breeding cycle. Yet, complete translation of marker discovery to pea breeding is still to be achieved. Molecular analysis of pea collections has shown that although substantial variation is present within the cultivated genepool, wild material offers the possibility to incorporate novel traits that may have been inadvertently eliminated. Association mapping analysis of diverse pea germplasm promises to identify genetic variation related to desirable agronomic traits, which are historically difficult to breed for in a traditional manner. The availability of high throughput ‘omics’ methodologies offers great promise for the development of novel, highly accurate selective breeding tools for improved pea genotypes that are sustainable under current and future climates and farming systems.

Graphical Abstract

1. Introduction

Pea belongs to the Leguminosae family (Genus: Pisum, subfamily: Faboideae tribe: Fabeae), which has an important ecological advantage because it contributes to the development of low-input farming systems by fixing atmospheric nitrogen and it serves as a break crop which further minimizes the need for external inputs. Legumes constitute the third largest family of flowering plants, comprising more than 650 genera and 18,000 species [1]. Economically, legumes represent the second most important family of crop plants after Poaceae (grass family), accounting for approximately 27% of the world's crop production [2]. Dry pea currently ranks second only to common bean as the most widely grown grain legume in the world with primary production in temperate regions and global production of 10.4 M tonnes in 2009 [3]. Pea seeds are rich in protein (23–25%), slowly digestible starch (50%), soluble sugars (5%), fiber, minerals and vitamins [4]. On a worldwide basis, legumes contribute about one-third of humankind's direct protein intake, while also serving as an important source of fodder and forage for animals and of edible and industrial oils. One of the most important attributes of legumes is their capacity for symbiotic nitrogen fixation, underscoring their importance as a source of nitrogen in both natural and agricultural ecosystems [5]. Legumes also accumulate natural products (secondary metabolites) such as isoflavonoids that are considered beneficial to human health through anticancer and other health-promoting activities [6]. Pea has also been a model system in plant biology since the work of Gregor Mendel [7,8].
The fundamental discoveries of Mendel and Darwin established the scientific basis of modern plant breeding in the beginning of the 20th century. Similarly, current progress in molecular biology, genetic and biotechnology has revolutionized plant breeding, allowing a shift toward molecular plant breeding and adding to its interdisciplinary nature [9]. However, although the methods have been available for over a decade, there is still a large gap between plant biologists engaged in basic research and plant breeders. In this review we summarize the current status of pea genetics, genomics and molecular biology in a format relevant for application to pea breeding.

2. Origin of Pea

Pea (Pisum sativum L.) is one of the world’s oldest domesticated crops [10,11]. Its area of origin and initial domestication lies in the Mediterranean, primarily in the Middle East. Prior to cultivation, pea together with vetches, vetchlings and chickpeas was part of the everyday diet of hunter-gatherers at the end of the last Ice Age in the Middle East and Europe. Remains of these legumes occur at high frequencies in sites dating from the 10th and 9th millennia BC suggesting that domestication of grain legumes could even predate that of cereals [11]. Thus, grain legumes were fundamental crops at the start of the ‘agricultural revolution’ which facilitated the establishment of permanent settlements. Subsequently, during centuries of selection and breeding thousands of pea varieties were developed and these are maintained in numerous germplasm collections worldwide [12]. The range of wild representatives of P. sativum extends from Iran and Turkmenistan through Anterior Asia, northern Africa and southern Europe [13,14,15]. However, due to the early cultivation of pea it is difficult to identify the precise location of the center of its diversity, especially considering that large parts of the Mediterranean region and Middle East have been substantially modified by human activities and changing climatic conditions. Moreover, reliable and thorough passport data are often missing or incomplete for the early accessions that were collected. The genus Pisum contains the wild species P. fulvum found in Jordan, Syria, Lebanon and Israel; the cultivated species P. abyssinicum from Yemen and Ethiopia, which was likely domesticated independently of P. sativum; and a large and loose aggregate of both wild (P. sativum subsp. elatius) and cultivated forms that comprise the species P. sativum in a broad sense [7,12,16,17,18].

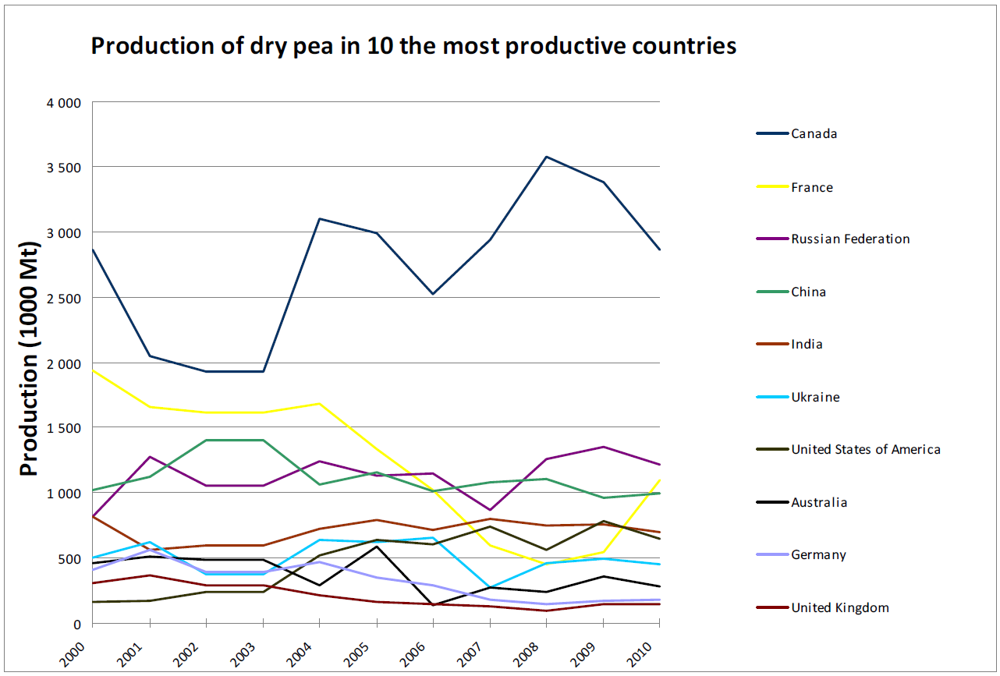
3. Global Pea Cultivation

Dry pea is grown in temperate zones and FAOSTAT [3] registered 94 countries growing pea during the period from 2000–2010 (Figure 1 and Supplementary S1) and cultivated area of dry pea ranged from 6 to 6.5 million hectares. Dry pea production in Europe declined while production increased in Canada, USA and the Russian Federation (Figure 1). The reasons for these changes include economic, biological, physical, sociological and technical factors. Canada has remained the leading pea producing country in the world over the last decade. Countries with production area greater than 100,000 hectares and yield less than 1000 kilograms ha-1 included Pakistan and Ethiopia. The highest yields of 4000–5000 kilograms ha-1 were traditionally achieved in Europe (Netherlands, France and Belgium). The worldwide average yield was about 1700 kilograms ha-1 and yields less than 500 kilograms ha-1 were recorded in parts of Africa (Supplementary S1). The ten countries with the greatest dry pea production are shown in Figure 1. European countries showed a gradual decrease in production from 2004 to 2009, while the opposite trend was recorded for the Russian Federation, India and USA where production showed a slow increase.
Figure 1. Production of dry peain 10 the most productive countries [3].
Agronomy 02 00074 g001

4. Assessment and Conservation of Pea Diversity

Currently, no international center conducts pea breeding and genetic conservation [18] and no single collection predominates in size and diversity (Table 1). Important genetic diversity collections of Pisum with over 2000 accessions are found in national genebanks in at least 15 countries (Table 1), with many other smaller collections worldwide [12,19]. A high level of duplication exists between the collections, giving a misleading impression of the true level of diversity [12,15,19]. However, the numbers of original pea landraces mainly from Europe, Asia, the Middle East and North Africa/Ethiopia have not been documented. The much smaller collections of wild relatives of pea are less widely distributed and there is more clarity when tracing these accessions to their origin. There are still important gaps in the collections, particularly of wild and locally adapted materials, that need to be addressed before these genetic resources are lost forever [15]. With the anticipated climate change-associated increase in the frequency of weather extremes affecting agricultural production, collecting adapted germplasm as well as pest and disease resistance genotypes is a priority [18].
Many studies have been conducted on Pisum germplasm collections to investigate genetic and trait diversity. Several major world pea germplasm collections have been analyzed by molecular methods and core collections were formed (Table 1). For example, genetic diversity has been assessed in over 2000 accessions from the Chinese collection using 21 SSR loci, 310 USDA pea accessions have been assessed using 37 RAPD and 15 SSR markers, and INRA France used an extensive set of 121 isozyme, RAPD, EST and SSR markers to genotype 148 accessions [20,21,22]. Additional examples include, analysis of 60 pea cultivars grown in Canada with RAPD, ISSR and SSR markers [23]; analysis of the entire JIC pea germplasm collection (3029 accessions) consisting of a broad balance of cultivars (33%), landraces (19%) wild accessions (13%) and genetic stocks (26%), using 45 retrotransposon-based insertion polymorphism (RBIP) markers; and genotyping 1283 pea accessions representing much of the cultivated pea diversity held at the Czech National Pea Germplasm collection (CzNPC) using a combination of 25 RBIPs and 10 SSRs [17,20,21,22,23,24,25].
Retrotransposon insertions showed good agreement with gene sequence and sequence specific amplified polymorphism (SSAP) studies [26,27]. It was shown that both SSRs and RBIPs have similarly high polymorphism information content and offer comparable diversity measurements in diversity surveys at the species level [28]. SSRs have also been popular for assessing Pisum diversity because of their high polymorphism information content, co-dominance and reproducibility [24]. Microsatellites have much higher mutation rates (estimated at 10−4·site−1·year−1) than the nucleotide substitution rate and, therefore, suffer from homoplasy (the state when identical alleles have arisen by two or more different pathways of descent) in widely diverse material [12,16].
A high-throughput genotyping technology based on insertion and deletion of retrotransposons was developed from the Ty1-copia retrotransposableelement sequences which have been used to study molecular variation among pea core collections [12,16,17,25,26,27,28,29]. It was demonstrated that Ty1-copia retrotransposableelement sequences provide greater power for phylogeny and genetic relationship studies compared to other marker types and are, therefore, well suited to in-depth phylogeny and germplasm diversity studies [12,17,29]. Another class of highly abundant retrotransposons in pea, the Angela-family, was identified and used for fingerprinting [30]. Improvements in marker methods have been accompanied by refinements in computational methods to convert original data into useful representation of diversity and genetic structure. Initially distance-based methods have been challenged by model-based Bayesian approaches [31,32,33]. Incorporation of probability, measures of support, accommodation of complex models, and various data types make them more attractive and powerful.
Table 1. List of sixteen major world pea germplasm collections with over 1000 accessions. Collections that have been genotyped, phenotyped or have core collections are indicated.
CodeCountryInstituteNumber of AccessionsWeb siteGenotypedPhenotypedCore
VIRRussiaN.I. Vavilov Research Institute of Plant Industry, St. Petersburg6,790http://www.vir.nw.ru/datanotnot
USDAUSAPlant Germplasm Introduction and Testing Research Station, Pullman5,400http://www.ars-grin.govyesyesformed
BARItalyIstituto del Germoplasma, Bari4,297http://www.ba.cnr.it/areagg34/germoplasmanotnot
SADBulgariaInstitute of Plant Introduction and Genetic Resources, Sadovo2,787http://www.genebank.hit.bgnotnot
NGBSwedenNordGen, Nordic Genetic Resource Centre, Alnarp2,724http://www.ngb.se/sestonotnot
CGNThe NetherlandsCentre for Genetic Resources, Wageningen1,008http://www.cgn.wur.nl/pgr/notnot
ATFCAustraliaAustralian Temperate Field Crop Collection, Horsham6,567http://www2.dpi.qld.gov.au/extra/asp/AusPGRISyesyesformed
ICARDASyriaInternational Center for Agricultural Research in the Dry Areas, Aleppo6,105http://www.icarda.cgiar.orgnotnot
GATGermanyLeibniz Institute of Plant Genetics and Crop Plant Research, Gaterleben5,336http://fox-serv.ipk-gatersleben.de/notnot
ICARChinaInstitute of Crop Sciences, CAAS China3,837http://icgr.caas.net.cn/cgrispartlynot
JICUKJohn Innes Centre, Norwich3,557http://www.jic.ac.uk/GERMPLAS/pisumyesyesformed
WTDPollandPlant Breeding and Acclimatization Institute Blonie, Radzikow2,899http://www.ihar.edu.pl/gene_bank/notnot
INRAFranceINRA CRG Légumineuse à grosses graines, Dijon1,891http://195.220.91.17/legumbase/partlyyesformed
UKRUkraineYurjev Institute of Plant Breeding, Kharkov1,671http://www.bionet.nsc.runotnot
CZECzech RepublicAGRITEC, Research, Breeding and Services Ltd., Sumperk1,284http://genbank.vurv.cz/genetic/resourcesyesyesformed
HUNHungaryInstitute for Agrobotany, Tapioszele1,188http://www.rcat.hunotnot
RBIP markers were chosen because of their scoring simplicity and the entire JIC dataset, the Czech National Pea Collection (CzNPC), and a selected core set of 117 accessions of Chinese origin from the ATFC collection were analyzed using a common set of 17 RBIP loci [12,17,25]. This combined set of 4429 accessions provided a total of 75,293 data points. Bayesian (BAPS) analysis provided posterior assignments for K = 2 to 14 with optimal partitioning into 11 clusters (K = 11). Notably, all wild peas (P. fulvum, P. sativum subsp. elatius, and P. abyssinicum) separated in one cluster together with the accessions of Afghan origin. Another cluster contained a large proportion of P. sativum subsp. sativum accessions of Ethiopian origin. One hundred forty accessions of Chinese origin from the ATFC and the JIC core collection were distributed into four clusters. The remaining clusters contained all cultivated material plus a set of mutant lines. It was proposed that the distinct differentiation of the Chinese P. sativum genotypes may in part reflect historic isolation of agriculture in eastern Asia from that in southern Asia, Europe and northern Africa. These results showed that wide diversity is captured among cultivated material; however, it is possible to broaden diversity using wild genotypes, which are often a source for various resistances and exotic traits [12]. Multivariate analysis revealed close genetic relationships within cultivated material, especially modern varieties and breeding lines, while wild material provides much of the Pisum genus diversity [12]. Heterogeneity is often found within landrace germplasm which is vulnerable to genetic erosion due to small population size within each accession and genetic drift during regeneration [34].
Climate change can be expected to exacerbate climate unpredictability and to result in unprecedented levels of heat and drought stress during the reproductive phase in agricultural areas of the temperate, sub-tropical zones worldwide, especially in the sub-Sahara and northcentral India [35,36,37,38]. Targeted utilization of selected landraces and wild relatives for adaptation to climate change will almost certainly be an urgent priority during this century. Pea as a major food legume has the capacity for enhanced nitrogen fixation and CO2 capture, which may partially offset growth reduction associated with higher temperature, shorter growing season, and periods of drought [19,38].
Conservation of pea germplasm should be scientifically based and internationally coordinated. The key priority is the collection and conservation of the historic land races and varieties of each country in ex situ gene banks. The overall goal is to ensure maintenance of variation for adaptation to the full range of agro-ecological environments, end uses (leaves, immature seed and pods, and dry seed), and production systems [39,40]. Wild peas have less than 3% representation in various national collections despite their wide genetic diversity. There is an urgent need to fully sample this variation since natural habitats are being lost due to increased human population, increased grazing pressure, conversion of marginal areas to agriculture, and ecological threats due to future climate change [41]. It is urgent to implement a comprehensive collection of wild relatives of peas representing the habitat range from the Mediterranean through the Middle East and central Asia while these resources are still available since these are likely to contain genetic diversity for abiotic stress tolerance [19]. Genetic diversity available in wild Pisum species has been poorly exploited [12,16,17]. The most attention has been given to P. fulvum, as a donor of bruchid resistance and source of novel powdery mildew resistance (Er3) [42,43]. Relatively few genotypes with high degree of relatedness have been used as parents in modern breeding programs, leading to narrower genetic base of cultivated germplasm [12,16,17]. There are several current efforts to make either genome-wide introgression lines or at least simple crosses with the intent of broadening the genetic base (Smýkal unpublished). Further investigations, particularly in the wild Pisum sativum subs. elatius genepool, are of great practical interest. Molecular methods, will allow breeders to avoid the linkage drag from wild relatives and make wide crosses more practical.

5. Pea Mutant Collections

The development of reference collections of genetic stocks for single or limited combinations of characters is a relatively recent activity dating back to the late 1800s. The earliest collection lists 21 pairs of cultivated pea lines for contrasting characters including plant form, foliage, flowers, pods and seeds that were the subject of genetic investigation held within a larger collection of 550 cultivars [44]. The adoption of induced mutagenesis became widespread as a way of accelerating mutation rates to create novel genetic variation for selection and the importance of the use of induced mutants in legume improvement programs is still recognized [45,46,47,48,49]. The major pea mutant collections include: John Innes Collection, Norwich, UK (575 accessions); IPGR collection, Plovdiv, Bulgaria (122 accessions); a targeted-induced local lesions in genomes (TILLING) population of 4817 lines (1840 described by phenotype), and 93 symbiotic mutants for 26 genes involved in nitrogen fixation [49,50,51,52]. In addition, fast neutron generated deletion mutant resources (around 3000 lines) are available for pea which have been useful in identifying several developmental genes [51,52,53].

6. Use of Pea Genetic Diversity in Trait Identification

The value of a gene bank depends on the representation of diversity in the species, its characterization for agricultural phenotypes and on identification of interesting genes and alleles [18]. Initially only core collections are expected to be fully characterized phenotypically and genetically, but a long term goal will be the full characterization of germplasm diversity. Inadvertent duplication of effort can be avoided with full documentation of synonymous accessions and establishment of pathways to share germplasm among gene banks. Sharing characterization data worldwide maximizes accession utility and distributes the cost provided there is agreement on the technology for genotypic characterization and on comparable protocols for phenotyping.
A coordinated effort to characterize germplasm collections could be achieved through an international consortium for pea genetic resources. The consortium would employ advanced analytical methods allowing three-way testing of diversity in genotypes, locations and quantitative traits to provide dynamic characterization of genotypic and phenotypic diversity in a pea core collection showing broad molecular and eco-geographic diversity [18,54]. Broad testing of the core set for adaptation across a range of different ecological locations could include developing countries from the Middle East across Central Asia where pea is a significant crop. Such a core set would also provide a useful and powerful resource for next generation markers such as SNPs or whole genome sequencing (WGS) and, more importantly, for phenotypic analysis of agronomic traits.
Selected subsets of major world pea collections were molecularly analyzed and core collections have been established (Table 1). These collections act as toolkits for association mapping, a strategy to gain insight into genes and genomic regions underlying desired traits [55]. Recent advances in genomic technology, the impetus to exploit natural diversity and development of robust statistical analysis methods make association mapping affordable to pea research programs. Compared to conventional linkage mapping based on time consuming biparental mapping population development, linkage disequilibrium (LD) mapping using the nonrandom associations of loci in haplotypes is a powerful high resolution tool for complex quantitative traits [55]. The ability to map QTLs in collections of breeding lines, landraces or samples from natural populations has potential for future trait improvement and germplasm security. The choice of germplasm, extent of genome-wide LD and relatedness within the population determine the mapping resolution, which together with marker density and statistical methods are critical to the success of association analysis. If LD decays within a short distance, mapping resolution is expected to be high, but a large number of markers are required [55]. Estimates of the rate of LD decay in pea within progressively more distantly related accessions tentatively suggest high LD among cultivars although few sequences and cultivars have been studied [26]. The decline in correlation values (r2) to very low values at 1kb, within pea wild accessions, landraces and cultivars, is comparable to rice and maize [56,57]. This estimate should be considered preliminary, but would imply that a greater number of SNPs (one hundred thousand or even millions as for maize) might be required for effective genome-wide association mapping and marker-assisted breeding.
With a wide range of approaches now available for genotyping and declining cost for whole genome sequencing, the greatest limitation for gene banks is phenotyping, not only for descriptive traits but agriculturally relevant quantitative traits related to expression of yield, crop growth and disease resistance. To increase precision, a single seed should be used for self-pollination to provide genetically uniform progeny for genotypic and phenotypic analysis. The genetic diversity within landrace accessions is purposely neglected, but hopefully compensated for by a wide survey across germplasm diversity. This level of precision is desirable if the key alleles of genes for important agronomic traits are to be identified, but broad characterization of diversity in pea germplasm can be based on a pooled DNA sample and phenotyping done on the bulked landrace mixture [20,25,56].
Quantitative trait and disease resistance characterization has generally been done in field nurseries and for only one year. Multi-environment analysis of quantitative variation involving multi-trait evaluation is far more informative than a single environment trial and potentially provides some prediction for performance in other environments [58]. The challenge for gene bank curators is to strategically sample collections and maximize information from costly evaluation trials. One approach is to use core collections that have been developed based on geography or using molecular marker diversity or developed based on priority traits [58]. This has led to using climatic site descriptors for characterization of natural selection and hence abiotic stress response and to provide lists of prospective germplasm with potential tolerances to heat, frost and drought [58]. Differential sets of germplasm with specific responses to races of a pathogen also can be tested with germplasm collections either in controlled inoculations or in different field locations to evaluate genetic diversity for disease resistance.
Searchable databases are indispensible tools for the principal clients of gene banks, such as plant breeders and germplasm enhancement scientists, to search for accessions that meet multi-trait criteria such as disease resistance, seed weight and grain yield, or even accessions originating from various environments. Pea is largely handicapped by not being a CGIAR mandate crop and consequently with no coordinated international funding support. One very important issue is the availability of molecular, agronomic and morphological trait data from different researchers for collation in a meta-database. Combining passport, morphological and genotypic data of many genebanks will both improve germplasm management and enable search/query data exploration for germplasm with multiple traits from a virtual world pea collection on-line [59]. Various software programs have been developed with this capability such as the International Crop Information System (ICIS) and the related International Wheat Information System (IWIS), Germplasm Resource Information Network (GRIN)-Global [60] by the USDA, and GENESYS with CGIAR in Rome, Italy.

7. Pea Genome, Karyotype and Genetic Maps

Despite their close phylogenetic relationships, crop legumes differ greatly in their genome size, base chromosome number, ploidy level, and reproductive biology. Nevertheless, early studies indicated that members of the Papilionoideae subfamily exhibit extensive genome conservation based on comparative genetic mapping. To establish a unified genetic system for legumes, two legume species in the Galegoid clade, Medicago truncatula and Lotus japonicus,which belong to the tribes Trifolieae and Loteae, respectively, were selected as model systems for studying legume genomics and biology [61]. Unlike many of the major crop legumes, M. truncatula and L. japonicus have small genome size, are amenable to forward and reverse genetic analyses, and are, therefore, well suited to biological inquiries important to crop legume species.
Nuclear genome size estimates for pea have been produced for several accessions using different methods and 9.09 pg DNA/2C is the most reliable value, which corresponds to the haploid genome size (1C) of 4.45 Gbp [62]. The GC content of pea is 37.7%, but in common with many eukaryotes, this GC content varies and appears to be distributed in relatively long regions of similar base composition [63]. Approximately 30% of C residues are 5methyl-cytosine and approximately 50% of 5meC are in the sequence C(A/T)G [64]. Early studies of sequence composition of the pea genome employing DNA reassociation kinetics and melting behavior measurements indicated that 75–97% of the genome is made up of heterogeneous populations of repetitive sequences [65,66]. Recent investigations using next generation sequencing (NGS) data confirmed the occurrence of highly diverse families of repeats and revealed that about 50–60% of pea nuclear DNA is made up of highly- to moderately repeated sequences [67,68]. In these studies, similarity-based clustering of sequence reads obtained from low-pass whole genome sequencing provided a global overview about repeat composition, identifying Ty3/gypsy LTR-retrotransposons as the main component of the pea repeats. Ogre elements alone were estimated to represent 20–33% of the pea genome. Other lineages of Ty3/gypsy and Ty1/copia elements as well as other types of repeats were found, at low frequency in the genome [68]. Ogre retrotransposons represent a phylogenetically distinct clade of the Tat lineage of Ty3/gypsy elements and were first identified in pea [69,70,71]. Due to their size and amplification to high copy numbers, Ogre elements are important genome constituents in other legume species [72,73]. Pea repeats have been the subject of a number of studies focusing on individual elements, including LTR-retrotransposons Cyclops, PDR, PIGY, Angela, MITE elements Zaba, Stowaway, and a group of centromeric retrotransposons [74,75,76,77,78,79,80,81]. Pea has a high number of diverse satellite repeats, some of the satellites provide useful cytogenetic markers allowing discrimination of individual chromosomes within the karyotype [82,83,84] (Figure 2).
Figure 2. The pea karyotype. Arabic and Roman numerals refer to chromosome type and linkage group, respectively, as assigned by Neumann et al. 2002 [84] and Fuchs et al. 1998 [90]. The upper panel shows a scheme of the pea karyotype with the loci for PisTR-B (red), 5S rDNA (green), and 45S rDNA (yellow). The bottom panel shows the same loci detected by FISH on isolated metaphase chromosomes. Bar = 5 µm.
Agronomy 02 00074 g002
The standard pea karyotype comprises seven chromosomes: five acrocentric chromosomes and two (4 and 7) with a secondary constriction corresponding to the 45S rRNA gene cluster (Figure 2). The numbering of pea chromosomes is unconventional in that the largest chromosome, traditionally named Chromosome 1, is actually Chromosome 5 in pea and aligns with linkage group (LG) III. The current chromosome naming scheme arises from an early attempt to coordinate the names of linkage groups and chromosomes. There is no simple solution to this inconsistency in pea, because the two small, submetacentric chromosomes (1 and 2) are statistically impossible to distinguish in terms of relative size and arm length ratios [85]. A set of translocation stocks was generated but there was considerable disagreement about which linkage groups and chromosomes were involved [86,87]. Assignment of the translocation points of the lines L108 (=JI48), L111 and L112 include linkage groups IV, VI and VII [88]. The translocations in lines L114 and L180 remain obscure [87].
The pea chromosomes are distinguishable on the basis of morphology and in situ hybridization and these identified chromosomes can be related to linkage groups [89]. There is clearly scope for redefinition of chromosome names in pea, but no systematic renaming has been agreed upon. For this reason the chromosome numbers and linkage group numbers are referred to using Arabic and Roman numerals, respectively (1 = VI, 2 = I,3 = V, 4 = IV, 5 = III, 6 = II and 7 = VII) [89,90]. The JI145, JI146 and JI148 lines with reconstructed karyotypes were used for flow sorting of individual pea chromosomes with over 95% purity suitable for PCR-based physical mapping in pea [84]. Therefore, the only means to distinguish between all chromosome types reliably is to label the chromosomes with markers showing chromosome-specific fluorescence in situ hybridization (FISH) pattern. The satellite repeat PisTR-B was found to be the most convenient cytogenetic marker because its labeling pattern in combination with chromosome morphology allowed discrimination of all pea chromosomes [83,84] (Figure 2).
There is a long history of genetic mapping studies in pea [85,89,91,92,93,94,95,96,97,98,99,100,101,102,103,104]. Different types of polymorphisms were successively used: morphological markers, isozymes, RFLP, RAPD, SSR, EST-based, PCR-based techniques and, more recently, high-throughput parallel genotyping. A genetic map was built from a population of 51 recombinant inbred lines (RILs) derived from the cross, JI1794/Slow, placing classical mutants, isozymes, RFLP and EST markers on the Pisum genetic map [98]. Later, pea consensus linkage maps were obtained using different segregating populations. The total length of the integrated map built from the JI15/JI1194, JI15/JI399 and JI281/JI399 progenies (937 cM) was close to the expectation based on chiasma distribution [102]. Three different crosses (Terese/K586, Champagne/Terese, Shawnee/Bohatyr) were used to build a composite genetic map of 1430 cM (Haldane) comprising 239 microsatellite markers [91]. The microsatellite markers included 216 anonymous SSRs plus 13 SSRs located in genes. These markers are evenly distributed throughout the seven linkage groups of the map with 85% of intervals between the adjacent SSR markers being smaller than 10 cM. This map was used to localize numerous QTLs for disease resistance as well as quality and morphology traits. More recently, functional maps composed of genes of known function were developed [94,103,104,105]. The latest consensus map published in pea provides a comprehensive view built from data obtained for 1022 RILs belonging to six RIL populations: Terese/K586, Champagne/Terese, VavD265/Cameor, Ballet/Cameor, VavD265/Ballet, China/Cameor [104]. The map includes 214 functional markers, representing genes from diverse functional classes such as development, carbohydrate metabolism, amino acid metabolism, transport and transcriptional regulation. It also includes 180 SSR, 133 RAPD and three morphological markers and is intrinsically related to previous maps [91,94,97,98,102]. Many of these maps were constructed using common RIL mapping populations and common markers. Based on markers shared with previously published maps, 48 known mutations and 15 protein or gene markers could be placed onto this consensus map [104]. This map provides a framework for translational genomic approaches among legumes (see section 12). Comparing different maps, length variations or gene order discrepancies among populations were observed. One contribution to excess map length could be incorrect scoring (e.g., due to DNA methylation), or deficiency of heterozygotes [106,107]. Different recombination rates could also occur with longer maps for crosses among close ecotypes and shorter maps for wider crosses. Gene order discrepancies could be generated by translocation events in the different RIL populations or by missing data for markers genotyped in one population and not another [104].

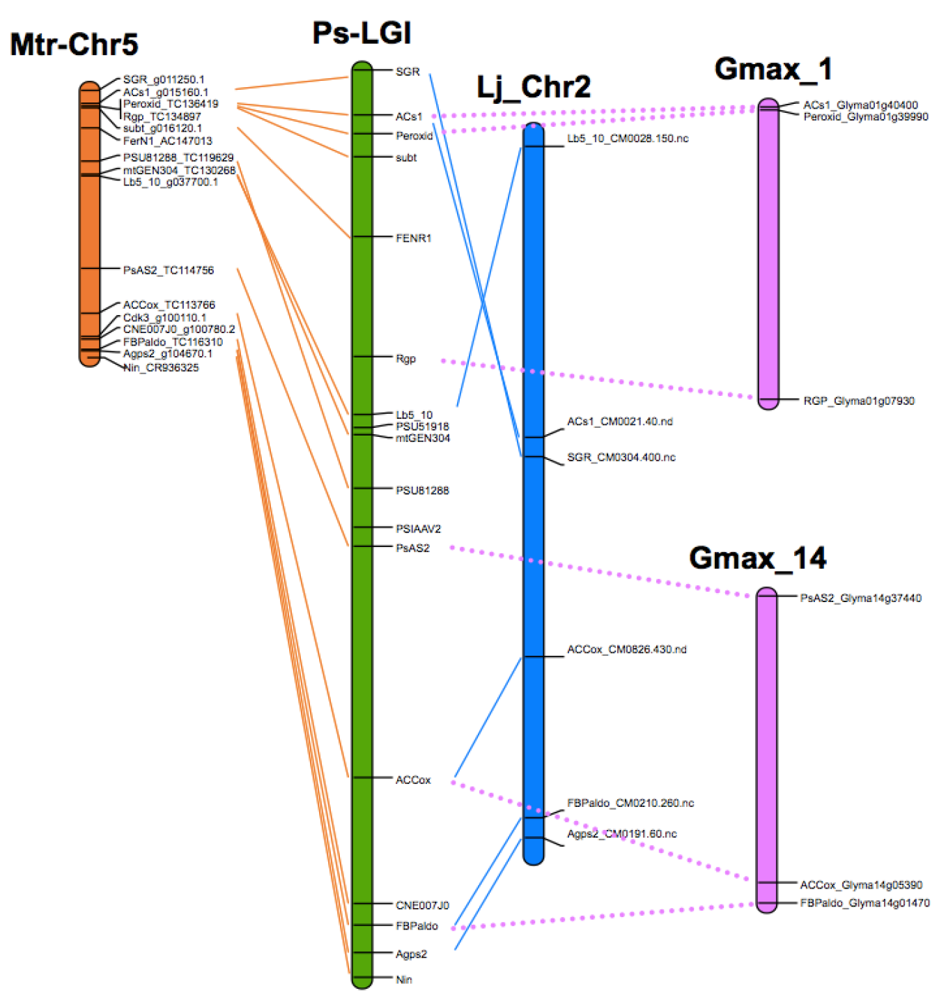
8. Translational Genomics—From Model Legumes to Pea

Study of complex biological processes in plants has been facilitated by several model plants, such as Arabidopsis thaliana, rice, poplar and specifically for legumes, Medicago truncatula and Lotus japonicus. Both M. truncatula and L. japonicus are diploid legume species with eight and six chromosomes, respectively, and relatively small genome size around 500 Mb [108,109,110,111]. These models allow progress in our understanding of development, responses to biotic and abiotic stresses as well as an evolutionary perspective. A goal of legume genomics is to transfer knowledge between model and crop legumes [111]. Accordingly, an in-depth understanding of conservation of genome structure among legume species is a prerequisite. Phylogenetically closely related species usually display a high degree of conservation based on proximity (i.e., synteny) and linear order (colinearity) of genes. Comparative genetic analysis among legumes was first presented by Vavilov’s studies on homologous series of similar heritable variation in related Papilionoid species [112]. The first molecular evidence of macrosynteny between legumes was given by the comparison of genetic maps of economically important legumes. Translational genomics makes the assumption that gene positions in a crop species can be inferred from gene positions of ortholog sequences in genomes of model species for which a genome sequence is available. Synteny among legume genomes, and specifically among pea and other legume species, has been investigated for the last 20 years. Comparative mapping among pea, lentil, chickpea and Medicago, as well as among several legume species has been reported [94,113,114,115,116].
All studies to date suggest a high degree synteny among legume crop species. Recently, new opportunities are available due to availability of genomic sequence for the model legumes M. truncatula and L. japonicus, as well as Glycine max.M. truncatula is taxonomically the closest model species to pea, while the model legume species L. japonicus belongs to the closely related robinioid clade and soybean to the more distant milletioid clade [115,116,117]. Cross species gene-based markers were used to identify homologous genome segments among eight legume species (M. truncatula, alfalfa, L. japonicus, chickpea, soybean, mungbean, common bean and pea) with M. truncatula used as a reference genome for the consensus map [115]. Identification of homologous gene sequences for genesmapped on the pea consensus map in sequence databases for other legumes allowed comparative gene order in pea, M. truncatula, L. japonicus and soybean to be identified and specified the syntenic relationship among these legumes [104]. There is overall conservation of gene order and correspondence among pea linkage groups with M. truncatula and L. japonicus pseudochromosomes is given in Table 2 and Figure 3. Some local discrepancies and/or inversions were also identified. More data will help refine this picture of synteny. Comparative mapping also allows investigation of the paleo-history of the pea genome. A scenario of evolution of the seven pea chromosomes from the paleo-hexaploid ancestor of Eudicot was proposed [104]. This approach gives insights into potential paralogous regions of the genome that were derived from the same paleo-chromosomes.
Figure 3. Comparative maps of P. sativum and M. truncatula, L. japonicus, soybean for LGI, as an example of synteny conservation among legume species.
Agronomy 02 00074 g003
Translational genomics is also beginning to assist identification of candidate genes or saturating markers in a zone of interest of pea. For example, candidate genes responsible for two floral zygomorphy mutant loci in pea, Keeled Wings (K) and Lobed Standard 1 (LST1), were identified using genomic information from L. japonicus [51]. More recently, the flowering locus GIGAS was identified using a candidate gene approach in comparison with M. truncatula [118]. Colinearity of the genome sequences among legumes allowed identification and isolation of genes involved in symbiosis with rhizobia and arbuscular mycorrhiza [119,120,121]. In order to support comparative legume biology, several databases were developed, integrating genetic and physical map data and enabling in silico analysis (Table 3).
Table 2. Correspondence among pea linkage groups and M. truncatula and L. japonicus pseudochromosomes.
P. sativumM. truncatulaL. japonicus
I52
II15
III2, 31, 3
IV84
V71
VI2, 66
VII43, 4
Table 3. Table 3. List of web databases providing links to pea related information.
International Legume Database & Information Service (ILDIS)http://www.ildis.org/
Legume Information System (LIS)http://www.comparative-legumes.org/
Phytozome -Soybean Gbrowserhttp://www.phytozome.net/cgi-bin/gbrowse/soybean/
Medicago truncatula HapMap Projecthttp://www.medicagohapmap.org/cgi-bin/gbrowse/mthapmap/
Legume phylo-informatics databasehttp://www.public.asu.edu/~mfwojci/legumephylo_dBase.html
Cool Season Food Legume Genome Databasehttp://www.gabcsfl.org/
INRA Dijon Legume genetic and genomic resourceshttp://www.thelegumeportal.net
A bioinformatics gateway towards integrative legume biologyhttp://www.legoo.org/
UTILLdb : URGV TILLING pea databasehttp://urgv.evry.inra.fr/UTILLdb
INRA LegumeBasehttp://195.220.91.17/legumbase/index.php?mode=0&id=
Legume proteomeshttp://iant.toulouse.inra.fr/plants/legumes/cgi/legumes.cgi
KnowPulsehttp://knowpulse2.usask.ca
LegumeIPhttp://plantgrn.noble.org/LegumeIP

9. Transcriptome and Proteome Analysis

Several transcriptome analyses have been performed using a pea 6k oligo-array (Ps6kOLI1) developed from diverse sources of genomic sequence, especially seed EST libraries. Notably, the effect of mutations in genes involved in primary metabolism or hormone deficiency on the seed transcriptome has been assessed [122,123,124,125]. Transcriptome variation for reaction to biotic stress was also analyzed using this microarray [126]. More recently, next generation sequencing (NGS) technology has provided the opportunity to generate transcriptome repertoires for non-model species, such as pea, without a sequenced genome [127]. Such a transcriptome resource will facilitate molecular and ‘omics’ approaches for pea. Libraries comprising a total of 450 megabases from flowers, leaves, cotyledons, epicotyl and hypocotyl, and light treated etiolated seedlings, were assembled into 324,428 unigenes and annotated with A. thaliana, M. truncatula, G. max and other databases [127].
Proteomics is widely used in plant studies to understand various physiological and biological mechanisms. The proteome of mitochondria (ca. 60 spots identified) and the peribacteroid space and membrane from symbiosomes (ca. 20 pea spots) of mature leaves and stems (190 spots identified) and mature seeds (156 spots identified) of pea were analyzed [128,129,130]. The kinetics studies of proteomes of mature leaves and stems revealed proteome variations associated with the remobilization and/or senescence processes [130]. The pea mature seed proteome revealed a large diversity of storage proteins and the plasticity of the seed proteome in varying environmental conditions [131]. Several proteins involved in biotic and abiotic stress responses were also identified, including lipoxygenases, dehydrins, beta 1,3 glucanase, heat shock and LEA proteins. Leaf proteome differential response to powdery mildew infection (108 spots) identified in the resistant cultivar constitutive stress and defense proteins which were more abundant than in the susceptible cultivar [132]. Similarly, proteome variation associated with cold acclimation identified several proteins which could protect Champagne, a resistant genotype, against photoinhibition, chilling and oxidative damage [133]. Proteomic analysis was also used to analyze the response to broomrape (Orobanche crenata) a parasitic plant devastating grain legumes in the Mediterranean region and Africa, leading to identification of stress related and proteins active in carbohydrate metabolism, nitrogen metabolism and the mitochondrial electron transport [134]. Similar results were found in a proteomic study on pea leaves challenged with Mycosphaerella pinodes [135]. Pea seed protein composition was deciphered through a PQL approach [136]. These authors mapped the loci controlling the quantity of 525 seed proteins revealed by 2D-PAGE and found that the accumulation of the major storage protein families was under the control of a limited number of loci. Storage protein accumulation was under the control of both cis- and trans-regulatory regions. A locus on LGII appeared a major regulator of protein composition and of protein in vitro digestibility [136]. Until now, few metabolomics studies have been undertaken in pea [137,138].

10. Molecular Markers

10.1. Molecular Marker Development and Application

Breeding aims to improve agronomically important traits by combining characters present in different parental lines. In conventional pea breeding programs, various crossing strategies are employed to incorporate desirable traits from an accession into more adapted genotypes using backcrossing, single seed descent and recurrent selection. While effective, this is a time-consuming process and may be sped up through the application of molecular markers used to determine the number, position and individual effects of loci associated with the trait of interest [139,140]. Markers also offer potential to advance pea breeding through accurate identity, pedigree purity, hybrid determination, and analysis of genetic variation [141]. Development of new genomic technologies has increased during the last decade providing previously unforeseen strategies for crop breeding.
Myriad DNA polymorphism is present among a set of varied genotypes which can then be customized into user-friendly molecular markers. Different techniques exploit nucleotide polymorphisms that arise from different classes of mutation such as substitution (point mutations), rearrangement (insertions or deletions) or error in replications of tandem-repeat DNA. Adaptation to breeder-friendly markers has relied on polymerase chain reaction (PCR)-based microsatellites or SNP markers because they can be easily employed in cost-effective genotyping of large segregating populations. The largest database of pea-specific SSR markers was developed by Agrogene, France and these have subsequently been used in several studies and are now broadly used for mapping [91]. More recently, EST-derived simple sequence repeat (eSSR) markers have become an important resource for gene discovery and comparative mapping studies. eSSR markers for pea have been developed from EST sequences within the NCBI database [105,141]. Over the last years, functionally-associated markers (i.e. cDNA/EST) have been developed to uncover and tag candidate genes and gene pathways underpinning desirable traits. This has most recently been expanded to include whole genome transcriptome analysis and with the advent of next generation sequencing technologies it will be possible to transfer this technology to species with relatively large genomes such as pea. Further application of this technology through directed sequencing will allow allele differences among genotypes for trait-associated genes to be characterized, resulting in functionally characterized markers that are in perfect association with the QTL or gene.

10.2. Transition to Gene-based Markers EST-SSRs and SNPs

The EST approach identifies candidate genes through production and interrogation of cDNAs (copies of mRNA) transcribed in response to a particular stimuli/trait of interest. Single-pass sequences are determined from one or both ends of anonymous or randomly chosen cDNA clones chosen from cDNA libraries. The availability of rapidly growing sequence databases allows detection of regions showing sequence similarities in functionally related gene products from distantly related organisms. Thus it is increasingly possible to assign putative functions for a large proportion of anonymous cDNA clones/ESTs. EST analysis is a rapid and efficient way to provide preliminary information on expression profiles for abundant gene transcripts in any particular tissue in different physiological conditions and then identify regulatory genes. EST analysis has been used to identify genes associated with a variety of traits in pea. The initial set of pea ESTs was developed by Gilpin [98]. An online database ‘CROP-EST’ (http://pgrc.ipk-gatersleben.de/cr-est/) was developed for crop EST projects, which currently includes two cDNA libraries for pea with a total of 9377 ESTs [142]. Recently, a large database comprising 7610 unique genes from shoot apical meristem cDNA libraries was generated [143] and a comprehensive transcriptome of pea using NGS was published [127]. Several high-throughput pea transcriptome sequencing projects are underway and should provide a complete set of pea genes (Table 2).
Single nucleotide polymorphism (SNP) markers are currently used to assess genetic diversity, for genetic mapping and tagging alleles of functional interest. Gene-specific studies have identified SNP markers useful for characterizing diversity and relationships among pea genotypes [26]. However, when SNP markers are incorporated into arrays, the assessment of thousands of gene-related SNP in a single reaction is possible. A custom 384-SNP array was developed, and used in pea genotypic diversity surveys and mapping [103]. Compared to retrotransposon and microsatellite markers, the rate of SNP marker discovery is almost unlimited. Sequence data from 80 gene amplicons totalling about 63.2 kb of sequence in five pea genotypes identified a total of 669 SNP and 84 indels [94,103]. On average, one SNP per 94 bp was detected (i.e., one in 165 bp in coding regions and one in 60 bp in non-coding regions). Advances in model legume sequencing and genomic knowledge have resulted in a switch to gene-based markers in pea [26]. Strategies combining NGS and Gene Capture arrays should provide thousands of gene-anchored SNP markers. The set of SNP markers using Illumina Veracode genotyping technology was used to construct a consensus map which includes 244 SNP markers and placed 5460 pea unigenes on the consensus map [104].
Available genetic markers in pea have been applied in gene mapping or QTL studies, marker assisted selection (MAS), genetic diversity surveys and association studies. Although SSR and RBIP marker types are still widespread, they will probably be replaced by the growing number of SNP assays and genotyping by sequencing (GBS) [144]. The GBS study in barley developed and mapped 25,000 sequence tags which have a genome size and structure similar to pea. This set should facilitate the investigation of whole genome sequence polymorphisms in pea and pave the way to genome wide association studies (GWAS) [145,146] as well as genomic selection [147].

10.3. Markers for Disease and Pest Resistance

Many diseases and pests affect pea [148]. Fungal and viral pathogens cause the most severe damage. Fusarium species cause root rot (F. solani f.sp. pisi and F. avenaceum ) or wilt (F. oxysporum f.sp. pisi). Available resistance to Fusarium root rot caused by F. solani f.sp. pisi is quantitatively inherited and putative QTL identified [149,150]. SSR markers flanking resistance loci useful for marker assisted selection (MAS), including one QTL on LG VII and three QTL on LG II, III and VI have recently been reported [151, Coyne unpublished]. The genetics of resistance to F. avenaceum is under investigation (Porter unpublished). Single genes are available for Fusarium wilt resistance, such as Fw for resistance to race 1 and Fwf for resistance to race 5 [91,152,153,154,155]. Three QTLs with flanking SSR markers were identified, including the hypothesized single gene Fnw, controlling resistance to Fusarium wilt race 2 [156]. Ascochyta blight of pea is caused by a complex of three fungal pathogens: Mycosphaerella pinodes, Phoma medicaginis var. pinodella and Ascochytapisi [148]. Both single genes (Rap2)and QTLs have been reported conferring resistance to Ascochyta blight [157,158,159,160,161,162,163]. An early study with very few markers per linkage group identified single genes (Rmp1 , Rmp2, Rmp3 and Rmp4) for M. pinodes resistance [158]. A series of QTL studies have deepened our understanding of the quantitative inheritance of resistance to M. pinodes in pea [159,160,161,162,163]. Using a linkage map based on RAPD, SSR and STS marker polymorphism, ten and six QTLs associated with Ascochyta blight resistance at the seedling and adult plant stages, respectively, and four QTL independent of developmental stage were identified [160,162]. Three of these QTL were confirmed in a second RIL population [163].
Three genes (er1, er2 and Er3) have been described conferring resistance to powdery mildew (Erysiphe pisi) [43,164,165,166]. The gene er1 is widely used in pea breeding programs [164]. Resistance conferred by this gene has proven to be stable and results in a barrier to pathogen penetration [167]. RFLP, RAPD/SCAR and SSR markers have been linked to er1 on linkage group VI [168,169,170,171,172,173]. Recently, through the study of a novel chemically induced er1 allele, co-segregation with PsMLO1 (Mildew Resistance Locus O) loss-of-function was reported [174,175]. Analysis of the gene from several known powdery mildew resistant cultivars has further supported that indeed PsMLO1 loss-of-function is responsible for the trait and indicated the same molecular basis is shared among well studied barley mlo,tomato ol-2 and pea er1 immunities [174,175]. The recessive allele er2 confers a high level of resistance in some locations but is ineffective in others [173,176]. Expression of er2 is strongly influenced by temperature and leaf age. The basis of er2-governed resistance is based mainly on post-penetration cell death complemented by a reduction of percentage penetration success in mature leaves [167,165]. AFLP and RAPD-SCAR markers have been linked to er2 [171,174]. A dominant resistance gene Er3 wasidentified in P. fulvum and has been introduced successfully into adapted P. sativum material through sexual crossing [43]. Resistance conferred by Er3 is due to a high frequency of cell death that occurs both as a rapid response to attempted infection and a delayed response that follows colony establishment [43,177]. RAPD-SCAR markers have been linked to Er3 [177].
Pea rust is caused by Uromyces viciae-fabae in tropical and subtropical regions and by U. pisi in temperate regions [178,179,180]. A major gene (Ruf) and QTLs have been reported conferring resistance to U. viciae-fabae in pea [181,182]. Two QTL on LG VII, flanked by SSRs for MAS, explain up to 58% and 12% of the phenotypic variation for resistance to U. viciae-fabae [182]. One QTL on LG III was identified which explained 63% of the phenotypic variation in a P. fulvum cross for resistance to U. pisi [179].
Genetic resistance to Aphanomyces root rot (Aphanomyces euteiches) in pea is quantitative with moderate heritability [183,184,185,186]. Five consistent QTLs with codominant SSRs for MAS were identified over multiple environments in France and the USA and confer high levels of partial resistance [186]. Resistance to pea bacterial blight (Pseudomonas syringae pv. pisi) is controlled by single dominant genes Ppi1 (for race R2), Ppi3 (for race R3) and Ppi4 (for race R4) [187]. P. abyssinicum accessions(sixteen originated from Ethiopia and one from Yemen) are resistant or partially resistant to all racesincluding race 6, for which there are no known resistant cultivars [188]. This resistance is controlled by a major recessive gene together with a number of modifiers [189]. Conversely, quantitative resistance to bacterial blight caused by Pseudomonas syringae pv. syringae has been reported to be associated two QTLs explaining 22.2 and 8.6% of the phenotypic variation [189]. Incomplete levels of resistance to crenate broomrape (Orobanche crenata) are available in accessions of P. sativum ssp.sativum,ssp.abyssinicum, ssp.arvense and ssp.elatius and P. fulvum. These accessions have been successfully crossed with commercial pea varieties and a breeding program for broomrape resistance is underway [190,191,192,193]. Four QTLs for O. crenata resistance have been reported to explain from 8 to 37% of the phenotypic variation [193]. Resistance to pea bruchid(Bruchus pisorum) has been described in P. fulvum and isconferred by three genes and a number of polymorphic AFLP bands for resistance have been identified [42,194].
Viruses are among the most widespread and destructive pathogens of crop plants causing serious economic losses by yield and quality reduction [3]. Although viral diseases can be controlled through elimination of virus sources, control of vectors and proper cultivation practices, genetic resistance is the most effective and reliable form of control. Pea seed-borne mosaic virus (PSbMV), a member of the genus Potyvirus, family Potyviridae, is a serious pathogen resulting in yield losses from 10 to 80%. Genetic studies have shown that pea contains two clusters of recessive resistance genes to various potyviruses [195]. The cluster on linkage group II includes bcm, cyv-1, mo, pmv and sbm-2 and confers resistance to Bean common mosaic virus (BCMV) Clover yellow vein virus (CYVV), Pea mosaic virus (PMV) and the L1 (P2) pathotype of Pea seed-borne mosaic virus (PSbMV). The second cluster on linkage group VI includes cyv-2, wlv and sbm-1, conferring resistance to Clover yellow vein virus (ClYVV), white lupin strain of Bean yellow mosaic virus (BYMV-W) and the P1 pathotype of PSbMV [195]. Recently, two homologous eIF4E and eIF(iso)4E genes were identified by a candidate gene approach based on Medicago truncatula genome to be responsible for PSbMV and BYMV-W resistance at the sbm-1 and sbm-2 loci [196,197,198]. Moreover, it was shown that eIF4E in peaalso controls resistance to ClYVV at the cyv-2 locus and to BYMV-W virus at the wlv locus [199]. Based on these studies, reliable and allele specific testing of single nucleotide polymorphism (SNP) and co-dominant amplicon length polymorphism were developed which proved to be 100% reliable, faster and cost efficient compared to classical virological testing [200] (Figure 4). Naturally occurring diversity can be extended by mutagenesis and refined using a TILLING approach, from which mutations were identified in pea eIF4E gene [47]. Markers closely linked to the En gene for resistance to Pea enation mosaic virus were reported [201,202,203].
Figure 4. Examples of agronomic practices, germplasm conservation, quality attributes and disease resistance traits in pea. (A) Intercropping pea with cereals for nitrogen fixation and phosphorus availability. (B) Pea germplasm increase and maintenance at Agritec, CZ. (C) Display of pea seed shape and color variation. (D) Cartoon representing a perfect marker for PSbMV virus resistance (Smýkal et al. 2010). (E) PSbMV infected seed and PEMV infected pea plants.
Agronomy 02 00074 g004

10.4. Markers for Flowering Time

A candidate gene approach based on comparative genome analysis is being used to study genes controlling flowering time in pea. Wild P. sativum ssp. elatius, a subset of pea landraces and winter cultivars do not flower at all under short photoperiods, but this long-day requirement has been genetically relaxed in a majority of cultivars. Up to six loci contribute to ‘natural’ variation related to flowering in pea, with derived or cultivated alleles generally conferring earlier flowering and a reduction in photoperiod response. Numerous other loci have been identified through mutation studies [204]. Although the lack of common markers has made it difficult, consensus among QTL studies are consistent with early Mendelian analyses and show that QTL on LGII and LGIII correspond to known positions of the Lf and Hr loci [204,205,206]. Lf was the first locus controlling flowering in pea to be cloned and was identified through a candidate gene approach as a homolog of the Arabidopsis inflorescence identity gene TFL1 [207]. While analysis of induced null mutants of Lf establishes its identity beyond doubt, identification of functional changes in naturally-occurring variants at Lf has not been possible in all cases, and the extent to which molecular variation at Lf contributes to flowering time across global Pisum germplasm has not been documented [207]. Lf orthologs have yet to be identified in any other legume system, but another TFL1 homolog, Det, controls determinacy of the primary inflorescence in several legumes including pea, soybean and bean [206,207].
A “functional candidate” approach has also been used to clone the photoperiod response locus Hr. Hr was originally defined as a major locus controlling flowering time. Hr shows Mendelian inheritance under controlled short photoperiod conditions with the hr allele causing reduction but not complete loss of the response to photoperiod [204,205]. More recently, comparison of Hr and hr genotypes revealed defects in circadian rhythms, and comparative mapping of circadian clock genes has identified Hr as the pea ortholog of ArabidopsisELF3 (Weller et al. submitted). A single functional variant is widespread in pea germplasm and likely to underlie many of the flowering time QTL identified in this region of LGIII. Hr is segregating in several mapping populations including JI281 (Hr) × JI399 (hr) and Champagne (Hr) × Terese (hr) where dominant Hr alleles are associated with increased resistance to winter frost damage [208].
Naturally-occurring recessive alleles at the Sn locus confer early flowering and completely eliminate the photoperiod response, but have a restricted distribution within cultivated pea germplasm and may have arisen within a spring (hr) background. Like Hr, Sn also appears to control circadian rhythms and has recently been identified as the pea ortholog of an Arabidopsis circadian clock gene [209,210]. Sn is also segregating in the JI281 (Sn) × JI399 (sn) population. Early studies identified a fourth locus, E, mapping close to Wlo and Na on LG VI [209,210]. Several subsequent studies have found evidence for a flowering time QTL on LG VI, but the relationship among these loci is not clear. A major-effect QTL on LGVI (QTL6) in a cross between cv. Torsdag and JI1794 has recently been narrowed to the interval between Er1 and Gty, suggesting it may be distinct from E (Weller et al. submitted). In this cross, QTL6 acts together with Hr to control nearly 90% of the variation in short-day flowering, with the presence of “wild” alleles at both loci conferring the obligate LD requirement of the JI1794 parent. QTL6 is also segregating in winter × spring crosses within cultivated P. sativum and coincides with QTL for branching, stem elongation and winter frost tolerance [207,209].
The flowering locus Hr was implicated to influence winter frost tolerance by delaying floral initiation until after the main winter freezing periods have passed [208]. The dominant Hr allele was found in a set of forage cultivars which remain vegetative until a threshold day length of 13h30min is reached. Although the gene is not yet cloned, three consistent QTLs were identified: WFD 3.1/Hr, WFD 5.1 and WFD 6.1 which makes these loci interesting targets for marker assisted selection [208]. Moreover, the flowering allele Hr enhances the capacity of pea photoperiodic lines to produce basal laterals which is often found in primitive accessions of Pisum sativum ssp. humile, P. sativum ssp. elatius and P. fulvum. Proximity of these QTL to agronomically important traits including vine length which is important for lodging resistance and anti-nutritional factors such as trypsin inhibitors have the potential to complicate selection. A set of PCR primers suitable for breeding for low trypsin inhibitor activity was developed and may alleviate challenges in breeding [211,212].

10.5. Markers for Agronomic Traits (QTLs and Major Genes)

Compared to other economically important food crops, fewer QTL mapping studies for agronomic traits have been reported in pea (Supplementary Table S2) [213]. The first QTL analysis in pea used a genetic linkage map of two populations segregating for seed weight (F2 progenies and single seed descent recombinant inbred lines (RILs) [214]. Despite the identification of several QTLs associated with seed weight from the two populations, only one QTL located on linkage group III was identified in both populations. One of the major QTLs identified on LG III was mapped to orthologous regions responsible for control of seed weight in Vigna spp. and soybean [215,216]. Other reported QTLs were associated with lodging resistance (QTLs on LG III and VI), plant height (QTLs on LG III and two on unassigned LGs C and D), grain yield (QTLs on LG II, VI and VII), seed protein concentration (QTLs on LG III, VI and unassigned LG A), and maturity (QTLs on LG II, III and VI) [217,218]. The utility of two markers for lodging resistance was verified in an applied plant breeding program [219].
Seed protein concentration QTLs have been studied in other RIL populations [220,221,222,223]. In the population Térèse/K586, QTL for seed yield and seed yield components were analyzed across five different environments: 261 QTL were detected across the five environments for all traits measured [221]. Most QTL for seed traits mapped in clusters with plant traits, suggesting the significant role of source-sink interactions in the control of seed traits [222]. Developmental genes Le and Af, which control internode length and tendril leaf morphology, respectively, were mapped in the vicinity of seed protein content and/or yield QTL depending on the environment [131,222]. Other QTL were associated with total seed nitrogen and protein content in different populations and locations [220,221,222,223] suggesting QTL by population by environment interactions. Through the use of a common population, QTL associated with root architecture, nodules growth and plant nitrogen nutrition were identified and related to QTL of seed protein content and quality, pointing out the link between plant nutrition and seed filling [222].
The QTLs associated with visual quality of field pea including seed coat color, seed shape and seed dimpling have been identified [224,225,226]. Quantitative inheritance was observed with polygenic control and transgressive segregation for all visual quality traits studied. Genetic control of green cotyledon color in field pea and associated QTLs were studied using F2 individuals and F2 derived F3 family populations. QTLs associated with cotyledon color on LG III, IV, V and VII, were also associated with QTLs for node number (3 QTL), earliness (2 QTL) and plant height (1 QTL) [225,226]. Heritability estimates for whole seed and cotyledon greenness were moderate (0.72 and 0.69, respectively) and heritability increased when assessed after exposing whole seeds to accelerated bleaching conditions [225]. Multiple QTL mapping detected major QTLs on LGIV and LGV, as well as location- and year-specific QTLs on LGII and LGIII associated with green cotyledon bleaching resistance [225,226]. In two RIL populations, nine QTLs controlling yellow seed lightness, three QTL for yellow seed greenness, 15 QTL for seed shape and nine QTL for seed dimpling were detected. Among them, five QTLs located on LG II, LG IV and LG VII were consistent in two environments [225,226]. The QTLs and their associated markers may be useful tools to assist pea breeding programs attempting to pyramid positive alleles for these traits, unfortunately most of the markers are dominant AFLP markers which are difficult to use in other crosses.
To increase yield in pea and avoid drought stress, autumn sowing would be preferable in some production regions. Therefore, frost tolerance is a major trait of interest.QTL analysis of an RIL population derived from the cross of Champagne, a frost tolerant line, and Terese, a frost sensitive line, identified chromosomal regions linked to frost tolerance. QTL flanked by SSR and genic markers explained from 6.5 to 46.5% of the phenotypic variance [208,227] and were shown to be associated with physiological QTL [227].
Several major genes underlying important phenotypic traits in pea have been cloned, most notable are genes involved in domestication. One of the characters used by Mendel was wrinkled seeds (R/r), wherestarch metabolism in the seed is altered. Plants and the immature seeds appear normal, but by maturity there are many differences in the seed including an altered ratio of the two major types of storage protein, the shape of starch granules, the amylose to amylopectin ratio of the starch polymers and sugar content [228]. The rugosus allele (r), disrupted by transposon insertion, was the first gene to be cloned and was shown to encode the starch branching enzyme [228]. This trait has importance not only for garden pea breeding, but also for industrial applications (biopolymers) and can now be efficiently traced by molecular methods. Another Mendelian character which has also practical implications is cotyledon color (i) at seed maturity. The corresponding gene, determining whether cotyledons will stay green or turn yellow, was identified as Stay-Green (SGR) and is known to regulate the chlorophyll degradation pathway in several species [7]. In pea seeds the Def (Development funiculus) locus defines an abscission layer between the funiculus and the hilum at maturity. A spontaneous mutation at this locus results in the seed failing to abscise from the funicle which is common in wild types [229]. Although the abscission of pea seeds from the funicle helps ensure effective dispersal of seeds, significant loss of seeds can occur if late rains followed by high temperatures and dry winds cause the pods to split open. The locus has been mapped but the actual gene remains unidentified [230].
Dehiscent pods are useful in wild pea as a seed dispersal mechanism. However, such a trait complicates commercial harvesting of the seeds and selection for indehiscent pods was probably one of the first modifications made during crop domestication. The inheritance of the dehiscent pod character led to identification of three genomic regions. The region on LG III corresponded to the expected position of Dpo, a gene known to influence pod dehiscence. A locus on LG V appeared to have a slightly smaller effect on expression of the phenotype. The third region was observed only in one cross, had a greater effect than Dpo, and was postulated to be yellow pod allele at the Gp locus [231].
Lateral branching was likely suppressed during pea domestication, leading to the absence of branching in currently grown varieties. On the other hand, most wild Pisum accessions display proliferation of lateral meristems. Several genes regulating this process were isolated, leading to the identification of a novel carotenoid-derived phytohormone, strigolactone [232]. Wild pea genotypes and early varieties had tall climbing vines and, similar to other crops, selection of shorter stature plant types was used to minimize lodging. The shorter vines and reduced internode length is the result of a mutation in the Le gene (GA3-oxidase) controlling giberellin biosynthesis. It is hypothesized that there was a single introduction of the le allele into varieties and subsequently used in breeding [233].

11. Genomic Analysis of Pea

Although pea is amenable to genetic transformation, this remains a challenge and precludes systematic characterization of gene function [234,235]. However, virus-induced gene silencing (VIGS) has become an important reverse genetics tool for functional genomics and VIGS vectors based on Pea early browning virus (PEBV, genus Tobravirus) are available for legume species and were successfully used to silence pea genes involved in symbiosis with nitrogen-fixing Rhizobium as well as development [236,237]. The genomics tools such as fast neutron and TILLING mutant populations were developed for reverse genetics approaches [47,51,52]. The TILLING method combines the induction of a high number of random point mutations with mutagens like ethyl methanesulfonate (EMS) and mutational screening systems to discover induced mutations in sequence DNA targets. This reverse genetic strategy encompasses all types of organisms, such as plants, animals and bacteria, without being subjected to the restrictions of genome size. A sufficiently large TILLING population is available for pea and characterization data have been deposited in an on-line database, UTILLdb, that contains phenotypic as well as sequence information on mutant genes [47]. The population currently has 4817 lines and 1840 of them have been characterized for phenotype and 464 mutations have been identified. Once the pea genome sequence data is available, mutant identification can be substantially extended to any genomic region as shown recently in rice [238].
The commercial pea variety ‘Cameor’, used to develop the TILLING population, was used also to develop a BAC library, an essential tool for positional cloning and also for pea genome sequencing. A second BAC library was developed from PI 269818 and could be used to introgress genetic diversity into the cultivated germplasm pool, which could be useful for the isolation of genes underlying disease resistance (such as Fw, for Fusarium wilt resistance) and other economically important traits [239]. Application of current genomic tools in pea to clone genes was demonstrated for the flower color gene A [53] and tendril formation gene, Tl [52]. The complete pea chloroplast genome sequence is available and may be useful for evolutionary as well as transgenic applications [240]. Moreover, complete genomes of several pea pests and pathogens are available such as a pea aphid Acyrthosiphon pisum [241]. Since aphids cause serious crop damage and transmit viral diseases, this knowledge has potential for evolutionary studies and practical applications.

12. Application of Genomics and Phenomics in Pea Breeding: Status and Outlook

Translation of marker discovery to breeding is still in its infancy and, despite the effort and progress developing molecular resources, their use in pea breeding has been limited. Several factors limit the direct application of QTLs and their associated markers including: (1) high genotype × environment interactions affecting expression, (2) the necessity to test marker polymorphism in different genetic backgrounds, (3) large (5–10 cM on average) genetic distances between markers and the QTLs, (4) imprecise phenotypic description has resulted in inaccurate marker-trait associations, (5) use of small mapping populations (50–200 individuals) has resulted in limited genetic resolution, (6) lack of anchor markers across QTL studies, (7) limited range of variation in the cultivated gene pool, (8) lack of trait and marker validation in different genetic backgrounds, and (9) limited financial investment in this crop and thus lag in molecular tool development for breeding.
Marker-trait associations are based on marker genotype and phenotypic evaluations. Marker genotype can be quite robust provided adequate polymorphism exists in the cross being evaluated and populations are sufficiently large. Precision of the phenotypic evaluations is critical to accurate identification of associated markers and presence of QTL. Extreme care must be taken to ensure phenotypic data is collected accurately and that methods can be repeated if necessary. Phenotyping is time and resource intensive and, unfortunately, is often given less attention than necessary, including conducting studies over few environments and with a limited number of genotypes.
Mapping based on linkage disequilibrium (LD) between markers and target traits has not been applied in pea due to insufficient marker density within the genome. Knowledge of the genetic structure of pea germplasm together with the availability of phenotypic data would provide an opportunity to take advantage of hundreds or even thousands of years of recombination resulting in much higher mapping precision [55]. However, until recently, the lack of genomic resources and a common reference set of genotypes in pulse crops including pea has prevented the application of association mapping and restricted it to basic diversity population structure studies.
The key breeding objectives involve increasing yield potential by improving biotic and abiotic stress resistances and enhancing quality for diverse end-use markets. Quality attributes include improved appearance of the seeds as well as improved nutritional value, cooking quality and flavor. As shown above the extension of model legumes for comparative functional genomics, together with ‘omics’ technnologies, is starting to provide candidate genes for stress and quality traits. As genes are identified in model legumes followed by comparison and transfer of candidate gene information from the model to the crop species favorable alleles for breeding and selection will be identified and improved varieties will be developed by marker assisted selection (MAS) or genetic transformation.
Future prospects for field pea production globally depend on several factors including; the ability of breeders to produce high yielding cultivars which are competitive in crop rotations with the dominant cereal and oilseed alternatives, the ability of agronomists to develop effective and sustainable crop production strategies, and the ability of the global pulse industry to market pea as a highly nutritious affordable food with diverse applications. Pea production will be challenged by climate change this century. This can be expected to exacerbate climate unpredictability and to result in unprecedented levels of heat and drought stress during the reproductive phase in agricultural areas of the temperate—sub-tropical zones worldwide, especially in the sub-Sahara and north central India [35,36,37,38].
In North America the key field pea breeding activities are conducted at four public institutions, i.e., University of Saskatchewan; Agriculture and Agri-Food Canada, Lacombe; USDA-Agricultural Research Service, Pullman, WA; and North Dakota State University, Fargo, ND. While in Europe, field pea breeding is primarily conducted by ten private companies with public institutions conducting supportive basic and applied research. In Australia, the national field pea breeding program is located at Horsham, Victoria with extensive evaluation conducted by collaborators in each state. Vegetable pea breeding is conducted by a few private companies primarily based in the US Pacific Northwest, Europe, China and India.

13. Conclusions

Similar to the delay in broad acceptance of Mendel’s and Darwin’s discoveries or the application of plant tissue culture for biotechnological gains, molecular breeding facilitated by genomic knowledge of not only model but also crop species is gradually finding its way into modern pea breeding programs. There is great potential for discovery and use of existing genetic variation preserved in germplasm, which can be efficiently identified and introduced into current pea cultivars. The integration of molecular techniques and applied plant breeding toward the common goal of improved yield and production of high quality pea seed for multiple end-uses is fast approaching; however, a number of gaps still remain, some of which have been listed in this review. The advent of modern genotyping technologies promises to narrow the gap; however, the lack of a reference pea genome sequence and the limited number of DNA markers hinder efficient application of MAS. Availability of improved molecular tools and adoption of standard phenotypic evaluation methods will allow significant and rapid implementation of genomics-based in pea breeding. This may now be possible with the advent of large scale automatic and digitalized formats making it possible to link phenotype with genotype on a whole genome basis, a process initiated by Mendel about 150 years ago.

Acknowledgements

P.S. acknowledges financial support from the Ministry of Education of Czech Republic ME1006, ME10062, LA08011 and the Bioversity International AEGIS LOA 10/048 projects. J.M. acknowledges financial support from the Academy of Sciences of the Czech Republic (AVOZ50510513). T.D.W. acknowledges financial support from the Saskatchewan Pulse Growers and the Saskatchewan Ministry of Agriculture. C.J.C. acknowledges financial support from the United States Department of Agricultural, Agricultural Research Service.

References

  1. Lock, M.; Mackinder, B.; Schrirer, B.; Lewis, G. Legumes of the World; 2005; Royal Botanical Gardens: Kew, UK. [Google Scholar]
  2. Vance, C.P.; Graham, P.H. Legumes: Importance and constraints to greater use. Plant Physiol. 2003, 131, 872–877. [Google Scholar] [CrossRef] [PubMed]
  3. FAOSTAT. 2011. Available online: http://faostat.fao.org (accessed on 11 January 2012).
  4. Regnier, J.M.; Duparque, M.; Peyronnet, C.; Grosjean, F.; Bastianelli, D. Feeding value of pea (Pisum sativum, L.)—1 Chemical composition of different categories of pea. Anim. Sci. 1998, 67, 609–619. [Google Scholar] [CrossRef]
  5. Phillips, D.A. Efficiency of symbiotic nitrogen fixation in legumes. Ann. Rev. Plant Physiol. 1980, 31, 29–49. [Google Scholar] [CrossRef]
  6. Sumner, L.W.; Dixon, R.A. Legume natural products: Understanding and manipulating complex pathways for human and animal health. Plant Physiol. 2003, 131, 878–885. [Google Scholar] [CrossRef] [PubMed]
  7. Hellens, R.P.; Coyne, C.J.; Timmerman-Vaughan, G.M.; Hofer, J.I.; Ellis, T.H.N. Mendel, 150 years on. Trends Plant Sci. 2011, 16, 590–596. [Google Scholar] [CrossRef] [PubMed]
  8. Ross, J.J.; Reid, J.B. Mendel’s genes: Toward a full molecular characterization. Genetics 2011, 189, 3–10. [Google Scholar] [CrossRef] [PubMed]
  9. Mumm, R.H.; Moose, S.P. Molecular plant breeding as the foundation for 21st century crop improvement. Plant Physiol. 2008, 147, 969–977. [Google Scholar] [CrossRef] [PubMed]
  10. Ambrose, M.J. From Near East centre of origin the prized pea migrates throughout world. Diversity 1995, 11, 118–119. [Google Scholar]
  11. Hopf, M.; Zohary, D. Domestication of Plants in the Old World; 2000; Oxford University Press: Oxford, UK. [Google Scholar]
  12. Ambrose, M.J.; Maxted, N.; Coyne, C.J.; Ford, R.; Redden, R.J.; Kosterin, O.; Corander, J.; Flavell, A.J.; Kenicer, G.; Smýkal, P.; et al. Phylogeny, phylogeography and genetic diversity of the Pisum genus. Plant Genet. Res. 2011, 9, 4–18. [Google Scholar] [CrossRef]
  13. Makasheva, R.K. Gorokh (Pea). In Kulturnaya Flora SSR; Ed., Korovina, O.N., Eds.; 1979; Kolos Publishing: Leningrad, Russia. [Google Scholar]
  14. Ambrose, N.; Maxted, N. Peas (Pisum L.) Chapter 10. Plant Genetic Resources of Legumes in the Mediterranean; Eds., Bennett, S.J., Maxted, N., Eds.; 2000; Kluwer Academic Publishers: Dordrecht, The Netherlands. [Google Scholar]
  15. Ford-Lloyd, B.; Jarvis, A.; Guarino, L.; Hunter, D.; Hodgkin, T.; Heywood, V.; Dulloo, E.; Toledo, A.; Kell, S.; Maxted, N. A global approach to crop wild relative conservation: Securing the gene pool for food and agriculture. Kew Bull. 2010, 65, 561–576. [Google Scholar] [CrossRef]
  16. Ellis, T.H.N. Pisum. In Wild Crop Relatives: Genomic and Breeding Resources; Ed., Kole, C., Eds.; 2011; Springer-Verlag: Berlin-Heidelberg, Germany. [Google Scholar]
  17. Flavell, A.J.; Ellis, T.H.N.; Ambrose, M.J.; Marshall, D.; Smýkal, P.; Shaw, P.; Grzebyta, J.; Vershinin, A.; Jing, R. The genetic diversity and evolution of field pea (Pisum) studied by high throughput retrotransposon based insertion polymorphism (RBIP) marker analysis. BMC Evol. Biol. 2010, 10. [Google Scholar] [CrossRef] [PubMed] [Green Version]
  18. Flavell, A.; Dumet, D.; Duc, G.; Debouck, D.; Smýkal, P.; Berger, J.; Ellis, N.; Ambrose, M.; Dwivedi, S.L.; Upadhyaya, H.D.; et al. Legume genetic resources: Management, diversity assessment, and utilization in crop improvement. Euphytica 2011, 180, 27–47. [Google Scholar] [CrossRef]
  19. Miles, C.A.; Furman, B.J.; Ambrose, M.J.; Redden, R.J.; McGee, R.J.; Coyne, C.J. Genetic Adjustment to Changing Climates: Pea. In Crop Adaptation to Climate Change; Eds., Hall, A.E., Lotze-Campen, H., Hatfield, J.L., Redden, R.J., Yadav, S.S., Eds.; 2011; Wiley Blackwell: Chichester, UK. [Google Scholar]
  20. Ford, R.; Ades, P.; Yan, L.; Gu, J.; Liu, X.; Xu, Y.; Liu, J.; Guan, J.; Wang, S.; Liu, Q.; Redden, R.; Zong, X. Analysis of a diverse global Pisum sp. collection and comparison to a Chinese local P. sativum collection with microsatellite markers. Theor. Appl. Genet. 2009, 118, 193–204. [Google Scholar] [CrossRef] [PubMed]
  21. Coyne, C.J.; Timmerman-Vaughan, G.M.; Kisha, T.; Watt, C.A.; McGee, R.J.; Hu, J.; Brown, A.F.; Kwon, S.J. Population Genetic Sub-structure within the USDA ARS Pisum Core Collection and Its Potential as a Platform for Association Mapping. In Proceedings of the Plant , 13–17 January 2012; San Diego, CA, USA.
  22. Burstin, J.; Lallemand, J.; Lejeune-Hénaut, J.; Weinachter, C.; Potier, J.; Deniot, G.; Lainé, A.L.; Arnau, G.; Aubert, G.; Baranger, A.G. Genetic diversity within Pisum sativum using protein- and PCR-based markers. Theor. Appl. Genet. 2004, 108, 1309–1321. [Google Scholar] [CrossRef] [PubMed]
  23. Vandenberg, A.; Tullu, A.; Warkentin, T.D.; Zhang, C.; Tar’an, B. Genetic diversity among varieties and wild species accessions of pea (Pisum sativum L.) based on molecular markers, and morphological and physiological characters. Genome 2005, 48, 257–272. [Google Scholar] [CrossRef] [PubMed]
  24. Taylor, P.W.J.; Brouwer, J.B.; Itman, C.; Le Roux, K.; Ford, R. Diversity analysis and genotyping in Pisum with sequence tagged microsatellite site (STMS) markers. Euphytica 2002, 124, 397–405. [Google Scholar] [CrossRef]
  25. Griga, M.; Flavell, A.J.; Jarkovský, J.; Corander, J.; Hýbl, M.; Smýkal, P. Genetic diversity and population structure of pea (Pisum sativum L.) varieties derived from combined retrotransposon, microsatellite and morphological marker analysis. Theor. Appl. Genet. 2008, 117, 413–424. [Google Scholar] [CrossRef] [PubMed]
  26. Flavell, A.J.; Ellis, T.H.N.; Knox, M.R.; Ambrose, M.J.; Kiss, G.; Seres, A.; Johnson, R.; Jing, R. Gene-based sequence diversity analysis of field pea (Pisum). Genetics 2007, 177, 2263–2275. [Google Scholar] [CrossRef] [PubMed]
  27. Ambrose, M.J.; Vershinin, A.V.; Knox, M.R.; Poyser, S.J.; Ellis, T.H.N. Polymorphism of insertion sites of Ty1-copia class retrotransposons and its use for linkage and diversity analysis in pea. Mol. Gen. Genet. 1998, 260, 9–19. [Google Scholar] [PubMed]
  28. Isaac, P.; Ellis, T.H.N.; Russell, J.; Jing, R.; Booth, A.; Bolshakov, V.N.; Flavell, A.J. A microarray–based high throughput molecular marker genotyping method: The tagged microarray marker (TAM) approach. Nucl. Acids Res. 2003, 31. [Google Scholar] [CrossRef] [PubMed]
  29. Flavell, A.J.; Ellis, T.H.N.; Ambrose, M.; Vershinin, A.V.; Lee, J.M.; Knox, M.R.; Jing, R.C. Insertional polymorphism and antiquity of PDR1 retrotransposon insertions in Pisum species. Genetics 2005, 171, 741–752. [Google Scholar] [CrossRef] [PubMed]
  30. Smýkal, P. Development of an efficient retrotransposon-based fingerprinting method for rapid pea variety identification. J. Appl. Genet. 2006, 47, 221–230. [Google Scholar] [CrossRef] [PubMed]
  31. Frisch, M.; Melchinger, A.E.; Reif, J.C. Genetical and mathematical properties of similarity and dissimilarity coefficients applied in plant breeding and seed bank management. Crop Sci. 2005, 45, 1–7. [Google Scholar] [CrossRef]
  32. Rannala, B.; Beaumont, M.A. The Bayesian revolution in genetics. Nat. Rev. Genet. 2004, 5, 251–261. [Google Scholar] [PubMed]
  33. Sillanpää, M.J.; Waldmann, P.; Corander, J. Bayesian analysis of genetic differentiation between populations. Genetics 2003, 164, 367–374. [Google Scholar]
  34. Griga, M.; Hýbl, M.; Procházka, S.; Hanáček, P.; Dočkalová, Z.; Smýkal, P.; Cieslarová, J. Molecular evidence of genetic diversity changes in pea (Pisum sativum L.) germplasm after long-term maintenance. Genet. Resour. Crop Evol. 2011, 58, 439–451. [Google Scholar] [CrossRef]
  35. Larrianzar, E.; Imran, A.; Gonzalez, E.M.; Hafeez, F.Y.; Arrese-Igor, C.; Shivakumar, B.G.; Kantar, F. Efficient Biological Nitrogen Fixation under Warming Climates. In Climate Change and Management of Cool Season Grain legume Crops; Eds., Patil, A., Redden, R., McNeil, D., Yadav, S., Eds.; 2010; Springer: Dordrecht, The Netherland. [Google Scholar]
  36. Slattery, J.; Croser, J.; Ford, R.; Leonforte, T.; Redden, B. Pea (Pisum sativum L.). In Genetic Resources, Chromosome Engineering, and Crop Improvement: Series II—Grain Legumes; Ed., Singh, R., Eds.; 2004; Department of Crop Sciences,University of Illinois: Champaign, IL, USA. [Google Scholar]
  37. Dixit, G.P.; Tanveer, H.; Choudhury, P.R. Identification and detection of genetic relatedness among important varieties of pea (Pisum sativum L.) grown in India. Genetica 2007, 130, 183–191. [Google Scholar] [CrossRef] [PubMed]
  38. Hall, A.E.; Lotze-Campen, H.; Hatfield, J.L.; Redden, R.J.; Yadav, S.S. Crop Adaptation to Climate Change; 2011; Wiley Blackwell: Chichester, UK. [Google Scholar]
  39. Redden, R.J.; Rose, I.A.; Guan, J.; Yan, Q.; Liu, Y.; Feng, Q.; Yuan, M.; Wu, K.; Liu, Y.; He, C.; et al. Collecting and surveying landraces of pea (Pisum sativum) and faba bean (Vicia faba) in Qinghai province of China. Plant Genet. Res. Newsl. 2008, 156, 1–10. [Google Scholar]
  40. Paull, J.; Redden, R.J.; Leonforte, T.; Rose, I.A.; Enneking, D.; Lichi, L.; Wang, L.; Zong, X.; Yuhua, H.; Bao, S. Collection of pea (Pisum sativum) and faba bean (Vicia faba) germplasm in Yunnan. Plant Genet. Res. Newsl. 2008, 156, 11–22. [Google Scholar]
  41. Kneller, M.; Scheldman, X.; Jarvis, A.; Ehsan, E.; Snook, L.K. Crop germplasm Diversity: The Role of Gene Bank Collections in Facilitating Adaptation to Climate Change. In Crop Adaptation to Climate Change; Eds., Hall, A.E., Lotze-Campen, H., Hatfield, J.L., Redden, R.J., Yadav, S.S., Eds.; 2011; Wiley Blackwell: Chichester, UK. [Google Scholar]
  42. Yan, G.; Khan, T.; Hardie, D.C.; Byrne, O.M. Genetic analysis of pod and seed resistance to pea weevil in a Pisum sativum x P. fulvum interspecific cross. Aust. J. Agric. Res. 2008, 59, 854–862. [Google Scholar] [CrossRef]
  43. Rubiales, D.; Moreno, M.T.; Torres, A.M.; Fondevilla, S. Identification of a new gene for resistance to powdery mildew in Pisum fulvum, a wild relative of pea. Breed Sci. 2007, 57, 181–184. [Google Scholar] [CrossRef]
  44. De Vilmorin, P. Fixite des Races de Froments. IVe Conference Internationale de Genetique—Paris 1911. Comptes-rendus et Rapport Edite s par Philippe de Vilmorin; Masson: Paris, France, 1913; pp. 312–316.
  45. Blixt, S. Mutation genetics in Pisum. Agric. Hort. Genet. 1972, 30, 1–293. [Google Scholar]
  46. Si, P.; Xu, X.; Nakagawa, H.; Islam, M.M.; Shah, T.; Toker, C.; Cagirgan, M.I.; Kharkwal, M.C. Legume Mutant Varieties for Food, Feed and Environmental Benefits. Proceedings of the 5th International Food Legumes Research Conference (IFLRC) 196.
  47. Guichard, C.; de Oliveira, Z.; Brunaud, V.; Aubert, G.; Savois, V.; Burstin, J.; Moussy, F.; Le Signor, C.; Schmidt, J.; Dalmais, M.; et al. UTILLdb, a Pisum sativum in silico forward and reverse genetics tool. Genome Biol. 2008, 9. [Google Scholar] [CrossRef]
  48. Messager, J.; Duc, G. A mutagenesis of pea (Pisum sativum L.) and the isolation of mutants for nodulation and nitrogen-fixation. Plant Sci. 1989, 60, 207–213. [Google Scholar] [CrossRef]
  49. Duc, G.; Huguet, T.; Sagan, M. Phenotypic characterization and classification of nodulation mutants of pea (Pisum sativum L.). Plant Sci. 1994, 100, 59–70. [Google Scholar] [CrossRef]
  50. Duc, G.; Sagan, M. Sym28 and Sym29, two new genes involved in regulation of nodulation in pea (Pisum sativum L.). Symbiosis 1996, 20, 229–245. [Google Scholar]
  51. Ambrose, M.; Tabata, S.; Sato, S.; Weng, L.; Yang, J.; Xu, S.; Wang, L.; Li, X.; Luo, Y.; Wang, Z.; et al. Genetic control of floral zygomorphy in pea (Pisum sativum L.). Proc. Natl. Acad. Sci. USA 2008, 105, 10414–10419. [Google Scholar] [CrossRef] [PubMed]
  52. Le Signor, C.; Dalmais, M.; Dupin, A.; Weller, J.; Butcher, S.; Isaac, P.; Ambrose, M.; Moreau, C.; Turner, L.; Hofer, J.; et al. Tendril-less regulates tendril formation in pea leaves. Plant Cell 2009, 21, 420–428. [Google Scholar] [CrossRef] [PubMed] [Green Version]
  53. Jacobs, J.M.E.; Hofer, J.M.I.; Murray, S.R.; Frew, T.J.; Fiers, M.W.E.J.; Thomson, S.J.; Schwinn, K.E.; Lin-Wang, K.; Moreau, C.; Hellens, R.P.; et al. Identification of Mendel’s white flower character. PLoS One 2010, 5. [Google Scholar] [CrossRef] [PubMed] [Green Version]
  54. Ambrose, M.; Duc, G.; Burstin, J.; Warkentin, T.; Hýbl, M.; Flavell, A.J.; Redden, R.; Ford, R.; Coyne, C.J.; Smýkal, P.; et al. Effort towards a world pea (Pisum sativum L.) germplasm core collection: The case for common markers and data compatibility. Pisum Genet. 2008, 40, 11–14. [Google Scholar]
  55. Buckler, E.S.; Gore, M.; Zhu, C. Status and prospects of association mapping in plants. Plant Genome 2008, 1, 5–20. [Google Scholar] [CrossRef]
  56. Zhang, Z.; Lu, T.; Zhu, C.; Li, C.; Zhao, Y.; Feng, Q.; Zhao, Q.; Sang, T.; Wei, X.; Huang, X.; et al. Genome-wide association studies of 14 agronomic traits in rice landraces. Nat. Genet. 2010, 42, 961–967. [Google Scholar] [CrossRef] [PubMed]
  57. Rafalski, A.J.; Morgante, M.; Scott Tingey, S.; Smith, O.S.H.; Dolan, M.; Jung, M.; Caldwell, K.S.; Ching, A. SNP frequency, haplotype structure and linkage disequilibrium in elite maize inbred lines. BMC Genet 2002, 3. [Google Scholar] [CrossRef] [Green Version]
  58. Keller, B.; Yahiaouia, N.; Mackay, M.; Street, K.; Bhullar, N.K. Unlocking wheat genetic resources for the molecular identification of previously undescribed functional alleles at the Pm3 resistance locus. Proc. Natl. Acad. Sci. USA 2009, 106, 9519–9524. [Google Scholar] [CrossRef] [PubMed] [Green Version]
  59. Flavell, A.J.; van Hintum, T.J.L.; Dicks, J.; Ambrose, M.J.; Ellis, T.H.N.; Marshall, D.; Davenport, G.F.; Lee, M.J. GERMINATE. A Generic database for integrating genotypic and phenotypic information for plant genetic resource collections. Plant Physiol. 2005, 139, 619–631. [Google Scholar] [CrossRef] [PubMed]
  60. Mackay, M.; Sinnott, Q.; Emberland, G.; Bohning, M.; Kinard, G.; Franko, T.; Bretting, P.; Ayala-Silva, T.; Hummer, K.; Postman, J.; et al. GRIN-GLOBAL: An international project to develop a global plant genebank information management system. ISHS Acta Hort. 2010, 859, 49–55. [Google Scholar]
  61. Stougaard, J. Genetics and genomics of root symbiosis. Curr. Opin. Plant Biol. 2001, 4, 328–335. [Google Scholar] [CrossRef] [PubMed]
  62. Greilhuber, J.; Dolezel, J. Greilhuber, J. Nuclear genome size. Are we getting closer? Cytometry 2010, 77, 635–642. [Google Scholar] [PubMed]
  63. Bernardi, G.; Montero, L.M.; Matassi, G.; Salinas, J. Compositional compartmentalization and compositional patterns in the nuclear genomes of plants. Nucl. Acids Res. 1988, 16, 4269–4285. [Google Scholar] [CrossRef] [PubMed]
  64. Thompson, W.F.; Cuellar, R.E.; Murray, M.G. DNA sequence organization in the pea genome. Biochemistry 1978, 17, 5781–5790. [Google Scholar] [CrossRef] [PubMed]
  65. Thompson, W.F.; Peters, D.L.; Murray, M.G. Ancient repeated sequences in the pea and mung bean genomes and implications for genome evolution. J. Mol. Evol. 1981, 17, 31–42. [Google Scholar] [CrossRef]
  66. Smith, D.B.; Smith, J.B.; Bennett, M.D.; Flavell, R.B. Genome size and the proportion of repeated nucleotide sequence DNA in plants. Biochem. Genet. 1974, 12, 257–269. [Google Scholar] [CrossRef] [PubMed]
  67. Macas, J.; Neumann, P.; Novák, P. Graph-based clustering and characterization of repetitive sequences in next-generation sequencing data. BMC Bioinforma 2010, 11. [Google Scholar] [CrossRef]
  68. Navrátilová, A.; Neumann, P.; Macas, J. Repetitive DNA in the pea (Pisum sativum L.) genome: Comprehensive characterization using 454 sequencing and comparison to soybean and Medicago truncatula. BMC Genomics 2007, 8. [Google Scholar] [CrossRef] [PubMed]
  69. Macas, J.; Pozárková, D.; Neumann, P. Highly abundant pea LTR retrotransposon Ogre is constitutively transcribed and partially spliced. Plant Mol. Biol. 2003, 53, 399–410. [Google Scholar] [CrossRef] [PubMed]
  70. Neumann, P.; Macas, J. Ogre elements—A distinct group of plant Ty3/gypsy-like retrotransposons. Gene 2007, 390, 108–116. [Google Scholar] [CrossRef] [PubMed]
  71. Macas, J.; Neumann, P.; Steinbauerová, V. Experimental evidence for splicing of intron-containing transcripts of plant LTR retrotransposon Ogre. Mol. Genet. Genomics 2008, 280, 427–436. [Google Scholar] [CrossRef] [PubMed]
  72. Macas, J.; Navrátilová, A.; Koblízková, A.; Neumann, P. Significant expansion of Vicia pannonica genome size mediated by amplification of a single type of giant retroelement. Genetics 2006, 173, 1047–1056. [Google Scholar] [CrossRef] [PubMed]
  73. Neumann, P.; Navrátilová, A.; Koblízková, A.; Macas, J. Hypervariable 3´UTR region of plant LTR-retrotransposons as a source of novel satellite repeats. Gene 2009, 448, 198–206. [Google Scholar] [CrossRef] [PubMed]
  74. Cerff, R.; Liaud, M.F.; Zhang, D.X.; Chavanne, F. Structure and evolution of Cyclops: A novel giant retrotransposon of the Ty3/Gypsy family highly amplified in pea and other legume species. Plant Mol. Biol. 1998, 37, 363–375. [Google Scholar] [CrossRef] [PubMed]
  75. Ellis, T.H.; Vershinin, A.V. Heterogeneity of the internal structure of PDR1, a family of Ty1/copia-like retrotransposons in pea. Mol. Gen. Genet. 1999, 262, 703–713. [Google Scholar] [CrossRef] [PubMed]
  76. Ellis, N.T.H.; Ambrose, M.J.; Knox, M.R.; Allnutt, T.R.; Vershinin, A.V. Transposable elements reveal the impact of introgression, rather than transposition, in Pisum diversity, evolution, and domestication. Mol. Biol. Evol. 2003, 20, 2067–2075. [Google Scholar] [CrossRef] [PubMed]
  77. Macas, J.; Koblízková, A.; Pozárková, D.; Neumann, P. PIGY: A new plant envelope-class LTR retrotransposon. Mol. Genet. Genomics 2005, 273, 43–53. [Google Scholar] [CrossRef] [PubMed]
  78. Griga, M.; Macas, J.; Ford, R.; Kalendar, R.; Smýkal, P. Evolutionary conserved lineage of Angela-family retrotransposons as a genome-wide microsatellite repeat dispersal agent. Heredity 2009, 103, 157–167. [Google Scholar] [CrossRef] [PubMed]
  79. Pozárková, D.; Neumann, P.; Macas, J. Zaba: A novel miniature transposable element present in genomes of legume plants. Mol. Genet. Genomics 2003, 269, 624–631. [Google Scholar] [CrossRef] [PubMed]
  80. Neumann, P.; Koblízková, A.; Macas, J. Characterization of Stowaway MITEs in pea (Pisum sativum L.) and identification of their potential master elements. Genome 2005, 48, 831–839. [Google Scholar] [CrossRef] [PubMed]
  81. Macas, J.; Dolezel, J.; Widmer, A.; Hobza, R.; Hribova, E.; Kejnovsky, E.; Koblizkova, A.; Navratilova, A.; Neumann, P. Plant centromeric retrotransposons: A structural and cytogenetic perspective. Mob. DNA 2011, 2. [Google Scholar] [CrossRef]
  82. Macas, J.; Neumann, P.; Navrátilová, A. Long-range organization of plant satellite repeats investigated using strand-specific FISH. Cytogenet. Genome Res. 2005, 109, 58–62. [Google Scholar] [CrossRef] [PubMed]
  83. Macas, J.; Nouzová, M.; Neumann, P. Molecular and cytogenetic analysis of repetitive DNA in pea (Pisum sativum L.). Genome 2001, 44, 716–728. [Google Scholar] [PubMed]
  84. Macas, J.; Dolezel, J.; Vrána, J.; Pozárková, D.; Neumann, P. Chromosome sorting and PCR-based physical mapping in pea (Pisum sativum L.). Chromosome Res. 2002, 10, 63–71. [Google Scholar] [CrossRef] [PubMed]
  85. Ellis, T.H.; Parker, J.S.; Hall, K.J. The relationship between genetic and cytogenetic maps of pea. I. Standard and translocation karyotypes. Genome 1997, 40, 744–754. [Google Scholar] [CrossRef] [PubMed]
  86. Miravalle, R.J.; Lamm, R. A translocation tester set in Pisum. Hereditas 1959, 45, 417–440. [Google Scholar]
  87. Lamm, R. Transpositions in Pisum. Pisum Newsl. 1977, 9, 28–29. [Google Scholar]
  88. Folkeson, D. Assignment of linkage segments to the satellite chromosomes 4 and 7 in Pisum sativum. Hereditas 1990, 112, 257–263. [Google Scholar]
  89. Poyser, S.J.; Ellis, T.H.N. An integrated and comparative view of pea genetic and cytogenetic maps. New Phytol. 2002, 153, 17–25. [Google Scholar] [CrossRef]
  90. Schubert, I.; Kühne, M.; Fuchs, J. Assignment of linkage groups to pea chromosomes after karyotyping and gene mapping by fluorescent in situ hybridization. Chromosoma 1998, 107, 272–276. [Google Scholar] [CrossRef] [PubMed]
  91. Lejeune-Hénault, I.; Coyne, C.J.; Baranger, A.; Rameau, C.; Aubert, G.; Pilet-Nayel, M.L.; Dubreuil, P.; Morin, J.; McPhee, K.E.; Loridon, K.; et al. Microsatellite marker polymorphism and mapping in pea (Pisum sativum L.). Theor. Appl. Genet. 2005, 111, 1022–1031. [Google Scholar] [CrossRef] [PubMed]
  92. Ambrose, M.; Ellis, T.H.; Timmerman-Vaughan, G.M.; Swiecicki, W.K.; Weeden, N.F. The current pea linkage map. Pisum Genet. 1996, 28, 1–4. [Google Scholar]
  93. McPhee, K. Pea. In Pulses, Sugar and Tuber Crops. Genome Mapping and Molecular Breeding in Plants; Ed., Kole, C., Eds.; 2007; Volume 3, pp. 33–47. Springer-Verlag: Berlin, Germany. [Google Scholar]
  94. Burstin, J.; Huguet, T.; Lejeune-Hénaut, I.; Rameau, C.; Petit, A.; Quillet, M.C.; Loridon, K.; Jacquin, F.; Morin, J.; Aubert, G. Functional mapping in pea, as an aid to the candidate gene selection and for investigating synteny with the model legume. Medicago truncatula. Theor. Appl. Genet. 2006, 112, 1024–1041. [Google Scholar] [CrossRef] [PubMed]
  95. Marx, G.; Weeden, N.F. Further genetic analysis and linkage relationships of isozyme loci in the pea: Confirmation of the diploid nature of the genome. J. Hered. 1987, 78, 153–159. [Google Scholar]
  96. Swiêcicki, W.K.; Wolko, B.; Irzykowska, L. The genetic linkage map of pea (Pisum sativum L.) based on molecular, biochemical and morphological markers. Pisum Genet. 2001, 33, 13–18. [Google Scholar]
  97. Rameau, C.; Ellis, N.; Haurogne, K.; Laucou, V. Genetic mapping in pea. I. RAPD-based linkage map of Pisum sativum. Theor. Appl. Genet 1998, 97, 905–915. [Google Scholar] [CrossRef]
  98. Timmerman-Vaughan, G.M.; Frew, T.J.; McCallum, J.A.; Gilpin, B.J. A linkage map of the pea (Pisum sativum L.) genome containing cloned sequences of known function and expressed sequence tags (ESTs). Theor. Appl. Genet. 1997, 95, 1289–1299. [Google Scholar] [CrossRef]
  99. Boone, W.E.; Weeden, N.F. Mapping the Rb locus on linkage group III using long PCR followed by endonuclease digestion. Pisum Genet. 1999, 31, 36. [Google Scholar]
  100. Weeden, N.F.; Frew, T.J.; Timmerman-Vaughan, G.M. Characterization and linkage mapping of R-gene analogous DNA sequences in pea (Pisum sativum L.). Theor. Appl. Genet. 2000, 101, 241–247. [Google Scholar] [CrossRef]
  101. Gostimsky, S.; Toshchakova, E.; Konovalov, F. A CAPS marker set for mapping in linkage group III of pea (Pisum sativum L.). Cell. Mol. Biol. Lett. 2005, 10, 163–171. [Google Scholar] [PubMed]
  102. Berdnikov, V.A.; Rozov, S.M.; Swiecicki, W.K.; Timmerman-Vaughan, G.M.; Ellis, T.H.N.; Weeden, N.F. A consensus linkage map for Pisum sativum. Pisum Genet. 1998, 30, 1–3. [Google Scholar]
  103. Aubert, G.; Burstin, J.; Lejeune-Hénaut, I.; Donnadieu, C.; Jacquin, F.; Marty, A.; Charrel, H.; Deulvot, C. Highly-multiplexed SNP genotyping for genetic mapping and germplasm diversity studies in pea. BMC Genomics 2010, 11. [Google Scholar] [CrossRef] [PubMed]
  104. Murat, F.; Rond, C.; Houtin, H.; Potier, J.; Bourgeois, M.; Chauveau, A.; Salse, J.; Nicolas, M.; Savois, V.; Bordat, A.; et al. Translational genomics in legumes allowed placing insilico 5460 unigenes on the pea functional map and identified candidate genes in Pisum sativum L. G3. G3. Genes-Genomes-Genetics 2011, 2, 93–103. [Google Scholar]
  105. Shultz, J.; Brumett, S.; Coyne, C.; Decarie, J. Additional pea EST-SSR markers for comparative mapping in pea (Pisum sativum L.). Plant Breed. 2012, 131, 222–226. [Google Scholar] [CrossRef]
  106. Ellis, T.H.N.; Knox, M.R. Excess heterozygosity contributes to genetic map expansion in pea recombinant inbred populations. Genetics 2002, 162, 861–873. [Google Scholar] [PubMed]
  107. Ellis, T.H.N.; Knox, M.R. Stability and inheritance of methylation states at PstI sites in Pisum. Mol. Genet. Genomics 2001, 265, 497–507. [Google Scholar] [CrossRef] [PubMed]
  108. Udvardi, M.; Young, N.D. Translating Medicago truncatula genomics to crop legumes. Curr. Opin. Plant Biol. 2009, 12, 193–201. [Google Scholar] [CrossRef] [PubMed]
  109. Tabata, S.; Isobe, S.; Asamizu, E.; Nakamura, Y.; Sato, S. Genome sequencing and genome resources in model legumes. Plant Physiol. 2007, 144, 588–593. [Google Scholar] [CrossRef] [PubMed]
  110. Cook, D.R.; Hoisington, D.A.; Singh, N.K.; Close, T.J.; Varshney, R.K. Orphan legume crops enter the genomics era! Curr. Opin. Plant Biol. 2009, 12, 202–210. [Google Scholar] [CrossRef]
  111. Jackson, S.A.; May, G.D.; Cannon, S.B. Three sequenced legume genomes and many crop species: Rich opportunities for translational genomics. Plant Physiol. 2009, 151, 970–977. [Google Scholar] [CrossRef] [PubMed]
  112. Vavilov, N.I. The law of homologous series in variation. J. Genetic. 1922, 12, 47–89. [Google Scholar] [CrossRef]
  113. Ladizinsky, G.; Muehlbauer, F.J.; Weeden, N.F. Extensive conservation of linkage relationships between pea and lentil genetic maps. J. Hered. 1992, 83, 123–129. [Google Scholar]
  114. Muehlbauer, F.J.; Simon, C.J. Construction of a chickpea linkage map and its comparison with maps of pea and lentil. J. Hered. 1997, 88, 115–119. [Google Scholar] [CrossRef]
  115. Cook, D.R.; Doyle, J.; Luckow, M.A.; Choi, H.K. Development of nuclear gene-derived molecular markers linked to legume genetic maps. Mol. Genet. Genomics 2006, 276, 56–70. [Google Scholar] [CrossRef] [PubMed]
  116. Kiss, G.B.; Ellis, T.H.N.; Kereszt, G.E.; Kevei, Z.A.; Jaka, J.; Taylor, S.A.; Seres, A.; Kalo, P. Comparative mapping between Medicago sativa and Pisum sativum. Mol. Genet. Genomics 2004, 272, 235–246. [Google Scholar] [CrossRef] [PubMed]
  117. Thelen, J.J.; Qijian Song, Q.; Hyten, D.L.; David, L.; Nelson, W.; Mitros, T.; Ma, J.; Schlueter, J.; Cannon, S.B.; Schmutz, J.; et al. Genome sequence of the palaeopolyploid soybean. Nature 2010, 463, 178–183. [Google Scholar] [CrossRef] [PubMed]
  118. Weller, J.L.; Macknight, R.C.; Murfet, I.C.; Sussmilch, F.C.; Liew, L.C.; Knowles, C.L.; Ridge, S.; Vander Schoor, J.K.; Laurie, R.E.; Hecht, V. The pea GIGAS gene is a FLOWERING LOCUS T homolog necessary for graft-transmissible specification of flowering but not for responsiveness to photoperiod. Plant Cell 2011, 23, 147–161. [Google Scholar] [CrossRef] [PubMed]
  119. Bisseling, T.; Lauber, E.; Ané, J.M.; Journet, E.P.; Duc, G.; Kulikova, O.; Chalhoub, B.; Geurts, R.; Bres, C.; Levy, J.; et al. A putative Ca2+ and Calmodulin-dependent protein kinase required for bacterial and fungal symbioses. Science 2004, 303, 1361–1364. [Google Scholar] [CrossRef] [PubMed]
  120. de Bruijn, F.; Tabata, S.; Kaneko, T.; Duc, G.; Szczyglowski, K.; Genua, A.; Aubert, G.; Sato, S.; Madsen, L.H.; Krusell, L.; et al. Shoot control of root development and nodulation is mediated by a receptor-like kinase. Nature 2002, 420, 422–426. [Google Scholar] [CrossRef] [PubMed]
  121. Nakagawa, T.; Aubert, G.; Otsubo, Y.; Oka-Kira, E.; Okamoto, S.; Grossmann, C.; Koch, E.B.V.; Fukuhara, I.; Sato, N.; Krusell, L.; et al. The Clavata2 genes of pea and Lotus japonicus affect autoregulation of nodulation. Plant J. 2008, 65, 861–871. [Google Scholar]
  122. Weber, H.; Saalbach, I.; Fernie, A.R.; Fait, A.; Weichert, H.; Muller, M.; Radchuk, R.; Kuster, H.; Weigelt, K. Increasing amino acid supply in pea embryos reveals specific interactions of N and C metabolism, and highlights the importance of mitochondrial metabolism. Plant J. 2008, 55, 909–926. [Google Scholar] [CrossRef] [PubMed]
  123. Hosein, F.; Desel, C.; Emery, R.J.N.; Wasternack, C.; Miersch, O.; Fernie, A.R.; Fait, A.; Rutten, T.; Küster, H.; Weigelt, K.; et al. ADP-glucose pyrophosphorylase-deficient pea embryos reveal specific transcriptional and metabolic changes of carbon-nitrogen metabolism and stress responses. Plant Physiol. 2009, 149, 395–411. [Google Scholar] [CrossRef] [PubMed]
  124. Weschke, W.; Fernie, A.R.; Nunes-Nesi, A.; Küster, H.; Emery, R.J.N.; Hajirezaei, M.R.; Meitzel, T.; Radchuk, R.; Häusler, R.E.; Riebeseel, E.; et al. The 2-oxoglutarate/malate translocator mediates amino acid and storage protein biosynthesis in pea embryos. Plant J. 2010, 61, 350–363. [Google Scholar] [PubMed]
  125. Weber, H.; Weschke, W.; Feil, R.; Lunn, J.E.; Geigenberger, P.; Vigeolas, H.; Weier, D.; Emery, N.J.R.; Radchuk, R. Sucrose non-fermenting kinase 1 (SnRK1) coordinates metabolic and hormonal signals during pea cotyledon growth and differentiation. Plant J. 2010, 61, 324–338. [Google Scholar] [PubMed]
  126. Rubiales, D.; Cubero, J.I.; Krajinski, F.; Küster, H.; Fondevilla, S. Identification of genes differentially expressed in a resistant reaction to Mycosphaerella pinodes in pea using microarray technology. BMC Genomics 2011, 12. [Google Scholar] [CrossRef] [PubMed]
  127. Weber, A.P.M.; Bornberg-Bauer, E.; Bräutigam, A.; Shrestha, R.P.; Franssen, S.U. Comprehensive transcriptome analysis of the highly complex Pisum sativum genome using next generation sequencing. BMC Genomics 2011, 12. [Google Scholar] [CrossRef] [PubMed]
  128. Bourguignon, J.; Garin, J.; Macherel, D.; Rabilloud, T.; Luche, S.; Jourdain, A.; Jaquinod, M.; Louwagie, M.; Bardel, J. A survey of the plant mitochondrial proteome in relation to development. Proteomics 2002, 2, 880–898. [Google Scholar] [CrossRef] [PubMed]
  129. Wienkoop, S.; Erik, P.; Saalbach, G. Characterisation by proteomics of peribacteroid space and peribacteroid membrane preparations from pea (Pisum sativum) symbiosomes. Proteomics 2002, 2, 325–337. [Google Scholar] [CrossRef] [PubMed]
  130. Burstin, J.; Sommerer, N.; Negroni, L.; Huart, M.; Gallardo, K.; Schiltz, S. Proteome reference maps of vegetative tissues in pea. An investigation of nitrogen mobilization from leaves during seed filling. Plant Physiol. 2004, 135, 2241–2260. [Google Scholar] [CrossRef] [PubMed]
  131. Bourgeois, M.; Jacquin, F.; Savois, V.; Sommerer, N.; Labas, V.; Henry, C.; Burstin, J. Dissecting the proteome of pea mature seeds reveals the phenotypic plasticity of seed protein composition. Proteomics 2009, 9, 254–271. [Google Scholar] [CrossRef] [PubMed]
  132. Jorrín, J.V.; Rubiales, D.; Maldonado, A.M.; Lopez, J.A.; Camafeita, E.; Curto, M. A proteomic approach to study pea (Pisum sativum) responses to powdery mildew (Erysiphe pisi). Proteomics 2006, 6, S163–S174. [Google Scholar] [CrossRef] [PubMed]
  133. Delbreil, B.; Lejeune-Hénaut, I.; Hilbert, J.L.; Sellier, H.; Valot, B.; Goulas, E.; Bahrman, N.; Dumont, E. A proteomic approach to decipher chilling response from cold acclimation in pea (Pisum sativum L.). Plant Sci. 2011, 180, 86–98. [Google Scholar] [CrossRef] [PubMed]
  134. Jorrín, J.V.; Rubiales, D.; Gaudot, E.D.; Amiour, N.; Castillejo, M.A. A proteomic approach to studying plant response to crenate broomrape (Orobanche crenata) in pea (Pisum sativum). Phytochemistry 2004, 65, 1817–1828. [Google Scholar] [CrossRef] [PubMed]
  135. Jorrin, J.V.; Rubiales, D.; Fondevilla, S.; Curto, M.; Castillejo, M.A. Two-dimensional electrophoresis based proteomic analysis of the pea (Pisum sativum) in response to Mycosphaerella pinodes. J. Agric. Food Chem. 2010, 58, 12822–12832. [Google Scholar] [CrossRef] [PubMed]
  136. Burstin, J.; Marget, P.; Huart, M.; Quillien, L.; Aubert, G.; Belghazi, M.; Savois, V.; Cassecuelle, F.; Jacquin, F.; Bourgeois, M. A PQL (protein quantity loci) analysis of mature pea seed proteins identifies loci determining seed protein composition. Proteomics 2011, 9, 1581–1594. [Google Scholar]
  137. Mullineaux, P.M.; Chinoy, C.; Ambrose, M.; Arques, J.L.; Oehlschlager, S.; Godward, J.; Jones, S.A.; Harrison, M.; Donarski, J.A.; Charlton, A.; et al. Responses of the pea (Pisum sativum L.) leaf metabolome to drought stress assessed by nuclear magnetic resonance spectroscopy. Metabolomics 2008, 4, 312–327. [Google Scholar] [CrossRef]
  138. Oehlschlager, S.; Mullineaux, P.; Ellis, N.; Bean, S.; Chisholm, J.; Holmes, S.; Allnutt, T.; Charlton, A. NMR profiling of transgenic peas. Plant Biotechnol. J. 2004, 2, 27–35. [Google Scholar] [CrossRef] [PubMed]
  139. Tanksley, S.D. Mapping polygenes. Ann. Rev. Genet. 1993, 27, 205–233. [Google Scholar] [CrossRef] [PubMed]
  140. Young, N.D. QTL mapping and quantitative disease resistance in plants. Ann. Rev. Phytopatol. 1996, 34, 479–501. [Google Scholar] [CrossRef]
  141. Hýbl, M.; Dostálová, R.; Horáček, J.; Smýkal, P. Variety discrimination in pea (Pisum sativum L.) by molecular, biochemical and morphological markers. J. Appl. Genet. 2008, 49, 155–166. [Google Scholar] [CrossRef] [PubMed]
  142. Scholz, U.; Grosse, I.; Thiel, T.; Miehe, H.; Funke, T.; Lange, M.; Künne, C. CR-EST: A resource for crop ESTs. Nucleic Acids Res. 2005, 33, D619–D621. [Google Scholar] [PubMed]
  143. Bhalla, P.L.; Smyth, G.K.; Phipson, B.; Beveridge, C.A.; Singh, M.B.; Wong, C.E.; Liang, D. Molecular dissection of the pea shoot apical meristem. Exp. Bot. 2009, 60, 4201–4213. [Google Scholar] [CrossRef]
  144. Mitchell, S.E.; Buckler, E.S.; Kawamoto, K.; Poland, J.A.; Sun, Q.; Glaubitz, J.C.; Elshire, R.J. A robust, simple genotyping-by-sequencing (GBS) approach for high diversity species. PLoS One 2011, 6. [Google Scholar] [CrossRef] [PubMed]
  145. Cockram, J.; White, J.; Zuluaga, D.L.; Smith, D.; Comadran, J.; Macaulay, M.; Luo, Z.; Kearsey, M.J.; Werner, P.; Harrap, D.; et al. Genome-wide association mapping to candidate polymorphism resolution in the unsequenced barley genome. Proc. Natl. Acad. Sci. USA 2010, 107, 21611–21616. [Google Scholar] [CrossRef] [PubMed]
  146. Graner, A.; Kilian, B.; Haseneyer, G.; van Eeuwijk, F.A.; Malosetti, M.; Sharma, R.; Pasam, R.K. Genome-wide association studies for agronomical traits in a world wide spring barley Collection. BMC Plant Biol. 2012, 12. [Google Scholar] [CrossRef] [PubMed]
  147. Sorrells, M.E.; Jannink, J.L.; Lorenz, A.J.; Heffner, E.L. Plant breeding with genomic selection: Gain per unit time and cost. Crop Sci. 2010, 50, 1681–1690. [Google Scholar] [CrossRef]
  148. Pfleger, F.L.; Kraft, J.M. Compendium of Pea Diseases and Pests; 2001; APS Press: St. Paul, MN, USA. [Google Scholar]
  149. Weeden, N.F.; Grey, W.; Hance, S.T. Indentification of tolerance to Fusarium solani in Pisum sativum ssp. elatius. Pisum Genet. 2004, 36, 9–13. [Google Scholar]
  150. Porter, L.; Weeden, N. The genetic basis of Fusarium root rot tolerance in the Afghanistan pea. Pisum Genet. 2007, 39, 35–36. [Google Scholar]
  151. Xue, A.G.; McLaren, D.L.; Gossen, B.D.; Strelkov, S.E.; Hwang, S.F.; Conner, R.L.; Chang, K.F.; Hwang, R.; Feng, J. Identification of microsatellite markers linked to quantitative trait loci controlling resistance to Fusarium root rot in field pea. Can. J. Plant Sci. 2011, 91, 199–204. [Google Scholar] [CrossRef]
  152. Coyne, C.J.; Inglis, D.A.; McPhee, K.E.; McClendon, M.T.; Keller, K.E.; Okubara, P.A. Y15_999Fw, a dominant SCAR marker linked to the Fusarium wilt race 1 (Fw) resistance gene in pea. Pisum Genet. 2005, 37, 32–35. [Google Scholar]
  153. Muehlbauer, F.J.; Grajal-Martin, M.J. Genomic location of the Fw gene for resistance to fusarium wilt race 1 in peas. J. Hered. 2002, 93, 291–293. [Google Scholar] [CrossRef] [PubMed]
  154. Coyne, C.J.; McPhee, K.E.; Inglis, D.A.; McClendon, M.T. DNA markers for Fusarium wilt race 1 resistance gene in pea. J. Am. Soc. Hort. Sci. 2002, 127, 602–607. [Google Scholar]
  155. Muehlbauer, F.J.; Whitehead, S.J.; Inglis, D.A.; Coyne, C.J. Chromosomal location of Fwf in pea. Pisum Genet. 2000, 32, 20–22. [Google Scholar]
  156. Coyne, C.J.; Gunderson, B.; Inglis, D.A.; McPhee, K.E. Mapping a resistance gene for Fusarium wilt Race 2 on LG IV of pea (Pisum sativum L.). Plant Breed. 2012. [Google Scholar] [CrossRef]
  157. Matthews, P.; Lewis, B.G.; Darby, P. heritance and Expression of Resistance to Ascochyta pisi. In The Pea Crop; Eds., Dawkins, T.C., Heath, M.C., Hebblethwaite, P.D., Eds.; 1985; Butterworths: London, UK. [Google Scholar]
  158. Lewis, B.G.; Matthews, P.; Clulow, S.A. Genetical analysis of resistance to Mycosphaerella pinodes in pea seedlings. Euphytica 1991, 58, 183–189. [Google Scholar] [CrossRef]
  159. Falloon, K.; Murray, S.; Gilpin, M.; Butler, R.; Khan, T.; Russell, A.C.; Frew, T.J.; Timmerman-Vaughan, G.M. QTL mapping of partial resistance to field epidemics of Ascochyta blight of peas. Crop Sci. 2002, 42, 2100–2111. [Google Scholar] [CrossRef]
  160. Khan, T.; Russell, A.; Lakeman, M.B.; Johnston, P.; Falloon, K.; Gilpin, M.; Murray, S.; Butler, R.; Frew, T.J.; Timmerman-Vaughan, G.M. Validation of quantitative trait loci for Ascochyta blight resistance in pea (Pisum sativum L.), using populations from two crosses. Theor. Appl. Genet. 2004, 109, 1620–1631. [Google Scholar] [CrossRef] [PubMed]
  161. DeKoeyer, D.; Xue, A.; Bing, D.; Woods, S.; Blade, S.; Vandenberg, A.; Miranda, D.; Somers, D.J.; Warkentin, T.; Tar’an, B.; et al. Quantitative trait loci for lodging resistance, plant height and partial resistance to mycosphaerella blight in field pea (Pisum sativum L.). Theor. Appl. Genet 2003, 107, 1482–1491. [Google Scholar] [CrossRef] [PubMed]
  162. Baranger, A.; Morin, G.; Deniot, G.; Frankewitz, A.; Prioul, S. Mapping of quantitative trait loci for partial resistance to Mycosphaerella pinodes in pea (Pisum sativum L.), at the seedling and adult plant stages. Theor. Appl. Genet. 2004, 108, 1322–1334. [Google Scholar] [CrossRef] [PubMed]
  163. Torres, A.M.; Cubero, J.I.; Vaz Patto, M.C.; Rubiales, D.; Satovic, Z.; Almeida, N.F.; Fondevilla, S. Identification of common genomic regions controlling resistance to Mycosphaerella pinodes, earliness and architectural traits in different pea genetic backgrounds. Euphytica 2011, 18, 43–52. [Google Scholar]
  164. Tazelaar, M.F.; van Norel, A.; Heringa, R.J. Resistance to powdery mildew (Erysiphe polygoni D.C.) in peas (Pisum sativum L.). Euphytica 1969, 18, 163–169. [Google Scholar]
  165. Harland, S.C. Inheritance of immunity to mildew in Peruvian forms of Pisum sativum. Heredity 1948, 2, 263–269. [Google Scholar] [CrossRef] [PubMed]
  166. Warkentin, T.D.; Penner, G.A.; Tiwari, K.R. Inheritance of powdery mildew resistance in pea. Can. J. Plant Sci. 1997, 77, 307–310. [Google Scholar] [CrossRef]
  167. Rubiales, D.; Moreno, M.T.; Carver, T.L.W.; Fondevilla, S. Macroscopic and histological characterisation of genes er1 and er2 for powdery mildew resistance in pea. Eur. J. Plant Pathol. 2006, 115, 309–321. [Google Scholar] [CrossRef]
  168. Devienne, D.; Cousin, R.; Belajouza, M.; Ranade, S.; Isaac, P.; Dirlewanger, E. Restriction fragment length polymorphism analysis of loci associated with disease resistance genes and developmental traits in Pisum sativum L. Theor. Appl. Genet. 1994, 88, 17–27. [Google Scholar]
  169. Weeden, N.F.; Frew, T.J.; Timmerman-Vaughan, G.M. Linkage analysis of er1, a recessive Pisum sativum gene for resistance to powdery mildew fungus (Erysiphe pisi D.C). Theor. Appl. Genet. 1994, 88, 1050–1055. [Google Scholar]
  170. Warkentin, T.D.; Penner, G.A.; Tiwari, K.R. Identification of coupling and repulsion phase RAPD markers for powdery mildew resistance gene er-1 inpea. Genome 1998, 41, 440–444. [Google Scholar]
  171. Leitão, J.M.; Farinho, M.; Tavares-Sousa, M.; Damaso, M.; Formiga, S.; Ribeiro, R.; Marques, C.; Pereira, G. Identification of DNA markers linked to an induced mutated gene conferring resistance to powdery mildew in pea (Pisum sativum L.). Euphytica 2010, 171, 327–335. [Google Scholar] [CrossRef]
  172. Tuvesson, S.; Issac, P.; Ceptilis, A.; Weibull, P.; Henriksson, T.; Dayteg, C.; von Post, R.; Eklund, M.; Ek, M. Microsatellite markers for powdery mildew resistance in pea (Pisum sativum L.). Hereditas 2005, 142, 86–91. [Google Scholar] [PubMed]
  173. Warkentin, T.D.; Penner, G.A.; Tiwari, K.R. Identification of AFLP markers for powdery mildew resistance gene er2 in pea. Pisum Genet. 1999, 31, 27–29. [Google Scholar]
  174. Ricciardi, L.; Lotti, C.; Bai, Z.; Visser, R.G.F.; Cillo, F.; Marcotrigiano, A.R.; Appiano, M.; Schiavulli, A.; Pavan, S. Pea powdery mildew er1 resistance is associated to loss-of-function mutations at a MLO homologous locus. Theor. Appl. Genet. 2011, 123, 1425–1431. [Google Scholar] [CrossRef] [PubMed]
  175. Panstruga, R.; Bisseling, T.; Ivanov, S.; Reinstaedler, A.; Humphry, M. Durable broad-spectrum powdery mildew resistance in pea er1 plants is conferred by natural loss-of-function mutations in PsMLO1. Mol. Plant Pathol. 2011, 12, 866–878. [Google Scholar] [CrossRef] [PubMed]
  176. Rathour, R.; Sharma, S.K.; Banayal, K.; Pathania, S.; Sharma, S.; Katoch, V. Molecular mapping of pea powdery mildew resistance gene er2 to pea linkage group III. Mol. Breed. 2010, 25, 229–237. [Google Scholar] [CrossRef]
  177. Torres, A.M.; Moreno, M.T.; Rubiales, D.; Fondevilla, S. Identification and validation of RAPD and SCAR markers linked to the gene Er3 conferring resistance to Erysiphe pisi DC in pea. Mol. Breed. 2008, 22, 193–200. [Google Scholar] [CrossRef]
  178. Srivastava, C.; Chand, R.; Kushwaha, C. Role of aeciospores in outbreaks of pea (Pisum sativum) rust (Uromyces fabae). Eur. J. Plant Path. 2006, 115, 323–330. [Google Scholar] [CrossRef]
  179. Torres, A.M.; Rubiales, D.; Satovic, Z.; Barilli, E. Mapping of quantitative trait loci controlling partial resistance against rust incited by Uromyces pisi (Pers.) Wint. in a Pisum fulvum L. intraspecific cross. Euphytica 2010, 175, 151–159. [Google Scholar] [CrossRef]
  180. Ram, R.S.; Katiyar, R.P. Genetics of rust resistance in pea. Indian J. Genet. 1987, 47, 46–48. [Google Scholar]
  181. Singh, B.D.; Chand, R.; Srivastava, C.P.; Sarode, S.B.; Kushwaha, C.; Yadav, K.; Vijayalakshmi, S. Identification of RAPD markers linked to the rust (Uromyces fabae) resistance gene in pea (Pisum sativum). Euphytica 2005, 144, 265–274. [Google Scholar] [CrossRef]
  182. Srivastava, C.P.; Chand, R.; Joshi, A.K.; Singh, B.D.; Singh, A.K.; Rai, R. Molecular mapping for resistance to pea rust caused by Uromyces fabae (Pers.) de-Bary. Theor. Appl. Genet. 2011, 123, 803–813. [Google Scholar] [CrossRef] [PubMed]
  183. Muehlbauer, F.J.; Grau, C.R.; McGee, R.J.; Weeden, N.F. A gene influencing tolerance to common root rot is located on linkage group IV. Pisum Genet. 2000, 32, 53–55. [Google Scholar]
  184. Coyne, C.J.; Baranger, A.; Kraft, J.M.; McGee, R.J.; Muehlbauer, F.J.; Pilet-Nayel, M.L. Quantitative trait loci for partial resistance to Aphanomyces root rot in pea. Theor. Appl. Genet. 2002, 106, 28–39. [Google Scholar] [PubMed]
  185. Coyne, C.J.; Baranger, A.; Kraft, J.M.; McGee, R.J.; Muehlbauer, F.J.; Pilet-Nayel, M.L. Consistent QTL in pea for partial resistance to Aphanomyces euteiches isolates from United States and France. Phytopathology 2005, 95, 1287–1293. [Google Scholar] [CrossRef] [PubMed]
  186. Mangin, P.; Klein, A.; Rivière, J.P.; Esnault, R.; L’Anthoëne, V.; Le Goff, I.; McGee, R.J.; Coyne, C.J.; Baranger, A.; Hamon, C.; et al. New consistent QTL in pea associated with partial resistance to Aphanomyces euteiches in multiple field and controlled environments from France and the United States. Theor. Appl. Genet. 2010, 123, 261–281. [Google Scholar]
  187. Taylor, J.D.; Ellis, N.; Hunter, P.J. Association of dominant loci for resistance to Pseudomonas syringae pv. pisi with linkage groups II, VI and VII of Pisum sativum. Theor. Appl. Genet. 2001, 103, 129–135. [Google Scholar] [CrossRef]
  188. Caminero, C.; Rubiales, D.; Fernández-Romero, M.D.; Satovic, Z.; Martın-Sanz, A.; Fondevilla, S. Identification of quantitative trait loci involved in resistance to Pseudomonas syringae pv. syringae in pea (Pisum sativum L.). Euphytica 2012. [Google Scholar] [CrossRef]
  189. Taylor, J.D.; Elvira-Recuenco, M. Resistance to bacterial blight (Pseudomonas syringae pv. pisi) in Spanish pea (Pisum sativum) landraces. Euphytica 2001, 118, 305–311. [Google Scholar] [CrossRef]
  190. Sillero, J.C.; Moreno, M.T.; Rubiales, D. Search for resistance to crenate broomrape (Orobanche crenata) in pea germplasm. Genet. Res. Crop Evol. 2005, 52, 853–861. [Google Scholar] [CrossRef]
  191. Fondevilla, S.; Rispail, N.; Sillero, J.; Castillejo, M.A.; Prats, E.; Pérez-de-Luque, A.; Fernández-Aparicio, M.; Rubiales, D. Breeding approaches for crenate broomrape (Orobanche crenata Forsk.) management in pea (Pisum sativum L.). Pest Manag. Sci. 2009, 65, 553–559. [Google Scholar] [CrossRef] [PubMed]
  192. Torres, A.M.; Cubero, J.I.; Rubiales, D.; Satovic, Z.; Román, B.; Valderrama, M.R. Locating genes associated with Orobanche crenata resistance in pea. Weed Res. 2004, 44, 323–328. [Google Scholar] [CrossRef]
  193. Rubiales, D.; Moreno, M.T.; Torres, A.M.; Emeran, A.A.; Satovic, Z.; Fernández-Aparicio, M.; Fondevilla, S. Identification of quantitative trait loci for specific mechanisms of resistance to Orobanche crenata Forsk. in pea (Pisum sativum L.). Mol. Breed. 2010, 25, 259–272. [Google Scholar] [CrossRef]
  194. Hardie, D.; Byrne, O. Incorporation of pea weevil resistance into a cultivar field peas. Grains Research and Development Corporation Project Report No UWA314SR, CLIMA,, University of Western Australia: Australia, 2004.
  195. Hampton, R.O.; Provvidenti, R. Chromosomal distribution of genes for resistance to seven potyviruses in Pisum sativum. Pisum Genet. 1991, 23, 26–28. [Google Scholar]
  196. Laursen, J.; Hjulsager, C.K.; Lund, O.S.; Johansen, E.I. Recessive resistance in Pisum sativum and Potyvirus pathotype resolved in a gene-for-cistron correspondence between host and virus. J. Virol. 2001, 75, 6609–6614. [Google Scholar] [CrossRef] [PubMed]
  197. Maule, A.; Ellis, N.; Thomas, C.; Eyers, S.; Gao, Z. Identification of markers tightly linked to sbm recessive genes for resistance to Pea seed-borne mosaic virus. Theor. Appl. Genet. 2004, 109, 488–494. [Google Scholar] [PubMed]
  198. Johansen, I.E.; Lund, O.S.; Hansen, K.R.; Tulinius, G.; Møller, I.S.; Bruun-Rasmussen, M. The same allele of translation initiation factor 4E mediates resistance against two Potyvirus spp. Pisum sativum. Mol. Plant Microbe Interact. 2007, 20, 1075–1082. [Google Scholar] [CrossRef]
  199. Uyeda, I.; Nakahara, K.S.; Abe, Y.; Andrade, M. The cyv-2 resistance to Clover yellow vein virus in pea is controlled by the eukaryotic initiation factor 4E. J. Gen. Plant Pathol. 2009, 75, 241–249. [Google Scholar] [CrossRef]
  200. Dostalová, R.; Navrátil, M.; Šafářová, D.; Smýkal, P. Marker assisted pea breeding: eIF4E allele specific markers to pea seed-borne mosaic virus (PSbMV) resistance. Mol. Breed. 2010, 26, 425–438. [Google Scholar] [CrossRef]
  201. Weeden, N.F.; Randhawa, H. Refinement of the position of En on LG III and identification of closely linked DNA markers. Pisum Genet. 2011. [Google Scholar]
  202. Providenti, R.; Weeden, N.F. A marker locus, Adh-1, for resistance to Pea Enation Mosaic Virus in Pisum sativum. J. Hered. 1988, 79, 128–131. [Google Scholar]
  203. Weeden, N.; Provvidenti, R.; Gu, W.K.; Yu, J. Identifying and mapping two DNA markers linked to the gene conferring resistance to Pea Enation Mosaic Virus. J. Am. Soc. Hort. Sci. 1995, 120, 730–733. [Google Scholar]
  204. Vander Schoor, J.K.; Knowles, C.L.; Wenden, B.; Sussmilch, F.C.; Liew, L.C.; Hecht, V.; Weller, J.L. Update on the genetic control of flowering in garden pea. J. Exp. Bot. 2009, 60, 2493–2499. [Google Scholar] [CrossRef] [PubMed]
  205. Murfet, I.C. Flowering in Pisum. Hr, a gene for high response to photoperiod. Heredity 1973, 31, 157–164. [Google Scholar] [CrossRef]
  206. Murfet, I.C. Flowering in Pisum. Multiple alleles at the Lf locus. Heredity 1975, 35, 85–98. [Google Scholar] [CrossRef]
  207. Rameau, C.; Banfield, M.J.; Ellis, N.; Cadioux, S.; Courtiade, J.; Morin, J.; Foucher, F. DETERMINATE and LATE FLOWERING are two TERMINAL FLOWER1/CENTRORADIALIS homologs that control two distinct phases of flowering initiation and development in pea. Plant Cell 2003, 15, 2742–2754. [Google Scholar] [CrossRef] [PubMed]
  208. Stempniak, J.J.; Boilleau, M.; Devaux, R.; Petit, A.; Morin, J.; Delbreil, B.; Fontaine, V.; Béthencourt, L.; Hanocq, E.; Lejeune-Hénaut, I.; et al. The flowering locus Hr colocalizes with a major QTL affecting winter frost tolerance in Pisum sativum L. Theor. Appl. Genet. 2008, 116, 1105–1116. [Google Scholar] [CrossRef] [PubMed]
  209. Weller, J.L.; Lambert, M.J.; Jones, S.E.; Liew, L.C.; Vander Schoor, J.K.; Knowles, C.L.; Hecht, V. Pea LATE BLOOMER1 is a GIGANTEA ortholog with roles in photoperiodic flowering, deetiolation, and transcriptional regulation of circadian clock gene homologs. Plant Physiol. 2007, 144, 648–661. [Google Scholar] [CrossRef] [PubMed]
  210. Liew, L. Genetic Control of Photoperiod Responsiveness in Pea. Ph.D. Dissertation, University of Tasmania, Tasmania, Australia, 2011. [Google Scholar]
  211. Domoney, C.; Welham, T.; Duc, G.; Aubert, G.; Page, D. Combinatorial variation in coding and promoter sequences of genes at the Tri locus in Pisum sativum accounts for variation in trypsin inhibitor activity in seeds. Mol. Genet. Genomics 2002, 267, 359–369. [Google Scholar] [CrossRef] [PubMed]
  212. Domoney, C.; Moreau, C.; Turner, L.; Welham, T.; Chinoy, C. The genetic control of seed quality traits: Effects of allelic variation at the Tri and Vc-2 genetic loci in Pisum sativum L. Euphytica 2011, 180, 107–122. [Google Scholar] [CrossRef]
  213. Timmerman-Vaughan, G.; Swiecicki, W.K. Molecular Marker Systems in Plant Breeding and Crop Improvement Biotechnology in Agriculture and Forestry,Localization of Important Traits: The Example Pea (Pisum sativum L.); Eds., Wenzel, G., Lorz, H., Eds.; 2005; Springer-Verlag: Berlin, Germany. [Google Scholar]
  214. Russell, A.C.; Weeden, N.F.; Frew, T.J.; McCallum, J.A.; Timmerman-Vaughan, G.M. Linkage mapping of quantitative trait loci controlling seed weight in pea (Pisum sativum L.). Theor. Appl. Genet. 1996, 93, 431–439. [Google Scholar] [CrossRef]
  215. Young, N.D.; Danesh, D.; Menancio-Hautea, D.I.; Fatokun, C.A. Evidence for orthologous seed weight genes in cowpea and mung bean based on RFLP mapping. Genetics 1992, 132, 841–846. [Google Scholar] [PubMed]
  216. Buss, G.R.; Saghai Maroof, M.A.; Maughan, P.J. Molecular-marker analysis of seed-weight: Genomic locations, gene action, and evidence for orthologous evolution among three legume species. Theor. Appl. Genet. 1996, 93, 574–579. [Google Scholar] [CrossRef]
  217. Wilson, D.; Russell, A.; McCallum, J.; Lakeman, M.; Murray, S.; Butler, R.; Frew, T.; Whitfield, C.; Mills, A.; Timmerman-Vaughan, G.M. Linkage mapping of QTL for seed yield, yield components, and developmental traits in pea. Crop Sci. 2005, 45, 1336–1344. [Google Scholar] [CrossRef]
  218. Bing, D.; Blade, S.; Vandenberg, A.; Miranda, D.; Somers, D.; Warkentin, T.; Tar’an, B. Quantitative trait loci for grain yield, seed protein content and days to maturity in field pea (Pisum sativum L.). Euphytica 2004, 136, 297–306. [Google Scholar] [CrossRef]
  219. Somers, D.J.; Vandenberg, A.; Bett, K.E.; Tullu, A.; Warkentin, T.D.; Tar’an, B.; Zhang, C. Selection for lodging resistance in field pea (Pisum sativum L.) using molecular markers. Crop Sci. 2006, 46, 321–329. [Google Scholar] [CrossRef]
  220. Wolko, B.; Irzykowska, L. Interval mapping of QTLs controlling yield-related traits and seed protein content in Pisum sativum. J. Appl. Genet. 2004, 45, 297–306. [Google Scholar] [PubMed]
  221. Duc, G.; Munier-Jolain, N.; Desprez, B.; Duchene, C.; Mangin, B.; Moessner, A.; Huart, M.; Marget, P.; Burstin, J. Developmental genes have pleiotropic effects on plant morphology and source capacity, eventually impacting on seed protein content and productivity in pea. Plant Physiol. 2007, 144, 768–781. [Google Scholar] [CrossRef] [PubMed]
  222. Burstin, J.; Duc, G.; Marget, P.; Galmiche, F.; de Larambergue, H.; Fournier, S.; Rizvi, S.M.H.; Bourion, V. Genetic dissection of nitrogen nutrition in pea through a QTL approach of root, nodule, and shoot variability. Theor. Appl. Genet. 2010, 121, 71–86. [Google Scholar] [CrossRef] [PubMed]
  223. Wolko, B.; Swiecicki, W.; Pniewski, T.; Kaczmarek, Z.; Gawłowska, M.; Bocianowski, J.; Krajewski, P. QTL for yield components and protein content: A multienvironment study of two pea (Pisum sativum L.) populations. Euphytica 2012, 183, 323–336. [Google Scholar] [CrossRef]
  224. Russell, A.; Frew, T.; Timmerman-Vaughan, G.; McCallum, J. Biochemical and genetic linkage analysis of green seed color in field pea. J. Am. Hort. Sci. 1997, 122, 218–225. [Google Scholar]
  225. Warkentin, T.D.; Vijayan, P.; Tar’an, B.; Bett, K.; Ubayasena, L. Genetic control and QTL mapping of cotyledon bleaching resistance in green field pea (Pisum sativum L.). Genome 2010, 53, 346–359. [Google Scholar] [CrossRef] [PubMed]
  226. Warkentin, T.D.; Tar’an, B.; Bett, K.; Ubayasena, L. Genetic control and identification of QTLs associated with visual quality traits of field pea (Pisum sativum L.). Genome 2011, 54, 261–272. [Google Scholar] [CrossRef] [PubMed]
  227. Hilbert, J.L.; Avia, K.; Frise, M.; Devaux, R.; Voedts, N.; Bodèle, S.; Sellier, H.; Vuylsteker, C.; Fontaine, V.; Dumont, E.; et al. Association of sugar content QTL and PQL with physiological traits relevant to frost damage resistance in pea under field and controlled conditions. Theor. Appl. Genet. 2009, 118, 1561–1571. [Google Scholar] [CrossRef] [PubMed]
  228. Martin, C.; Hedley, C.; Ellis, T.H.N.; Smith, A.M.; Bhattacharyya, M.K. The wrinkled-seed character of pea described by Mendel is caused by a transposon-like insertion in a gene encoding starch-branching enzyme. Cell 1990, 60, 115–122. [Google Scholar] [CrossRef] [PubMed]
  229. Hvoslef-Eide, A.K.; Ambrose, M.J.; Lee, Y.K.; Owusu, A.K. Growth, seed development and genetic analysis in wild type and Def mutant of Pisum sativum L. BMC Res. Notes 2011, 4. [Google Scholar] [CrossRef] [PubMed]
  230. Jacobsen, H.J.; Riesselmann, S.; Menke, M.; Lindemann, S.; Stackelberg, M. Identification of AFLP and STS markers closely linked to the def locus in pea. Theor. Appl. Genet. 2003, 106, 1293–1299. [Google Scholar] [PubMed]
  231. Weeden, N.F. Genetic changes accompanying the domestication of Pisum sativum: Is there a common genetic basis to the ‘domestication syndrome’ for legumes? Ann. Bot. 2007, 100, 1017–1025. [Google Scholar]
  232. Portais, J.C.; Danoun, S.; Matusova, R.; Letisse, F.; Pillot, J.P.; Dun, E.A.; Puech-Pagès, V.; Brewer, P.B.; Fermas, S.; Gomez-Roldan, V.; et al. Strigolactone inhibition of shoot branching. Nature 2008, 455, 189–194. [Google Scholar] [CrossRef] [PubMed]
  233. Reid, J.B.; Davies, P.J.; Ross, J.J.; Lester, D.R. Mendel’s stem length gene (Le) encodes a gibberellin 3[beta]-hydroxylase. Plant Cell 1997, 9, 1435–1443. [Google Scholar] [PubMed]
  234. Olhoft, P.M.; Samac, D.A.; Somers, D.A. Recent advances in legume transformation. Plant Physiol. 2003, 131, 892–899. [Google Scholar] [CrossRef] [PubMed]
  235. Ondrej, V.; Griga, M.; Smýkal, P.; Svabova, L. Agrobacterium-mediated transformation of Pisum sativum in vitro and in vivo. Biol. Plant. 2005, 49, 361–370. [Google Scholar] [CrossRef]
  236. Lund, O.S.; Johansen, I.E.; Nicolaisen, M.; MacFarlane, S.A.; Krath, B.N.; Constantin, G.D. Virus-induced gene silencing as a tool for functional genomics in a legume species. Plant J. 2004, 40, 622–631. [Google Scholar] [CrossRef] [PubMed]
  237. Jakobsen, I.; Johansen, I.E.; Olsen, A.; Gronlund, M. Protocol: Using virus-induced gene silencing to study the arbuscular mycorrhizal symbiosis in Pisum sativum. Plant Methods 2010, 6. [Google Scholar] [CrossRef]
  238. Tamiru, M.; Mitsuoka, C.; Yoshida, K.; Matsumura, H.; Kanzaki, H.; Takagi, H.; Natsume, S.; Yoshida, K.; Kosugi, S.; Abe, A.; et al. Genome sequencing reveals agronomically important loci in rice using MutMap. Nat. Biotechnol. 2012, 30, 174–178. [Google Scholar] [CrossRef] [PubMed]
  239. Martin, R.R.; Keller, K.E.; Shultz, J.L.; Lightfoot, D.A.; Meksem, K.; Murray, S.; Timmerman-Vaughan, G.M.; Walling, J.G.; McClendon, M.T.; Coyne, C.J.; et al. Construction and characterization of two bacterial artificial chromosome libraries of pea (Pisum sativum L.) for the isolation of economically important genes. Genome 2007, 50, 871–875. [Google Scholar] [CrossRef] [PubMed]
  240. Palmer, J.D.; Barth, S.; Milbourne, D.; Stefanović, S.; Perry, A.S.; Sémon, M.; Cusack, B.P.; Rice, D.W.; Aspinall, S.; Magee, A.M.; et al. Localized hypermutation and associated gene losses in legume chloroplast genomes. Genome Res. 2010, 20, 1700–1710. [Google Scholar] [CrossRef] [PubMed]
  241. The International Aphid Genomics Consortium. Genome sequence of the pea aphid Acyrthosiphon pisum. PLoS Biol. 2010, 8. [CrossRef] [PubMed] [Green Version]

