
Modeling Topsoil Phosphorus—From Observation-Based Statistical Approach to Land-Use and Soil-Based High-Resolution Mapping

1
Institute of Agricultural and Environmental Sciences, Estonian University of Life Sciences, Kreutzwaldi 1, 51006 Tartu, Estonia
2
Centre of Estonian Rural Research and Knowledge, Teaduse 4, 75501 Saku, Estonia
3
Institute of Ecology and Earth Sciences, University of Tartu, Vanemuise 46, 51003 Tartu, Estonia
*
Author to whom correspondence should be addressed.
Agronomy 2023, 13(5), 1183; https://doi.org/10.3390/agronomy13051183
Submission received: 13 February 2023
/
Revised: 26 March 2023
/
Accepted: 12 April 2023
/
Published: 22 April 2023
(This article belongs to the Topic Applications of Big Data and Machine Learning in Smart Agriculture)
Abstract
:Phosphorus (P) is a macronutrient that often limits the productivity and growth of terrestrial ecosystems, but it is also one of the main causes of eutrophication in aquatic systems at both local and global levels. P content in soils can vary largely, but usually, only a small fraction is plant-available or in an organic form for biological utilization because it is bound in incompletely weathered mineral particles or adsorbed on mineral surfaces. Furthermore, in agricultural ecosystems, plant-available P content in topsoil is mainly controlled by fertilization and land management. To understand, model, and predict P dynamics at the landscape level, the availability of detailed observation-based P data is extremely valuable. We used more than 388,000 topsoil plant-available P samples from the period 2005 to 2021 to study spatial and temporal variability and land-use effect on soil P. We developed a mapping approach based on existing databases of soil, land-use, and fragmentary soil P measurements by land-use classes to provide spatially explicit high-resolution estimates of topsoil P at the national level. The modeled spatially detailed (1:10,000 scale) GIS dataset of topsoil P is useful for precision farming to optimize nutrient application and to increase productivity; it can also be used as input for biogeochemical models and to assess P load in inland waters and sea.
1. Introduction
Phosphorus (P) is an important macronutrient for plant growth, and the primary role of P in plants is to store energy needed for plant growth and reproduction produced by photosynthesis. Most phosphorus is relatively immobile in soil and even P from phosphate fertilizers will readily react with soil minerals, making it less available for plants.
Soil phosphorus consists of two forms: organic (non-plant available) and inorganic (plant available) P. Approximately 29 to 65 percent of total soil phosphorus is in organic forms, which is not plant available, while the remaining 35 to 71 percent is in inorganic forms [1] available to plants mainly in the form of phosphate as labile or occluded forms of P [2]. Organic forms of phosphorus include dead plant/animal residues and soil microorganisms. Soil microorganisms play a key role in processing and transforming these organic forms of phosphorus into plant-available forms, especially in natural ecosystems.
The inorganic form (plant-available form of P) is highly reactive and can be tied up to chemical compounds (e.g., iron, aluminum, and calcium) in soils as absorbed phosphorus [3]. The inorganic P has to be dissolved into a solution (P-solution) for plants to be able to uptake it. P absorption (incorporation of plant-available P in soil solution into soil clay minerals, such as Fe, Al, and Ca oxides) is a fast process, and absorbed P can be released into soil solution (plant-available P) via desorption. P absorption (retention) is higher in soils that contain more clay and iron and aluminum oxides [4]. A lower soil pH favors P absorption by aluminum and iron (pH below 5.5), and a higher pH (over 7.5) enhances plant-available P fixation by calcium [4,5].
The solution P pool (plant-available P) is very small and ranges from 0.001 mg/L to 1 mg/L [6]. In general, roots absorb phosphorus in the form of orthophosphate but can also absorb certain forms of organic phosphorus (e.g., glycerophosphate, lecithin, and phytin) [7]. The active (labile) pool is P in the solid phase that is more readily released into soil solution, which is the water surrounding soil particles. As plants take up phosphate, the concentration of phosphate in the solution decreases and some phosphate from the active P pool is released. An active P pool consists of mainly P absorbed into soil clay minerals (Fe, Al, and Ca oxides) and easily mineralizing organic P. Labile inorganic P in soils is predominantly present as specifically adsorbed orthophosphate. This P is in equilibrium with the soil solution and acts to buffer the soil solution against concentration change [8,9]. Thus, P is desorbed into solution in response to plants’ P uptake or adsorbed from solution when the P concentration is raised by mineralization or by the addition of a fertilizer material.
Soil age is also an important factor influencing P availability, with P becoming increasingly limiting in ancient soils because it gradually disappears through leaching and erosion [10,11]. In arable lands, P is also partly removed with yield, and additional P fertilizer application is needed to maintain soil fertility. Contrarily to agricultural lands, in natural ecosystems, P uptaken by plants will mainly remain in place after plants’ death, and after decomposition and mineralization, it will be available in topsoil for other plants.
Climatic conditions affect P availability as a higher temperature increases the activity of soil microorganisms and contributes to faster organic matter decomposition and P mineralization. On the other hand, a higher temperature also increases P sorption. In well-aerated soils, P is released faster than in saturated wet soils. A neutral soil pH (6–7.5) is the best for P availability, while pH values below 5.5 and between 7.5 and 8.5 limit P availability to plants due to fixation by aluminum, iron (in case of lower pH), or calcium (in case of higher pH) [5]. Wet soil conditions decrease soil pH, which increases P sorption to Fe and Al oxides, but flooding the soil reduces P sorption by increasing the solubility of phosphates that are bound to aluminum and iron oxides and amorphous minerals [12]. This aspect has to be considered when mapping soil P in high latitudes rich in histosols across all land uses and soil types.
Soil phosphorus maps are used to estimate P availability to calculate the need for fertilization and to model P loss. As only a small amount of P fertilizers used may be readily available for plant uptake due to P sorption and P loss via erosion and runoff, the use of fertilizers should be based on deeper knowledge about soil properties. Improper P fertilizer use contributes to higher P loss and eutrophication rather than better plant growth.
Detailed and spatially high-resolution soil P measurements covering equally all land uses and soil types are not usually available for larger areas to produce accurate data-driven P maps, which are based only on soil sampling data. If high-spatial-resolution P sampling data are available (e.g., for small areas), geostatistical methods, such as interpolation techniques (e.g., ordinary kriging, co-kriging, or regression kriging) are usually used to produce soil P maps [13,14]. In the case that soil P sampling grid is not dense enough, other available environmental variables are also used to predict P content by using machine learning algorithms, co-kriging, or some other multi-criteria algorithms, including multiple regression models. Hybrid geostatistical methods, which incorporate spatially distributed soil observations and readily available ancillary environmental data (e.g., topographic variables and satellite data) are recommended instead of univariate methods, such as ordinary kriging, in cases where natural soil-forming processes are complex or landscapes have high anthropogenic influence [15,16].
Gaussian process regression (GPR) works principally like co-kriging with a number of covariates. Ballabio et al. [17] applied GPR to create maps of different LUCAS topsoil chemical properties (pH, P, N, CaCO3, K, etc.), including indexes calculated from remote sensing data, meteorological parameters, XY coordinates, and topographic, land-use, and geological variables.
Recently, machine learning algorithms are increasingly used in predictive mapping of soil parameters over larger areas as the number of available variables and computing capacity are increased. Matos-Moreira et al. [18] used a machine learning tool (Cubist) to develop rule-based predictive models from a calibration dataset. Covariates included pedological, geological, agricultural, terrain and geophysical-related attributes. Rossel and Bui [19] used a machine learning algorithm (Cubist) to predict total phosphorus in six different soil layers and ordinary kriging to predict the residuals at each of the standard depths in Australian soils. To derive the final estimates of total P, the predictions from Cubist and the kriging estimates of the residuals were summed. The spatial modeling was performed on 50 bootstraps, and 90 m grid size was used for modeling. Hosseini et al. [20] used different statistical and machine learning algorithms, such as genetic algorithm (GA), artificial neural network (ANN), fuzzy inference system (FIS), adaptive neuro-fuzzy inference system (ANFIS), partial least squares (PLS), principal component regression (PCR), ordinary least squares (OLS), and multiple regression (MR), to determine the best model to predict soil P in Iran. Four predictive variables (clay, sand, soil organic matter (SOM), and pH) were used to predict soil P, and the best results were obtained by PLS (among the regression models) and GA and ANN (among the intelligent models).
Esfandiarpour-Boroujeni et al. [21] used different methods (decision tree (DT), random forest (RF), artificial neural network (ANN), and support vector machine (SVM)) for predicting soil classes (different WRB classification levels) based on environmental variables (planar and profile curvature, aspect, elevation, slope, catchment area, topographic wetness index (TWI), LS factor, NDVI, etc.) and expert knowledge from soil scientists (presence or absence of soil horizons and other soil properties). The SVM algorithm had the highest overall accuracy for prediction of all qualitative soil properties. The ANN algorithm showed good performance in predicting some quantitative variables (e.g., pure clay percentage), and the DT algorithm had the lowest uncertainty value.
However, most of these studies that have been conducted to predict soil P with good results have used detailed measured data for smaller areas [16,18,20,21,22] or small-scale maps over larger areas [17,19,23].
The aim of this study was to create a high-resolution (1:10,000) topsoil plant-available P map for the entire Estonia (area 45,339 km2) covering all land uses and soil types based on datasets with highly unbalanced data availability and spatial resolution across land-use categories. The available soil sampling data are usually collected for different purposes and, thus, have different spatial and temporal resolutions, usually covering agricultural areas mainly on mineral soils well while being extremely scarce over natural ecosystems (e.g., forests and wetlands) on histosols and other less fertile soils. Based on the typical large bias of sampling data along soil types and land-use categories, we hypothesized that topsoil P content can be sufficiently accurately mapped with geostatistical methods (e.g., kriging interpolation) in arable lands, but the use of machine learning algorithms increases prediction accuracy, especially in less intensively managed land-use categories (e.g., short-term and permanent grasslands), while these established relationships are not applicable for natural ecosystems (e.g., forests and wetlands), where more robust models such as the two parameter ordination method should be applied.
Our study objectives were to establish the relationships between observed soil plant-available P and environmental variables by soil and land-use classes, to determine the most effective predictive factors related to soil P, establish a cost-effective modeling approach, assess the accuracy of different modeling methods, and create a high-resolution topsoil P map at the national level.
2. Materials and Methods
2.1. Soil Phosphorus Data
Soil phosphorus data available for agricultural soils were obtained from the PANDA database, which contains regular soil monitoring and voluntary soil sampling data by farmers. The database contains soil sampling data collected from agricultural lands for the period 2005–2021 and is managed by the Centre of Estonian Rural Research and Knowledge. For this period in the PANDA database, there are data about 387,904 composite soil samples all over Estonia, including topsoil phosphorus content (mg/kg). Composite soil samples in the PANDA database were collected by licensed personnel following the same prescribed sampling strategy (prescribed sampling route and sampling density, depth, and volume) and analyzed in the same laboratory using the Mehlich-3 method. All soil samples from arable lands were collected in late summer or autumn at minimum 2–3 months after last fertilization and, in case of winter crops in crop rotation, before the sowing of crops. In the case of application of organic fertilizers, the soil samples were collected not earlier than 6 months after fertilization. The same field was resampled in each 4–5 years. Up to 2012, the Mehlich-3 colorimetric and, since 2013, the Mehlich-3 inductively coupled plasma (ICP) analysis method were used to determine soil available phosphorus. The Mehlich-3 P extraction method is the main method used for estimating plant-available P in Estonia since 2004. This method is robust, provides the advantage of multielement analysis [24,25], and, thus, is well-suited for long-term monitoring of Estonian agricultural soils, where pH is in the range between 5 and 7 for 75.9% of the samples. The PANDA dataset from 2021 (29,261 soil samples) was not included in model building but used as an additional independent test dataset to evaluate model performance.
There are no similar comprehensive topsoil phosphorus content databases for other land-use categories available in Estonia. Comparable values of topsoil phosphorus content for other land-use types (forest, wetland, peat extraction areas, and quarries) on different soil types were searched through a literature review of scientific papers [26,27,28,29,30,31,32,33,34,35,36,37,38,39,40,41,42,43,44], reports [45,46], and the Estonian Environmental Monitoring System and supplemented by original unpublished datasets of the authors. Therefore, the datasets for these land-use categories vary by sample size, sampling, and analysis methods. For all samples from agricultural soils, the Mehlich-3 method was applied, while the topsoil P concentration in the forest and peatland soil samples collated from multiple studies and literature sources were determined with various methods (Aqua Regia, Olsen, and Kjeldahl), and, thus, conversion coefficients based on Kulhánek et al. [47] and Wolf and Baker [48] were used prior to statistical analysis to convert phosphorus content to the same level with the Mehlich-3 method.
2.2. Land Use and Land Cover
Land-use data were combined from the ARIB (Agricultural Registers and Information Board) 2020 database, where main crop types for agricultural lands are registered. Data on natural grasslands were taken from the EELIS (Estonian Nature Information System) database for semi-natural grassland layer, and all other land-use types (wetlands, forests, mining areas, settlement, waterbodies, etc.) were taken from the ETD (1:10,000, Estonian Topographic Database) (Estonian Land Board, 2020). For topographic information (ground elevation), a 10 m resolution digital elevation model generated from LiDAR data (Estonian Land Board, 2021) was used.
Crop data by year were obtained from the ARIB database. In the ARIB database, all crops that are grown in agricultural massive (complex of neighboring fields) are listed in alphabetical order. Agricultural massive is an agricultural unit that is in the agricultural registry and can be applied for EU agriculture support (area-related aid). The ARIB crops were classified into 8 categories: natural grassland, fallow, cultural grassland, permanent cultures (e.g., orchards and berries), crop (e.g., rye, wheat, and barley), legumes (e.g., pea, bean, and lentil), technical cultures (rapeseed, flax, and hemp), and vegetables (e.g., potato, carrot, and cabbage). The main crop type was selected for each agricultural massive from the ARIB crop list by prioritizing the crops by their probability of having the largest share of this agricultural massive (e.g., the area for crop growing is probably larger than the area for vegetables). From the EELIS database, data on semi-natural grasslands were obtained and added to the natural grassland category. These areas not covered by the ARIB data, and EELIS semi-natural grasslands were obtained from the ETD database and additional categories of wetland, peat mining areas, forest, settlements, and waterbodies were added. Settlements and waterbodies were omitted from the further analysis as we did not estimate phosphorus for these areas.
We distinguished 11 land-use classes, with 8 of which being agricultural land categories (crop types) for which topsoil P values had been obtained from the PANDA database (permanent grassland, fallow, cultivated grassland, permanent cultures (e.g., orchards and berries), cereals (e.g., rye, wheat, and barley), legumes (e.g., pea, bean, and lentil), technical cultures (rapeseed, flax, and hemp), vegetables (e.g., potato, carrot, and cabbage)). Three non-agricultural land-use types (forest, wetland, and peat extraction area) were included in the models to allow P value prediction for the entire Estonia (excluding settlement areas, waterbodies, and mining areas).
2.3. Soil Data
The Estonian Soil Map (1:10,000) in digital form based on extensive field surveys includes information about soil type, fertility, texture, coarse fragments, and rock content by layers. Kmoch et al. [49] used the Estonian Soil Map to develop EstSoil-EH: A high-resolution eco-hydrological modelling parameters dataset for Estonia where soil map information was made machine-readable and used to predict soil properties (such as clay, silt and sand content, organic carbon content, and bulk density) by pedotransfer functions (PTF). In our study, we used the Estonian Soil map data obtained from Kmoch et al. [49]. Kmoch et al. [49] used the SAGA GIS functions (Conrad et al., 2015) to calculate the mean, median, and standard deviation of several topographic factors (slope, USLE slope length and steepness factor LS, topographic wetness index (TWI), and topographic ruggedness index (TRI)) and environmental variables (share of drained area and different land-use types within the soil polygon) as predictor variables in a random forest model to predict soil organic carbon content (SOC). The 5 m resolution LiDAR-based DEM provided by the Estonian Land Board was used for deriving topographic factors. In our study, we modeled only topsoil phosphorus content; thus, we used only top-layer soil variables (bulk density (bd1); clay (clay1), silt (silt1), and sand (sand1) contents; soil organic carbon content (soc1); hydrologic conductivity (k1); and available water content (awc1)) from Kmoch et al. [49].
Quaternary sediment deposit map in a scale of 1:400,000 (Estonian Land Board, 2020) was used as an indicator of soil parent material. This information was classified into 9 categories (alluvial, glaciolacustrine, glaciofluvial, till, aeolian, wetland sediment, shallow quaternary sediment, lacustrine, and marine deposits).
2.4. Data Processing
2.4.1. Soil-Type Aggregation
In the Estonian Soil map (1:10,000), there are 119 soil types distinguished according to the Estonian national soil classification system. The Estonian soil classification and soil texture types based on the Kachinsky texture system [50] cannot be directly converted to WRB or FAO classification as the soil types are distinguished based on different principles [49]. To avoid potential conversion-related issues, we made all our calculations based on the original texture and soil-type classes.
The original Estonian soil types were in some cases grouped into larger categories based on genesis and expected similarities in soil properties related to phosphorus content (soil wetness, gleyic processes, erosion, anthropogenic influences, etc.) to increase soil P sample number per soil group. Median phosphorus content by soil types or groups was calculated (Soil_MedP variable in Supplementary Table S1), and differences between soil groups were tested by using the Kruskal–Wallis and Dunn tests with Bonferroni multiple comparison correction in R. There were no statistically significant differences between different Gleysols (Gh, GI, Gk, Go, and Gor). Due to the limited number of samples and the mixed origin of soils in the anthropogenic soil category (mainly quarries and recultivated quarries), these soils also had no statistically significant difference from many other soil categories. Altogether, 26 soil categories were distinguished.
Soil texture was classified into 12 categories based on Estonian soil texture types [50] as some of these categories could not be directly converted to the USDA texture system. An approximate reference was used as listed (Estonian texture codes given in brackets): gravel (kr), gravel limestone (r), sand (s), sandy loam (ls1), loamy sand (ls2, ls3, and sl), fine sand (pl), clay (s), peat (t), fine sandy loam (tls), and fine loamy sand (tsl). Differences in median phosphorus content between soil texture categories were calculated (Texture_MedP variable in Table S1), and differences between categories were tested by using the Kruskal–Wallis and Dunn tests in R.
2.4.2. Data Analysis and Modeling
Three different approaches were used to model phosphorus content: (1) spatial interpolation (kriging), (2) statistical-empirical soil and land-use ordination scalar, and (3) machine learning bagging (bootstrap aggregation) model.
Spatial interpolation techniques (kriging in our case) create continuous smooth raster surfaces based on the predictive variable values. Soil and land-use ordination and bagging methods need some data units (polygons) for which all predictive variables are available. Therefore, for model building, only variables that were available for all study area (entire Estonia) could be used. For topsoil P content prediction, we used the unique units created by intersecting soil and land-use polygons.
The ArcGIS Pro (2.9) tools were used to prepare units (so-called soil–land use polygons) for P prediction. Soil map layer enriched with the predicted soil parameters (EstSoil-EH) was intersected with land-use/land-cover layer (composed from the ARIB, EELIS, and ETD data as described above) to create a layer that contains information about both soil and land-use parameters. Settlements and waterbodies were excluded from the prediction dataset. The output layer contained over 3 million polygons. Sediment (parent material) information was added to the soil–land use polygons by spatial join function with the largest share option. The soil–land use polygons central point X and Y coordinates were calculated, and the central point elevation was extracted from a 10 m resolution LiDAR DEM to represent longitude, latitude, and elevation variables in the bagging model.
Kriging
The most widespread approach to create a continuous surface from spatially well-distributed point measurements is interpolation [51,52,53]. Kriging is among the most popular spatial interpolation techniques because it can give the best linear unbiased prediction if suitable parameters are selected. This method is widely used in regional hydrological and spatial nutrient runoff models, but also for mapping spatial distribution of nutrients in detailed field-level test areas.
In our study, topsoil phosphorus content for agricultural areas all over the Estonia was interpolated based on the measured phosphorus values of the PANDA database by using simple kriging and stable variogram method in the ArcGIS Pro Geostatistical Analyst extension. Normal score transformation was used to transform the measured phosphorus data to follow a univariate standard normal distribution. Kriging is using Gaussian process to estimate the mean value of a dependent variable and thus normal distribution of data are very important. Kriging assumes normal distribution and stationarity of data (close points should have quite similar values, with low variance nearby). Spatial trend was investigated based on the scatter plots of P values against the X and Y coordinates, but, as no trend was detected, trend removal was not applied in the kriging models. Two kriging models were built in order to compare the kriging results with other models: the Kriging1 method, which used all available sample points to build a model to get the best results, and the Kriging2 method, where the original phosphorus dataset was divided into training (75%) and test (25%) datasets by using the ArcGIS Geostatistical Analyst extension tool Subset Features, which created a random subset from the dataset. The Kriging2 model served only a model validation purpose.
Soil–Land Use Ordination
As the PANDA database covers only agricultural lands, kriging interpolation predictions outside agricultural areas are not valid as the topsoil phosphorus content is largely depending on anthropogenic factors, such as fertilizer application, pollution, and crop harvesting, which are different in agricultural lands and cannot be interpolated or extrapolated to other land-use categories without taking into consideration other factors.
Ordination can be considered a synonym for multivariate gradient analysis. Ordination methods are mainly used in community ecology, where multiple spatial axes are used to arrange or order multiple variables (of species and/or sample units) along gradients. The most famous ordination methods are principal component analysis (PCA), factor analysis (FA), detrended correspondence analysis (DCA), and other similar multidimensional statistical analysis methods [54,55].
According to the exploratory data analysis, soil and land-use types were the main independent factors influencing phosphorus content in topsoil. The median values of P content of different soil types, land-use types, and their combinations were calculated to create a land-use/soil-type matrix. Soil and land-use types were ordered ascendingly based on the median topsoil phosphorus values. Some soil-type/land-use combinations had no or limited number of measured soil P values. To interpolate topsoil phosphorus values for these soil–land use combination without sufficient sampling data, the so-called soil–land use ordination surface was created. Soil type was used as the X axis and land-use type was used as the Y axis to generate Cartesian coordinates. The X and Y coordinates representing soil and land-use types and the corresponding class’s median topsoil phosphorus content for groups with sufficient measured topsoil P data were used to interpolate trend surface in Surfer (ver. 24) by using radial basis multiquadratic (R2 parameter 0.2) gridding. The created ordination model surface represents the P value for different soil and land-use combinations. This model was used to assign median phosphorus values for all soil–land use polygons in the entire Estonia according to particular combination of soil type and land-use class. The soil–land use ordination model results were validated by calculating the linear relationship between the model results predicted for the soil–land use polygons all over Estonia and all phosphorus sampling points in the PANDA database. Additionally, the soil–land use polygons’ median P values calculated from the measured P data from the PANDA database were used for validation. As the P values in the PANDA database are not normally distributed, a nonparametric correlation analysis was implemented, and Kendall tau correlation metrics between the measured and predicted data were calculated.
Bagging
To predict the topsoil phosphorus content for soil–land use/land cover polygons all over Estonia based on multiple variables, the prediction model was built by using bagging-based machine learning method (bootstrap aggregation and classification and regression trees (CART) method) [56]. Bagging works best with high-variance unstable models, and it is usually applied to decision tree methods, where a forest of many trees is created to average the model and predict the best outcome, to add stability and accuracy, and to reduce overfitting and variance. Bagging decreases the variance in prediction in high-variance models without increasing the bias. It creates new bootstrap training sets by sampling with replacement and then fits a model to each new training set. These models are combined by averaging the predictions for the regression case. Other machine learning methods, such as random forest and extreme gradient boosting methods, were tried, but they gave very similar results; thus, bagging was chosen because the bagging prediction was faster in case of large dataset (over 3 million soil–land use polygons). Microsoft R and R Studio (v4.0.2) were used to build machine learning models and for exploratory data analysis. For bagging, the tidymodels and baguette libraries were used. As the dependent variable (topsoil phosphorus content (mg/kg)) was a continuous variable, a regression mode and rpart (recursive partitioning and regression tree) model [57] was used for bagging. The dataset was randomly divided into training (75%, 268,882 samples) and test data (25%, 89,625 samples), and high and low phosphorus values were selected proportionally. A total of 25 bootstrap samples were taken from the training dataset to fit the regression model. Additionally, 50 and 100 bags (bootstrap samples) were also tried, but the model improvement was very limited compared to the increase in computing time. For bagging, individual trees are grown deep and not pruned. These trees have high variance and low bias. Overfitting and high variance are solved by averaging the model over the number of trees. In this study, bagging fitted 25 regression models and averaged the results to reduce the variance. A total of 32 variables (Supplementary Table S1) were used to build the bagging model to predict topsoil P content. The categorical variables (soil type, land-use/land-cover type, sediments (parent material), soil texture, and soil hydrological group) were replaced with the median phosphorus content value of each category (Supplementary Table S1).
2.4.3. Model Evaluation
To compare the results from different models, similar evaluation methods and metrics were used when applicable. The main metrics we used to evaluate the model performance were coefficient of determination (R2), root mean squared error (RMSE), and mean absolute error (MAE). R2 is the metric used to describe the performance of any models (including cross-validation and test set validation). R2 explains to what extent the variance of the predicted P explains the variance of the measured P (or polygon median P). In our case, R2 also evaluates the linear regression between the measured and predicted values. RMSE is the standard deviation of the residuals (prediction errors) in original units. As the effect of each error (deviation from regression line) is proportional to the size of the squared error, RMSE is sensitive to outliers. MAE is the average of the absolute values of the errors in original units.
In the kriging method, prediction errors are evaluated using cross-validation by leaving one sample point out and using all other data points to predict the value for this omitted point, but cross-validation method uses all data points to estimate the trend and autocorrelation. As the cross-validation differs from validation applied for evaluation of other models, our original phosphorus dataset was divided into training (75%) and test (25%) datasets by using the ArcGIS Geostatistical Analyst extension tool Subset Features, which created a random subset from the dataset. Both training data cross-validation and test data validation against the measured P values were used to evaluate the kriging model’s performance. As the ArcGIS Geostatistical extension kriging evaluation statistics does not involve any other metrics, the cross-validation dataset was exported to Excel, and the evaluation metrics (R2, RMSE, and MAE) were calculated separately.
The bagging model was built based on 75% of data (268,882 samples) being used as the training set. The other 25% of data (89,625 samples) were used for model validation. To test the bagging model performance, R2, RMSE, and MAE were calculated.
As bagging uses random subsampling with replacement, each bagged predictor was trained on approximately 63% of training data, and the remaining 37% of data were called out-of-bag (OOB) observations. OOB error estimates require less computation than cross-validation and can be used to evaluate model performance in the training process. Another benefit of OOB is that it does not require a separate test dataset. Cross-validation (CV) and 10-fold random sampling were used to evaluate the model performance on the training data, and the evaluation metrics R2, RMSE, and MAE, were calculated.
Besides using traditional (validation on test data) and model-specific (OOB error and cross-validation) validation methods, all model results were also compared with the measured composite sample P values and the soil–land use polygon median P values. The model prediction results were extracted at the measured P sample locations (358,947 samples), and evaluation metrics (MAE, RMSE, and R2) to compare the measured vs. predicted values were calculated. The topsoil P samples collected in 2021 (29,261 samples) served as an additional independent validation dataset not used in any other analysis.
The topsoil P samples were also compared to the soil–land use polygon median P values as the ordination and bagging method predicted values to soil–land use polygons. Likewise, the topsoil P samples collected in 2021 were also compared to the soil–land use polygon median P values, which were calculated based on the topsoil P samples taken in the period 2005–2020.
3. Results
3.1. Long-Term Changes of Topsoil Phosphorus in Agricultural Soils
Plant-available P is relatively stable in natural ecosystems but strongly influenced by management in agricultural areas. To assess trends in topsoil P content, we used long-term monitoring data from the PANDA database for agricultural land in the period 2005–2021.
The lowest number of P samples was collected in 2012 (5243 samples), while 24,857 P samples were collected in 2015. The median P value was lowest in 2005 (47 mg/kg) and highest in 2016 (82 mg/kg). The P sample locations, sample size, and median P content by years are presented in the supplementary materials (Figure S1). As the exploratory analysis detected no specific temporal trend for P values collected in different years (Figure 1), the temporal component was left out from further topsoil P modeling. The P values vary interannually mostly because different locations were sampled in different years and resampling usually occurred in four years. Moreover, the topsoil P value is affected by fertilizer application and crop rotation. Extremely high P values might be measured in case of recent fertilizer application nearby and were treated as outliers.
3.2. Dependence of Topsoil P on Soil Parameters in Agricultural Lands
To understand the dynamics and potential loss of P at the landscape level, it is important to understand how soil parameters are related to P content. We used exploratory statistical analysis to check the measured topsoil P content relations with other variables related to soil, land use, and topography available for the entire Estonia (Figure 2). The correlation analysis shows that in agricultural ecosystems, plant-available P content in topsoil is mainly controlled by fertilization and land management. The best explanatory variables in the single-parameter linear regression to predict P values are soil type (R2 = 0.15) and other soil-related categorical variables, including texture (R2 = 0.08) and soil hydro group (R2 = 0.09). Land-use category contributes less to P prediction in the single-parameter model (R2 = 0.02). According to the linear regression model built by using soil and land-use categories, both soil and land-use categories are statistically significant factors describing the measured P values (R2 = 0.16). The exploratory data analysis shows that higher median P values are associated with automorphic soils (original soil classes shown, approximate WRB reference is provided in [49], mainly with K (Kh 116 mg/kg, KI 93 mg/kg, Ko 81 mg/kg, and Kr 75 mg/kg) and L (Lk 126 mg/kg, LP 101 mg/kg, and LkG 77 mg/kg) soils and also D soils (69 mg/kg). Lower P values are common for hydromorphic soils (AM 16, M 18, T 18, AG 24, G1 27, and Gk 29 mg/kg) (see also Figure 3).
Quaternary sediments as an indicator of parent material are directly related to soil properties, and different sediments contribute differently to topsoil P values. The highest median P values are associated with glaciofluvial deposits (MedP = 90 mg/kg). Shallow quaternary deposits in the case of Rendzic soils (MedP = 76), aeolian deposits (MedP = 74), and till (MedP = 74) have medium median P values. The lowest median P values belong to wetland sediments (peat) where MedP = 35, lacustrine deposits (MedP = 44), glaciolacustrine deposits (MedP = 51), and marine and alluvial deposits (MedP = 59).
3.3. Topsoil Phosphorous Modeling
3.3.1. Soil–Land Use Ordination Model
Soil–land use/land cover ordination is principally a categorical model that assigns the same P values for a particular soil–land use category combination. It can distinguish values for types in a matrix predefined by soil categories (29) multiplied by land-use categories (11), which leads to a total of 298 soil–land use combinations. Each unique soil–land use ordination combination corresponds to single predicted P value. The advantage of this method is that if the soil and land use ordination is known, then further interpolation can also provide topsoil P values for categories where observed values are missing or limited in number, or estimate continuous values for transition from one soil/land use category to another. An ordination model was created to predict the median topsoil phosphorus values for pre-defined soil–land use combinations. The model predicts topsoil P values for pre-defined soil–land use combinations based on the trend surface interpolated by using all available P values (including data from the literature), and the soil and land-use categories are ordinated in an ascending order (Figure 3).
The results show that soil and land-use types have influence on topsoil phosphorus content, but these factors do not describe the majority of variance, which depends on many other factors. This kind of simple two-parameter ordination and classification model does not cover enough variance in topsoil P content to use the predicted P values for, e.g., P loss modeling. To improve the ordination model, the ordination values were replaced with the soil–land use polygon median phosphorus values (Figure 4) calculated based on the PANDA database (2005–2020) in those polygons where phosphorus sampling points existed (there were 108,128 polygons out of 3,063,558 where at least one sampling point was located). In this way, the model quality was improved in agricultural areas. Model validation against the measured P sample values (2005–2020) gave the following results: R2 = 0.74, MAE = 18.8, and RMSE = 36.4, showing the relationship between soil–land use polygon median topsoil phosphorus content and measured phosphorus sampling points. The results suggest that there is quite high variance in topsoil phosphorus content even within the same agricultural parcel with an identical soil type.
3.3.2. Kriging Model
Simple kriging was used to interpolate topsoil P content in Estonia (Figure 5) based on the P sampling points (PANDA database) collected in 2005–2020. Two kriging models were built in order to validate the kriging results by different methods. The first kriging model (Kriging1) was built traditionally by using all sample points and validated by cross-validation (by leaving-one-out method). The Kriging1 model cross-validation evaluation gave the following results: R2 = 0.63, MAE = 27.1, and RMSE = 43.1.
To test the kriging model performance on the test data, Kriging2 model was built by using only 75% of randomly selected P sample data. The remaining 25% of P samples (89,661 samples) were used for model validation, which gave the following results: R2 = 0.62, MAE = 27.7, and RMSE = 44.4.
The kriging models represent the topsoil P values well in fields which are uniform in soil cover and are excessively sampled, but they fail in areas where soil cover is mosaic, crop rotation has been different over the years, or the distance between existing sampling points is greater than the average soil mapping unit diameter.
3.3.3. Bagging Model
The bagging model was introduced in order to overcome the disadvantages of the kriging and ordination models, namely a low share of P variation explained by the two-parameter soil–land use ordination model and the unreliability of the kriging model results outside of agricultural areas and far from the P sampling points.
Ensemble machine learning models can give much more accurate predictions than simple models, but the result is like a Black Box Model which underlying functional form is so complex that it cannot be written down as a simple formula. We used 32 variables (Supplementary Table S1) to build the bagging model. Ensemble models, such as bagging models, that average the results of multiple models are not easy to interpret as each variable may appear in different trees in different positions, if at all. However, bagging gives the aggregated variable importance scores (Figure 6), which can be used to understand which variables are more important in predicting the topsoil P values. According to the bagging model that we used to predict topsoil P values (Figure 7), the two most important variables were the Y coordinate (latitude) and X coordinate (longitude). The next important variables were soil-type median phosphorus content (Soil_MedP) and the soil-type median phosphorus content if the land use was natural grassland (NatSoil_MedP). The absolute elevation was in the fifth rank of importance. The most important topographic variables calculated from the digital elevation model were the standard deviation of slope in soil polygon (slp_stdev), mean terrain ruggedness index (tri_mean), and standard deviation of LS factor (ls_stdev). Soil organic carbon (soc1) was also important as expected, and so was soil polygon size (unit_area).
In many cases, the importance of X and Y coordinates is complicated to interpret, but in our model, they represent a known set of natural phenomena following these directions. The north–south direction represents the gradient in bedrock (from limestone to sandstone) and the presence of naturally occurring phosphorite brought up by glacial activity in the northernmost part of Estonia [58]. The west–east direction coincides with the gradients of maritime to continental climate, lower to higher topography, and soil formation age after the retreat of the last continental ice sheet.
3.3.4. Hybrid Map of Topsoil Phosphorus
All models created based on different methods have limitations inherited from data availability or bias by land-use or soil-type classes. Agricultural land is spatially well covered with sampling data, but only limited soil types and few sampling points are available in natural ecosystems (e.g., forests and wetlands) or human-altered environment (e.g., quarries), thus severely hindering use of data-driven methods such as machine learning or kriging. Moreover, the relationship between the explanatory variables and predicted variable established in a managed environment, such as agricultural land, could not be directly applied in natural ecosystems. On the other hand, simple land-use/soil-type relationship with topsoil P in a relatively uniform natural environment does not describe the spatial and temporal variability of managed ecosystems where the same soil polygon might be divided by different land uses or experience various fertilization practices or crop rotation affecting the soil phosphorus status.
To overcome the problems related to different methods, including (a) interpolation performs well only in densely sampled agricultural lands, (b) the bagging model covers with sufficient accuracy most land-use categories with meaningful sampling data by land-use and soil classes, but topsoil P predictions overshoot in natural ecosystems with limited data availability, and (c) the ordination model’s substantive problem that single variables, such as soil and land use/land cover, explain only a minor share of variance related to topsoil P content in managed and fertilized land-use classes, we created a hybrid map (Figure 8).
The hybrid map was created by combining arable land polygons with the median value of existing sampling data, the bagging-based predicted values for other agricultural lands, and the two-parameter soil–land use ordination matrix-based model values for forests, wetlands, and peat extraction areas. The topsoil P values for each soil–land use unit of eight agricultural land-use categories (permanent grassland, fallow, cultivated grassland, permanent cultures, cereals, legumes, technical cultures, and vegetables) were based on the observed polygon median topsoil P content value if a particular soil–land use unit had sufficient number of sampling data to calculate the median value. The bagging model predicted topsoil P values were used in agricultural land where sampling data were limited or missing. The remaining three non-agricultural land-use types (forest, wetland, and peat extraction area) were based on the ordination model results.
The created high-resolution topsoil phosphorus map reveals clear a latitudinal–longitudinal and elevation-related spatial pattern. Higher predicted P values are concentrated in the northern and western coastal areas. In the northern coast region (Maardu, Toolse, and Rakvere), there are phosphorite deposits due to glacial deposits that naturally contribute to the higher P values in the topsoil of this region. In West Estonian islands and in uplands, the P content in the topsoil is higher than average, partly due to long-term management and fertilization. In Estonian northern and western coastal areas, thin and calcareous juvenile soils contribute to the higher P content as soil age is one of the factors contributing to the P content. Low P values are associated with large wetland areas and older soils with lighter texture, which contain less P due to leaching and erosion.
3.3.5. Validation of Topsoil P Prediction Models
All models were validated against the measured topsoil P values, the median of the measured P values of the soil–land use unit area, as well against each other.
- Ordination validation
Due to the data-driven approach of the ordination model, classical model validation methods (test dataset and cross-validation) were not available. All topsoil P sample points were used to evaluate the ordination model performance (R2 = 0.15, MAE = 42.9, and RMSE = 66.8) (Table 1, Ordination vs. P).
The model results were validated with an independent dataset (P samples collected in 2021), and the results were as follows: R2 = 0.17, MAE = 46.2, and RMSE = 73.4 (in Table 1 Ordination vs. P 2021). The ordination model results were also evaluated against the soil–land use polygon median P values as the ordination model predicts values based on the soil–land use types. The ordination model evaluation against the polygon median P values gave slightly better results (R2 = 0.20, MAE = 36.7, and RMSE = 56.5) (Table 1, Ordination vs. poly MedP) compared to the evaluation against the sampled P values. The ordination + polygon median P model results were validated with an independent dataset (P samples collected in 2021), and the results were as follows: R2 = 0.48, MAE = 34.5, and RMSE = 57.4 (Table 1: Ordination + polygon MedP vs. P 2021).
- Kriging validation
The Kriging1 model cross-validation evaluation gave the following results: R2 = 0.63, MAE = 27.1, and RMSE = 43.1 (Table 2, Kriging1 CV vs. P). The R2 between the Kriging1 predicted values and all measured phosphorus values is 0.82, MAE = 19.8, and RMSE = 31.3 (Table 2, Kriging1 vs. P), but this comparison is not valid as the validation considering the kriging1 model was built by using the same P sample points, and the kriging interpolator is the exact interpolator; thus, the result rather suggests that variation in the topsoil P values is quite high even in a very short distance.
The Kriging1 model results were also compared with the soil–land use polygon median P values (kriging model value in the measured P sample location was compared with the median P value of soil–land use polygon; Table 2, Kriging1 vs. poly MedP). These results show very good model performance; however, as the model was built by using all P samples and it was evaluated using the same data, the good agreement was expected. The Kriging1 model performance based on the data that were not included in model building (P samples taken in 2021) gave the following results: R2 = 0.59, MAE = 30.7, and RMSE = 49.6 (Table 2, Kriging1 vs. P 2021), indicating significant interannual and spatial topsoil P variation due to fertilization and crop rotation.
The Kriging2 model results were evaluated by comparing the test dataset that was not used in the kriging surface prediction to the soil–land use polygon median P values (R2 = 0.75, MAE = 19.7, and RMSE = 31.6; Table 2, Kriging2_test vs. poly MedP). With relatively good accordance of this comparison in proportion to the abovementioned comparison between the Kriging1 model and 2021 sampling data, it reflects that interannual variation in arable-land topsoil P content might be a more important factor than spatial variation.
- Bagging validation
Bagging model performance was validated on the test dataset (bagging model was built on 75% of randomly selected bootstrap sample and 25% of data were left for model validation), and the results were as follows: R2 = 0.54, MAE = 30.8, and RMSE = 48.6 (Table 3, Bagging_test vs. P). The evaluation of the bagging model results against all measured P samples (both training and test data) show moderate prediction capability (R2 = 0.56, MAE = 30.4, and RMSE = 47.3 (Table 3, Bagging vs. P)).
The bagging predicted P values against the polygon median P values show good agreement: R2 = 0.72, MAE = 20.9, and RMSE = 33.6 (Table 3, Bagging vs. poly MedP). The PANDA database P samples collected in 2021 were used as an additional validation dataset to evaluate the bagging model performance. The result shows a weaker prediction capability like in the case of kriging1 with similar validation: R2 = 0.43, MAE = 36.9, and RMSE = 58.3 (Table 3, Bagging vs. P 2021). When the bagging prediction results were replaced with the soil–land use polygon median P values (in polygons where P samples were taken in 2005–2020) and the results were compared to the P samples taken in 2021, the results were only slightly better: R2 = 0.49, MAE = 34.3, and RMSE = 56.5 (Table 3, Bagging + polygon MedP vs. P 2021).
The bagging model performance was also evaluated by calculating the out-of-bag estimate, which used the training data that were left out from the random bootstrap sampling with replacement (OOB sample) as a test dataset (RMSE = 50.3; Table 3, Bagging OOB error). The cross-validation (CV) and 10-fold random sampling gave the following results: RMSE = 49.1, R2 = 0.52, and MAE = 31.3 (Table 3, Bagging 10-fold CV).
4. Discussion
High-resolution modeling of topsoil plant-available P over large areas is a complicated task as P content is influenced by both natural and human-driven processes; some of these phenomena are continuous in time and space (e.g., soil development, parent material, erosion, climate), while management of agricultural lands can affect P content in topsoil sharply at the border of land parcels, even in cases of the same soil and crop types, or over the years, bearing in mind legacy P as well.
Previous studies have shown that soil P content is heterogeneous even at the field level [59], although land use is also an important factor determining P content. Our results show that the topsoil P values inside the same soil–land use polygon can have quite high variance (mean P range inside soil–land use polygon 58 mg/kg, median range 38 mg/kg, maximum range of 198 mg/kg). Very high P values are usually related to croplands but are sometimes observed in pasture areas as well, which can be explained by the presence of livestock and continuous addition of manure. This phenomenon has been observed in extensively grazed natural grasslands and wooded meadows in Estonia, and it is also recorded by Roger et al. [13]. Roger et al. [13] showed that due to continuous addition of manure (on average, 737 mg/kg organic P), permanent grasslands and mountain pasture areas, compared to croplands, have the lowest quantity of total P, but the highest quantity of available P.
There is an inherent problem of unbalanced monitoring data by land-use categories but also by soil types, which affects spatial analysis of soil properties [60,61]. The relative lack of information from non-agricultural areas results in bias of data by spatial extent and land-use types. The relationship established between the explanatory variables and predicted variable in a managed environment could not be directly applied in natural ecosystems. While topsoil P is relatively uniform by soil type in natural environments, the spatial and temporal variability of managed ecosystems is very high, being affected by land uses, fertilization practices, crop rotation, as well as the legacy P. Most authors, who have predicted P values for larger areas, have found that prediction uncertainty is high [23], and higher uncertainty has been associated with sparse measurements and higher measured P values [19].
Most commonly used ancillary environmental variables for P prediction models include soil properties, e.g., clay, sand, soil organic matter, pH, and soil type [13,17,20,62], different topographic variables, such as slope, elevation, curvature, LS factor and topographic wetness index [13,17,20], vegetation and remote sensing data mostly in the form of vegetation indices, e.g., NDVI [16,22], land use [13,17], and climatic variables (e.g., temperature and precipitation indices) [17]. Similar to our results, higher P values are associated with anthropogenic land use and fertilizer application [19]. According to Hosseini et al. [20] attributes related to agricultural practices contributed more to plant-available P models, whereas soil and geological attributes contributed more to TP (total P) models. Roger et al. [13] found that environmental variables (elevation, slope, wetness index, and plan curvature derived from a digital elevation model) explained about 20–25% of spatial variance of different P forms. In our study, soil type explained about 15% of P variance, land-use category explained 13%, and other parameters contributed individually less, although most of them were statistically significant in the bagging model.
The kriging model shows the best results in model evaluation, but its use is limited to land-use categories with extensive sampling data available as interpolation methods are primarily based on spatial autocorrelation. The bagging and ordination models are not related to certain locations, although the bagging model includes also spatial variables (latitude and longitude), and, therefore, the values that these models predict are not directly connected to the sample point values in particular locations.
5. Conclusions
Three methods were used for data-driven spatial modeling to produce a spatially detailed map of plant-available topsoil P content in Estonia. Simple kriging performed the best (R2 = 0.82, MAE = 19.8, and RMSE = 31.3) for agricultural lands where sampling density was high and spatially well distributed; however, due to the method’s reliance on spatial autocorrelation, it is unable to predict values in areas with high spatial variance in soil or land-use types, and in areas with missing sampling points or with low sampling density where the active lag distance is exceeded.
The results of the bagging model were slightly inferior (R2 = 0.56, MAE = 30.4, and RMSE = 47.3) to the kriging model. However, bagging models are not directly related to certain sampling locations nor sampling density but incorporate supplementary spatial variables (e.g., latitude, longitude, elevation land-use classes, and soil properties); therefore, these models are more capable of predicting available P values in agricultural lands distant to any sampling point. Nevertheless, neither bagging nor kriging models, which heavily rely on an extensive database of measured topsoil P content from agricultural soils, could be used to predict topsoil P values outside of agricultural lands, where the processes of P mineralization and immobilization, often biological in nature, are generally different than in agricultural ecosystems where P is added as a fertilizer and crop rotation affects the topsoil P status.
In large non-agricultural areas (wetlands and forests, covering 61% of Estonian land area), topsoil plant-available P content was infrequently sampled with poor spatial coverage. To overcome the spatial soil P data scarcity, a two-parameter soil–land use ordination matrix-based model was developed. The median topsoil P value of this ordination approach did not explain the spatial variance (R2 = 0.20, MAE = 36.7, and RMSE = 56.5) in data-abundant agricultural areas; however, soil type alone explained about 15% of P variance and land-use class contributed less (13%), thus making it sufficient for gap filling in these spatially more homogeneous areas, especially for peat soils.
The final hybrid topsoil plant-available P map (R2 = 0.74, MAE = 18.8, and RMSE = 36.4) was produced by combining arable-land polygons with the median value of the sampling data, the bagging-based predicted values for agricultural lands with missing sampling data, and the two-parameter soil–land use ordination matrix-based model values for forests and wetlands.
The predicted topsoil plant-available P map can be used to assess soil P fertilization need, estimate legacy P, and optimize P fertilizer application, taking into consideration soil properties to reduce P loss and eutrophication of waterbodies.
Supplementary Materials
The following supporting information can be downloaded at https://www.mdpi.com/article/10.3390/agronomy13051183/s1. Figure S1: Topsoil plant-available P sample points taken from agricultural lands in 2005–2020. The count (n) and median P value (mg/kg) are presented for every year; Table S1: Variables used in bagging model. P is the predicted variable, and 32 variables were used to predict the P values. Index 1 after sand, silt, clay, rock, soc, bd, k, and awc indicates the upper soil layer (topsoil). Different statistics (mean, median, and standard deviation) of the topographic variables (TRI, TWI, LS, and SLP) were included in the bagging model. References [63,64,65,66,67,68] are cited in Supplementary Materials.
Author Contributions
Conceptualization, A.K. (Ain Kull), P.P. and A.K. (Anne Kull); methodology, A.K. (Ain Kull) and A.K. (Anne Kull); formal analysis, A.K. (Anne Kull), A.K. (Ain Kull) and T.K.; resources, A.K. (Ain Kull) and P.P.; data curation, A.K. (Anne Kull), A.K. (Ain Kull) and T.K.; writing—original draft preparation, A.K. (Anne Kull) and A.K. (Ain Kull); writing—review and editing, A.K. (Ain Kull), A.K. (Anne Kull), T.K. and P.P.; visualization, A.K. (Anne Kull) and A.K. (Ain Kull); funding acquisition, A.K. (Ain Kull) and P.P. All authors have read and agreed to the published version of the manuscript.
Funding
This research was supported by the Estonian Research Council research grants PRG352, PRG1167, and SLTOM19384 (WaterJPI-JC-2018_13); the Estonian Environmental Investment Centre grants SLOOM12006 and SLOOM14103; the Estonian State Forest Management Centre grant LLTOM17250; and the Ministry of Rural Affairs.
Institutional Review Board Statement
Not applicable.
Informed Consent Statement
Not applicable.
Data Availability Statement
The high-resolution plant-available topsoil phosphorous hybrid map generated during the study is available at the following site: https://datadoi.ee/handle/33/405?locale-attribute=en (accessed on 20 March 2023).
Acknowledgments
The authors would like to thank Elsa Putku for her valuable comments and discussions during manuscript preparation process.
Conflicts of Interest
The authors declare no conflict of interest. The funders had no role in the design of the study; in the collection, analyses, or interpretation of data; in the writing of the manuscript, or in the decision to publish the results.
References
- Harrison, A.F. Soil Organic Phosphorous: A Review of World Literature; CAB International: Singapore, 1987. [Google Scholar]
- Bardgett, R. The Biology of Soil: A Community and Ecosystem Approach; Oxford University Press: New York, NY, USA, 2005. [Google Scholar]
- Van der Wal, A.; de Boer, W.; Lubbers, I.M.; van Veen, J.A. Concentration and vertical distribution of total soil phosphorus in relation to time of abandonment of arable fields. Nutr. Cycl. Agroecosys. 2007, 79, 73–79. [Google Scholar] [CrossRef]
- Batjes, N.H. Global Distribution of Soil Phosphorus Retention Potential; ISRIC: Wageningen, The Netherlands, 2011. [Google Scholar]
- Penn, C.; Camberato, J. A Critical Review on Soil Chemical Processes that Control How Soil pH Affects Phosphorus Availability to Plants. Agriculture 2019, 9, 120. [Google Scholar] [CrossRef]
- Brady, N.C.; Weil, R.R. Soil Organic Matter. The Nature and Properties of Soils; Prentice Hall: Upper Saddle River, NJ, USA, 1999. [Google Scholar]
- Tarafdar, J.C.; Claassen, N. Organic phosphorus compounds as a phosphorus source for higher plants through the activity of phosphatases produced by plant roots and microorganisms. Biol. Fertil. Soils 1988, 5, 308–312. [Google Scholar] [CrossRef]
- Beckett, P.H.T.; White, R.E. Studies on the Phosphate Potentials of Soils: Part III: The Pool of Labile Inorganic Phosphate. Plant Soil 1964, 21, 253–282. [Google Scholar] [CrossRef]
- Hinsinger, P. Bioavailability of soil inorganic P in the rhizosphere as affected by root-induced chemical changes: A review. Plant Soil 2001, 237, 173–195. [Google Scholar] [CrossRef]
- Lambers, H.; Raven, J.A.; Shaver, G.R.; Smith, S.E. Plant nutrient-acquisition strategies change with soil age. Trends Ecol. Evol. 2008, 23, 95–103. [Google Scholar] [CrossRef]
- Nelson, L.; Cade-Menun, B.J.; Walker, I.J.; Sanborn, P. Soil Phosphorus Dynamics Across a Holocene Chronosequence of Aeolian Sand Dunes in a Hypermaritime Environment on Calvert Island, BC, Canada. Front. For. Glob. Chang. 2020, 3, 83. [Google Scholar] [CrossRef]
- Tian, J.; Dong, G.; Karthikeyan, R.; Li, L.; Harmel, R. Phosphorus Dynamics in Long-Term Flooded, Drained, and Reflooded Soils. Water 2017, 9, 531. [Google Scholar] [CrossRef]
- Roger, A.; Libohova, Z.; Rossier, N.; Joost, S.; Maltas, A.; Frossard, E.; Sinaj, S. Spatial variability of soil phosphorus in the Fribourg canton, Switzerland. Geoderma 2014, 217, 26–36. [Google Scholar] [CrossRef]
- Mondal, B.P.; Sekhon, B.S.; Sadhukhan, R.; Singh, R.K.; Hasanain, M.; Mridha, N.; Das, B.; Dhyay, A.C.; Banerjee, K. Spatial variability assessment of soil available phosphorus using geostatistical approach. Indian J. Agric. Sci. 2020, 90, 1170–1175. [Google Scholar] [CrossRef]
- Scull, P.; Franklin, J.; Chadwick, O.A.; McArthur, D. Predictive soil mapping: A review. Prog. Phys. Geogr. 2003, 27, 171–197. [Google Scholar] [CrossRef]
- Rivero, R.G.; Grunwald, S.; Bruland, G.L. Incorporation of spectral data into multivariate geostatistical models to map soil phosphorus variability in a Florida wetland. Geoderma 2007, 140, 428–443. [Google Scholar] [CrossRef]
- Ballabio, C.; Lugato, E.; Fernández-Ugalde, O.; Orgiazzi, A.; Jones, A.; Borrelli, P.; Montanarella, L.; Panagos, P. Mapping LUCAS topsoil chemical properties at European scale using Gaussian process regression. Geoderma 2019, 355, 113912. [Google Scholar] [CrossRef] [PubMed]
- Matos-Moreira, M.; Lemercier, B.; Dupas, R.; Michot, D.; Viaud, V.; Akkal-Corfini, N.; Louis, B.; Gascuel-Odoux, C. High-resolution mapping of soil phosphorus concentration in agricultural landscapes with readily available or detailed survey data. Eur. J. Soil Sci. 2017, 68, 281–294. [Google Scholar] [CrossRef]
- Viscarra Rossel, R.A.; Bui, E.N. A new detailed map of total phosphorus stocks in Australian soil. Sci. Total Environ. 2016, 542, 1040–1049. [Google Scholar] [CrossRef]
- Hosseini, M.; Rajabi Agereh, S.; Khaledian, Y.; Jafarzadeh Zoghalchali, H.; Brevik, E.C.; Movahedi Naeini, S.A.R. Comparison of multiple statistical techniques to predict soil phosphorus. Appl. Soil Ecol. 2017, 114, 123–131. [Google Scholar] [CrossRef]
- Esfandiarpour-Boroujeni, I.; Shahini-Shamsabadi, M.; Shirani, H.; Mosleh, Z.; Bagheri-Bodaghabadi, M.; Salehi, M.H. Assessment of different digital soil mapping methods for prediction of soil classes in the Shahrekord plain, Central Iran. Catena 2020, 193, 104648. [Google Scholar] [CrossRef]
- Bogrekci, I.; Lee, W.S. Spectral Phosphorus Mapping using Diffuse Reflectance of Soils and Grass. Biosyst. Eng. 2005, 91, 305–312. [Google Scholar] [CrossRef]
- Yang, X.; Post, W.M.; Thornton, P.E.; Jain, A. The distribution of soil phosphorus for global biogeochemical modeling. Biogeosciences 2013, 10, 2525–2537. [Google Scholar] [CrossRef]
- Iatrou, M.; Papadopoulos, A.; Papadopoulos, F.; Dichala, O.; Psoma, P.; Bountla, A. Determination of Soil Available Phosphorus using the Olsen and Mehlich 3 Methods for Greek Soils Having Variable Amounts of Calcium Carbonate. Commun. Soil Sci. Plant Anal. 2014, 45, 2207–2214. [Google Scholar] [CrossRef]
- Szara, E.; Sosulski, T.; Szymańska, M.; Szyszkowska, K. Usefulness of Mehlich-3 test in the monitoring of phosphorus dispersion from Polish arable soils. Environ. Monit. Assess. 2018, 190, 1–10. [Google Scholar] [CrossRef] [PubMed]
- Vares, A.; Jõgiste, K.; Kull, E. Early growth of some deciduous tree species on abandoned agricultural lands in Estonia. Balt. For. 2001, 7, 52–58. [Google Scholar]
- Laas, A.; Kull, A. Application Of GIS For Soil Erosion And Nutrient Loss Modelling In A Small River Catchment. WIT Trans. Ecol. Environ. 2003, 67, 525–534. [Google Scholar] [CrossRef]
- Vares, A.; Uri, V.; Tullus, H.; Kanal, A. Height growth of four fast-growing deciduous tree species on former agricultural lands in Estonia. Balt. For. 2003, 9, 2–8. [Google Scholar]
- Kull, A.; Kull, A.; Jaagus, J.; Kuusemets, V.; Mander, U. The effects of fluctuating climatic conditions and weather events on nutrient dynamics in a narrow mosaic riparian peatland. Boreal Environ. Res. 2008, 13, 243–263. [Google Scholar]
- Kund, M.; Vares, A.; Sims, A.; Tullus, H.; Uri, V. Early growth and development of silver birch (Betula pendula Roth.) plantations on abandoned agricultural land. Eur. J. Forest Res. 2010, 129, 679–688. [Google Scholar] [CrossRef]
- Varik, M.; Aosaar, J.; Ostonen, I.; Lõhmus, K.; Uri, V. Carbon and nitrogen accumulation in belowground tree biomass in a chronosequence of silver birch stands. For. Ecol. Manag. 2013, 302, 62–70. [Google Scholar] [CrossRef]
- Lutter, R.; Tullus, T.; Tullus, A.; Kanal, A.; Tullus, H. Forest Ecosystem Recovery in 15-Year-Old Hybrid Aspen (Populus tremula L. × p. Tremuloides Michx.) Plantations on a Reclaimed Oil Shale Quarry. Oil Shale 2017, 34, 368–389. [Google Scholar] [CrossRef]
- Lutter, R.; Tullus, A.; Kanal, A.; Tullus, T.; Vares, A.; Tullus, H. Growth development and plant–soil relations in midterm silver birch (Betula pendula Roth) plantations on previous agricultural lands in hemiboreal Estonia. Eur. J. Forest Res. 2015, 134, 653–667. [Google Scholar] [CrossRef]
- Uri, V.; Kukumägi, M.; Aosaar, J.; Varik, M.; Becker, H.; Soosaar, K.; Morozov, G.; Ligi, K.; Padari, A.; Ostonen, I.; et al. Carbon budgets in fertile grey alder (Alnus incana (L.) Moench.) stands of different ages. For. Ecol. Manag. 2017, 396, 55–67. [Google Scholar] [CrossRef]
- Uri, V.; Kukumägi, M.; Aosaar, J.; Varik, M.; Becker, H.; Morozov, G.; Karoles, K. Ecosystems carbon budgets of differently aged downy birch stands growing on well-drained peatlands. For. Ecol. Manag. 2017, 399, 82–93. [Google Scholar] [CrossRef]
- Uri, V.; Aosaar, J.; Varik, M.; Becker, H.; Kukumägi, M.; Ligi, K.; Pärn, L.; Kanal, A. Biomass resource and environmental effects of Norway spruce (Picea abies) stump harvesting: An Estonian case study. For. Ecol. Manag. 2015, 335, 207–215. [Google Scholar] [CrossRef]
- Uri, V.; Kukumägi, M.; Aosaar, J.; Varik, M.; Becker, H.; Aun, K.; Krasnova, A.; Morozov, G.; Ostonen, I.; Mander, Ü.; et al. The carbon balance of a six-year-old Scots pine (Pinus sylvestris L.) ecosystem estimated by different methods. For. Ecol. Manag. 2019, 433, 248–262. [Google Scholar] [CrossRef]
- Varik, M.; Kukumägi, M.; Aosaar, J.; Becker, H.; Ostonen, I.; Lõhmus, K.; Uri, V. Carbon budgets in fertile silver birch (Betula pendula Roth) chronosequence stands. Ecol. Eng. 2015, 77, 284–296. [Google Scholar] [CrossRef]
- Aosaar, J.; Mander, Ü.; Varik, M.; Becker, H.; Morozov, G.; Maddison, M.; Uri, V. Biomass production and nitrogen balance of naturally afforested silver birch (Betula pendula Roth.) stand in Estonia. Silva Fenn. 2016, 50, 1114. [Google Scholar] [CrossRef]
- Aosaar, J.; Drenkhan, T.; Adamson, K.; Aun, K.; Becker, H.; Buht, M.; Drenkhan, R.; Fjodorov, M.; Jürimaa, K.; Morozov, G.; et al. The effect of stump harvesting on tree growth and the infection of root rot in young Norway spruce stands in hemiboreal Estonia. For. Ecol. Manag. 2020, 475, 118425. [Google Scholar] [CrossRef]
- Aun, K.; Kukumägi, M.; Varik, M.; Becker, H.; Aosaar, J.; Uri, M.; Morozov, G.; Buht, M.; Uri, V. Short-term effect of thinning on the carbon budget of young and middle-aged Scots pine (Pinus sylvestris L.) stands. For. Ecol. Manag. 2021, 492, 119241. [Google Scholar] [CrossRef]
- Becker, H.; Aosaar, J.; Varik, M.; Morozov, G.; Kanal, A.; Uri, V. The effect of Norway spruce stump harvesting on net nitrogen mineralization and nutrient leaching. For. Ecol. Manag. 2016, 377, 150–160. [Google Scholar] [CrossRef]
- Paal, J.; Jürjendal, I.; Suija, A.; Kull, A. Impact of drainage on vegetation of transitional mires in Estonia. Mires Peat 2016, 18, 1–19. [Google Scholar] [CrossRef]
- Tullus, T.; Lutter, R.; Randlane, T.; Saag, A.; Tullus, A.; Oja, E.; Degtjarenko, P.; Pärtel, M.; Tullus, H. The effect of stand age on biodiversity in a 130-year chronosequence of Populus tremula stands. For. Ecol. Manag. 2022, 504, 119833. [Google Scholar] [CrossRef]
- Kull, A. Buffer Zones to Limit and Mitigate Harmful Effects of Long-Term Anthropogenic Influence to Maintain Ecological Functionality of Bogs, Stage II. 2016. Available online: https://4ce0b57b-a630-4e1d-8a88-d1e1a7a51b96.filesusr.com/ugd/6b6658_446958f4118b44a2a68812820c31119b.pdf (accessed on 13 January 2023). (In Estonian).
- Asi, E.; Timmusk, T. Greenhouse Gas Emissions Inventory Studies for the National Reporting on Forest Litter and Soil; Ministry of the Environment: Tallinn, Estonia, 2018. (In Estonian)
- Kulhánek, M.; Balík, J.; Černý, J.; Vaněk, V. Evaluation of phosphorus mobility in soil using different extraction methods. Plant Soil Environ. 2009, 55, 267–272. [Google Scholar] [CrossRef]
- Wolf, A.M.; Baker, D.E. Comparisons of soil test phosphorus by Olsen, Bray P1, Mehlich I and Mehlich III methods. Commun. Soil Sci. Plant Anal. 1985, 16, 467–484. [Google Scholar] [CrossRef]
- Kmoch, A.; Kanal, A.; Astover, A.; Kull, A.; Virro, H.; Helm, A.; Pärtel, M.; Ostonen, I.; Uuemaa, E. EstSoil-EH: A high-resolution eco-hydrological modelling parameters dataset for Estonia. Earth Syst. Sci. Data 2021, 13, 83–97. [Google Scholar] [CrossRef]
- Kachinsky, N. Soil Physics; Nauka Publishing House: Moscow, Russia, 1965; 320p. (In Russian) [Google Scholar]
- Abd-Elsamad, A.; Abdelmoein, N.M.; Mahmoud, A.H.; Rostom, M.; Hassan, S.M.; Gazni, R. Evaluation and comparison of ordinary kriging and inverse distance weighting methods for prediction of spatial variability of some soil chemical parameters. Res. J. Biol. Sci. 2009, 4, 93–102. [Google Scholar]
- Sahu, B.; Ghosh, A.K. Seema Deterministic and geostatistical models for predicting soil organic carbon in a 60 ha farm on Inceptisol in Varanasi, India. Geoderma Reg. 2021, 26, e00413. [Google Scholar] [CrossRef]
- Xue, W.; Pangara, C.; Aung, A.M.; Yu, S.; Tabucanon, A.S.; Hong, B.; Kurniawan, T.A. Spatial changes of nutrients and metallic contaminants in topsoil with multi-geostatistical approaches in a large-size watershed. Sci. Total Environ. 2022, 824, 153888. [Google Scholar] [CrossRef] [PubMed]
- Peet, R.K. Ordination as a tool for analyzing complex data sets. Vegetatio 1980, 42, 171–174. [Google Scholar] [CrossRef]
- Ter Braak, C.J.F.; Prentice, I.C. A Theory of Gradient Analysis. In Advances in Ecological Research; Elsevier Science & Technology: Amsterdam, The Netherlands, 2004; Volume 34, pp. 235–282. [Google Scholar]
- Breiman, L. Bagging predictors. Mach Learn. 1996, 24, 123–140. [Google Scholar] [CrossRef]
- Therneau, T.M.; Atkinson, E.J. An Introduction to Recursive Partitioning Using the RPART Routines. In An Introduction to Recursive Partitioning Using the RPART Routines; Mayo Foundation: Rochester, MN, USA, 2022; p. 61. [Google Scholar]
- Petersell, V.; Ressar, H.; Carlsson, M.; Mõttus, V.; Enel, M.; Mardla, A.; Täht, K. Geochemical atlas of Estonian agricultural soil. Eest. Geol. Sver. Geol. Undersökning. Tallinn Upps. Seletuskiri 1997, 75, 171. [Google Scholar]
- Werner, F.; Mueller, C.W.; Thieme, J.; Gianoncelli, A.; Rivard, C.; Höschen, C.; Prietzel, J. Micro-scale heterogeneity of soil phosphorus depends on soil substrate and depth. Sci. Rep. 2017, 7, 3203–3209. [Google Scholar] [CrossRef]
- Van Leeuwen, J.P.; Saby, N.P.A.; Jones, A.; Louwagie, G.; Micheli, E.; Rutgers, M.; Schulte, R.P.O.; Spiegel, H.; Toth, G.; Creamer, R.E. Gap assessment in current soil monitoring networks across Europe for measuring soil functions. ERL 2017, 12, 124007. [Google Scholar] [CrossRef]
- Schillaci, C.; Saia, S.; Lipani, A.; Perego, A.; Zaccone, C.; Acutis, M. Validating the regional estimates of changes in soil organic carbon by using the data from paired-sites: The case study of Mediterranean arable lands. Carbon Balance Manag. 2021, 16, 19. [Google Scholar] [CrossRef] [PubMed]
- Keshavarzi, A.; Omran, E.E.; Bateni, S.M.; Pradhan, B.; Vasu, D.; Bagherzadeh, A. Modeling of available soil phosphorus (ASP) using multi-objective group method of data handling. Model. Earth Syst. Environ. 2016, 2, 1–9. [Google Scholar] [CrossRef]
- Zhang, Y.; Schaap, M.G. Weighted recalibration of the Rosetta pedotransfer model with improved estimates of hydraulic parameter distributions and summary statistics (Rosetta3). J. Hydrol. 2017, 547, 39–53. [Google Scholar] [CrossRef]
- Dipak, S.; Abhijit, H. Physical and Chemical Methods in Soil Analysis; New Age International Ltd.: New Delhi, India, 2005; 193p. [Google Scholar]
- Tóth, B.; Weynants, M.; Pásztor, L.; Hengl, T. 3D soil hydraulic database of Europe at 250 m resolution. Hydrol Process 2017, 31, 2662–2666. [Google Scholar] [CrossRef]
- Riley, S.J.; DeGloria, S.D.; Elliot, R. Index that quantifies topographic heterogeneity. Intermt. J. Sci. 1999, 5, 23–27. [Google Scholar]
- Beven, K.J.; Kirkby, M.J. A physically based, variable contributing area model of basin hydrology/Un modèle à base physique de zone d’appel variable de l’hydrologie du bassin versant. Hydrol. Sci. J. 1979, 24, 43–69. [Google Scholar] [CrossRef]
- Moore, I.D.; Grayson, R.B.; Ladson, A.R. Digital terrain modelling: A review of hydrological, geomorphological, and biological applications. Hydrol. Process 1991, 5, 3–30. [Google Scholar] [CrossRef]
Figure 1.
Measured topsoil P values (mg/kg) for agricultural lands in 2005–2021 and corresponding median P values for main land-use classes.
Figure 1.
Measured topsoil P values (mg/kg) for agricultural lands in 2005–2021 and corresponding median P values for main land-use classes.
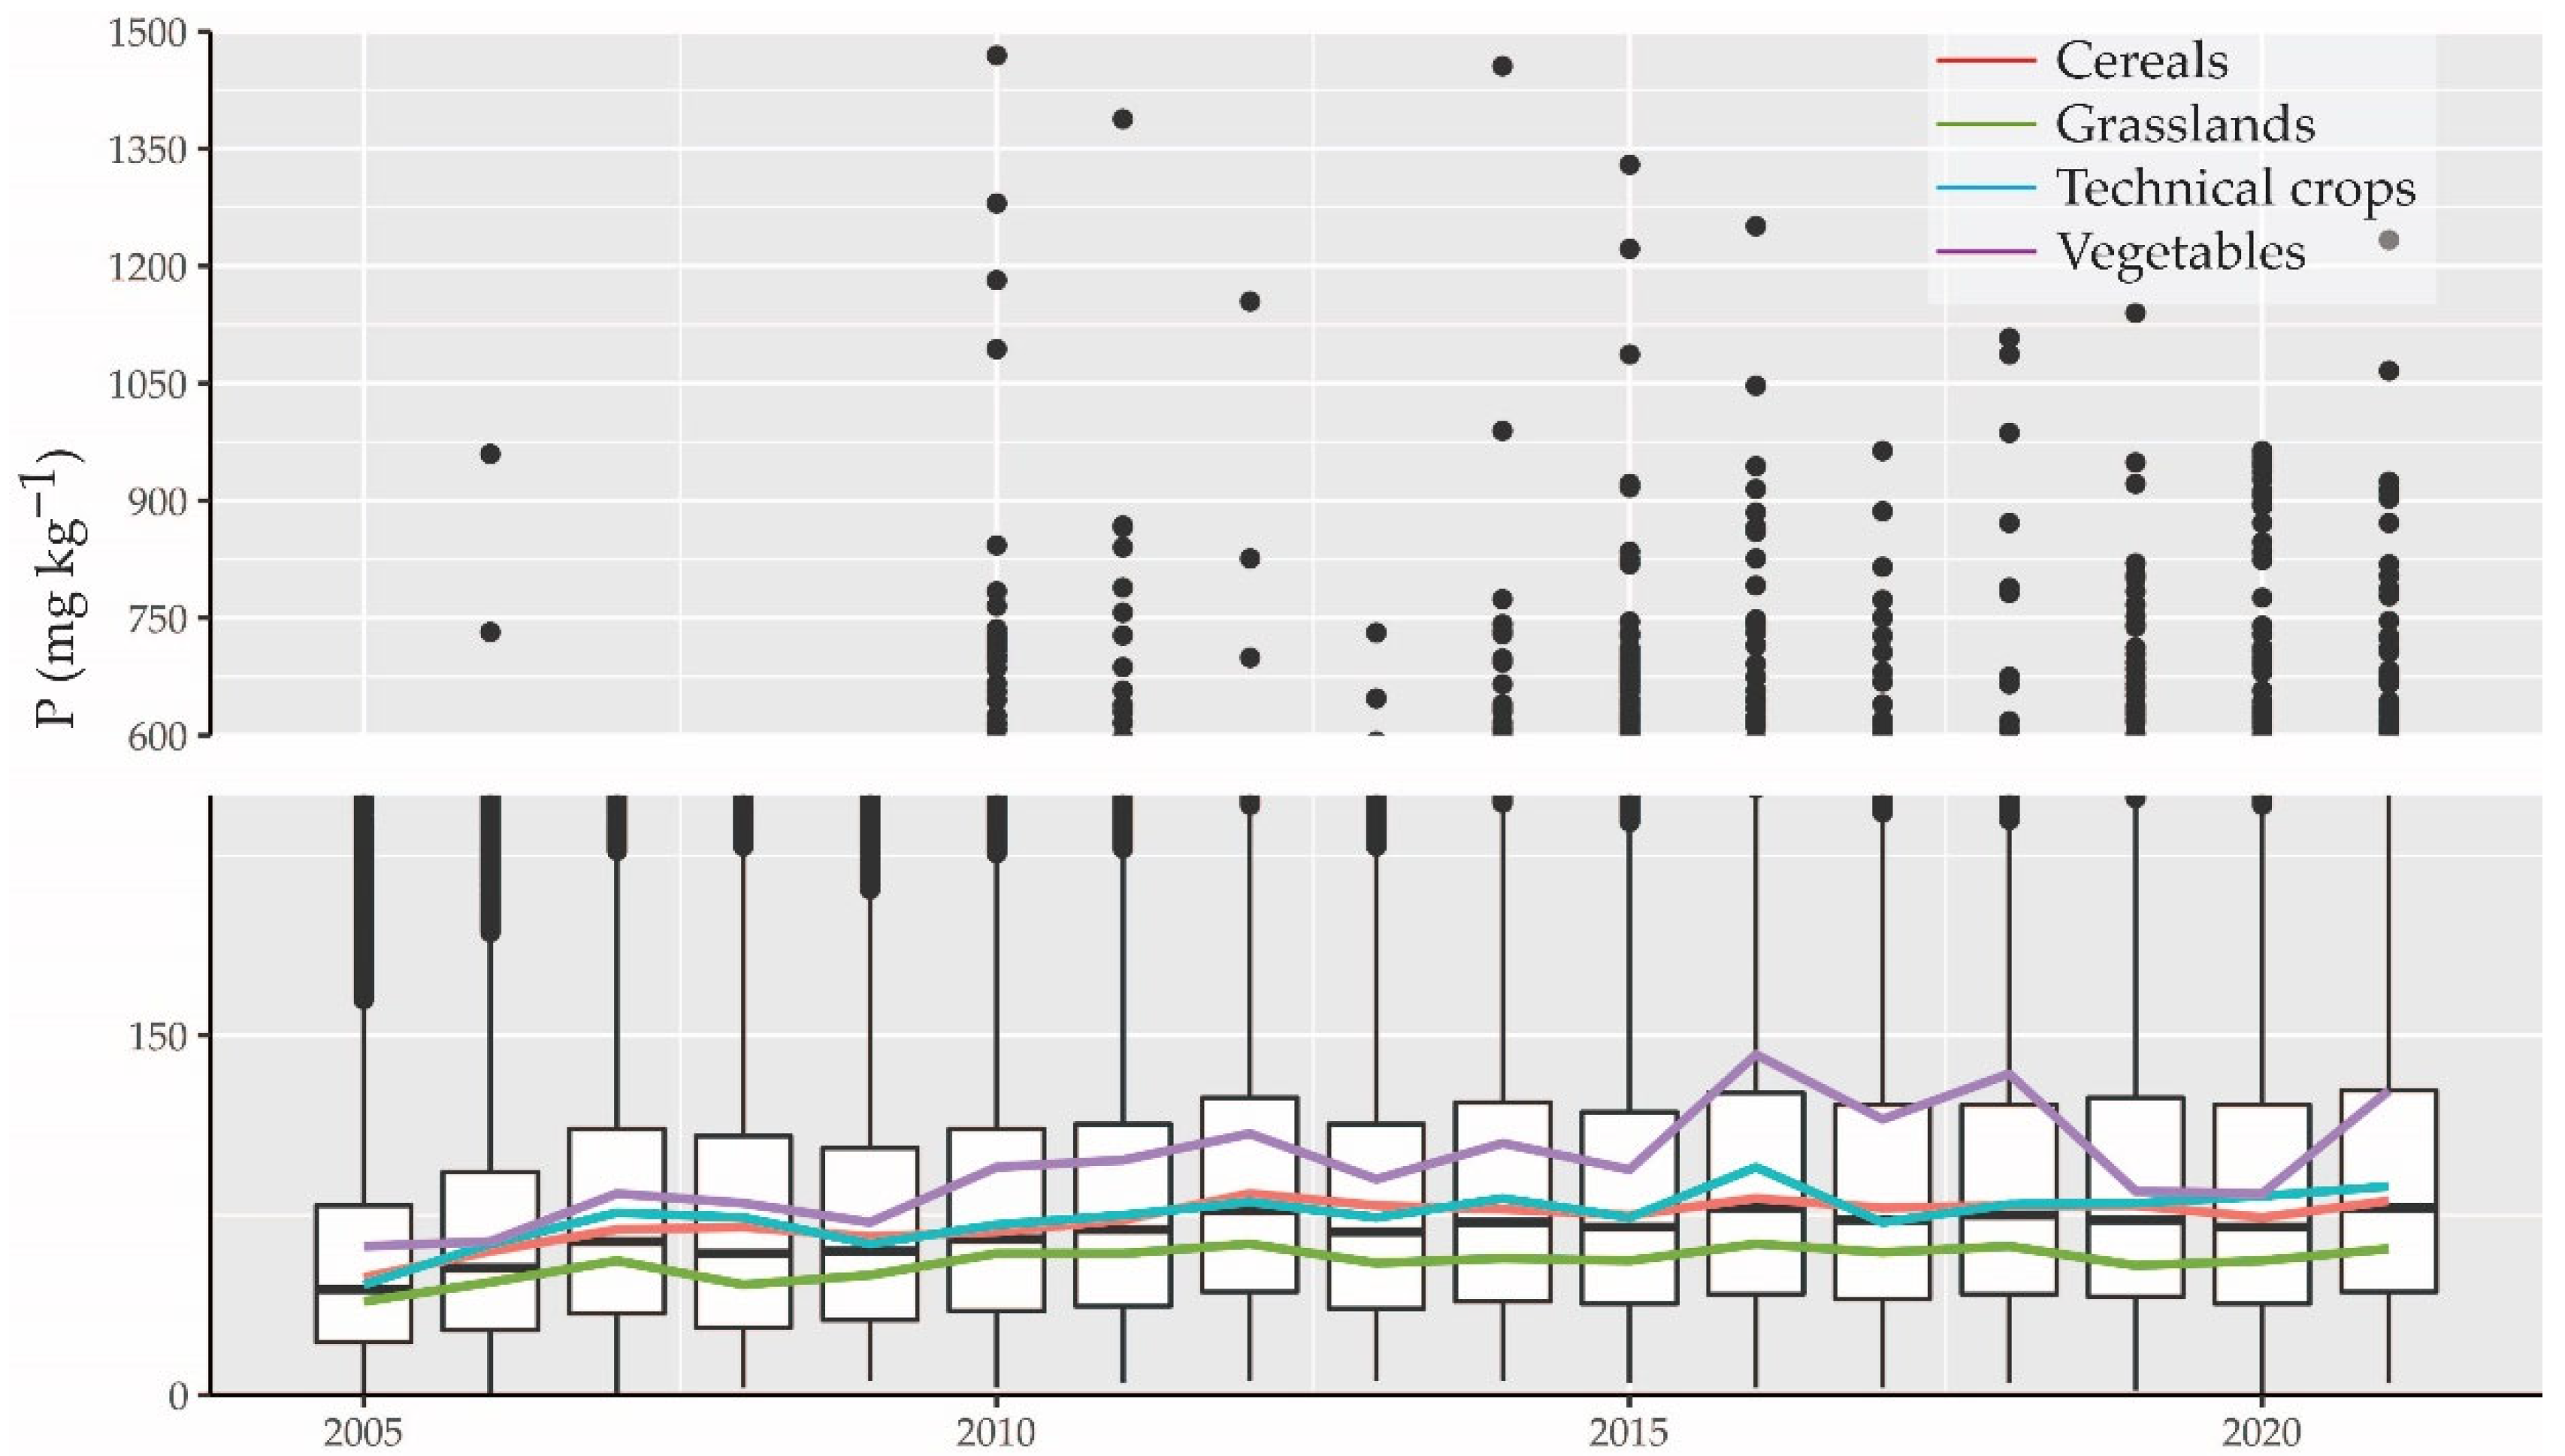
Figure 2.
Kendall correlation between topsoil P values (mg/kg) for agricultural lands in 2005–2020 and variables used in the bagging model.
Figure 2.
Kendall correlation between topsoil P values (mg/kg) for agricultural lands in 2005–2020 and variables used in the bagging model.

Figure 3.
Data gap filling by radial basis multiquadratic spatial interpolation along soil and crop ordination axes to model topsoil P values for any soil-type and land-use combinations.
Figure 3.
Data gap filling by radial basis multiquadratic spatial interpolation along soil and crop ordination axes to model topsoil P values for any soil-type and land-use combinations.

Figure 4.
Modeled topsoil median plant-available P content (mg/kg) based on soil–land use ordination + polygon median P model.
Figure 4.
Modeled topsoil median plant-available P content (mg/kg) based on soil–land use ordination + polygon median P model.

Figure 5.
Modeled topsoil median plant-available P content (mg/kg) based on kriging model. Non-agricultural land uses are excluded from kriging to avoid extrapolation.
Figure 5.
Modeled topsoil median plant-available P content (mg/kg) based on kriging model. Non-agricultural land uses are excluded from kriging to avoid extrapolation.

Figure 6.
Standardized variable importance score of factors in the bagging model.

Figure 7.
Modeled topsoil median plant-available P content (mg/kg) based on the bagging model.

Figure 8.
Hybrid model of topsoil median plant-available P content (mg/kg) based on the bagging model and soil–land use polygon median P values if available for agricultural land, and the ordination model for natural vegetation-covered areas.
Figure 8.
Hybrid model of topsoil median plant-available P content (mg/kg) based on the bagging model and soil–land use polygon median P values if available for agricultural land, and the ordination model for natural vegetation-covered areas.


Table 1.
Ordination model validation results.
| Model | MAE | RMSE | R2 | Explanation |
|---|---|---|---|---|
| Ordination vs. P | 42.9 | 66.8 | 0.15 | Soil–land use ordination model results validated against measured P samples (all P samples used for validation). |
| Ordination vs. poly MedP | 36.7 | 56.5 | 0.2 | Soil–land use ordination model results validated against polygon median P values (all P samples used for validation). |
| Ordination vs. P 2021 | 46.2 | 73.4 | 0.17 | Soil–land use ordination model results validated against P data collected in 2021 and not used for model building. |
| Ordination + polygon MedP vs. P 2021 | 34.5 | 57.4 | 0.48 | Soil–land use ordination model values replaced with soil–land use polygon median P values in polygons where P sample points measured in 2005–2020 exist, and evaluated against P samples collected in 2021. |
Table 2.
Validation of kriging model results.
| Model | MAE | RMSE | R2 | Explanation |
|---|---|---|---|---|
| Kriging1 CV vs. P | 27.1 | 43.1 | 0.63 | Kriging1 (all sample points used for interpolation) cross-validation (by leaving-one-out method). |
| Kriging1 vs. P | 19.8 | 31.3 | 0.82 | Kriging1 (all sample points used for interpolation) validation against all measured P samples (same points that were used for interpolation). |
| Kriging1 vs. poly MedP | 15.6 | 25.1 | 0.84 | Kriging1 (all sample points used for interpolation) validation against polygon median P values (if there was only one P sample in the polygon, then the same values were used for interpolation). |
| Kriging1 vs. P 2021 | 30.7 | 49.6 | 0.59 | Kriging1 (all sample points used for interpolation) validation against P samples (collected in 2021) not used for model building. |
| Kriging2_test vs. P | 27.7 | 44.4 | 0.62 | Kriging2 model (surface was interpolated by using only 75% of P sample data) validated against test data (25% of data). Only 25% of data were used to calculate these metrics. |
| Kriging2_test vs. poly MedP | 19.7 | 31.6 | 0.75 | Kriging2 model (surface was interpolated by using only 75% of P sample data) validated against test data (25% of data) polygon median P values. Only 25% of data were used to calculate these metrics. |
Table 3.
Validation results of the bagging model.
| Model | MAE | RMSE | R2 | Explanation |
|---|---|---|---|---|
| Bagging vs. P | 30.4 | 47.3 | 0.56 | Bagging prediction results validated against measured P values (all P samples used for validation). |
| Bagging vs. poly MedP | 20.9 | 33.6 | 0.72 | Bagging prediction results validated against polygon median P values (all P samples used for validation). |
| Bagging vs. P 2021 | 36.9 | 58.3 | 0.43 | Bagging prediction results validated against P samples collected in 2021 and not used for model building. |
| Bagging + polygon MedP vs. P 2021 | 34.3 | 56.5 | 0.49 | Bagging model values replaced with soil–land use polygon median P values in polygons where P sample points measured in 2005–2020 exist, and evaluated against P samples collected in 2021. |
| Bagging_test vs. P | 30.8 | 48.6 | 0.54 | Bagging model results validated on test dataset (25% of data not used for model building). |
| Bagging 10-fold CV | 31.3 | 49.1 | 0.52 | Bagging model performance evaluation by using a random 10-fold cross-validation dataset (75% of data used for model building). |
| Bagging OOB error | 50.3 | Bagging model performance evaluation by using out-of-bag (OOB) samples. From the training dataset (75% of data) selected randomly for each bagged predictor, approximately 63% of data were used for training, and the remaining 37% were used as OOB samples. | ||
| Poly MedP vs. P | 18.8 | 36.4 | 0.74 | Polygon median P values compared to P values measured in 2005–2020 (polygon median P value was calculated based on the same sample). |
| Poly MedP vs. P2021 | 32.6 | 54.6 | 0.53 | Polygon median P values (calculated based on P sample values in 2005–2020) compared to P values measured in 2021. |
Disclaimer/Publisher’s Note: The statements, opinions and data contained in all publications are solely those of the individual author(s) and contributor(s) and not of MDPI and/or the editor(s). MDPI and/or the editor(s) disclaim responsibility for any injury to people or property resulting from any ideas, methods, instructions or products referred to in the content. |
© 2023 by the authors. Licensee MDPI, Basel, Switzerland. This article is an open access article distributed under the terms and conditions of the Creative Commons Attribution (CC BY) license (https://creativecommons.org/licenses/by/4.0/).
Share and Cite
MDPI and ACS Style
Kull, A.; Kikas, T.; Penu, P.; Kull, A. Modeling Topsoil Phosphorus—From Observation-Based Statistical Approach to Land-Use and Soil-Based High-Resolution Mapping. Agronomy 2023, 13, 1183. https://doi.org/10.3390/agronomy13051183
AMA Style
Kull A, Kikas T, Penu P, Kull A. Modeling Topsoil Phosphorus—From Observation-Based Statistical Approach to Land-Use and Soil-Based High-Resolution Mapping. Agronomy. 2023; 13(5):1183. https://doi.org/10.3390/agronomy13051183
Chicago/Turabian StyleKull, Anne, Tambet Kikas, Priit Penu, and Ain Kull. 2023. "Modeling Topsoil Phosphorus—From Observation-Based Statistical Approach to Land-Use and Soil-Based High-Resolution Mapping" Agronomy 13, no. 5: 1183. https://doi.org/10.3390/agronomy13051183
Note that from the first issue of 2016, this journal uses article numbers instead of page numbers. See further details here.