Article

Effect of Drip Irrigation, N, K, and Zn Coupling on Pn of Densely Cultivated Apple on Dwarf Rootstock in Xinjiang, China

1
School of Water Resources and Hydropower, Xi’an University of Technology, Xi’an 710048, China
2
State Key Laboratory of Eco-Hydraulics in Northwest Arid Region, Xi’an University of Technology, Xi’an 710048, China
*
Author to whom correspondence should be addressed.
Agronomy 2023, 13(4), 1082; https://doi.org/10.3390/agronomy13041082
Submission received: 18 February 2023 / Revised: 6 April 2023 / Accepted: 8 April 2023 / Published: 9 April 2023

Abstract

:
This study aimed to determine the effect of irrigation amount ( W ), nitrogen ( N ), potassium ( K ), and zinc ( Z n ) on the net photosynthetic rate ( P n ) of closely planted apple trees on dwarf rootstocks in arid areas of Xinjiang. Taking the “Royal Gala” apple as the experimental material, a mathematical model for  P n  was established using the principle of four-factor five-level quadratic regression with a general rotation combination design. The results show that: (1) The regression equations reached significant levels (F = 37.06 > F0.01(11.11) = 4.54). (2) The effect of  W N K Z n  on  P n  is significant with relative importance  W  >  N  >  Z n  >  K . (3) The results of single factor analysis showed that with an increase in W, N, K, and Zn P n  exhibits an n-shaped parabolic response. (4) The positive coupling between  W  and  N  is significant, and the positive coupling between  W  and  Z n  is also significant. (5) Analysis of the interaction between sets of three factors revealed that  W N ,  and  Z n  could be combined to best effect, with the maximum value reaching 12.77  μ mol · m 2 · s 1 . Compared with  W × K × Z n  and  W × N × K , the combination of  W × N × Z n  reduces  W  by 9.2% and 6.3%, respectively, which indicates its suitability for use in the dry and water deficient planting environment in Xinjiang. (6) Within the 95% confidence level, when  W  is 258–294.75 mm,  N  is 33.44–39.51  kg / hm 2 K  is 53.82–69.39  kg / hm 2 ,  and  Z n  is 6.46–7.84  kg / hm 2 , the net photosynthetic rate reaches 11  μ mol · m 2 · s 1 .

1. Introduction

Photosynthesis is the basic link between energy absorption, fixation, material transformation, and distribution in terrestrial ecosystems, an important biochemical process of material circulation and energy exchange on the surface, and an important factor affecting crop productivity, providing essential nutrients for crop growth [1,2,3,4]. Under natural conditions, in addition to the plant’s own physiological characteristics, the main factors affecting any change in  P n  (net photosynthetic rate) are the amount of irrigation ( W ) and fertilization ( F t ), but other environmental factors also play a decisive role, which is more obvious in agricultural crops [5,6,7]. Therefore, research into the effect of  W  and  F t  on  P n  has always been a hot research issue globally [8].
As an important crop, apple is widely planted, particularly because of its adaptability to the environment and its high nutritional value [9]. According to recent statistics, China has become the largest apple producer in the world, with the planting area and output accounting for about 50% of the global total, and the export volume of apples also ranks among the top in the world [10,11]. Xinjiang is located in an arid area. In this area there is sufficient sunlight and a large temperature difference between day and night, resulting in conditions that are extremely effective for the accumulation of fruit sugar; it has, therefore, become an important high-quality apple production base in China [12]. As a new type of planting mode, dwarfing rootstock combined with close planting has the advantages of high mechanization potential, early bearing, high quality, and high land utilization rate, and has become an important approach in apple cultivation [13]. However, the development of the apple industry in Xinjiang is seriously restricted by limited rainfall, extensive use of irrigation and fertilizer, and serious salinization of the soil [14,15]. Therefore, it is very important to study how the interaction between irrigation and fertilization affects the physiological characteristics of apples during growth and development, in order to build an effective irrigation and fertilization management model, ensuring the efficient production and sustainable development of dwarf, closely planted apples in arid areas of Xinjiang [16,17,18].
Irrigation and fertilization are important factors affecting crop growth, photosynthetic characteristics, and production efficiency. Controlling the relationship between  W  and  F t  can help to promote crop growth, improve  P n , and enhance crop yield and water and fertilizer use efficiency [19,20,21]. Of these factors,  W  is particularly important with respect to photosynthesis [22]. It has been found that a good soil water environment can promote the opening of leaf stomata, increase the absorption of  C O 2  by leaves, facilitate the transport of photosynthetic products and reduce inhibition of photosynthesis due to an accumulation of photosynthetic products in leaves [23,24]. Therefore, appropriately increasing  W  will promote the  P n  of plant leaves [23,25,26]. Soil water deficit will induce plant roots to produce abscisic acid, which will send inhibition signals to reduce plant growth, with signals being transmitted to the crown through the xylem under the effect of water transmission, there will be the closure of the crown stomata, leading to a reduction in  P n  [27,28,29,30]. Too much  W  will lead to poor soil aeration, and decreased root activity, and will indirectly affect photosynthesis [31]. In addition, the nitrogen concentration in most plant leaves is closely related to carbon fixation via photosynthesis [32,33]. Research shows that increasing  N  can improve the photosynthetic performance of leaves and increase the  P n , thereby promoting the yield and harvest of crops [34]. However excessive nitrogen will reduce the activity of key enzymes in photosynthesis, which is not conducive to the improvement of photosynthetic performance [35,36,37].
Although potassium does not directly participate in the synthesis of important organic substances in plants, it is frequently an activator of enzymes, and thus indirectly participates in important metabolic activity in plants and has a significant effect on  P n  [38,39,40,41]. Topdressing with potassium at the fruit expansion stage can improve  P n  quality and yield [42]. Potassium stress will limit transmission, transformation, and other non-stomatal factors associated with light energy, reduce photosynthetic capacity and cause a decline in biomass accumulation [43,44]. Zinc is an essential trace element for crops and has important nutritional and physiological functions playing a role in stabilizing, regulating, or catalyzing various enzymes [45,46,47]. Increasing  Z n  can enhance leaf photosynthesis and facilitate the transportation of photosynthetic products [48,49]. During the growth of fruit trees, the loss of  Z n  will cause  I A A  synthesis in the plant to cease, and eventually lead to the development of young leaves and stems of the plant being blocked; this is usually referred to as “small leaf disease” and “clump leaf disease” and ultimately affects the photosynthetic ability of leaves [50,51].
In general, the existing research on irrigation and fertilizer regulation has mostly focused on the effects of  W  and  F t  as individual factors or on different fertilizer ratios on plant growth, Research into the combined effects of  W N K Z n , on photosynthesis is relatively rare [18,52,53]. Especially in arid areas, it is very important to study the synergistic effect of irrigation and fertilization. In this study, the apple variety “Royal Gala” on dwarf rootstock closely planted in the arid region of Xinjiang was used as the experimental material, in order to determine the effect of irrigation amount ( W ), nitrogen ( N ), potassium ( K ), and zinc ( Z n ) on net photosynthetic rate ( P n ) of apple trees planted closely with dwarf stocks in arid areas of Xinjiang. The field experiment was carried out using a four-factor five-level quadratic regression general rotation combination design [54,55,56]. The effects of  W N K ,  and  Z n  on  P n  were analyzed in order to provide reference data and effective suggestions for extending drip irrigation and the use of closely planted apples on dwarf rootstock in arid areas of Xinjiang.

2. Materials and Methods

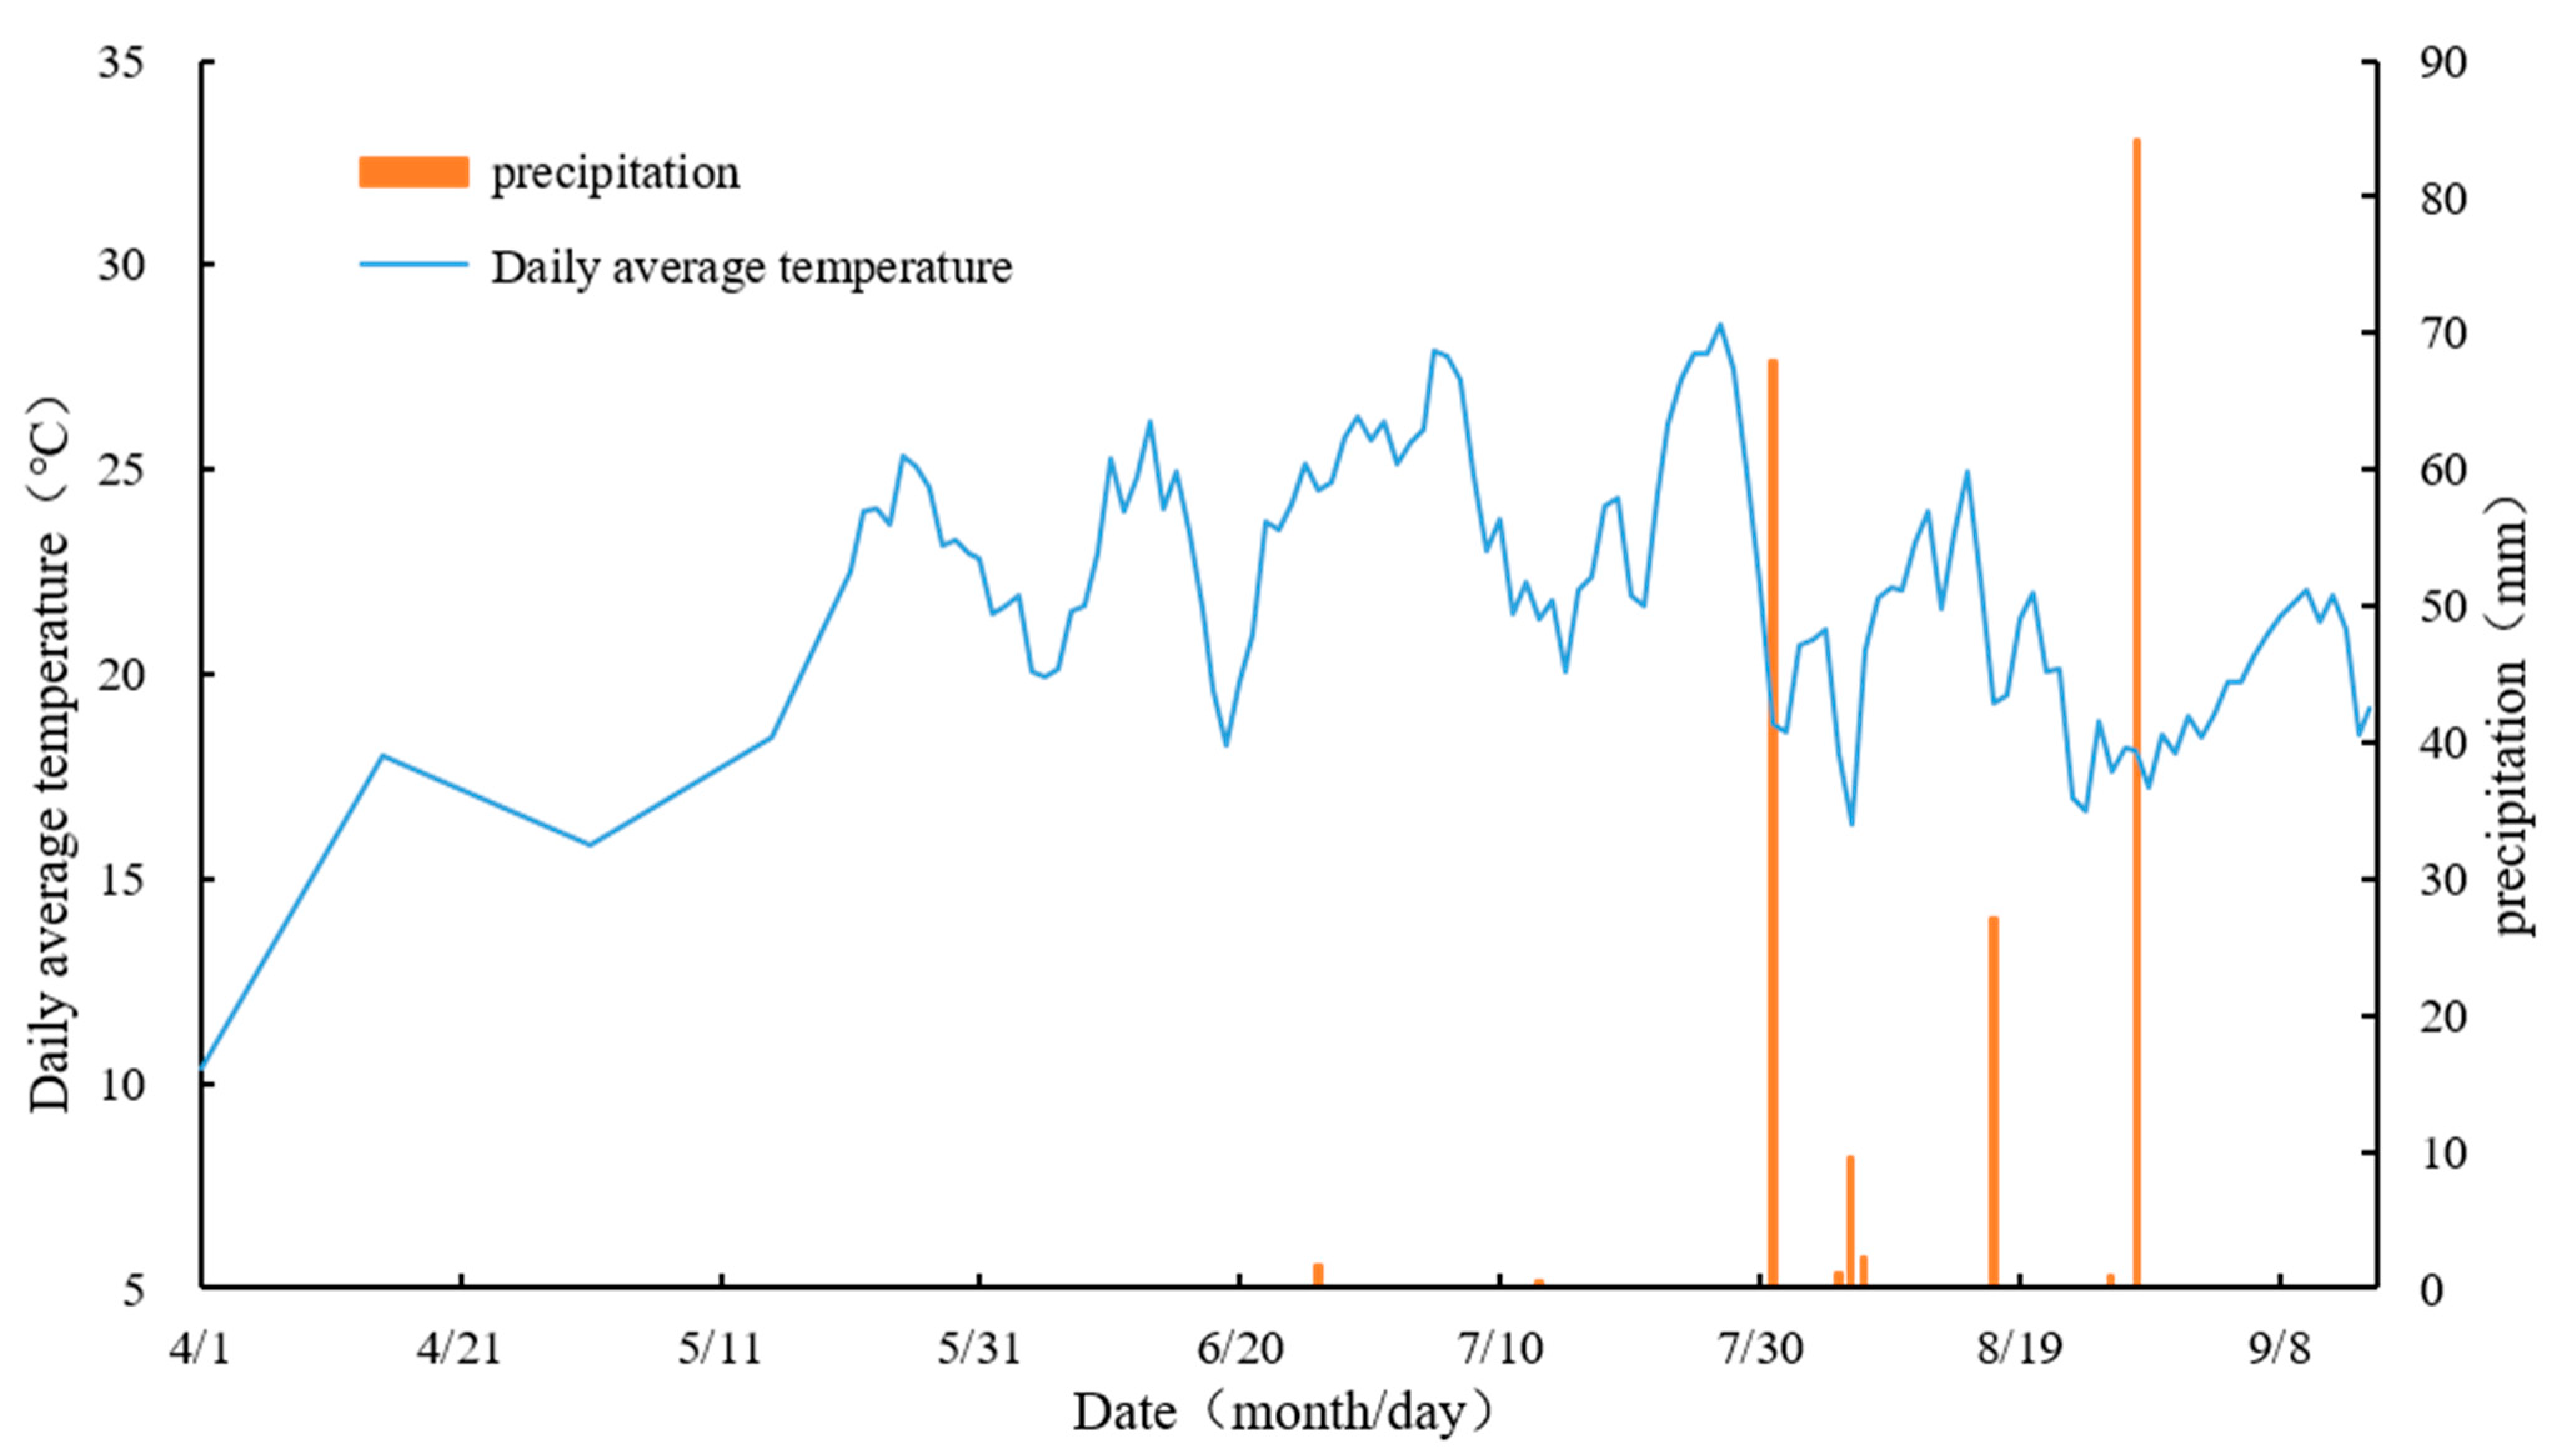
2.1. Overview of the Study Area

The study site is located in the Apple Garden of the 10th Regiment of Alar City, the First Division of the Xinjiang Production and Construction Corps (40°39′14″ N, 81°16′21″ E), which belongs to a typical inland extremely arid climate zone. The annual precipitation is about 150  mm , the average annual temperature is about 11  , the annual evaporation is about 2100  mm , the annual sunshine hours amount to about 2900, the frost-free period is more than 200  days , and the groundwater depth is more than 3  m . The tested soils were sandy with a field holding capacity of 13.7% from 0 to 120  cm  soil depth, an average capacity of 1.52  g / cm 3 , organic matter content of 11.05  g / kg , available phosphorus and available boron contents of 3.20  mg / kg  and 0.60  mg / kg , rapid potassium content of 33  mg / kg , alkaline nitrogen and total nitrogen contents of 10  mg / kg  and 176  mg / kg , ammonium nitrogen and nitrate nitrogen contents of 2.01  mg / kg  and 1.00  mg / kg , respectively,  P H  of 8.71, and  E C  value of 154.60  μ s / cm .

2.2. Experimental Materials

The experiment was conducted from 10 April to 1 September 2022, using “Royal Gala”, an early maturing apple variety. The M195 rootstock was the trees grafted and the apple trees used in the experiment were six years old. The total growth period (TGP) was 150 days. The anthesis fruit setting stage (AFS) was from 20 April to 1 May, the young fruit development stage (YFS) from 2 May to 1 June, the fruit expansion stage (FES) from 2 June to 1 August, and the fruit ripeness stage (FRS) from 2 August to 20 August. The planting density 2850  plants / hm 2 , the plant spacing 1 m, and the row spacing 3.5  m . The drip pipe was set 60  cm  from the ground on each side of the fruit trees; the drop head flow was 4  L / h , the drop head spacing was 50  cm , and the tanks were pressure differential fertilization tanks, which were individually configured for each test plot. The distribution of precipitation and daily average temperature is shown in Figure 1. The total precipitation was 195.3  mm , mainly concentrated in July and August.

2.3. Experimental Design

W N K Z n  were treated as independent variables, and net photosynthetic rate ( P n ) was used as the dependent variable. A total of 23 treatments were set up using a four-factor five-level quadratic regression general rotation combination design (with 50% implementation) [54,55,56]. Each treatment was repeated three times with an experimental plot area of 35 m2 ( 10   m × 3.5   m ) and 10 apple trees were planted in each plot, 690 apple trees in total. The irrigation method is drip irrigation. Irrigation was controlled by a water meter (precision 0.001 m3) during the test. Since 10 April, the water has been irrigated every 4 days, 30 times. Each test plot was equipped with its own fertilizer tank; fertilizer was dissolved before application. During the experiment, nitrogen was supplied in the form of urea (46%), potassium as potassium sulfate ( K 2 S O 4  52%) and zinc as zinc sulfate heptahydrate ( Z n S O 4 , 56%) [57,58]. During the total growth period of the apple, a total of 15 times fertilization. Fertilize every 8 days. The level coding for the four factors is presented in Table 1 [56]. Therein,  z t  represents the coded formula, and  x 1 , x 2 , x 3 , x 4  represent the coded levels of  W N K , and  Z n ,  respectively [56]. Five levels were assigned to  W N K Z n , and the coded levels were  ± r , ± 1 , 0 . The specific irrigation and fertilization regimes were executed in accordance with Table 2.

2.4. Data Acquisition and Analysis

(1)
Sample collection
At the FRS, we randomly selected three apple trees in each test plot and selected three leaves from the middle of each tree, east, south, west, and north for the observation of the net photosynthetic rate, and measured the net photosynthetic rate three times for each leaf. The  P n  was determined using a  L i 6800  portable photosynthesis analysis system (USA) between 9:00 and 11:00 a.m. During the assay, the photometric flux setting was 1800  μ mol · m 2 · s 1 , and the blade temperature was set to 28  .
(2)
Construction of regression models
Based on the quadratic regression general rotation combination design, the regression statistics were generated; with  p  variables, the general formula of the quadratic orthogonal regression model is:
y ^ = b 0 + j = 1 p b j X j + j = 1 p b j j X j 2 + i < j p b i j X i X j
where  y ^ is the response variable; b 0 is a constant term; b j is the coefficient for  X 1 b j j is the quadratic term coefficient; b i j is the interaction term coefficient; p is the number of dependent variables; 1 j p 1 i p and  i < p .
The corresponding regression coefficients were calculated:
b 0 = A i = 1 N a y i + E j = 1 p i = 1 N a x i j 2 y i
b j = e 1 i = 1 N a x i j y i = B j D j
b h j = m c 1 i = 1 h > j N a x i h x i j y i = B h j D h j
b j j = F a G i = 1 N a x i j 2 y i + G j = 1 p i = 1 N a x i j 2 y i + E i = 1 N a y i
where  A , E , N a , F a , G , m c , p  all represent the necessary parameters of quadratic regression general rotation combination design,  x   a n d   y , respectively, represent coding and the corresponding  P n .
(3)
Data processing and mapping
Data were processed using Microsoft Excel 2020 (Microsoft, Redmond, WA, USA); frequency analysis and regression analysis were conducted in SPSS 25.0 (IBM SPSS, Chicago, IL, USA), and one-way effect plots as well as two- and three-factor interac-tion plots were produced by Origin 2021 pro (Northampton, MA, USA) and Matlab 2021 (Natick, MA, USA).

3. Results and Analysis

3.1. Analysis of Pn in Apple Leaves

It can be seen from Table 3 that there are significant differences between T1, T2, T3 T4. The results show that  P n  is affected only by the  W . Significant differences were found between T9, T10, and T17, and the  P n  response is ranked T17 > T10 > T9. It appears that fixing  N K , and  Z n , and changing  W  significantly affects  P n . As  W  increases,  P n  first increases and then decreases. These results indicate that the effect of water fertilizer coupling on  P n  can be altered by changing  W  and  F t  individually. Based on the differences between treatments (T15, T16, T17), it can be seen that an appropriate increase in  Z n  can increase the  P n , when  W N ,  K  are fixed; however, when the application is excessive, it will inhibit  P n . Fixing  N  (T3, T4, T7, T8), P (T1, T3, T5, T7), and Zn (T2, T3, T5, T8), respectively, resulted in the  P n  differing significantly, indicating that each factor has a significant effect on  P n . It follows that an increase in irrigation water and fertilization alone does not necessarily contribute to fruit tree growth, which in turn favors yield increase, and that fruit tree growth can be better enhanced and fruit yield improved only by an appropriate water-to-fertilizer ratio.

3.2. Regression Analysis

With  P n  as the response variable ( y P n ), and  W  ( x 1 ),  N  ( x 2 ),  K  ( x 3 ),  Z n  ( x 4 ) as independent variables, regression models were constructed according to general rotation combination design and Formula (1) [56]. Coefficients values ( b 0 , b j , b j j , b h j ) for the regression model were obtained according to Formulas (2)–(5), respectively [56].
y p n = 12.5517 + 0.6238 x 1 + 0.4011 x 2 + 0.1988 x 3 + 0.2787 x 4 0.5666 x 1 2 0.62 x 2 2 0.4134 x 3 2 0.3955 x 4 2 + 0.2759 x 1 x 2 + 0.0872 x 1 x 3 + 0.2097 x 1 x 4
To determine the validity and reliability of the regression models, the regression coefficients and partial regression coefficients were examined using the F-test. The results are shown in Table 4. Based on these results, a lack-of-fit test was conducted.
F I f = S r / f I f S e / f e = 4.04 < F 0.05 5,6 = 4.36
The lack-of-fit of the regression model was not significant, indicating that the four factors selected in this experiment are meaningful for investigating the change in  P n  of apple and suitable for estimation. For the regression equations, the test was as follows:
F r = S r / f r S R / f R = 37.06 > F 0.01 11,11 = 4.54
This indicates that the relationship between four factors ( W N K Z n ) and  P n  was significant ( P < 0.01 ), and the regression model could well reflect the correlation between independent variables and dependent variables. In addition, Table 4 also shows that partial regression coefficients in the model reached significant or extremely significant levels for all but the  x 1 x 3 ( W · K ) interaction term. Further indicating that the single factor variations in  W N K , and  Z n  were strongly related to the variation in  P n  and there was a strong correlation between the quadratic term and  P n W × N  coupling and  W × Z n  coupling had significant effects on  P n .
(1)
Main effect analysis
Regression models were subjected to principal factor analysis. There was no correlation between the coefficients of the linear term in the model and the linear term coefficients and the interaction term coefficients were also uncorrelated. Therefore, the effect of the linear term for each factor on  P n  was determined by comparing the magnitude of the absolute value of the regression coefficients. The results showed that  W  and  N  had the greatest important effect on  P n , followed by  K  and  Z n , respectively, and that all factors had a positive effect on  P n . It can be concluded from the linear term coefficient that  P n  increased with the increasing application until the maximum tested application was reached.
The quadratic coefficients of  W N K , and  Z n  were all negative. With increasing  W P n  showed first an increasing and then decreasing trend, appearing as an n-shaped parabolic curve. We believe that the optimal solution for  W N K , and  Z n  is at the highest point of the parabolic curve when  P n  reaches its peak value. Because of the correlation between the quadratic term coefficients in the orthogonal trial designs, the absolute value of the coefficients cannot be used directly to compare the magnitude of the quadratic term effect, and therefore, further analysis and validation are required. The coefficients of the  W × N  coupling,  W × K  coupling, and  W × Z n  coupling were all positive, therefore, increasing their combined effect is important to increase net photosynthesis in fruit trees, showing a positive interaction, indicating that the factors can work synergistically to increase  P n .
(2)
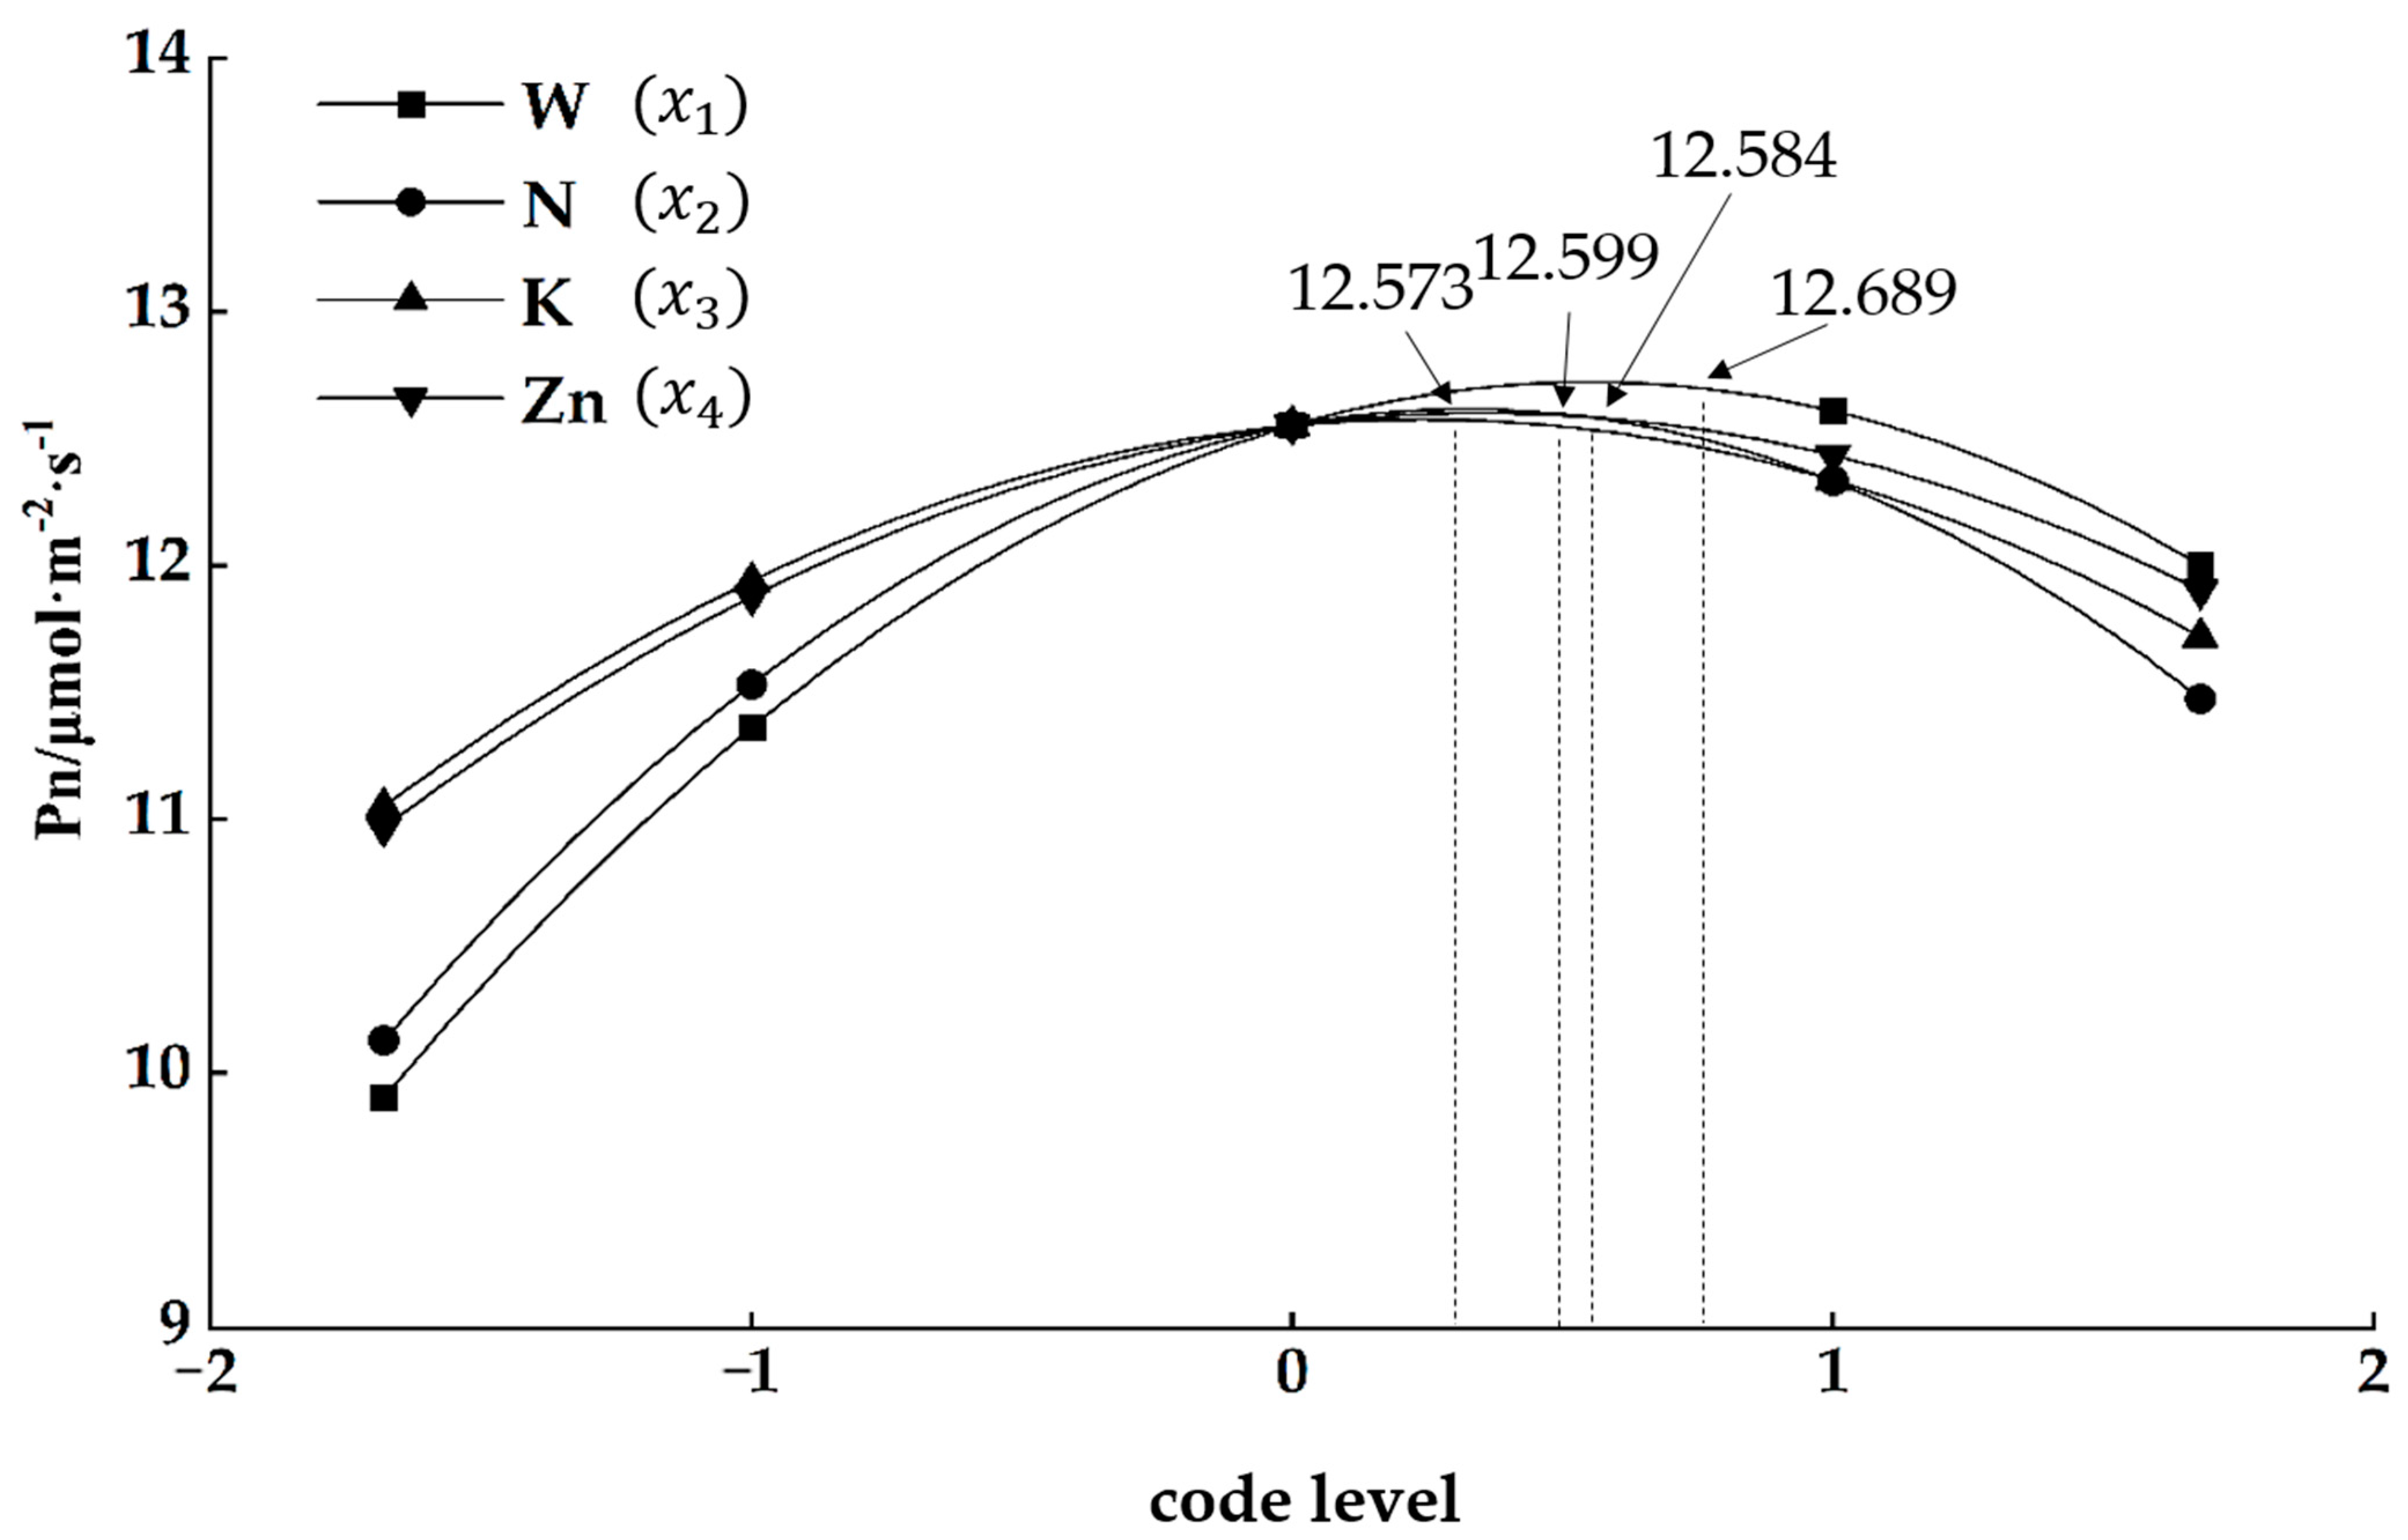
Single factor effects
The “dimension reduction method” was used to simplify the regression model, coding one factor within the range of investigated values, with the remaining factors all set to zero; this approach eliminates the influence of other factors on the analysis of the target factor. A single-factor model was obtained after dimension reduction elimination:
y = 12.5517 + 0.6238 x 1 0.5666 x 1 2
y = 12.5517 + 0.401 x 2 0.62 x 2 2
y = 12.5517 + 0.1988 x 3 0.4134 x 3 2
y = 12.5517 + 0.2787 x 4 0.3955 x 4 2
A single-factor plot of  P n  effects was produced from the single-factor model described above (Figure 2). From calculations, we know that the corresponding  P n  is 9.9  μ mol · m 2 · s 1 , 10.123  μ mol · m 2 · s 1 , 11.047  μ mol · m 2 · s 1 , and 10.964  μ mol · m 2 · s 1 , respectively, when the single-factor minimum coded level for  W N K Z n  is −1.682 within the experimental design. When the coded level increased to 0, the corresponding  P n  values all increased to 12.552  μ mol · m 2 · s 1 . The corresponding  P n  reached its maximum value within the range of the experimental design when the coded values of  W N K , and  Z n  increased to 0.799, 0.493, 0.323, and 0.561, the corresponding applications were 669.775  mm , 123.586  kg / hm 2 , 236.298  kg / hm 2  and 13.815  kg / hm 2 , respectively, and the  P n  values were 12.689 μ mol · m 2 · s 1 , 12.599  μ mol · m 2 · s 1 , 12.573  μ mol · m 2 · s 1  and 12.584  μ mol · m 2 · s 1 . When the coded levels were increased to 1.682, the corresponding  P n  for each factor decreased to 11.998  μ mol · m 2 · s 1 , 11.471  μ mol · m 2 · s 1 , 11.715  μ mol · m 2 · s 1 , and 11.902  μ mol · m 2 · s 1 , respectively. It follows that the maximum  P n  that can be achieved under a single-factor influence and the coded levels of that single factor are not the same, but the trend of change in  P n  is similar under each in-factor influence, showing a gradual increase in  P n  with increasing levels for  W N K , and  Z n  before the maximum levels are reached, after which the  P n  again exhibits a gradually decreasing trend. This indicates that excessive irrigation and fertilization do not promote  P n  but rather have an inhibitory effect.
The sensitivity of individual single factors to  P n  can be judged by examining the curve of the parabola: the tighter the curve, the more sensitive the  P n  is to the factor, and the greater the extent to which it is affected. Figure 2 reveals that the single factor effect plots in relation to  P n  are parabolic and n-shaped, and the sensitivity ranking of the factors to the  P n  is:  W  >  N  >  Z n  > K .
(3)
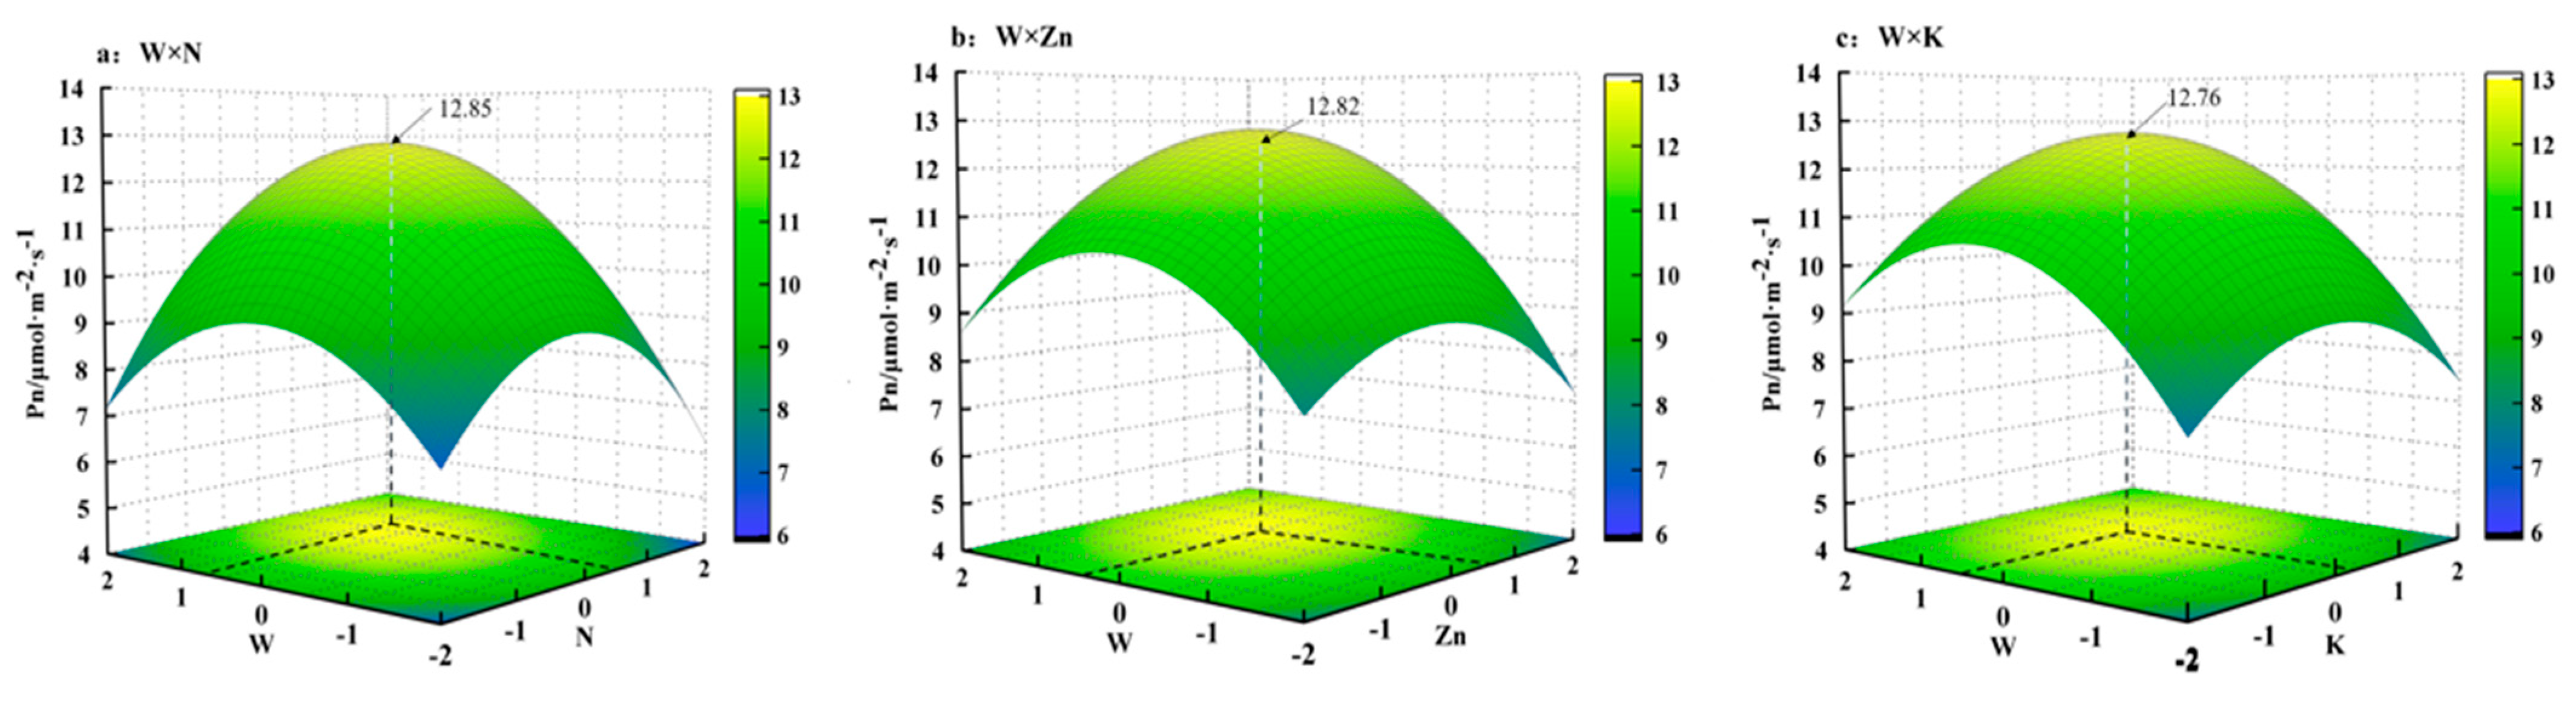
Two-factor interaction effect analysis
Fixing the coding value of two factors to zero, we can model the interaction between the other two factors with respect to the  P n :
y = 12.5517 + 0.6238 x 1 + 0.4011 x 2 0.5666 x 1 2 0.62 x 2 2 + 0.2759 x 1 x 2
y = 12.5517 + 0.6238 x 1 + 0.1988 x 3 0.5666 x 1 2 0.4134 x 3 2 + 0.0872 x 1 x 3
y = 12.5517 + 0.6238 x 1 + 0.2787 x 4 0.5666 x 1 2 0.3955 x 4 2 + 0.2097 x 1 x 4
Figure 3 represents the above models. Figure 3a shows that the effects of  W × N  coupling can be represented as a domed surface. That is, when other factors are set to zero,  P n  changes are represented by a parabola as  W  and  N  increase, and the interaction coefficient is 0.2759. This suggests that the interaction between  W  and  N  promotes  P n . When the coded levels for  W  and  N  were 0.68 and 0.48, respectively,  P n  reached its maximum of 12.85  μ mol · m 2 · s 1 . The actual levels for  W  and  N  were 652  mm  and 123.3  kg / hm 2 , respectively. With a continuing increase in  W  and  N  application,  P n  began to decline.
Figure 3b,c show similar effect trends for the  W × Z n  coupling and  W × K  coupling. With respect to the degree of effect  W > K , Z n . When the  W  was at its middle or upper level, the  P n  remained at a high level. When the  W  was at a lower level, increasing the Zn or K had little effect on  P n . The  W × Z n  coupling produced a maximum  P n  of 12.82  μ mol · m 2 · s 1  with coded levels of 0.64 and 0.52, respectively. The corresponding  W  and  Z n  actual levels are 646 mm and 13.63  kg / hm 2 , respectively. For  W  and  K P n  reached a maximum value of 12.76  μ mol · m 2 · s 1  when the coded levels were 0.56 and 0.28, respectively. The corresponding  W  and  K  actual levels are 634  mm  and 237.6  kg / hm 2 , respectively.
(4)
Three-factor interaction effect analysis
By setting the value of one factor in the fixed model to zero, the combined effect of the other three factors on  P n  can be examined. The model was, thus, used to derive the relationships shown in Figure 4. Figure 4a. reveals the combined effects of  W K , and  Z n  on the  P n : when coded levels reach 0.496, 0.187, and 0.221, respectively, the corresponding actual levels are 624.33  mm , 233.42  kg / hm 2 , and 12.06  kg / hm 2 , and the  P n  reaches 12.75  μ mol · m 2 · s 1 . Figure 4b. reveals that when the  P n  reaches its highest value, 12.77  μ mol · m 2 · s 1 , under the combined effects of  W K , and  Z n , the corresponding coded levels are 0.454, 0.222 and 0.231, respectively, and the actual levels are 618.06  mm , 117.5  kg / hm 2  and 12.31  kg / hm 2 . Compared with Figure 4a, the maximum  P n  exhibits little difference. The  Z n  is increased by 4.5% and the  W  is decreased by 9.2%. Figure 4c shows the combined effect of  W N , and  K  on the  P n . The maximum  P n  is 12.76  μ mol · m 2 · s 1 . When the  P n  reaches its maximum, the coded levels for each factor are 0.483, 0.216, and 0.189 respectively; the corresponding actual levels are 622.51  mm , 117.36  kg / hm 2 , and 233.51  kg / hm 2 . By comparing Figure 4c to Figure 4b, it can be seen that when the  P n  reached its maximum,  W  increased by 6.2%. Contrasting Figure 4a–c, it can be found that the maximum  P n  values for the  W × Z n × K  coupling,  W × K × N  coupling,  W × Z n × N  coupling do not differ much, but in the case of  W × Z n × N  coupling, the  W  required for  P n  to reach a maximum is minimal, which is more suitable for the arid conditions in Xinjiang. This demonstrates that the combined effect of  W × Z n × N  coupling can be manipulated to deliver the best results. This may be related to the content of soil nitrogen and zinc in the experimental plot, or it is possible that under the experimental conditions,  P n  is more sensitive to the changes in  N  and  Z n  in the soil. It may also be that the synergy between soil water and nitrogen and zinc is strong, so the promotion of  P n  is more obvious than other water and fertilizer combinations.
(5)
Optimal combination scheme
The regression model was based on five levels (−1.682, −1, 0, 1, 1.682) and we used simulation optimization and frequency analysis, resulting in 129 irrigation fertilizer couplings with  P n  > 11  μ mol · m 2 · s 1 , accounting for 20.6% of the total test protocol. It can be seen from Table 5 that when the value range for each factor value reflects the 95% confidence interval for  W -coded levels (0.72–0.965),  N -coded levels (0.486–0.756),  K -coded levels (0.196–0.542) and  Z n -coded levels (0.411–0.72), the corresponding actual level of  W N K , and  Z n  are 658–694.75  mm , 123.44–129.51  kg / hm 2 , 233.82–249.39  kg / hm 2  and 13.13–14.54  kg / hm 2 , respectively.

4. Discussion

Photosynthesis is the main driving force affecting dry matter assimilation and organ formation, and it is the basis of plant production [59,60]. Irrigation and fertilizer are important factors affecting crop photosynthesis. Appropriate irrigation and fertilizer management can change the environmental conditions for crop growth and improve crop  P n  [61,62].
This study has shown that soil moisture has a significant positive effect on the  P n ; that is, with increased  W , the  P n  first showed an increasing trend. This is consistent with the research results of Liao et al. [63] and Zhen et al. [64]. An increase in soil moisture promotes the synthesis of hormones and related enzymes in plants, enhances the material transport capacity, and accelerates the transport rate of photosynthetic products, whilst, at the same time, the stomata open, the transpiration rate increases, and the  P n  increases [65,66]. However, when the  W  increases beyond a certain threshold, the  P n  decreases. This may be because too much soil moisture leads to poor soil ventilation and decreased root activity, thus affecting water transmission in plants, and indirectly inhibiting photosynthesis [67].
Under the conditions of this experiment, the effects of the linear term and quadratic term for  N K , and  Z n  reached significant levels. Single-factor analysis showed that, with increased applications,  P n  first increased and then declined. The effects of the three factors on the  P n  were ranked as follows:  N  >  Z n  >  K . This may be because all three factors participate in photosynthesis in plant leaves, but they have different functions. Braun et al. [68] reported that the presence of  K +  helps to maintain the transmembrane proton gradient of chloroplasts and thylakoids under light, keeping the chloroplast interstitium at the higher PH required for  C O 2  assimilation, promoting photophosphorylation and  C O 2  assimilation, and improving the  P n . Makino et al. [37] and Sperling et al. [69] reported that nitrogen is the main element in chloroplasts, present in chloroplasts, proteins, and lamellar membranes and playing an important role in photosynthesis. Zinc is an important component and activator of many enzymes in photosynthesis, and also an essential nutrient for protein, nucleic acid, and sugar metabolism in chloroplasts [70,71,72]. After zinc application, the stomatal resistance of plant leaves decreases, stomatal conductance increases, and the transpiration and  P n  of leaves increases [48,73]. Wang et al. [70,74] also found that a lack of zinc will lead to a decrease in chlorophyll content, stomatal conductance, intercellular concentration, and  P n , and a reduction in plant photosynthetic performance. These research results support, to some extent, the results of our experiment. However, with the continuous application of nitrogen, potassium, and zinc, the effective content of the three elements in the soil increases, and the plants can also absorb a lot, thus promoting their growth. At the same time, due to the initial content of nitrogen, potassium, and zinc in the soil at the experimental site, the three elements reached the optimum threshold at different application rates, and the activities of photosynthesis-related enzymes were reduced due to non-stomatal factors, which further led to the inhibition of plant photosynthesis with increasing application rates [75].
A large number of studies have shown that the coupling of water and fertilizer indirectly affects the photosynthetic rate of plant leaves by expanding leaf area, increasing leaf transpiration rate, increasing stomatal conductance, increasing intracellular water concentration, and reducing intracellular carbon dioxide concentration [76]. Wang et al. [77] showed that water/nitrogen coupling had a significant positive effect on the  P n  of leaves, which is similar to the results of the current study. The reason may be that, with the increase in irrigation and nitrogen fertilizer application, the available nitrogen in the soil increase. Because there is sufficient soil water, the nutrient transport efficiency of the tree is significantly improved. Therefore, the combined effect of the two factors is that the absorption of nitrogen increases, and it is quickly and effectively transported to the leaves, promoting the synthesis of chlorophyll and thus enhancing the  P n  [78,79,80]. With regard to the interaction between  W  and  Z n , we found that when there was limited  W , the  P n  remained at a low level with increasing  Z n , and when there was more  W , the  P n  increased somewhat with the appropriate increase in  Z n . This shows that water plays the dominant role in the interaction between  W  and  Z n . Some studies have shown that the effect of applying zinc fertilizer on plant biomass is better when there is sufficient water. Spraying  Z n S O 4  on the leaf surface can improve the leaf water conditions [48,49]. Water and potassium are important factors affecting plant photosynthesis [81].
Some studies have shown that when soil moisture content increases, soil mechanical resistance decreases, which facilitates the flow of nutrients, thus promoting the absorption of nutrients by the root system. Potassium itself promotes photosynthesis. Studies by Nieves-Cordones have shown that under the condition of insufficient potassium fertilizer supply, excess energy in plants can induce the production of more reactive oxygen species, destroy chloroplast structure, accelerate chloroplast decomposition, and then inhibit photosynthesis. These negative effects caused by potassium deficiency will be improved with the increase in potassium application. The results of this experiment showed that the photosynthetic rate of apple leaves increased significantly with the increase in irrigation amount under the condition of constant potassium application. The results showed that the increase in irrigation water promoted the absorption of potassium in apple trees. There was a significant coupling effect between irrigation amount and potassium application amount, and it had a positive effect on Pn increase. So, the combined effect of  W  and  K  has a somewhat synergistic effect on the  P n  [43,82,83,84].
It should be pointed out that due to spatial and temporal differences in the coupling of irrigation and fertilizer, different regions, soil textures, and soil nutrient contents will lead to different conclusions from such testing. Therefore, in both production and application, we must adapt measures to local conditions and consider the prevailing conditions if we are to gain the best effect.

5. Conclusions

With drip irrigation of closely planted dwarf stock in the arid area of Xinjiang,  W N K , and  Z n , had significant effects on the  P n  of apple trees, but the influence of each factor on the  P n  differed and can be ranked:  W > N > Z n > K . By examining the interaction between irrigation and each of the fertilizers, we found the following ranking of effects:  W × N  >  W × Z n  >  W × K . Applying zinc can improve the Pn, thus enhancing the storage of nutrients in the tree and promoting growth and development, and thus further improving the yield of apple trees.
The test simulation optimization and frequency analysis showed that with  W  in the range 258–294.75  mm N  in the range 33.44–39.51  kg / hm 2 K  in the range 53.82–69.39  kg / hm 2 , and  Z n  in the range 6.46–7.84  kg / hm 2 , within the 95% confidence level, the net photosynthetic rate reaches 11  μ mol · m 2 · s 1 . This is the best irrigation and fertilizer management plan, under the test conditions.
Based on previous research results and our data, we consider that the indicators and methods targeted by this test have certain limitations. More plant physiological growth indicators are required to establish the relationship between irrigation and fertilizer factors and various growth indicators. Finally, the relationship between yield and economic benefits should be established to better serve the development of commercial agriculture and forestry.

Author Contributions

Conceptualization, W.M. and Q.W.; methodology, W.M.; software, X.W.; validation, Y.L., X.G. and K.W.; formal analysis, K.W.; investigation, Q.W.; resources, Y.L.; data curation, X.G.; writing—original draft preparation, X.D.; writing—review and editing, Q.W.; visualization, X.D.; supervision, Q.W.; project administration, Y.L.; funding acquisition, X.G. All authors have read and agreed to the published version of the manuscript.

Funding

This research was funded by the major science and technology projects of the XPCC (2021AA003-2) Special Scientific Research Project of the Education Department of Shaanxi Province (21JK0783).

Institutional Review Board Statement

Not applicable.

Informed Consent Statement

Not applicable.

Data Availability Statement

The data presented in this study are available on request from the corresponding author.

Conflicts of Interest

The authors declare no conflict of interest. The funders had no role in the design of the study; in the collection, analyses, or interpretation of data; in the writing of the manuscript, or in the decision to publish the results.

References

  1. Fatichi, S.; Pappas, C.; Ivanov, V.Y. Modeling plant-water interactions: An ecohydrological overview from the cell to the global scale. Wires Water 2016, 3, 327–368. [Google Scholar] [CrossRef]
  2. Tracy, L.; Silvère, V.C. Speedy stomata, Photosynthesis and plant water use efficiency. New Phytol. 2019, 221, 93–98. [Google Scholar]
  3. Han, H.; Yang, H.; Ma, X.; Feng, J.; Li, X.; Tissue, D.T. Seasonal maintenance of leaf level carbon balance facilitated by thermal acclimation of leaf respiration but not photosynthesis in three angiosperm species. Environ. Exp. Bot. 2022, 195, 104781. [Google Scholar] [CrossRef]
  4. Retta, M.; Ho, Q.T.; Yin, X.; Verboven, P.; Berghuijs, H.N.C.; Struik, P.C.; Nicolaï, B.M. A two-dimensional microscale model of gas exchange during photosynthesis in maize (Zea mays L.) leaves. Plant Sci. 2016, 246, 37–51. [Google Scholar] [CrossRef]
  5. Luo, C.; Wang, R.; Li, C.; Zheng, C.; Dou, X. Photosynthetic characteristics, soil nutrients, and their interspecific competitions in an apple–soybean alley cropping system subjected to different drip fertilizer regimes on the Loess Plateau, China. Agric. Water Manag. 2023, 275, 108001. [Google Scholar] [CrossRef]
  6. Hosseinzadeh, S.R.; Amiri, H.; Ismaili, A. Evaluation of photosynthesis, physiological, and biochemical responses of chickpea (Cicer arietinum L. cv. Pirouz) under water deficit stress and use of vermicompost fertilizer. J. Integr. Agric. 2018, 17, 2426–2437. [Google Scholar] [CrossRef]
  7. Chen, Y.H.; Liu, L.; Guo, Q.S.; Zhu, Z.B.; Zhang, L.X. Effects of different water management options and fertilizer supply on photosynthesis, fluorescence parameters and water use efficiency of Prunella vulgaris seedlings. Blological Res. 2016, 49, 1–9. [Google Scholar] [CrossRef]
  8. Zhou, X.; Wang, H.; Chen, Q.; Ren, J. Coupling effects of depth of film-bottomed tillage and amount of irrigation and nitrogen fertilizer on spring wheat yield. Soil Tillage Res. 2007, 94, 251–261. [Google Scholar] [CrossRef]
  9. Hyson, D.A. A comprehensive review of apples and apple components and their relationship to human health. Adv. Nutr. 2011, 2, 408–420. [Google Scholar] [CrossRef]
  10. Wu, Z.; Pan, C. State analysis of apple industry in china. IOP Conf. Ser. Earth Environ. Sci. 2021, 831, 012067. [Google Scholar] [CrossRef]
  11. Zhou, J.; Zhao, D.; Chen, Y.; Kang, G.; Cheng, C. Analysis of apple producing area changes in China. J. Fruit Sci. 2021, 38, 372–384. [Google Scholar]
  12. Cao, H.; Wang, H.B.; Li, Y.; Hamani, A.K.M.; Zhang, N.; Wang, X.P.; Gao, Y. Evapotranspiration partition and dual crop coefficients in apple orchard with dwarf stocks and dense planting in arid region, aksu oasis, southern Xinjiang. Agriculture 2021, 11, 1167. [Google Scholar] [CrossRef]
  13. Ferree, D.C.; Warrington, I.J.; Ebrary, I. Apples: Botany, Production and Uses; CABI Publishing: New York, NY, USA, 2003. [Google Scholar]
  14. Heping, Z.; Mingyi, Z.; Qi, Z.; Zhifeng, S.; Jinlong, C. Analysis of agricultural irrigation water-using coefficient in Xinjiang arid region. Trans. Chin. Soc. Agric. Eng. 2013, 29, 100–107. [Google Scholar]
  15. Thevs, N.; Peng, H.; Rozi, A.; Zerbe, S.; Abdusalih, N. Water allocation and water consumption of irrigated agriculture and natural vegetation in the Aksu-Tarim river basin, Xinjiang, China. J. Arid. Environ. 2015, 112, 87–97. [Google Scholar] [CrossRef]
  16. Fereres, E.; Soriano, M.A. Deficit irrigation for reducing agricultural water use. J. Exp. Bot. 2007, 58, 147–159. [Google Scholar] [CrossRef]
  17. Wang, H.; Wu, L.; Cheng, M.; Fan, J.; Zhang, F.; Zou, Y.; Chau, H.W.; Gao, Z.; Wang, X. Coupling effects of water and fertilizer on yield, water and fertilizer use efficiency of drip-fertigated cotton in northern Xinjiang, China. Field Crops Res. 2018, 219, 169–179. [Google Scholar] [CrossRef]
  18. Liu, X.; Li, M.; Guo, P.; Zhang, Z. Optimization of water and fertilizer coupling system based on rice grain quality. Agric. Water Manag. 2019, 221, 34–46. [Google Scholar] [CrossRef]
  19. Cao, X.S.; Feng, Y.Y.; Li, H.P.; Zheng, H.X.; Wang, J.; Tong, C.F. Effects of subsurface drip irrigation on water consumption and yields of alfalfa under different water and fertilizer conditions. J. Sens. 2021, 2021, 6617437. [Google Scholar] [CrossRef]
  20. Yang, L.; Lin, Y.; Kong, J.; Yu, Y.; He, Q.; Su, Y.; Li, J.; Qiu, Q. Effects of fertilization and dry-season irrigation on the timber production and carbon storage in subtropical Eucalyptus plantations. Ind. Crops Prod. 2023, 192, 116143. [Google Scholar] [CrossRef]
  21. Yu, F.; Truong, T.V.; He, Q.; Hua, L.; Su, Y.; Li, J.Y. Dry Season Irrigation Promotes Leaf Growth in Eucalyptus urophylla x E. grandis under Fertilization. Forest 2019, 10, 67. [Google Scholar] [CrossRef]
  22. Man, J.; Wang, D.; White, P.J.; Yu, Z. The length of micro-sprinkling hoses delivering supplemental irrigation affects photosynthesis and dry matter production of winter wheat. Field Crops Res. 2014, 168, 65–74. [Google Scholar] [CrossRef]
  23. Chen, X.; Qi, Z.; Gui, D.; Sima, M.W.; Zeng, F.; Li, L.; Li, X.; Feng, S. Responses of cotton photosynthesis and growth to a new irrigation control method under deficit irrigation. Field Crops Res. 2022, 275, 108373. [Google Scholar] [CrossRef]
  24. Shareef, M.; Gui, D.; Zeng, F.; Waqas, M.; Zhang, B.; Iqbal, H. Water productivity, growth, and physiological assessment of deficit irrigated cotton on hyperarid desert-oases in northwest China. Agric. Water Manag. 2018, 206, 1–10. [Google Scholar] [CrossRef]
  25. Zhao, W.; Liu, L.; Shen, Q.; Yang, J.; Wu, J. Effects of water stress on photosynthesis, yield, and water use efficiency in winter wheat. Water 2020, 12, 2127. [Google Scholar] [CrossRef]
  26. Han, K.; Liu, Y.; Zhang, J.; Hao, Y.; Wang, W.; Zhang, L. Effects of water stress on photosynthesis and chlorophyll fluorescence of the sugar beet. J. Agric. Resour. Environ. 2015, 32, 463–470. [Google Scholar]
  27. Abdalla, M.; Carminati, A.; Cai, G.C.; Javaux, M.; Ahmed, M.A. Stomatal closure of tomato under drought is driven by an increase in soil-root hydraulic resistance. Plant Cell Environ. 2021, 44, 425–431. [Google Scholar] [CrossRef]
  28. Ma, S.-C.; Zhang, W.-Q.; Duan, A.-W.; Wang, T.-C. Effects of controlling soil moisture regime based on root-sourced signal characteristics on yield formation and water use efficiency of winter wheat. Agric. Water Manag. 2019, 221, 486–492. [Google Scholar] [CrossRef]
  29. Dos Santos, M.R.; Neves, B.R.; da Silva, B.L.; Donato, S.L.R. Yield, water use efficiency and physiological characteristic of ‘Tommy Atkins’ mango under partial rootzone drying irrigation system. J. Water Resour. Prot. 2015, 7, 1029–1037. [Google Scholar] [CrossRef]
  30. Wei, Z.; Abdelhakim, L.O.A.; Fang, L.; Peng, X.; Liu, J.; Liu, F. Elevated CO2 effect on the response of stomatal control and water use efficiency in amaranth and maize plants to progressive drought stress. Agric. Water Manag. 2022, 266, 107609. [Google Scholar] [CrossRef]
  31. Liu, R.-X.; Zhou, Z.-G.; Guo, W.-Q.; Chen, B.-L.; Oosterhuis, D.M. Effects of N fertilization on root development and activity of water-stressed cotton (Gossypium hirsutum L.) plants. Agric. Water Manag. 2008, 95, 1261–1270. [Google Scholar] [CrossRef]
  32. Heerema, R.J.; VanLeeuwen, D.; Hilaire, R.S.; Gutschick, V.P.; Cook, B. Leaf photosynthesis in nitrogen-starved ‘Western’ pecan is lower on fruiting shoots than non-fruiting shoots during kernel fill. J. Am. Soc. Hortic. Sci. 2014, 139, 267–274. [Google Scholar] [CrossRef]
  33. Sun, J.; Feng, Z.; Leakey, A.D.B.; Zhu, X.; Bernacchi, C.J.; Ort, D.R. Inconsistency of mesophyll conductance estimate causes the inconsistency for the estimates of maximum rate of Rubisco carboxylation among the linear, rectangular and non-rectangular hyperbola biochemical models of leaf photosynthesis—A case study of CO2 enrichment and leaf aging effects in soybean. Plant Sci. 2014, 226, 49–60. [Google Scholar]
  34. Mu, X.; Chen, Y. The physiological response of photosynthesis to nitrogen deficiency. Plant Physiol. Biochem. 2021, 158, 76–82. [Google Scholar] [CrossRef]
  35. Zhu, X.-G.; de Sturler, E.; Long, S.P. Optimizing the distribution of resources between enzymes of carbon metabolism can dramatically increase photosynthetic rate: A numerical simulation using an evolutionary algorithm. Plant Physiol. 2007, 145, 513–526. [Google Scholar] [CrossRef]
  36. Vos, J.; van der Putten, P.E.L. Effect of nitrogen supply on leaf growth, leaf nitrogen economy and photosynthetic capacity in potato. Field Crops Res. 1998, 59, 63–72. [Google Scholar] [CrossRef]
  37. Makino, A.; Suzuki, Y.; Ishiyama, K. Enhancing photosynthesis and yield in rice with improved N use efficiency. Plant Sci. 2022, 325, 111475. [Google Scholar] [CrossRef]
  38. Xu, X.X.; Du, X.; Wang, F.; Sha, J.C.; Chen, Q.; Tian, G.; Zhu, Z.L.; Ge, S.F.; Jiang, Y.M. Effects of potassium levels on plant growth, accumulation and distribution of carbon, and nitrate metabolism in apple dwarf rootstock seedlings. Front. Plant Sci. 2020, 11, 904. [Google Scholar] [CrossRef]
  39. Ju, F.; Pang, J.; Huo, Y.; Zhu, J.; Yu, K.; Sun, L.; Loka, D.A.; Hu, W.; Zhou, Z.; Wang, S.; et al. Potassium application alleviates the negative effects of salt stress on cotton (Gossypium hirsutum L.) yield by improving the ionic homeostasis, photosynthetic capacity and carbohydrate metabolism of the leaf subtending the cotton boll. Field Crops Res. 2021, 272, 108288. [Google Scholar] [CrossRef]
  40. Degl’Innocenti, E.; Hafsi, C.; Guidi, L.; Navari-Izzo, F. The effect of salinity on photosynthetic activity in potassium-deficient barley species. J. Plant Physiol. 2009, 166, 1968–1981. [Google Scholar] [CrossRef]
  41. Kanai, S.; Moghaieb, R.E.; El-Shemy, H.A.; Panigrahi, R.; Mohapatra, P.K.; Ito, J.; Nguyen, N.T.; Saneoka, H.; Fujita, K. Potassium deficiency affects water status and photosynthetic rate of the vegetative sink in green house tomato prior to its effects on source activity. Plant Sci. 2011, 180, 368–374. [Google Scholar] [CrossRef]
  42. Hiratsuka, S.; Suzuki, M.; Nishimura, H.; Nada, K. Fruit photosynthesis in Satsuma mandarin. Plant Sci. 2015, 241, 65–69. [Google Scholar] [CrossRef] [PubMed]
  43. Srinivasarao, C.; Shanker, A.K.; Kundu, S.; Reddy, S. Chlorophyll fluorescence induction kinetics and yield responses in rainfed crops with variable potassium nutrition in K deficient semi-arid alfisols. J. Photochem. Photobiol. B Biol. 2016, 160, 86–95. [Google Scholar] [CrossRef] [PubMed]
  44. Zahoor, R.; Zhao, W.; Dong, H.; Snider, J.L.; Abid, M.; Iqbal, B.; Zhou, Z. Potassium improves photosynthetic tolerance to and recovery from episodic drought stress in functional leaves of cotton (Gossypium hirsutum L.). Plant Physiol. Biochem. 2017, 119, 21–32. [Google Scholar] [CrossRef] [PubMed]
  45. Sturikova, H.; Krystofova, O.; Huska, D.; Adam, V. Zinc, zinc nanoparticles and plants. J. Hazard. Mater. 2018, 349, 101–110. [Google Scholar] [CrossRef]
  46. Siddiqui, Z.A.; Parveen, A.; Ahmad, L.; Hashem, A. Effects of graphene oxide and zinc oxide nanoparticles on growth, chlorophyll, carotenoids, proline contents and diseases of carrot. Sci. Hortic. 2019, 249, 374–382. [Google Scholar] [CrossRef]
  47. Barman, H.; Das, S.K.; Roy, A. Zinc in soil environment for plant health and management strategy. Univers. J. Agric. Res. 2018, 6, 149–154. [Google Scholar] [CrossRef]
  48. Rossi, L.; Fedenia, L.N.; Sharifan, H.; Ma, X.; Lombardini, L. Effects of foliar application of zinc sulfate and zinc nanoparticles in coffee (Coffea arabica L.) plants. Plant Physiol. Biochem. 2019, 135, 160–166. [Google Scholar] [CrossRef]
  49. Davarpanah, S.; Tehranifar, A.; Davarynejad, G.; Abadía, J.; Khorasani, R. Effects of foliar applications of zinc and boron nano-fertilizers on pomegranate (Punica granatum cv. Ardestani) fruit yield and quality. Sci. Hortic. 2016, 210, 57–64. [Google Scholar] [CrossRef]
  50. Fu, C.; Li, M.; Zhang, Y.; Zhang, Y.; Yan, Y.; Wang, Y.A. Morphology, photosynthesis, and internal structure alterations in field apple leaves under hidden and acute zinc deficiency. Sci. Hortic. 2015, 193, 47–54. [Google Scholar] [CrossRef]
  51. Mahdi, A.; Abdul, S. Effect of plant regulators, zinc nanoparticles and irrigation intervals on leaf content of endogenous hormones and nutrients in sunflower (Helianthus Annuus L.). Plant Arch. 2020, 20, 2720–2725. [Google Scholar]
  52. Zand-Parsa, S.; Sepaskhah, A.R. Optimal applied water and nitrogen for corn. Agric. Water Manag. 2001, 52, 73–85. [Google Scholar] [CrossRef]
  53. Rahman, S.M.; Khalil, M.I.; Ahmed, M.F. Yield-water relations and nitrogen utilization by wheat in salt-affected soils of Bangladesh. Agric. Water Manag. 1995, 28, 49–56. [Google Scholar] [CrossRef]
  54. Yanjun, Y.; Jinhua, Z.; Linjing, C.; Aiqing, J.; Pingyi, G. Effects of fertilizer levels and plant density on chlorophyll contents, its fluorescence and grain yield of setaria italica. Int. J. Agric. Biol. 2018, 20, 737–744. [Google Scholar]
  55. Liu, Z.; Zhong, H.; Weize, R.; Yang, Z.; Chen, Y.; Liu, Y. Effects of combined application of N, P and K on yield and active ingredient content of rhizome of Paris polyphylla var.chinensis. Chin. Tradit. Herb. Drugs 2019, 50, 6103–6113. [Google Scholar]
  56. Ren, L.Q. Regression Design and Optimization; Science Press: Beijing, China, 2009. [Google Scholar]
  57. Du, Q.; Li, J.; Pan, T.; Chang, Y.; Liu, G.; Wang, P.; Zheng, G. The compound effects of water and fertilizer on yield and quality of tomato under drip irrigation. Agric. Res. Arid. Areas 2015, 33, 10–17. [Google Scholar]
  58. Tuiwong, P.; Lordkaew, S.; Prom-u-thai, C. Improving Grain Zinc Concentration in Wetland and Upland Rice Varieties Grown under Waterlogged and Well-Drained Soils by Applying Zinc Fertilizer. Agronomy 2021, 11, 554. [Google Scholar] [CrossRef]
  59. Wang, C.; She, H.Z.; Liu, X.B.; Hu, D.; Ruan, R.W. Effects of fertilization on leaf photosynthetic characteristics and grain yield in tartary buckwheat Yunqiao1. Photosynth. Int. J. Photosynth. Res. 2017, 55, 77–84. [Google Scholar] [CrossRef]
  60. Chhaya; Yadav, B.; Jogawat, A.; Gnanasekaran, P.; Kumari, P.; Lakra, N.; Lal, S.K.; Pawar, J.; Narayan, O.P. An overview of recent advancement in phytohormones-mediated stress management and drought tolerance in crop plants. Plant Gene 2021, 25, 100264. [Google Scholar] [CrossRef]
  61. Dong, Z.; Zhang, X.; Li, J.; Zhang, C.; Wei, T.; Yang, Z.; Cai, T.; Zhang, P.; Ding, R.; Jia, Z. Photosynthetic characteristics and grain yield of winter wheat (Triticum aestivum L.) in response to fertilizer, precipitation, and soil water storage before sowing under the ridge and furrow system: A path analysis. Agric. For. Meteorol. 2019, 272, 12–19. [Google Scholar] [CrossRef]
  62. Liu, Y.; Yang, H.S.; Li, Y.F.; Yan, H.J.; Li, J.S. Modeling the effects of plastic film mulching on irrigated maize yield and water use efficiency in sub-humid Northeast China. Int. J. Agric. Biol. Eng. 2017, 10, 69–84. [Google Scholar]
  63. Liao, Z.; Zeng, H.; Fan, J.; Lai, Z.; Zhang, C.; Zhang, F.; Wang, H.; Cheng, M.; Guo, J.; Li, Z.; et al. Effects of plant density, nitrogen rate and supplemental irrigation on photosynthesis, root growth, seed yield and water-nitrogen use efficiency of soybean under ridge-furrow plastic mulching. Agric. Water Manag. 2022, 268, 107688. [Google Scholar] [CrossRef]
  64. Zhen, X.; Zhang, Q.; Sanz-Saez, A.; Chen, C.Y.; Dang, P.M.; Batchelor, W.D. Simulating drought tolerance of peanut varieties by maintaining photosynthesis under water deficit. Field Crops Res. 2022, 287, 108650. [Google Scholar] [CrossRef]
  65. Dos Santos, M.R.; Donato, S.L.R.; Coelho, E.F.; Cotrim, P.R.; De Castro, I.N. Irrigation deficit strategies on physiological and productive parameters of ‘Tommy Atkins’ mango. Rev. Caatinga 2016, 29, 173–182. [Google Scholar] [CrossRef]
  66. Bhusal, N.; Kim, H.S.; Han, S.-G.; Yoon, T.-M. Photosynthetic traits and plant–water relations of two apple cultivars grown as bi-leader trees under long-term waterlogging conditions. Environ. Exp. Bot. 2020, 176, 104111. [Google Scholar] [CrossRef]
  67. Chen, H.; Qualls, R.G.; Blank, R.R. Effect of soil flooding on photosynthesis, carbohydrate partitioning and nutrient uptake in the invasive exotic Lepidium latifolium. Aquat. Bot. 2005, 82, 250–268. [Google Scholar] [CrossRef]
  68. Braun, N.A.; Davis, A.W.; Theg, S.M. The chloroplast tat pathway utilizes the transmembrane electric potential as an energy source. Biophys. J. 2007, 93, 1993–1998. [Google Scholar] [CrossRef]
  69. Sperling, O.; Karunakaran, R.; Erel, R.; Yasuor, H.; Klipcan, L.; Yermiyahu, U. Excessive nitrogen impairs hydraulics, limits photosynthesis, and alters the metabolic composition of almond trees. Plant Physiol. Biochem. 2019, 143, 265–274. [Google Scholar] [CrossRef]
  70. Wang, H.; Jin, J.Y. Photosynthetic rate, chlorophyll fluorescence parameters, and lipid peroxidation of maize leaves as affected by zinc deficiency. Photosynth. -Praha 2006, 2, 41–42. [Google Scholar] [CrossRef]
  71. Tuiwong, P.; Lordkaew, S.; Veeradittakit, J.; Jamjod, S.; Prom-u-thai, C. Efficacy of nitrogen and zinc application at different growth stages on yield, grain zinc, and nitrogen concentration in rice. Agronomy 2022, 12, 2093. [Google Scholar] [CrossRef]
  72. Niyigaba, E.; Twizerimana, A.; Mugenzi, I.; Ngnadong, W.A.; Ye, Y.P.; Wu, B.M.; Hai, J.B. Winter wheat grain quality, zinc and iron concentration affected by a combined foliar spray of zinc and iron fertilizers. Agronomy 2019, 9, 250. [Google Scholar] [CrossRef]
  73. Rahman, N.; Schoenau, J. Bioavailability, Speciation, and crop responses to copper, zinc, and boron fertilization in South-Central saskatchewan soil. Agronomy 2022, 12, 1837. [Google Scholar] [CrossRef]
  74. Wang, H.; Jin, J.; Zhou, W. Effect of zinc application on physiological response of maize to different soil moisture regimes. Plant Nutr. Fertitizer Sci. 2004, 10, 367–373. [Google Scholar]
  75. Li, J.; Zhou, Y.; Lu, Z.; Cong, R.; Li, X.; Ren, T.; Lu, J. The effects of combined nitrogen and potassium application on photosynthesis and nitrogen allocation in photosynthetic organs of winter oilseed rape (Brassica napus L.) silique wall. J. Plant Nutr. Fertitizer 2022, 28, 869–879. [Google Scholar]
  76. Zhang, P.; Dong, T.; Jin, H.; Pei, D.; Pervaiz, T.; Ren, Y.; Jia, H.; Fang, J. Analysis of photosynthetic ability and related physiological traits in nodal leaves of grape. Sci. Hortic. 2022, 304, 111251. [Google Scholar] [CrossRef]
  77. Wang, X.; Cao, H.; Niu, Y.; Shi, X. Influence of water and nitrogen coupling on photosynthesis characteristic of pear-jujube tree. J. Irrig. Drain. 2012, 31, 53–55. [Google Scholar]
  78. Sun, X.; Chai, Z.; Jiang, P.; Fang, L. Effects on the photosynthetic characteristics and the quality of the apple under the water and nitrogen coupling. Res. Soil Water Conserv. 2010, 17, 271–274. [Google Scholar]
  79. Li, Z.; Zou, H.; Lai, Z.; Zhang, F.; Fan, J. Optimal drip fertigation regimes improved soil micro-environment, root growth and grain yield of spring maize in arid northwest china. Agronomy 2023, 13, 227. [Google Scholar] [CrossRef]
  80. Kaur, A.; Singh, K.B.; Gupta, R.K.; Alataway, A.; Dewidar, A.Z.; Mattar, M.A. Interactive effects of nitrogen application and irrigation on water use, growth and tuber yield of potato under subsurface drip irrigation. Agronomy 2023, 13, 11. [Google Scholar] [CrossRef]
  81. Qu, Z.; Chen, Q.; Feng, H.; Hao, M.; Niu, G.; Liu, Y.; Li, C. Interactive effect of irrigation and blend ratio of controlled release potassium chloride and potassium chloride on greenhouse tomato production in the Yellow River Basin of China. Agric. Water Manag. 2022, 261, 107346. [Google Scholar] [CrossRef]
  82. Ali, M.M.E.; Petropoulos, S.A.; Selim, D.A.F.H.; Elbagory, M.; Othman, M.M.; Omara, A.E.; Mohamed, M.H. Plant growth, yield and quality of potato crop in relation to potassium fertilization. Agronomy 2021, 11, 675. [Google Scholar] [CrossRef]
  83. Kuzin, A.; Solovchenko, A. Essential role of potassium in apple and its implications for management of orchard fertilization. Plants 2021, 10, 2624. [Google Scholar] [CrossRef]
  84. Nieves-Cordones, M.; Ródenas, R.; Lara, A. The combination of K+ deficiency with other environmental stresses: What is the outcome? Physiol. Plant. 2019, 165, 264–276. [Google Scholar] [CrossRef]
Figure 1. Meteorological data.
Agronomy 13 01082 g001
Figure 2. Effect on net photosynthetic rate ( P n ) of irrigation amount ( W ), nitrogen application amount ( N ), potash application amount ( K ), and zinc application amount ( Z n ).
Agronomy 13 01082 g002
Figure 3. Combined effects of pairs of factors ((a):  W × N , (b):  W × Z n , (c):  W > K  ) on net photosynthetic rate ( P n  ).
Agronomy 13 01082 g003
Figure 4. Combined effects of trios of factors ((a):  W × Z n × K , (b):  W × K × N , (c):  W × Z n × N  ) on net photosynthetic rate ( P n  ).
Agronomy 13 01082 g004
Table 1. Factor level code table for the four factors.
  z   ( x t )   z 1     ( W )   z 2     ( N )   z 3     ( K )   z 4     ( Z n )
z 2 j ( r )800.0150.0300.022.5
z 0 j + j (1)700.0135.0270.015.8
z 0 j (0)550.0112.5225.011.3
z 0 j j (−1)400.090.0180.06.7
z 1 j ( r )300.075.0150.00
  j = z 2 j z i j 2 r 148.622.344.66.7
  x j = z j z 0 j / j   x 1 = z 1 550 148.6   x 2 = z 2 112.5 22.5   x 3 = z 3 225 44.6   x 4 = z 4 6.7
Table 2. Irrigation and fertilization regimes.
FactorsStageFactor Levels
−1.682−1011.682
  K
  ( g / 35 cm 3 )
AFS26.2531.5039.2547.2552.50
YFS105.00126.00157.00189.00210.00
FES288.75346.50431.75519.75577.50
FRS105.00126.00157.00189.00210.00
TGP525.00630.00785.00945.001050.00
  N
  ( g / 35 cm 3 )
AFS26.2531.5039.3847.2552.50
YFS131.25157.50196.88236.25262.50
FES105.00126.00157.40189.00210.00
FRS00000
TGP262.50315.00393.75472.50525.00
  W
  ( m 3 / 35 cm 3 )
AFS0.530.700.961.231.40
YFS1.582.102.893.684.20
FES6.308.4011.5514.7016.80
FRS2.102.803.854.905.60
TGP10.5014.0019.2524.5028.00
  Z n
  ( g / 35 cm 3 )
AFS07.1017.5027.9035.00
YFS07.1017.5027.9035.00
FES07.1017.5027.9035.00
FRS00000
TGP021.3052.4583.70105.00
Note: TGP represents the total growth period of the apple tree, AFS represents the anthesis fruit setting stage of the apple tree, YFS represents the young fruit development stage of the apple tree, FES represents the fruit expansion stage of the apple tree, FRS represents the fruit ripeness stage of the apple tree.
Table 3. Net photosynthetic rate ( P n  ) change for different treatment.
No.Factor CodeImplementation   P n   ( μ mol · m 2 · s 1 )
  x 1   x 2   x 3   x 4   W
(mm)
  N
(kg/hm2)
  K
(kg/hm2)
  Z n
(kg/hm2)
T11111700135.027015.82512.960 a
T211−1−1700135.01806.67511.226 ef
T31−11−170090.02706.67510.428 hi
T41−1−1170090.018015.82510.797 gh
T5−111−1400135.02706.67510.227 ij
T6−11−11400135.018015.82510.106 ij
T7−1−11140090.027015.82510.062 ij
T8−1−1−1−140090.01806.6759.517 k
T9−1.682000300112.522511.2509.900 jk
T101.682000800112.522511.25011.692 d
T110−1.6820055075.022511.25010.119 ij
T1201.68200550150.022511.25011.168 efg
T1300−1.6820550112.515011.25011.025 ef
T14001.6820550112.530011.25011.431 de
T15000−1.682550112.5225010.897 fg
T160001.682550112.522522.50011.659 d
T170000550112.522511.25012.733 ab
T180000550112.5225750.00012.580 bc
T190000550112.5225750.00012.643 abc
T200000550112.5225750.00012.752 ab
T210000550112.5225750.00012.677 ab
T220000550112.5225750.00012.265 c
T230000550112.5225750.00012.575 bc
Note:  P n  is the net photosynthetic rate. T1–T23, respectively, represent 23 treatments set up in the experiment.  P n  is expressed in average values, and different letters indicate significant difference at  p < 0.05 .
Table 4. Analysis of variance for the regression relationships.
SourceDfSSMSF Valuep Value
  x 1 15.3145.31482.620.0001 **
  x 2 12.1972.19734.160.0001 **
  x 3 10.5400.5408.390.015 *
  x 4 11.0611.06116.490.002 **
  x 1 2 15.1035.10379.330.0001 **
  x 2 2 16.1096.10994.970.0001 **
  x 3 2 12.7172.71742.230.0001 **
  x 4 2 12.4862.48638.650.0001 **
  x 1 x 2 10.6090.6099.470.011 *
  x 1 x 3 10.0610.0610.950.352
  x 1 x 4 10.3520.3525.470.039 *
Regression11 ( f r )26.225 ( S r )2.384 F r  = 37.060.0001 **
Residual error11 ( f R )0.708 ( S R )0.064
Lack-of-fit5 ( f I f )0.546 ( S I f )0.109 F I f  = 4.040.059
Error6 ( f e )0.162 ( S e )0.027
Sum2226.225
Notes: * indicates significant at the 0.05 level, ** indicates significant at the 0.01 level; SS indicates stdev square, MS is mean square, Df is degree of freedom.
Table 5. Optimization scheme and frequency of target output.
Code   x 1   x 2   x 3   x 4
tftftftf
1.682360.279250.194250.194180.140
1510.395460.357360.279410.318
0390.302490.380390.302410.318
−130.02390.070250.194180.140
−1.682000040.03100
total1291129112911291
Weighted average0.8430.6210.3690.565
95% Confidence interval0.720–0.9650.486–0.7560.196–0.5420.411–0.720
Application rate658.00–694.75 mm123.44–129.51 kg/hm2233.82–249.39 kg/hm213.13–14.54 kg/hm2
Notes: t indicates times, f indicates frequency.
Disclaimer/Publisher’s Note: The statements, opinions and data contained in all publications are solely those of the individual author(s) and contributor(s) and not of MDPI and/or the editor(s). MDPI and/or the editor(s) disclaim responsibility for any injury to people or property resulting from any ideas, methods, instructions or products referred to in the content.

