Article

Multi-Objective Optimization Water–Nitrogen Coupling Zones of Maize under Mulched Drip Irrigation: A Case Study of West Liaohe Plain, China

1
College of Water Conservancy and Civil Engineering, Inner Mongolia Agricultural University, Huhhot 010018, China
2
Farmland Irrigation Research Institute, Chinese Academy of Agricultural Sciences (CAAS), Xinxiang 453002, China
3
High-Efficiency Water-Saving Technical Equipment and Water and Soil Environmental Effects Inner Mongolia Autonomous Region Engineering Research Center, Huhhot 010018, China
*
Author to whom correspondence should be addressed.
Agronomy 2023, 13(2), 486; https://doi.org/10.3390/agronomy13020486
Submission received: 22 December 2022 / Revised: 5 February 2023 / Accepted: 6 February 2023 / Published: 7 February 2023
(This article belongs to the Special Issue Water-Saving in Agriculture: From Soil to Plant)

Abstract

:
The impact of different combinations of water–nitrogen coupling on maize yield and the environment needs investigation. Low, medium, and high levels of irrigation and N application gradients were studied through field experiments to elucidate the suitable water–nitrogen coupling zone for spring maize in the West Liaohe Plain during three hydrological year patterns under drip irrigation with plastic film. The effects of different water–nitrogen couplings on maize yield, water- and nitrogen-use efficiencies (WUE and NUE), and post-harvest soil alkali-hydrolyzable N residues were studied under integrated drip irrigation by varying the application rates of water and fertilizer. A multi-objective optimization of water–nitrogen coupling zones was performed by integrating maize yield, harvest index, WUE, and soil environmental effects. Results show that with an increase in irrigation and N application rate, the residual amount of alkali-hydrolyzable N increased slowly within a certain range. Upon exceeding a certain amount, residual N increased rapidly, and more N entered the soil environment. The NUE of moderate water–nitrogen coupling treatment was high, with lower environmental risk of residual alkali-hydrolyzable N. Moderate irrigation yielded the highest harvest index in the normal hydrological year. Irrigation rate had a higher impact on yield compared to nitrogen application, because of drip irrigation under plastic film. An appropriate irrigation amount results in a higher WUE and the application of N application must be adjusted according to the rainfall in a particular year. This study highlights the need for structuring water–nitrogen coupling zones specifically for different hydrological years.

1. Introduction

Compared to conventional planting in bare land, mulching, drip irrigation, and N fertilization are not only separate manual regulatory factors, but also interact with and influence each other [1]. Drip irrigation under plastic film has become an important agronomic measure in arid areas [2,3], where the sealing by the plastic film blocks the direct exchange of soil water with the outside air, thereby reducing unnecessary evaporation of soil moisture [4,5,6]. This can provide a suitable soil environment for crops, create early sowing conditions, and reduce weed growth [6,7,8,9]. Drip irrigation directly applies water and N fertilizers at the roots of the crops, which can alter the distribution of water, nutrients, and roots in the soil [10], improve water- and nitrogen-use efficiencies (WUE and NUE) [11,12], and mitigate the drop in groundwater level caused by agricultural irrigation and groundwater pollution caused by excessive N application [13,14].
Water and N are the main limiting factors of high crop-yield under drip irrigation with plastic film, and there is a synergistic effect between them [15,16]. N participates in all metabolic processes of plants and plays an important role in their growth and development [17]. An optimal amount of appropriate N fertilizer is beneficial to the synthesis of chlorophyll, promoting plant growth and biomass accumulation [18]. However, the excessive application of N fertilizers can cause fertilizer burn on seedling tips and leaves, and the excessive vegetative growth caused by excessive N application increases unnecessary crop water evaporation and energy consumption, thereby affecting grain growth and reducing yield and quality [19,20]. An increase in N application has largely positive effects on crop growth under conditions of sufficient water and slight water shortage, but under severe water shortage conditions, stomatal conductance will be reduced and photosynthesis will be affected [21]. Excessive N application also increases the concentration of soil nitrate and osmotic pressure of the root system, and reduces the water potential difference between the root system and the soil, which is not conducive to water absorption. As a result, this exacerbates the negative impact of the water deficit on crop yield and reduces WUE [22,23]. The improper application of N fertilizer will have a negative impact on NUE and the environment [24]. Therefore, appropriate water and N inputs are critical to optimizing crop yield and nutrient management.
Liu [25] argued that a reasonable level of water and fertilizer input is key to water–N coupling. By establishing a relationship model between water–nitrogen coupling, yield, and WUE, the study obtained an elliptical “water–nitrogen optimal coupling zone”. Si [26] conducted water–nitrogen coupling experiments on winter wheat over two years and concluded that the interaction of water and N has a positive effect on maize. However, the outcome is not optimized with higher irrigation and N application; instead, there was an optimal ratio of water and N for high yield, WUE, and intrinsic WUE under drip irrigation in the North China Plain. Li [27] studied the effects of water–nitrogen coupling on cotton growth, WUE, NUE, yield, quality, and economic benefits under drip irrigation in northern Xinjiang through two years of field experiments to obtain a multi-objective optimization of water and N management. Furthermore, Wang [28] derived the optimal water and fertilizer application zone for cucumbers grown in a greenhouse through multi-objective optimization and comprehensively considered yield, quality, WUE, and NUE. In recent years, the identification of the optimal water–nitrogen coupling zone for multiple objectives such as high crop yield, WUE, and quality has gained serious attention. There are few reports on the effects of different combinations of water–nitrogen coupling on maize yield, efficient use of water and fertilizer, and the environment under the integrated planting model of drip irrigation with plastic film in different hydrological years. In this study, the West Liaohe Plain was used as the climatic and geographical background to perform field experiments on maize through an integrated planting model using drip irrigation with water and fertilizer under plastic film. This paper proposes the optimal range of water and N application considering multiple objectives (maize yield, efficient use of water and N, and environmental effects) under different hydrological years, thereby providing a theoretical basis for the promotion and application of the integrated planting technology of drip irrigation with water and fertilizer under plastic film.

2. Materials and Methods

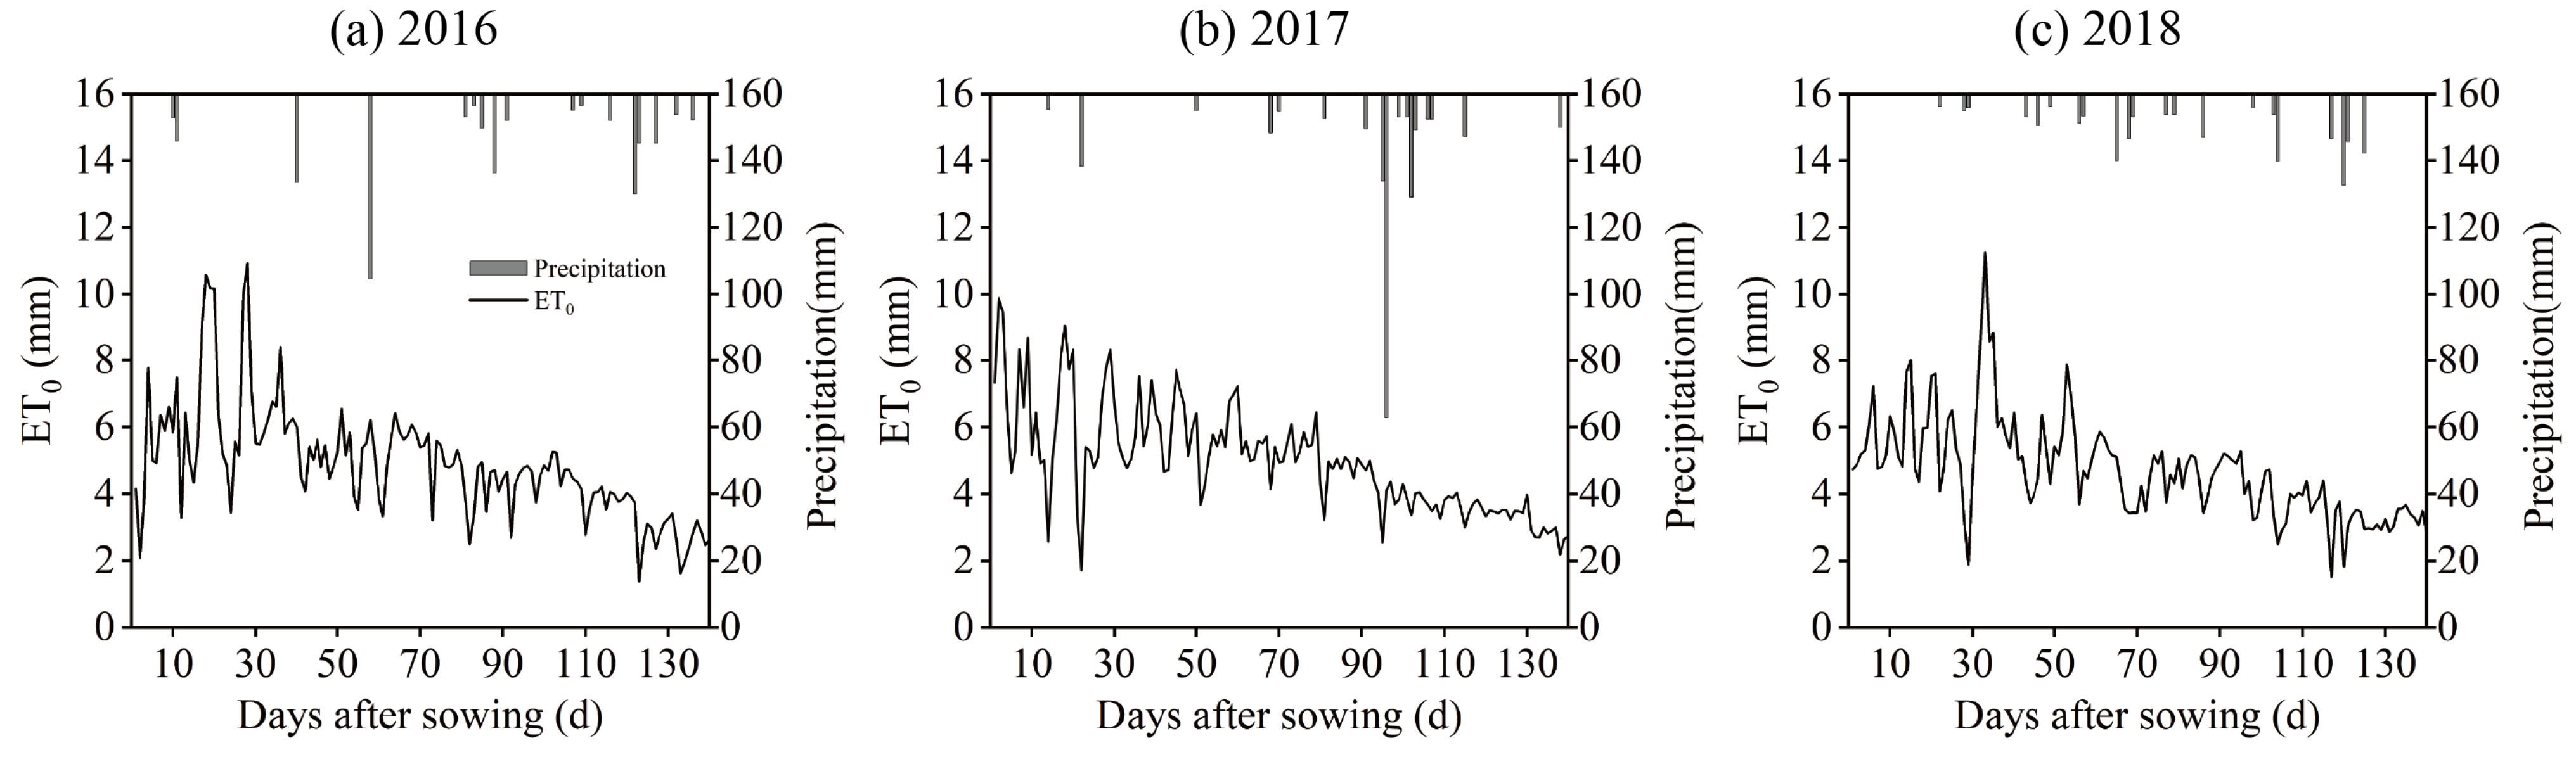
2.1. Overview of the Study Area

The experiments were performed in Yaolinmaodu Town, Horqin Left Middle Banner, Tongliao City, Inner Mongolia. The site is located on the southeastern edge of the Greater Khingan Mountains and on the north bank of the West Liao River, which is the transition zone from the Songliao Plain to the Inner Mongolia Plateau. It has a continental monsoon climate in the northern temperate zone, with an average annual precipitation of 324 mm and evaporation of 2027 mm. According to the rainfall experienced by the region, it is a semi-arid area, with a multi-year average temperature of 5.6 °C and sunshine of 2884.8 h. The daily average temperature is above 5 °C for 188-d, the cumulative temperature above 10 °C is 3048 °C, and the frost-free period is 150–160-d. Rainfall experienced during the whole growth period from sowing to harvest in the experimental years of 2016, 2017, and 2018 were 272.03, 290.42, and 212.56 mm, indicating normal year, partially wet normal year, and dry year, respectively [29]. Soil total N, P, and K contents of the cultivated layer (0–60 cm) are 0.81, 0.77 and 31.48 g/kg, and the physical and chemical properties and basic fertility of the soil are shown in Table 1.

2.2. Field Experiments

The maize (Zea mays L.) cultivated was Nonghua 106, with a growing period of 129 d. The planting mode was drip irrigation under mulch, with one drip irrigation belt ( φ 16 mm) irrigating two rows of maize with wide and narrow rows (35–85 cm) and biased sowing. The distance between adjacent drip irrigation belts was 1.2 m, with the planting unit shown in Figure 1, and the irrigation volume was recorded by a digital rotary-wing water meter. The dosage of phosphate and potassium fertilizers (60 kg/ha), pests, and weeds, and supporting measures of agricultural machinery and agronomy all adopted local conventional methods. The base fertilizer N was applied with integrated agricultural machinery, and the method of topdressing N fertilizer was characterized by fully dissolving urea in the fertilization tank first to obtain an aqueous solution of amide N, and then applying it to the root zone under the mulch with irrigation water through the water pressure difference. The topdressing N fertilizer was applied at the jointing, tasseling, and grouting stage. According to the upper and lower limits of the percentage of soil moisture content in the field water holding capacity, the amount of irrigation water in the experiment was set as low ( W 1 , 60 to 80% before jointing and 55% to 80% after jointing), medium ( W 2 , 65 to 80% before jointing and 60 to 85% after jointing), and high ( W 3 , 75 to 95% before jointing and 70 to 95% after jointing). According to the N application gradient, the amount of N was set as low ( N 1 , 224 kg/ha), moderate ( N 2 , 270 kg/ha), and high ( N 3 , 330 kg/ha), giving a total of nine treatments. The quantities of irrigation and fertilization are shown in Table 2. To prevent side-seepage of water and fertilizer adjacent to the treatment, four drip irrigation belts were set up for each experimental treatment with four planting units with protection rows on both sides. Both monitoring and sampling were performed in middle units. Each plot size was 20 × 4.8 m and each treatment was repeated three times for a total of 27 plots. Maize was planted on 29 April 2016, 27 April 2017, and 27 April 2018, the emergence time was 15 May 2016, 17 May 2017, 20 May 2018; 22 June 2016, 26 June 2017, and 27 June 2018 were the jointing stage; on 13 July 2016, 17 July 2017, 20 July 2018, the tasseling period began; 14 August 2016, 18 August 2017, 18 August 2018 ended the tasseling period; and the maize was harvested on 26 September 2016, 24 September 2017, and 25 September 2018, respectively. Weeding and deworming were performed once during each seedling stage. Intertillage was performed during the jointing stage and deworming was carried out once again during the grain-filling stage.

2.3. Observational Parameters and Methods

The sum of the residual amount of alkali-hydrolyzable N in each soil layer is the total residual amount of alkali-hydrolyzable N in a certain depth of soil. The soil was sampled between maize plants parallel to the drip irrigation belt, with soil samples taken at a depth of 1 m before sowing and after harvest. Soil samples were also taken from a 20-cm layer. Soil alkali-hydrolyzable N was determined by the alkaline hydrolysis diffusion method, and the residual amount of alkali-hydrolyzable N in each soil layer (20 cm) was calculated according to the measured alkali-hydrolyzable N and soil bulk density of each soil layer as follows:
A N i = C · ( D · H · A ) · 10 6
where A N i represents the cumulative amount of alkali-hydrolyzable N in each soil layer ( kg / ha ); C indicates the soil alkali-hydrolyzable N content of the soil layer ( mg / kg ); D indicates the soil bulk density of the soil layer ( kg / m 3 ); H indicates the thickness of the soil layer (0.2 m); A indicates the area per hectare of land (100 × 100 m).
Three maize plants were harvested from each plot, the stalks and ear parts were cut longitudinally, and were then placed in an oven at 105 °C for 30 min. The temperature was adjusted to 80 °C and the plants were dried to a constant weight to measure the weight of above-ground dry matter and grain dry matter of a single plant. It was then converted into above-ground dry matter weight per hectare according to the planting density.
HI (harvest index) is the ratio of economic yield (adapt the formulation to the type of caryopsis fruit—indehiscent) to biological yield when the crops are harvested and is calculated as follows:
H I = d r y w e i g h t o f g r a i n s d r y w e i g h t o f a b o v e g r o u n d b i o m a s s
For yield measurement, three 10-m-long double rows of maize were taken in each plot parallel to the drip irrigation belt.
Monitoring of soil moisture content mainly relied on time-domain reflectometry (TDR) monitoring probes, which were used to penetrate into pre-installed buried monitoring pipes to collect data. The TDR was checked using the soil drilling and drying method, and Figure 1 shows the monitoring position of moisture content by the TDR method. Field climate data were measured by a weather station (HOBO U30 Onset, Onset Computer Corporation, Bourne, MA, USA) installed at the experimental site, and Figure 2 shows evapotranspiration and rainfall.
For the calculation of water balance and WUE, groundwater recharge was ignored as the groundwater depth measured locally was below 6 m. As drip irrigation was used and the surface was flat, surface runoff and deep seepage were ignored, and the calculation was as follows:
E T c = I + P + Δ W
W U E = Y E T c · 10
where E T c is the total water consumption by evapotranspiration (mm), I and P are the depth of irrigation (mm) and effective rainfall (mm), Δ W denotes the difference in water storage (mm) during the calculation period of E T c , WUE is the water-use efficiency ( kg / m 3 ), and Y is the grain yield ( kg / ha ).

2.4. Statistical Analysis

Data processing and illustrations were performed using Adobe Illustrator 2020, Origin 2018, and Excel 2016. The combination of letters W, N, and numbers without special labels represents water and N treatments, and the rest are measurement units or statistical expressions.

3. Results

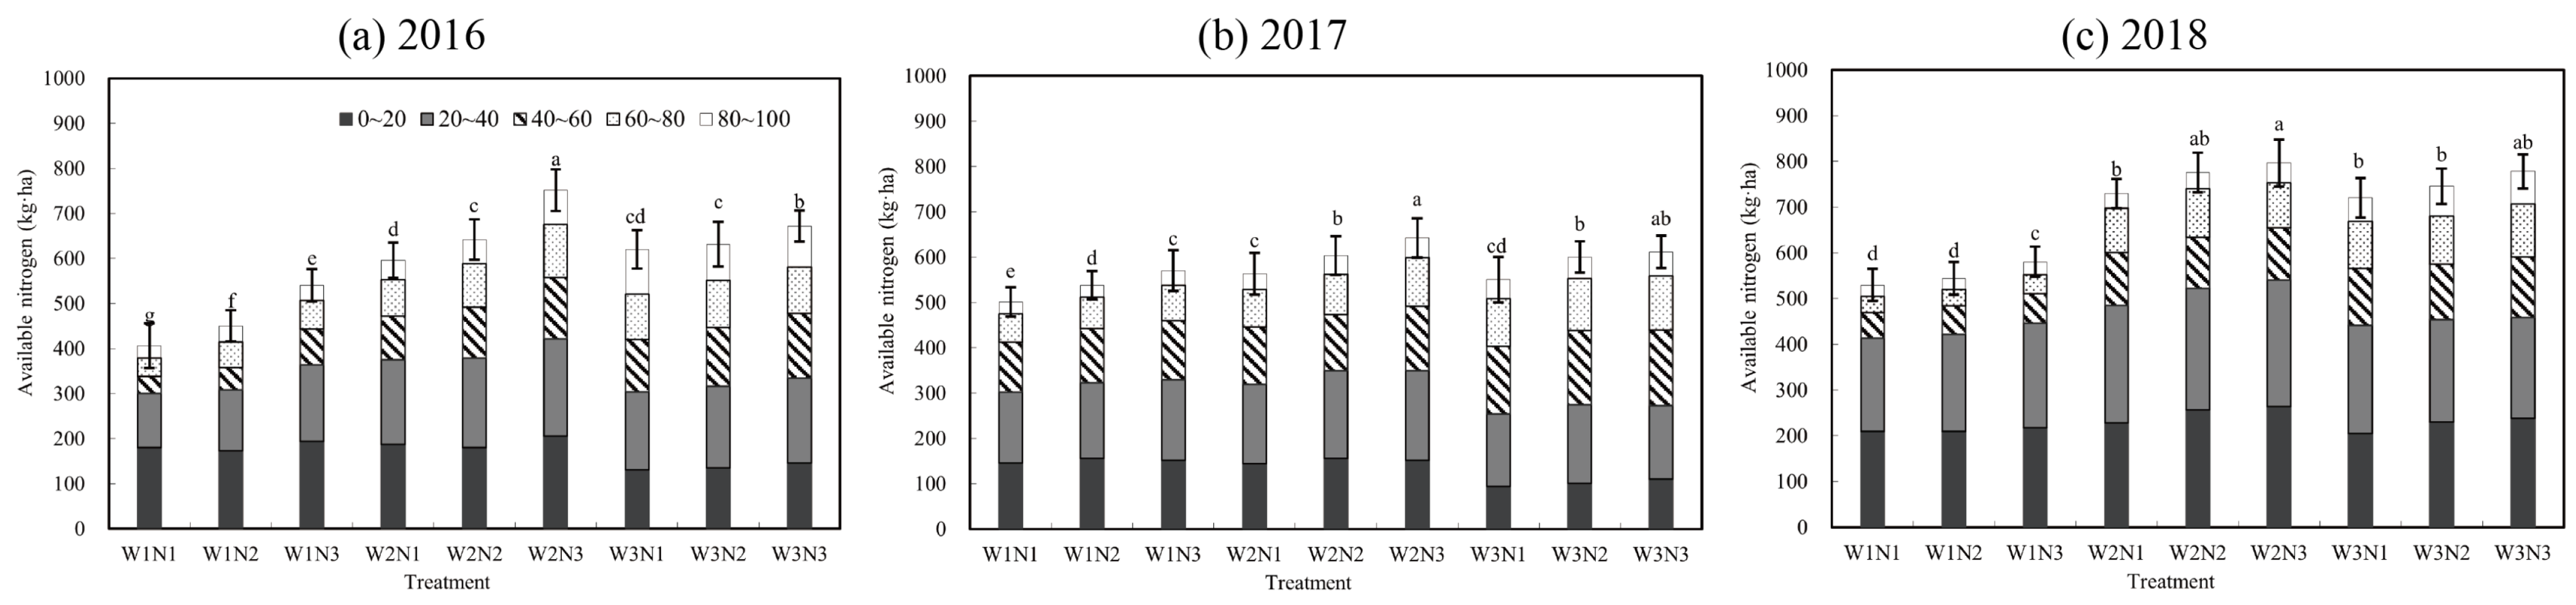
3.1. Soil Alkali-Hydrolyzable Nitrogen Residue after Harvest

Alkali-hydrolyzable N is that which can be directly absorbed by plants, also known as available N. Under each irrigation condition, the 3-year trend of the residual amount of alkali-hydrolyzable N in the 1-m soil layer increased with the increase in the rate of N application (Figure 3). In 2017, owing to the leaching of torrential rain during the grain-filling stage, the differences among the treatments were lower than those in 2016 and 2018. As the amount of N application increased from N 1 to N 2 , the increase in residual amount of alkali-hydrolyzable N was less than the corresponding increase from N 2 to N 3 .
As the volume of irrigation increased, the overall residual amount of alkali-hydrolyzable N first increased and then decreased, with no significant difference in the content of alkali-hydrolyzable N in the 0–40 cm surface soil of W 1 and W 2 treatments. With the increase in irrigation water, N gradually migrated downward, the content of alkali-hydrolyzed N increased in the 40–100 cm soil layer at the W 2 level. The conversion process of N fertilizer into alkali-hydrolyzable N at the W 1 level was inhibited, resulting in less available soil N. The amount of N that “escapes” from the surface soil to the atmospheric environment increased, resulting in low levels of accumulated crop dry matter and yield. Therefore, although the residual amount of alkali-hydrolyzable N in the soil under low water treatment was lower, the combination of low water at various N application rates caused a poor water–nitrogen coupling mode.
When the irrigation level was increased from W 2 to W 3 , the residual amount in the 0–1 m soil layer decreased. The amount of soil N that migrated with water below 1 m increased, and the increased moisture carried soil N into the deeper soil layer. Under the drip irrigation planting mode with the film, the maize root system was mainly distributed in the 0–50 cm layer, and the root system in the soil layer below 1 m can be ignored. N leaching of W 3 leads to an increase in environmental risk. In summary, this study recommends W 2 N 2 as the water–nitrogen coupling treatment with lower environmental risk of residual alkali-hydrolyzable N.

3.2. Aboveground Biomass and Harvest Index

Aboveground dry matter (Figure 4) showed an overall increasing trend with the increase in water and N input. However, the differences among the W 3 N 3 , W 3 N 2 , W 2 N 3 , and W 2 N 2 treatments were not significant. This reflects that high water and N fertilizer supply can yield higher accumulated dry matter, but after water and N were increased to a certain level, dry matter did not increase significantly. The effect of water and N on dry matter was in line with the law of diminishing returns.
Under W 1 , dry matter increased slightly and then decreased significantly with the increase of N fertilizer application. N fertilizer had little effect on dry matter accumulation, and excessive N application hindered dry matter accumulation in maize. Under W 2 , dry matter increased significantly when the amount of N fertilizer increased from N 1 to N 2 , but there was no significant difference between the dry matter of N 3 and N 2 , and the contribution of the N fertilizer applied exceeding N 2 to the accumulation of dry matter was not obvious. Under W 3 , dry matter accumulation gradually increased with the increase of N application rate, but the difference between N 2 and N 3 was not significant. Under N 1 , dry matter accumulation increased significantly with the increase in irrigation level, while under N 2 and N 3 levels, when the irrigation level increased from W 1 to W 2 , the dry matter increased significantly, but there was no significant difference in dry matter between W 3 and W 2 treatments. The effect of N fertilizer was different under different irrigation levels, and the effect of water was different under different fertilization levels, which indicated that there was an interaction between both factors of water and N.
HI can provide feedback on the distribution of photosynthetic products between reproductive organs (grains) and vegetative organs (such as leaves and straw). Under the same level of N application, the HI of W 1 and W 3 were lower than that of W 2 (Figure 4). Under W 1 conditions, maize was under water stress, resulting in a low total dry matter accumulation and grain yield. When the irrigation level was increased to W 2 , the HI increased evidently but after further increasing to W 3 , the HI decreased.
Under the same level of irrigation as during the normal year, as the amount of N applied increased from N 1 to N 2 , the HI slightly increased. A further increase to N 3 caused the HI to decrease, and the excessive N application contributed to more vegetative organs. However, in 2018 (dry year), the HI gradually increased with the increase in fertilization. Under the conditions of this experiment, W 2 N 2 can obtain a higher HI during the normal year while during the dry year, W 2 N 3 can better coordinate the distribution of photosynthetic products.

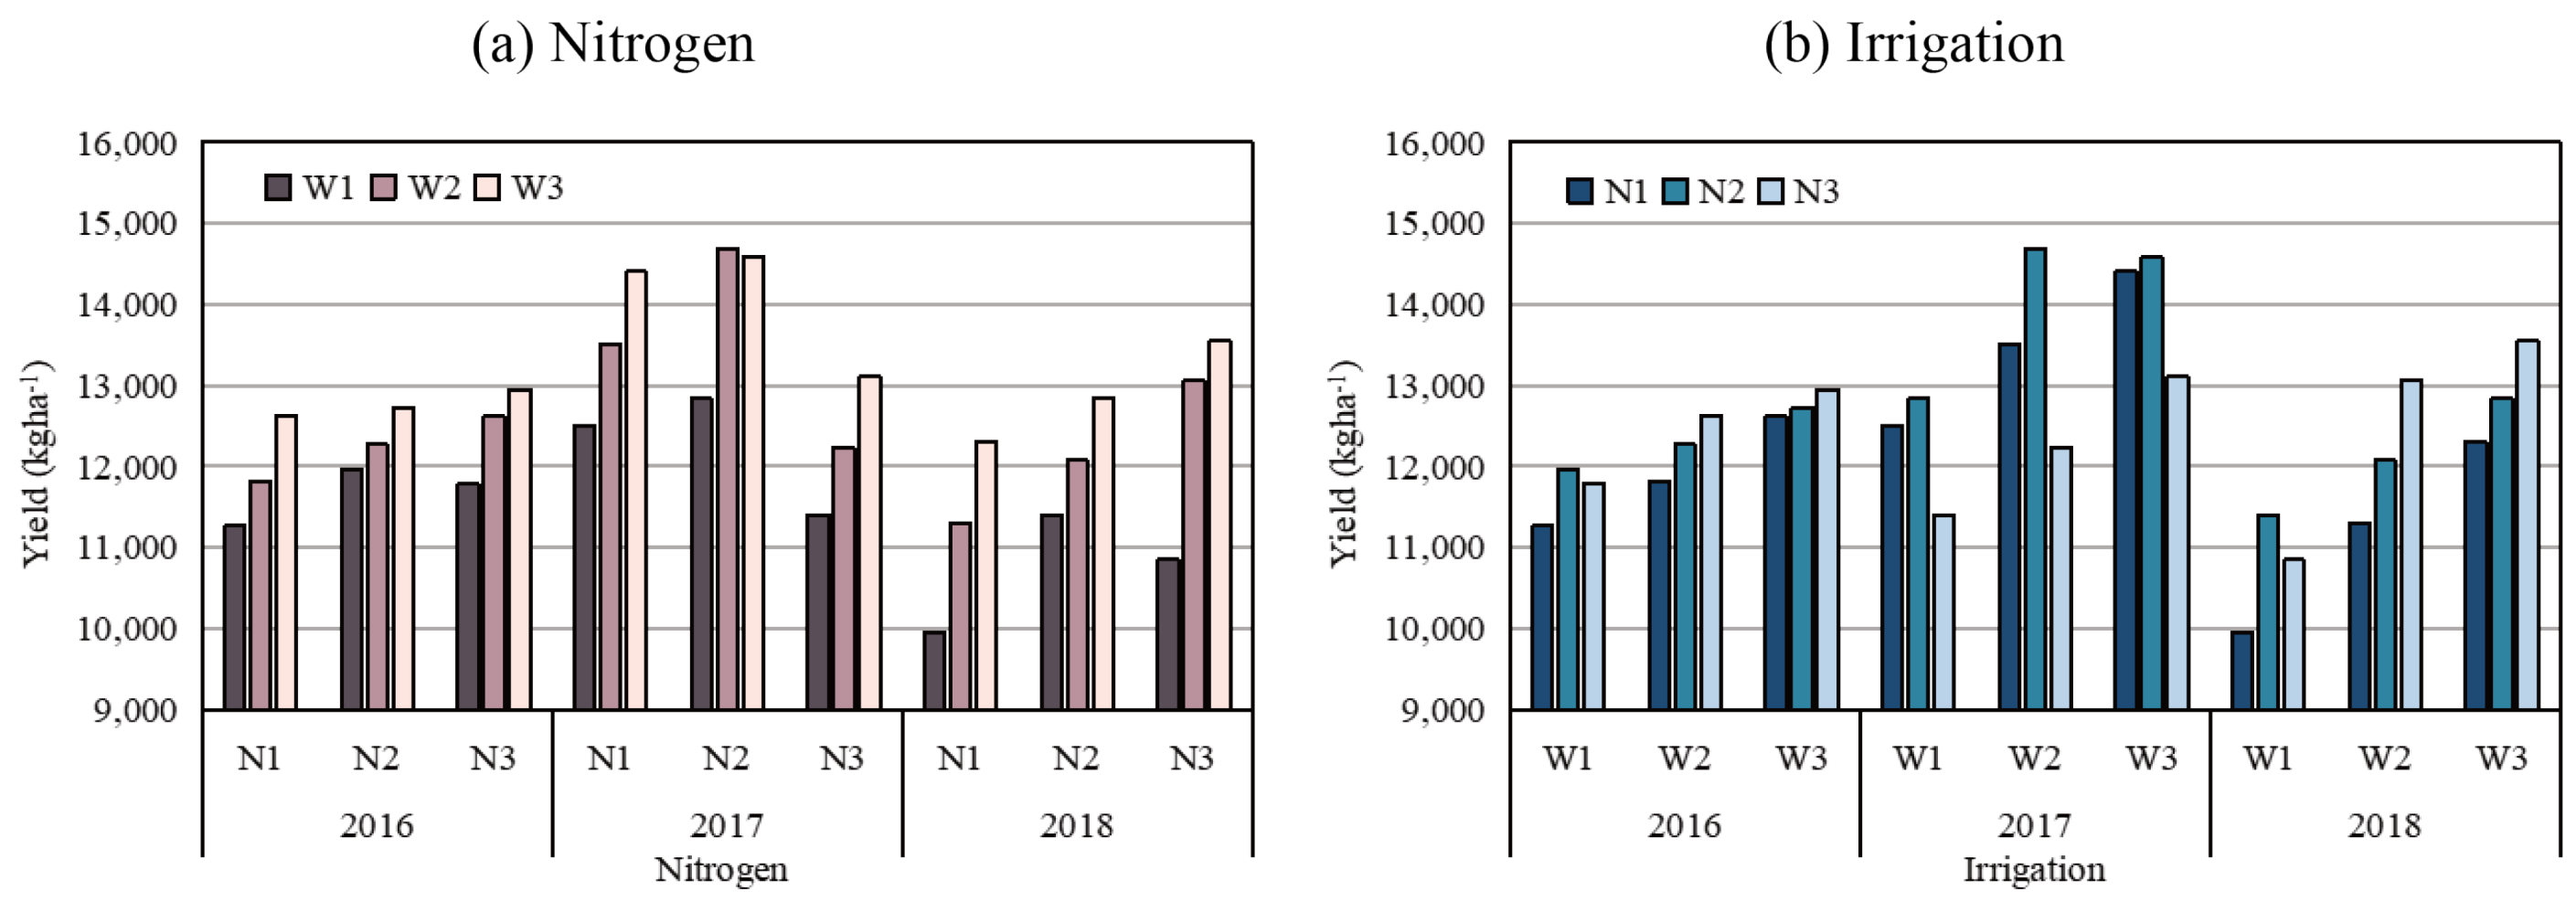
3.3. Yield, Total Water Consumption by Evapotranspiration, and Water-Use Efficiency

For maize yield under different water and N treatments from 2016 to 2018 (Table 3), the yield increased with the increase of water and N input. In 2016 and 2018, the yield of W 3 N 3 was the highest, and there was no significant difference with W 2 N 3 . In 2017, W 2 N 2 had the highest yield, followed by W 3 N 2 . Figure 5a shows that under the three N application levels, the yield gradually increased with the increase in irrigation. The average yield of W 3 increased by 611.09 kg/ha compared with W 2 , and the average yield of W 2 increased by 1068.07 kg/ha compared with W 1 . The yield-increasing effect of W 3 was lesser than that of W 2 . As shown in Figure 5, in 2016 and 2018, under W 1 , the yield increased first, then decreased with the increase in the rate of N application. However, the overall level of yield is low, and the contribution of N fertilizer to yield cannot be effectively manifested. Under W 2 and W 3 , the average yield of N 3 increased by 565.79 kg/ha compared to N 2 , and the average yield of N 2 increased by 466.85 kg/ha compared to N 1 , with the yield gradually increasing as N increases. In 2017, under the three irrigation conditions, the N application rate of N 2 had the highest yield, and water and N contributed to decreasing yield with increasing application.
The WUE ranges of different water and N treatments from 2016 to 2018 were 2.79–2.99, 2.61–3.14, and 2.72–3.22 kg / m 3 , respectively. In the normal year (2016), the WUE of W 2 N 2 treatment was the highest, and in the dry year (2018), the WUE of W 2 N 3 treatment was the highest. Under the same N application, W 2 yielded the highest WUE, while under the same irrigation level in the normal year, N 2 yielded the highest WUE. In the dry year, under W 2 and W 3 , WUE continued to increase as more N was applied, but there was no significant difference between medium and high N treatments. It can be observed that the increase in application of water and N can increase WUE, but a certain amount of excessive application will lead to a decrease or no significant increase in WUE.

3.4. Confidence Interval of Water and Nitrogen Based on Frequency Analysis

Using water and N-production test data, the regression equations of the amount of irrigation and N on maize yield were obtained as follows:
For 2016:
Y = 5066.1194 + 4.9571 W + 3.3716 N + 0.0014 W N 0.001 W 2 0.0051 N 2 , R 2 = 0.952
For 2017:
Y = 40828.4402 + 23.3068 W + 230.2579 N 0.013 W N 0.0045 W 2 0.3886 N 2 , R 2 = 0.927
For 2018:
Y = 10248.1296 + 8.6703 W + 65.6157 N + 0.0046 W N 0.0018 W 2 0.1133 N 2 , R 2 = 0.973
Plotting the equations (Figure 6), the “absolutely” high yields in 2016, 2017, and 2018 occurred in high-water and high-N coupled areas, and in medium-water-medium-N, and high-water-medium-N areas, respectively. Figure 6 shows that under the highest input of water and N, the slope of the curved surface is relatively gentle or declines, indicating a very low ability of water and N input to increase production and weakening their interaction effect. Furthermore, under very high irrigation level, the interaction effect weakened and disappeared with the decrease of N application level. Under the medium to low N application level, the yield increased gradually with the increase in irrigation level, but the increase of N application rate had almost no effect on the yield. When both water and N were at the lowest value, although the yield increased rapidly, the influence process was very short, and the eventual yield was very low.
The units of amount of irrigation and N applied were different, so the deviations in water and N data were first standardized and linearly transformed to make the dimension uniform. The different values of the two factors of water and N were within the interval [0, 1], and according to the fitting of multiple linear regressions, the following regression equations of the amount of irrigation and N on maize yield were obtained:
For 2016:
Y = 11240.9043 + 2161.8605 W + 338.5942 N + 138.51 W N 836.3155 W 2 56.9139 N 2 , R 2 = 0.952
For 2017:
Y = 11715.9889 + 5034.4242 W + 3885.2872 N 1001.9137 W N 2370.9727 W 2 4377.7643 N 2 , R 2 = 0.927
For 2018:
Y = 10028.8820 + 3307.9944 W + 2401.8735 N + 423.2892 W N 1269.2875 W 2 1295.2535 N 2 , R 2 = 0.973
In the [0, 1] interval, the step length of water and N was divided into seven levels (0.00, 0.17, 0.33, 0.50, 0.67, 0.83, and 1.00), forming a total of 49 sets. In 2016 and 2018, there were 32 sets of schemes that exceeded the average yield of the test (122,203.27 and 11,924.98 kg / ha ), accounting for 65.31% of all schemes. In 2017 there were 30 schemes that exceeded the average yield of this experiment by 13,252.17 kg / ha , accounting for 61.22% of all schemes. Frequency analysis of different levels of irrigation and N application (Table 4) was performed, obtaining a probability of 95% for obtaining more than average maize yield with irrigation amount and N application of 2103.50–2253.31 m 3 / ha and 268.34–295.39 kg / ha , 1897.17–2036.09 m 3 / ha and 256.08–277.41 kg / ha , and 2198.62–2348.29 m 3 / ha and 271.64–296.49 kg / ha , in 2016, 2017, and 2018, respectively.

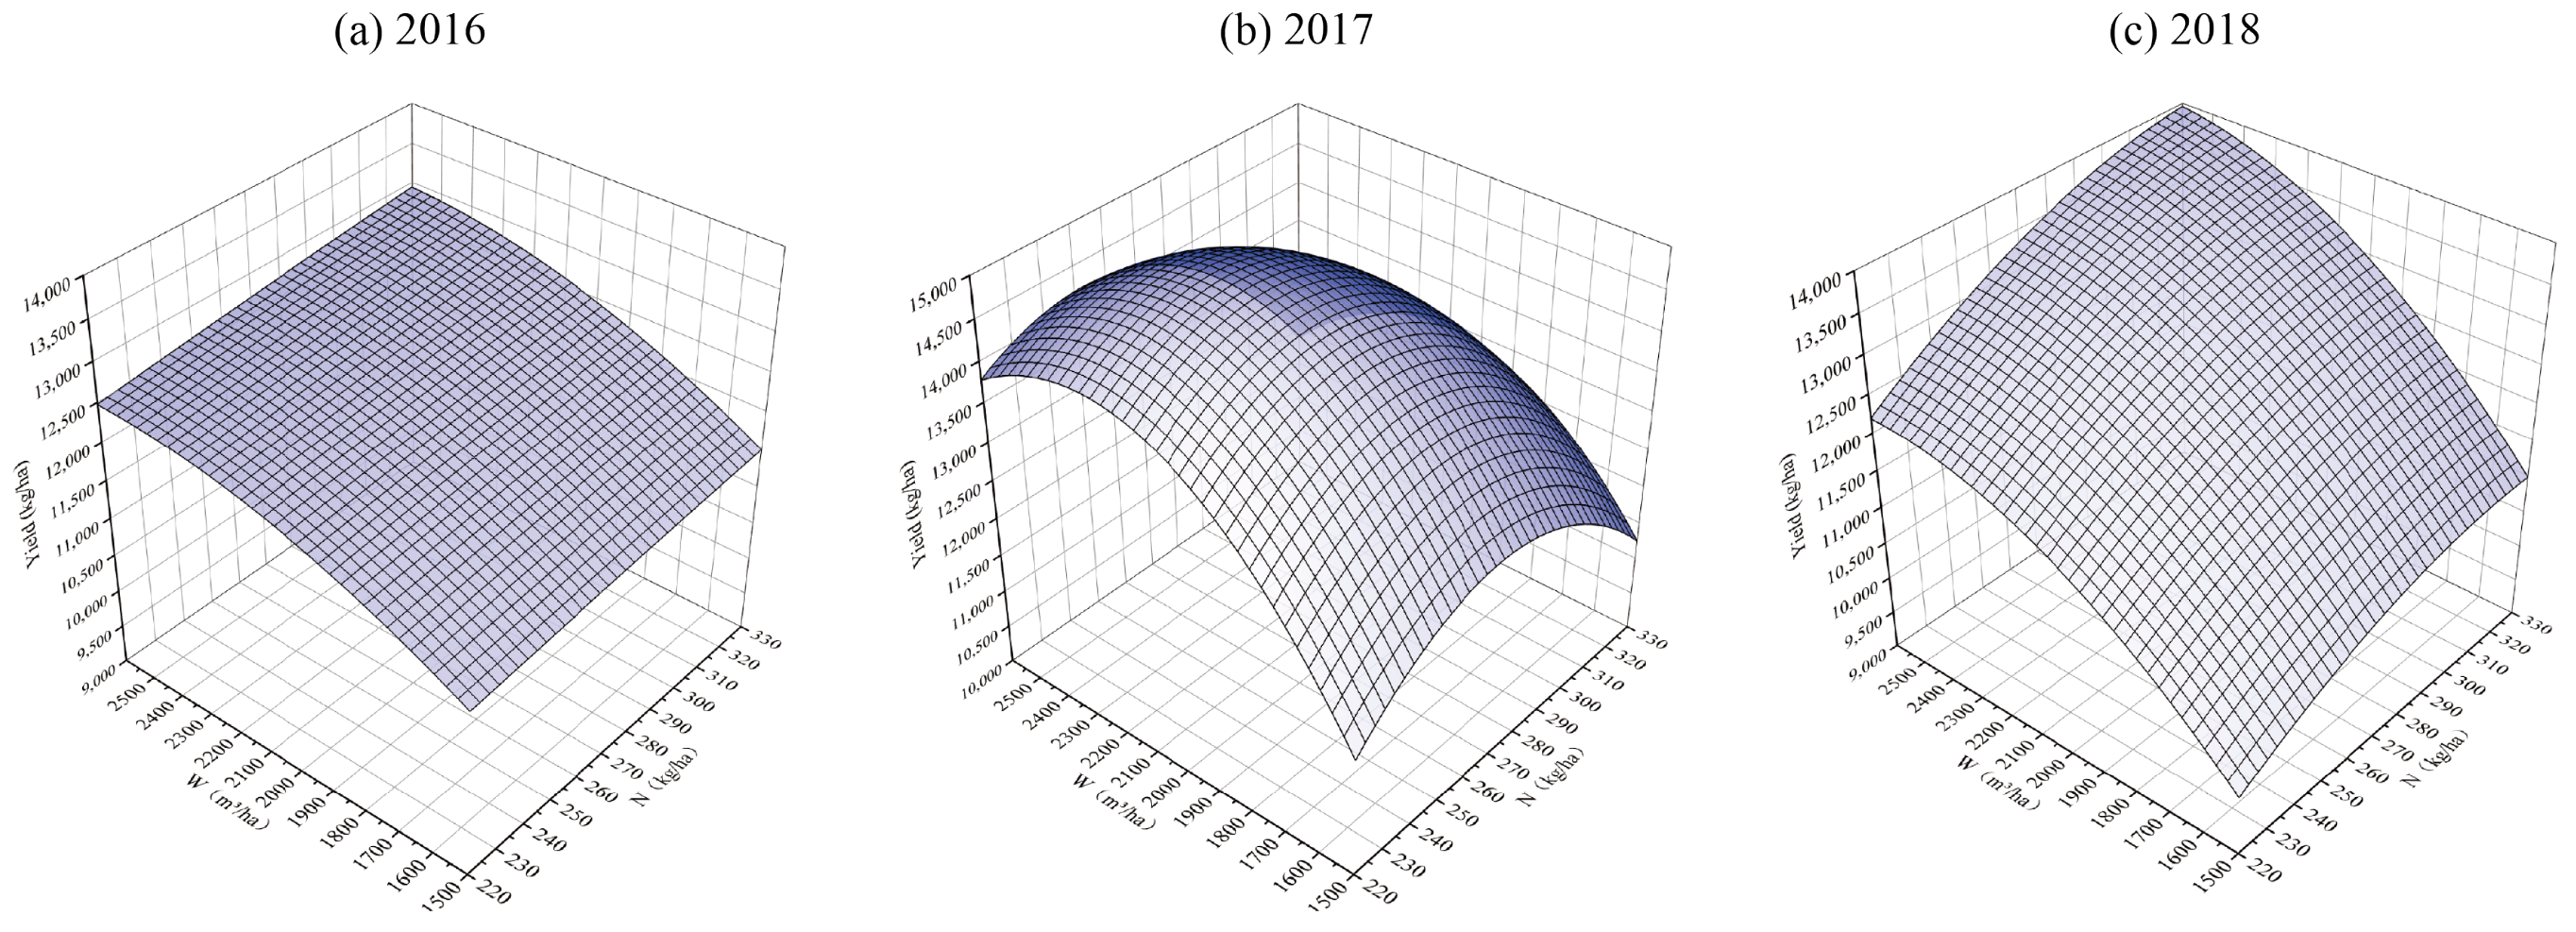
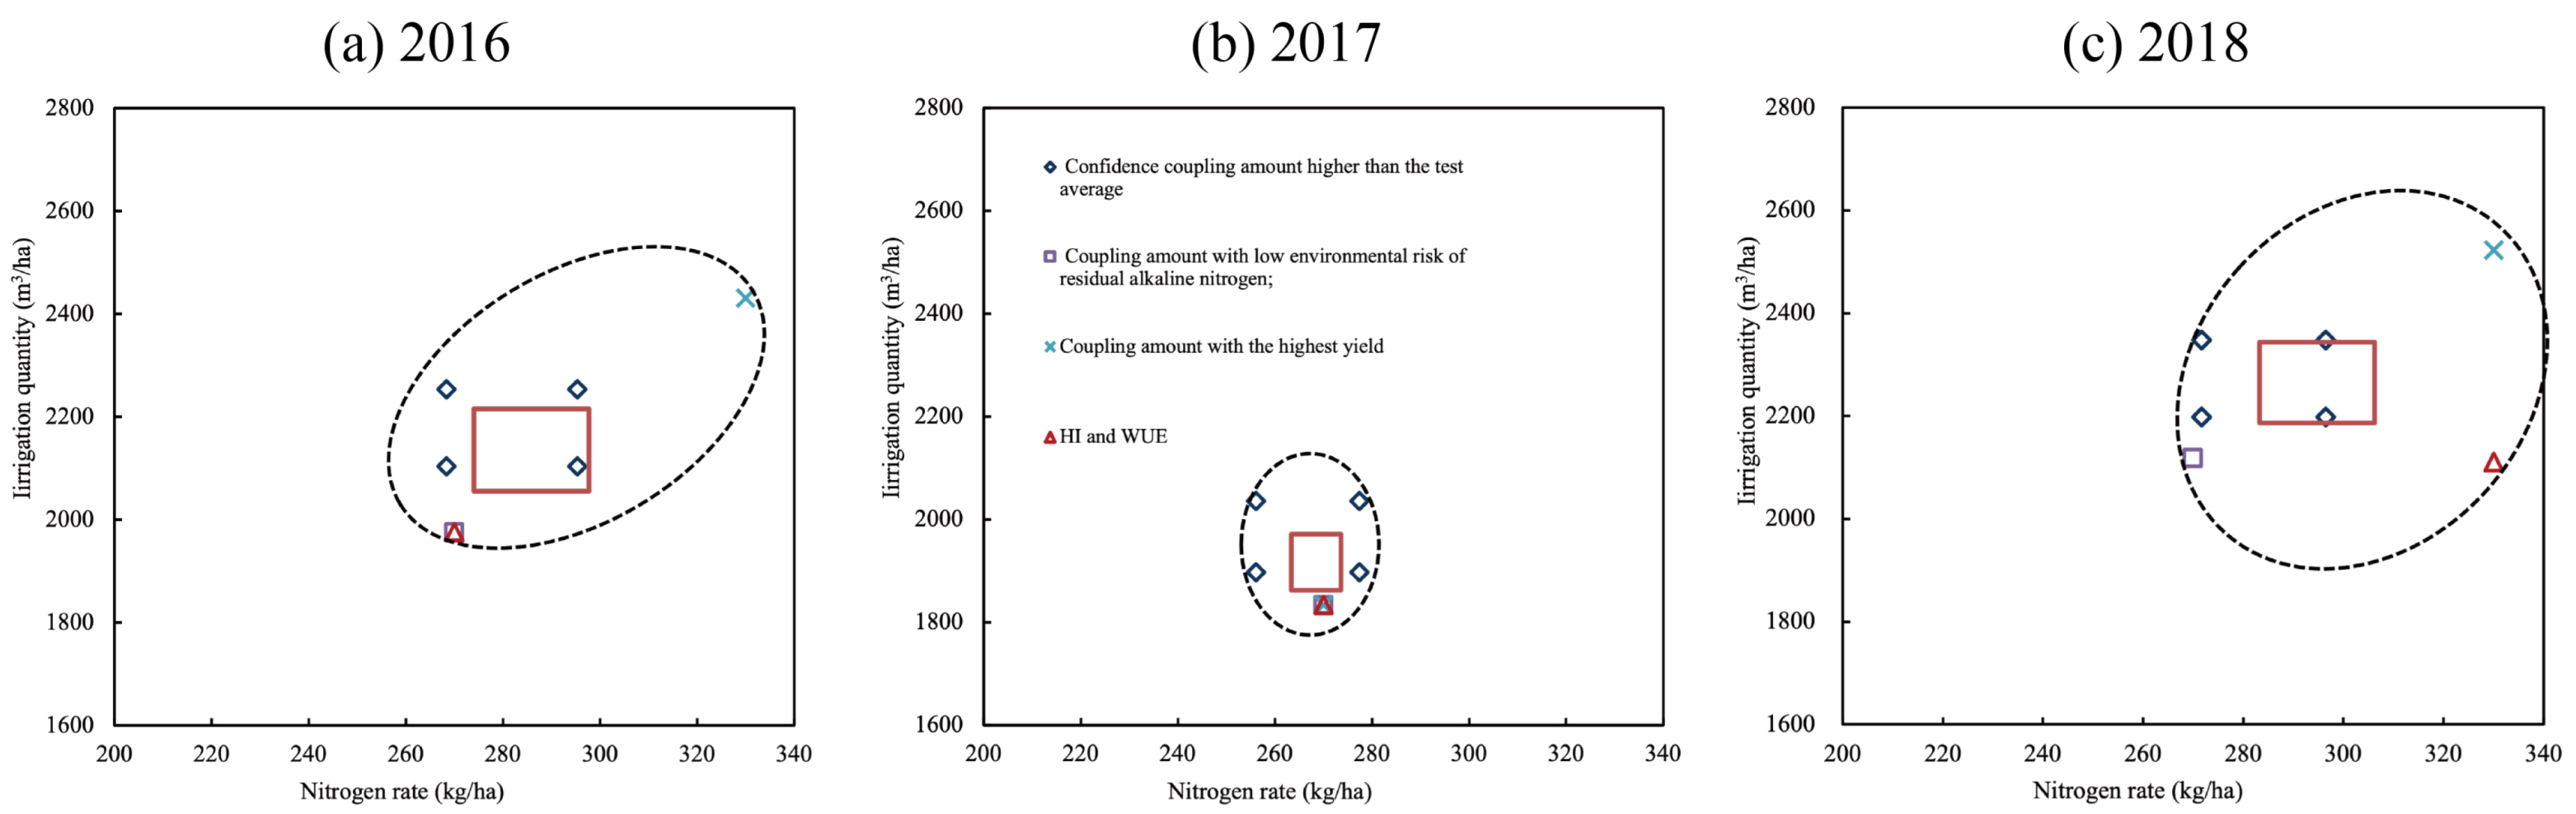
3.5. Multi-Objective Optimization of Water–Nitrogen Coupling Zones

W 2 N 2 treatment has the lowest environmental risk in this study. In 2016 and 2017, W 2 N 2 yielded a higher HI and WUE, while in 2018, W 2 N 3 showed better distribution of photosynthetic products. In 2016 and 2018, W 3 N 3 achieved the highest yield and the difference was not significant, while in 2017, W 2 N 2 achieved the highest yield, respectively. The 95% confidence intervals for irrigation and N values that produced higher than average yield were 2103.50–2253.31 m 3 / ha and 268.34–295.39 kg / ha , 1897.17–2036.09 m 3 / ha and 256.08–277.41 kg / ha , and 2198.62–2348.29 m 3 / ha and 271.64–296.49 kg / ha for 2016, 2017, and 2018, respectively. Using the scatter diagram to express different water–nitrogen coupling zones, an elliptical area was obtained (Figure 7). The center point was obtained by weighting the scatter points, and 20% of the difference between the extreme values was taken as the degree of deviation. The obtained rectangular area is the optimal water–nitrogen coupling range that considers WUE, high yield, and environmental effects of N residue. Irrigation and N application were 2086.65–2268.85 m 3 / ha and 271.09–295.76 kg / ha , 1897.17–2036.09 m 3 / ha and 256.08–277.41 kg / ha , and 2198.62–2348.29 m 3 / ha and 271.64–296.49 kg / ha for 2016, 2017, and 2018, respectively.

4. Discussion

This study shows that with an increase in irrigation and N application rate, the residual amount of alkali-hydrolyzable N increased slowly within a certain range. Upon exceeding a certain amount, residual N increased rapidly, and more N entered the soil environment. W 2 N 2 can maintain nutrients in the root zone, realize the optimal utilization of water and N by crops, and reduce potential environmental risks, which is consistent with results of recent research [13,14,24]. At an appropriate level of water–nitrogen coupling effect, higher dry matter can be obtained, with better coordination between the amount of water and fertilizer, and this finding is supported by some studies [17,18,26]. Water deficit and excess are not conducive to the transfer of plant vegetative growth to reproductive growth [30]. Increasing the amount of irrigation and fertilization after reaching the optimal amount of water and N application will reduce their rate of contribution to yield [19,20,31]. In addition, after reaching an appropriate water level and increasing the irrigation beyond the level, the contribution of irrigation to the vegetative organs is higher than that to the grains. Similarly, excessive N application contributed more to vegetative organs, with the ratio of grain yield to above=ground biomass decreasing, thereby decreasing HI.
Through experimental research on maize in Northeast China, Sun [32] found that irrigation and fertilization have a synergistic effect on the grain yield of maize, where N fertilization has the most significant effect, followed by irrigation. However, this study showed that compared with increasing N application rate, increasing irrigation rate had a higher impact on yield, probably due to the adoption of the drip irrigation under plastic film, a water-saving irrigation method, which improved the WUE [12,33]. Moreover, the impact of irrigation on yield in the dry year was significantly higher than that in the normal year in this experiment. Zamora-Re [34] studied the effects of different irrigation strategies on maize yield and concluded that in years with low rainfall, the impact of irrigation on yield is more pronounced. It is evident that the similarities and differences between the conclusions of this experiment and those of previous studies are related to the differences in the applied irrigation methods and hydrological year patterns.
This study shows that, in 2017, under the same irrigation level, the yield of the N 3 treatment was the lowest, which is related to the heavy rainfall and uneven temporal and spatial distribution in that year, which reduced the impact of irrigation on yield. Furthermore, maize with N 3 treatment consumed a high amount of nutrients in the early growth stage for vegetative growth, and the heavy rain in the later period caused the leaching of topdressing N during the grain-filling stage, resulting in a significant reduction in yield. For the other years, the higher responsiveness of water–nitrogen coupling to yield occurred in the areas with medium and high irrigation and N levels, and the highest yield occurred in the W 3 N 3 treatment, but there was no significant difference between the W 2 N 3 and W 3 N 2 treatments. It can be observed that although a high amount of water and N can be used to obtain absolute high yields, the capacity to increase production is too low [26,27]. Some researchers studied wheat [26], cotton [27], cucumber [28], rapeseed [35], and tomato [36] arrived at similar conclusions. In the normal year, W 2 N 2 treatment yielded the highest WUE, while in the dry year, W 2 N 3 treatment had the highest WUE, instead of W 3 N 3 treatment which had the highest yield. The highest WUE occurred under W 2 irrigation conditions. Therefore, an appropriate irrigation amount can obtain a higher WUE, and the amount of N application can be adjusted according to the change in the hydrological year. Therefore, it is reasonable to recommend water–nitrogen coupling zones according to different hydrological years.

5. Conclusions

Water and nitrogen are limiting factors for high yields in maize under drip irrigation with plastic film. Irrigation rate had higher impact on yield than nitrogen application due to drip irrigation under plastic film. Moderate irrigation and nitrogen treatment have high nitrogen-use efficiency with no negative environmental impact.
The multi-objective optimal water-nitrogen coupling area integrating corn yield, harvest index, WUE, and soil environmental effects, and irrigation in normal water years were 2086–2268 m 3 / ha , nitrogen application was 271–295 kg/ha, and irrigation in flat water and partial abundance years was 1897–2036 m 3 / ha ; nitrogen application was 256–277 kg/ha, irrigation in dry years was 2198–2348 m 3 / ha , and nitrogen application was 271–296 kg/ha.

Author Contributions

Conceptualization, Y.F. and H.S.; methodology, Y.F.; investigation, Y.F. and Q.J.; data curation, Y.F. and Q.J.; writing—original draft preparation, Y.F.; writing—review and editing, R.L. and Y.J.; visualization, Y.F. and Y.J.; supervision, H.S.; project administration, Q.M.; funding acquisition, H.S. All authors have read and agreed to the published version of the manuscript.

Funding

“The 14th Five-Year Plan” of Chinese National Key Research and Development Program (2021YFD1900602-06), National Natural Science Foundation of China (51879132), Central Public-interest Scientific Institution Basal Research Fund (No.Y2021YJ07).

Institutional Review Board Statement

Not applicable.

Informed Consent Statement

Not applicable.

Data Availability Statement

Not applicable.

Conflicts of Interest

The authors declare no conflict of interest.

Abbreviations

The following abbreviations are used in this manuscript:
HIharvest index
NUEnitrogen-use efficiency
N 1 low nitrogen
N 2 medium nitrogen
N 3 high nitrogen
TDRtime-domain reflectometry
WUEwater-use efficiency
W 1 low water
W 2 medium water
W 3 high water

References

  1. Zheng, J.; Fan, J.; Zhang, F.; Guo, J.; Yan, S.; Zhuang, Q.; Cui, N.; Guo, L. Interactive effects of mulching practice and nitrogen rate on grain yield, water productivity, fertilizer use efficiency and greenhouse gas emissions of rainfed summer maize in northwest China. Agric. Water Manag. 2021, 248, 106778. [Google Scholar] [CrossRef]
  2. Li, C.; Wang, C.; Wen, X.; Qin, X.; Liu, Y.; Han, J.; Li, Y.; Liao, Y.; Wu, W. Ridge–furrow with plastic film mulching practice improves maize productivity and resource use efficiency under the wheat–maize double–cropping system in dry semi–humid areas. Field Crops Res. 2017, 203, 201–211. [Google Scholar] [CrossRef]
  3. Gu, X.; Li, Y.; Du, Y. Biodegradable film mulching improves soil temperature, moisture and seed yield of winter oilseed rape (Brassica Napus L.). Soil Tillage Res. 2017, 171, 42–50. [Google Scholar] [CrossRef]
  4. Xie, Z.; Wang, Y.; Li, F. Effect of plastic mulching on soil water use and spring wheat yield in arid region of northwest China. Agric. Water Manag. 2005, 75, 71–83. [Google Scholar] [CrossRef]
  5. He, G.; Wang, Z.; Cao, H.; Dai, J.; Li, Q.; Xue, C. Year-round plastic film mulch to increase wheat yield and economic returns while reducing environmental risk in dryland of the Loess Plateau. Field Crops Res. 2018, 225, 1–8. [Google Scholar] [CrossRef]
  6. Zong, R.; Wang, Z.; Zhang, J.; Li, W. The response of photosynthetic capacity and yield of cotton to various mulching practices under drip irrigation in Northwest China. Agric. Water Manag. 2021, 249, 106814. [Google Scholar] [CrossRef]
  7. Wang, N.; Ding, D.; Malone, R.W.; Chen, H.; Wei, Y.; Zhang, T.; Luo, X.; Li, C.; Chu, X.; Feng, H. When does plastic-film mulching yield more for dryland maize in the Loess Plateau of China? A meta-analysis. Agric. Water Manag. 2020, 240, 106290. [Google Scholar] [CrossRef]
  8. Zhang, F.; Li, M.; Qi, J.; Li, F.; Sun, G. Plastic film mulching increases soil respiration in ridge-furrow maize management. Arid Land Res. Manag. 2015, 29, 432–453. [Google Scholar] [CrossRef]
  9. Chen, N.; Li, X.; Šimůnek, J.; Shi, H.; Ding, Z.; Zhang, Y. The effects of biodegradable and plastic film mulching on nitrogen uptake, distribution, and leaching in a drip-irrigated sandy field. Agric. Ecosyst. Environ. 2020, 292, 106817. [Google Scholar] [CrossRef]
  10. Li, J.; Xu, X.; Lin, G.; Wang, Y.; Liu, Y.; Zhang, M.; Zhou, J.; Wang, Z.; Zhang, Y. Micro-irrigation improves grain yield and resource use efficiency by co-locating the roots and N-fertilizer distribution of winter wheat in the North China Plain. Sci. Total Environ. 2018, 643, 367–377. [Google Scholar] [CrossRef]
  11. Kumar, M.; Rajput, T.; Kumar, R.; Patel, N. Water and nitrate dynamics in baby corn (Zea mays L.) under different fertigation frequencies and operating pressures in semi-arid region of India. Agric. Water Manag. 2016, 163, 263–274. [Google Scholar] [CrossRef]
  12. Jha, S.K.; Gao, Y.; Liu, H.; Huang, Z.; Wang, G.; Liang, Y.; Duan, A. Root development and water uptake in winter wheat under different irrigation methods and scheduling for North China. Agric. Water Manag. 2017, 182, 139–150. [Google Scholar] [CrossRef]
  13. Ayars, J.; Fulton, A.; Taylor, B. Subsurface drip irrigation in California—Here to stay? Agric. Water Manag. 2015, 157, 39–47. [Google Scholar] [CrossRef]
  14. Jha, S.K.; Ramatshaba, T.S.; Wang, G.; Liang, Y.; Liu, H.; Gao, Y.; Duan, A. Response of growth, yield and water use efficiency of winter wheat to different irrigation methods and scheduling in North China Plain. Agric. Water Manag. 2019, 217, 292–302. [Google Scholar]
  15. Wang, Z.; Zhang, W.; Beebout, S.S.; Zhang, H.; Liu, L.; Yang, J.; Zhang, J. Grain yield, water and nitrogen use efficiencies of rice as influenced by irrigation regimes and their interaction with nitrogen rates. Field Crops Res. 2016, 193, 54–69. [Google Scholar] [CrossRef]
  16. Wolff, M.W.; Hopmans, J.W.; Stockert, C.M.; Burger, M.; Sanden, B.L.; Smart, D.R. Effects of drip fertigation frequency and N-source on soil N2O production in almonds. Agric. Ecosyst. Environ. 2017, 238, 67–77. [Google Scholar] [CrossRef]
  17. Leghari, S.J.; Wahocho, N.A.; Laghari, G.M.; HafeezLaghari, A.; MustafaBhabhan, G.; HussainTalpur, K.; Bhutto, T.A.; Wahocho, S.A.; Lashari, A.A. Role of nitrogen for plant growth and development: A review. Adv. Environ. Biol. 2016, 10, 209–219. [Google Scholar]
  18. Chen, Z.; Tao, X.; Khan, A.; Tan, D.K.; Luo, H. Biomass accumulation, photosynthetic traits and root development of cotton as affected by irrigation and nitrogen-fertilization. Front. Plant Sci. 2018, 9, 173. [Google Scholar] [CrossRef] [PubMed]
  19. Rudnick, D.; Irmak, S.; Djaman, K.; Sharma, V. Impact of irrigation and nitrogen fertilizer rate on soil water trends and maize evapotranspiration during the vegetative and reproductive periods. Agric. Water Manag. 2017, 191, 77–84. [Google Scholar] [CrossRef]
  20. Wang, Y.; Zhang, X.; Chen, J.; Chen, A.; Wang, L.; Guo, X.; Niu, Y.; Liu, S.; Mi, G.; Gao, Q. Reducing basal nitrogen rate to improve maize seedling growth, water and nitrogen use efficiencies under drought stress by optimizing root morphology and distribution. Agric. Water Manag. 2019, 212, 328–337. [Google Scholar] [CrossRef]
  21. Tang, B.; Yin, C.; Yang, H.; Sun, Y.; Liu, Q. The coupling effects of water deficit and nitrogen supply on photosynthesis, WUE, and stable isotope composition in Picea Asperata. Acta Physiol. Plant. 2017, 39, 1–11. [Google Scholar] [CrossRef]
  22. Kang, Y.; Park, J.; Kim, S.; Kang, N.; Park, K.; Lee, S.; Jeong, B. Effects of root zone pH and nutrient concentration on the growth and nutrient uptake of tomato seedlings. J. Plant Nutr. 2011, 34, 640–652. [Google Scholar] [CrossRef]
  23. Shrestha, N.; Raes, D.; Vanuytrecht, E.; Sah, S.K. Cereal yield stabilization in Terai (Nepal) by water and soil fertility management modeling. Agric. Water Manag. 2013, 122, 53–62. [Google Scholar] [CrossRef]
  24. Wang, X.; Fan, J.; Xing, Y.; Xu, G.; Wang, H.; Deng, J.; Wang, Y.; Zhang, F.; Li, P.; Li, Z. The effects of mulch and nitrogen fertilizer on the soil environment of crop plants. Adv. Agron. 2019, 153, 121–173. [Google Scholar]
  25. Liu, W.; Zhang, X. Optimizing water and fertilizer input using an elasticity index: A case study with maize in the loess plateau of china. Field Crops Res. 2007, 100, 302–310. [Google Scholar] [CrossRef]
  26. Si, Z.; Zain, M.; Mehmood, F.; Wang, G.; Gao, Y.; Duan, A. Effects of nitrogen application rate and irrigation regime on growth, yield, and water-nitrogen use efficiency of drip-irrigated winter wheat in the North China Plain. Agric. Water Manag. 2020, 231, 106002. [Google Scholar] [CrossRef]
  27. Li, X.; Liu, H.; He, X.; Gong, P.; Lin, E. Water–nitrogen coupling and multi-objective optimization of cotton under mulched drip irrigation in arid northwest China. Agronomy 2019, 9, 894. [Google Scholar] [CrossRef]
  28. Wang, H.; Li, J.; Cheng, M.; Zhang, F.; Wang, X.; Fan, J.; Wu, L.; Fang, D.; Zou, H.; Xiang, Y. Optimal drip fertigation management improves yield, quality, water and nitrogen use efficiency of greenhouse cucumber. Sci. Hortic. 2019, 243, 357–366. [Google Scholar] [CrossRef]
  29. Jia, Q.; Shi, H.; Li, R.; Feng, Y.; Li, H.; Zheng, J. Drip irrigation schedules of maize in Tongliao. Drain. Irrig. Mach. 2018, 36, 897–902. [Google Scholar]
  30. Liu, E.; Mei, X.; Yan, C.; Gong, D.; Zhang, Y. Effects of water stress on photosynthetic characteristics, dry matter translocation and WUE in two winter wheat genotypes. Agric. Water Manag. 2016, 167, 75–85. [Google Scholar] [CrossRef]
  31. Xu, Z.; Yu, Z.; Wang, D. Nitrogen translocation in wheat plants under soil water deficit. Plant Soil 2006, 280, 291–303. [Google Scholar] [CrossRef]
  32. Sun, Z.Z.; Zheng, J.M.; Sun, W.T. Coupled effects of soil water and nutrients on growth and yields of maize plants in a semi-arid region. Pedosphere 2009, 19, 673–680. [Google Scholar] [CrossRef]
  33. Sui, J.; Wang, J.; Gong, S.; Xu, D.; Zhang, Y.; Qin, Q. Assessment of maize yield-increasing potential and optimum N level under mulched drip irrigation in the Northeast of China. Field Crops Res. 2018, 215, 132–139. [Google Scholar] [CrossRef]
  34. Zamora-Re, M.I.; Dukes, M.; Hensley, D.; Rowland, D.; Graham, W. The effect of irrigation strategies and nitrogen fertilizer rates on maize growth and grain yield. Irrig. Sci. 2020, 38, 461–478. [Google Scholar] [CrossRef]
  35. Gu, X.; Li, Y.; Du, Y. Optimized nitrogen fertilizer application improves yield, water and nitrogen use efficiencies of winter rapeseed cultivated under continuous ridges with film mulching. Ind. Crops Prod. 2017, 109, 233–240. [Google Scholar] [CrossRef]
  36. Zhang, F.; Wu, L.; Fan, J.; Zhang, Y.; Li, J.; Xing, Y. Determination of optimal amount of irrigation and fertilizer under, drip fertigated system based on tomato yield, quality, water and, fertilizer use efficiency. Trans. Chin. Soc. Agric. Eng. 2015, 31, 110–121. [Google Scholar]
Figure 1. Schematic diagram of planting mode and sampling monitoring of soil moisture content.
Agronomy 13 00486 g001
Figure 2. Precipitation and reference crop evapotranspiration ( E T 0 ) during the maize growing seasons. (a) 2016. (b) 2017. (c) 2018.
Agronomy 13 00486 g002
Figure 3. Soil alkaline hydrolysis nitrogen residue after harvest in 0–1 m soil layer. (a) 2016. (b) 2017. (c) 2018. Statistical comparisons were made by one-way ANOVA. Different characters mean significant differences found at p < 0.05.
Agronomy 13 00486 g003
Figure 4. Dry weight of above-ground biomass and harvest index of corn after harvest. (a) 2016. (b) 2017. (c) 2018. Statistical comparisons were made by one-way ANOVA. Different characters mean significant differences found at p < 0.05.
Agronomy 13 00486 g004
Figure 5. Maize yield under different water and nitrogen treatments. (a) Effect of different nitrogen inputs on yield. (b) Effect of different irrigation on yield.
Agronomy 13 00486 g005
Figure 6. The effect of coupling of water and nitrogen on the yield of Maize. (a) 2016. (b) 2017. (c) 2018.
Agronomy 13 00486 g006
Figure 7. Graphic expression of water and nitrogen coupling area. (a) 2016. (b) 2017. (c) 2018. Note: rhombus represents confidence coupling amount higher than the test average; square represents coupling amount with low environmental risk of residual alkaline nitrogen; triangle represents harvest index; cross represents WUE.
Agronomy 13 00486 g007
Table 1. Physical and chemical properties and fertility of soil in the experiment field.
Soil LayersSoil Separates (%)Bulk DensityField CapacitySoil Organic MatterSoil Available N
(cm)SandSiltClay(g/cm3)(cm3/cm3)(g/g)(mg/kg)
0–2036.7652.710.541.390.261582
20–4021.6548.8129.541.380.3424.479
40–6020.1839.1540.671.230.4510.937
60–8077.0821.651.271.320.211.126
80–10073.0125.581.411.320.1711.415
Table 2. Test scheme of water–nitrogen coupling effect on maize.
TreatmentIrrigation FrequencyIrrigation Amount (m 3 / ha)Nitrogen Application Amount (kg/ha)
201620172018201620172018SeedingJointingTasselingGroutingTotal
W 1 N 1 7871496.401523.191667.9251696934.5224
W 1 N 2 7871692.001585.141697.906382.882.841.4270
W 1 N 3 7871710.201498.191660.428996.496.448.2330
W 2 N 1 9871905.901829.712113.7051696934.5224
W 2 N 2 9871975.601833.332117.606382.882.841.4270
W 2 N 3 9871924.001836.962110.198996.496.448.2330
W 3 N 1 11872279.002224.642529.9851696934.5224
W 3 N 2 11872326.102201.092514.996382.882.841.4270
W 3 N 3 11872431.102195.652522.498996.496.448.2330
Table 3. Effects of different water and nitrogen treatments on maize yield and WUE.
TreatmentYield (kg/ha)ET_c (mm)WUE (kg/m 3 )
201620172018201620172018201620172018
W 1 N 1 11,266.95 c12,499.47 c9952.35 e397.12 c457.28 b366.37 c2.84 b2.73 c2.72 c
W 1 N 2 11,964.75 bc12,836.05 b11,402.4 d402.33 c454.24 b368.77 c2.98 ab2.83 bc3.09 ab
W 1 N 3 11,788.8 bc11,408.49 d10,846.95 d402.91 c447.28 b365.72 c2.93 ab2.55 d2.97 b
W 2 N 1 11,823 bc13,510.05 b11,294.1 d411.54 b467.57 b405.47 b2.87 ab2.89 b2.79 c
W 2 N 2 12,271.2 b14,687.4 a12,075.6 c410.26 b467.86 b405.78 b2.99 a3.14 a2.98 b
W 2 N 3 12,618 ab12,236.7 c13,062.75 ab425.38 b468.15 b405.18 b2.97 ab2.61 cd3.22 a
W 3 N 1 12,619.05 ab14,401.65 a12,308.55 bc453.59 a498.98 a429.46 a2.78 b2.89 b2.87 bc
W 3 N 2 12,726.95 a14,580.3 a12,838.35 b456.64 a497.1 a428.25 a2.79 b2.93 b3 ab
W 3 N 3 12,950.7 a13,109.25 b13,543.8 a461.25 a496.56 a429.84 a2.81 b2.64 cd3.16 a
F valueW40.67 **87.14 **150.58 **72.49 **39.63 **76.32 **5.43 *6.65 **NS
N11.23 **97.13 **55.78 **NSNSNSNS28.47 **22.01 *
W × NNS4.16 *7.6 **NSNSNSNSNSNS
Different lowercase letters in the same column indicate significance (p < 0.05), while the same letter indicates non-significance; *, ** F value means significant at the p < 0.05 and p < 0.01 levels, respectively. NS means non-significant at the p > 0.05 level. Data shown in N treatment is average over the three irrigation amounts.
Table 4. Factor value of the frequency distribution and proportion plan with grain yield surpass average.
Horizontal Code201620172018
W(m 3 /ha)N(kg/ha)W(m 3 /ha)N(kg/ha)W(m 3 /ha)N(kg/ha)
TimesFreqTimesFreqTimesFreqTimesFreqTimesFreqTimesFreq
0.0000.00310.3400.00516.1300.0026.67
0.1700.00413.7926.45516.1300.00413.33
0.3326.90413.79516.13619.35413.33413.33
0.50620.69413.79619.35619.35620.00516.67
0.67724.14413.79619.35516.13620.00516.67
0.83724.14517.24619.35412.90723.33516.67
1.00724.14517.24619.3500.00723.33516.67
Total times292931313030
weighted mean0.72970.54590.64480.40320.70500.5667
95% confidence0.6495–0.80980.4183–0.67350.5492–0.74050.3026–0.50390.6189–0.79110.4495–0.6839
Preferred interval2103.50–2253.31268.34–295.391897.17–2036.09256.08–277.412198.62–2348.29271.64–296.49
Disclaimer/Publisher’s Note: The statements, opinions and data contained in all publications are solely those of the individual author(s) and contributor(s) and not of MDPI and/or the editor(s). MDPI and/or the editor(s) disclaim responsibility for any injury to people or property resulting from any ideas, methods, instructions or products referred to in the content.

