Article

Comparison between Drift Test Bench and Other Techniques in Spray Drift Evaluation of an Eight-Rotor Unmanned Aerial Spraying System: The Influence of Meteorological Parameters and Nozzle Types

1
College of Science, China Agricultural University, Beijing 100193, China
2
College of Agricultural Unmanned System, China Agricultural University, Beijing 100193, China
3
Centre for Chemicals Application Technology, China Agricultural University, Beijing 100193, China
*
Authors to whom correspondence should be addressed.
Agronomy 2023, 13(1), 270; https://doi.org/10.3390/agronomy13010270
Submission received: 23 December 2022 / Revised: 13 January 2023 / Accepted: 14 January 2023 / Published: 16 January 2023
(This article belongs to the Special Issue Agricultural Environment and Intelligent Plant Protection Equipment)

Abstract

:
In the past decade, an unmanned aerial spraying system (UASS) was applied more and more widely for low-volume aerial pesticides spraying operations in China. However, UASS have a higher drift risk due to more fine droplets sprayed with a higher working height and a faster driving speed than ground sprayers. Study on UASS spray drift is a new hot spot within the field of pesticide application technology. The field test bench was originally designed and applied for the measurement of the spray drift potential of ground sprayers. No methodology using the test bench for UASS drift evaluation was reported. Based on our previous study, field drift measurements of an eight-rotor UASS were conducted using three techniques (test bench, ground petri dish, and airborne collection frame) in this study, and the effects of meteorological parameters and nozzle types were investigated, to explore the applicability and the feasibility of the test bench used in UASS field drift evaluation. The test bench is proven promising for direct drift determination of UASS and the described methodology enabled classification of different UASS configurations. Higher wind speeds and finer droplets produced higher drift values. The faster the wind speed and the lower the humidity, the more the spray drift. The test bench can reduce the site requirements and improve the efficiency of the field drift test.

1. Introduction

In the past 10–15 years, the unmanned aerial spraying system (UASS), or unmanned aerial vehicle (UAV) sprayer, was widely used worldwide as a new type of efficient plant protection machinery [1,2]. Especially in China, UASSs replaced manual sprayers with low efficiency, such as knapsack sprayers and sprayer guns. These aerial sprayers are flexible and easy to operate, and have a lot of unique advantages in scenarios where ground sprayers are difficult to access, i.e., paddy fields, hilly areas, and fruit trees planted in disorder. They can also reduce the chemical toxicity for operators effectively. According to the statistics from DJI and XAG, two leading Chinese manufacturers, the marketing holdings of agricultural UAV used for spraying and broadcasting exceeded 160 thousand and the annual working area reached 93 million ha all over China in 2021.

1.1. UASS Spray Drift

Under the combined influence of flying platform load capacity, spraying system performance, regulatory policies, development and maintenance costs, operation convenience, and flexibility, the max take-off weight of UASS does not exceed 150 kg and the liquid tank capacity does not exceed 100 L, currently. Therefore, a fine droplet (volume median diameter, VMD < 200 μm) and a low application volume (<150 L/ha) are needed to guarantee the pesticide active ingredients to be applied uniformly to targeted crops. UASS spraying operations are normally classified into ultra-low volume application (ULV) and very-low volume application (VLV) for field crops and tree crops. Compared to ground-based equipment, UASS aerial operation normally generate a finer droplet with a faster flight speed and a longer nozzle to target distance, contributing to an enormous risk of UASS’s drift. Spray drift can be regarded as that part of a pesticide application that is deflected away from the target area by the action of the wind. Control of drift is important because of the potential exposure to pesticides of non-target organisms and structures outside a treatment zone and where there is the possibility of such organisms being sensitive to very small quantities of the pesticide materials [3]. Factors influencing the risk of spray drift vary, mainly including spray nozzle design and performance, nozzle to target distance, atmospheric variables, properties of the spray liquid, and the sprayer speed. Several studies on UASS spray drift evaluation were conducted to explore the effects of application parameters, meteorology conditions, and UASS configurations in different scenarios, such as field crops, orchards, and vineyards [4,5,6,7,8,9,10,11,12].

1.2. Drift Testing Method

The testing method of spray drift mainly consists of the direct field test and the indirect evaluation test. The field test is to measure the actual spray drift outdoors in typical field conditions or over a defined surface including grass turf following the ISO 22866 standard ‘Methods for field measurement of spray drift’ (all standards cited in this paper were introduced in Appendix A), [13] which is considered as the most realistic drift measurement method. On the other hand, the evaluation test includes wind tunnel [14], drift test bench [15,16], and droplets spectrum test [17,18]. The drift potential reduction percentages are calculated by measuring the spray deposition or the droplet size distribution for analysis [19,20,21].

1.3. Field Drift Test Bench

The field test bench was originally designed and applied for the measurement of the spray drift potential of ground sprayers, including boom sprayers for field crops and orchard airblast sprayers for tree crops. As an alternative methodology to simplify the assessment of spray drift risk for different equipment, the Department of Agricultural Forest and Environmental Economics and Engineering (DEIAFA) of the University of Turin developed the drift test bench in 2007 [22] X. Wang et al. tested the spray drift potential of six types of fan nozzles at two spraying pressures with a boom sprayer [23] Gil et al. evaluated the influence of wind velocity and wind direction on the drift potential value using the test bench [24]. In 2015, the ISO 22401 standard ‘Method for measurement of potential spray drift from horizontal boom sprayers by the use of a test bench’ was published [15], aiming at defining a test procedure to assess potential spray drift using the ad hoc test bench. Nuyttens et al. and Balsari et al. measured the effects of application speed, boom height, and spray characteristics on drift reduction potentials for boom sprayers using the drift test bench under controlled indoor conditions [25,26,27]. The applications of the test bench in quantifying the drift potential of airblast sprayers were also attempted by Grella et al. [28,29]. However, no methodology using the test bench for UASS spray drift evaluation was proposed and reported.
Under similar meteorological parameters, we compared the spray performance of three different typical commercial UASS types with two nozzles types with an artificial vineyard in 2019, and the characteristics of deposition, drift, and mass balance of unmanned aerial spraying were obtained in our previous work [30]. Based on this methodology, field drift measurements of an eight-rotor UASS were conducted using three techniques (test bench, ground petri dish and airborne collection frame) in this study, and the effects of meteorological parameters and nozzle types were investigated, to explore the applicability and the feasibility of the test bench used in UASS field drift evaluation.

2. Materials and Methods

2.1. Characteristics of Unmanned Aerial Spraying System
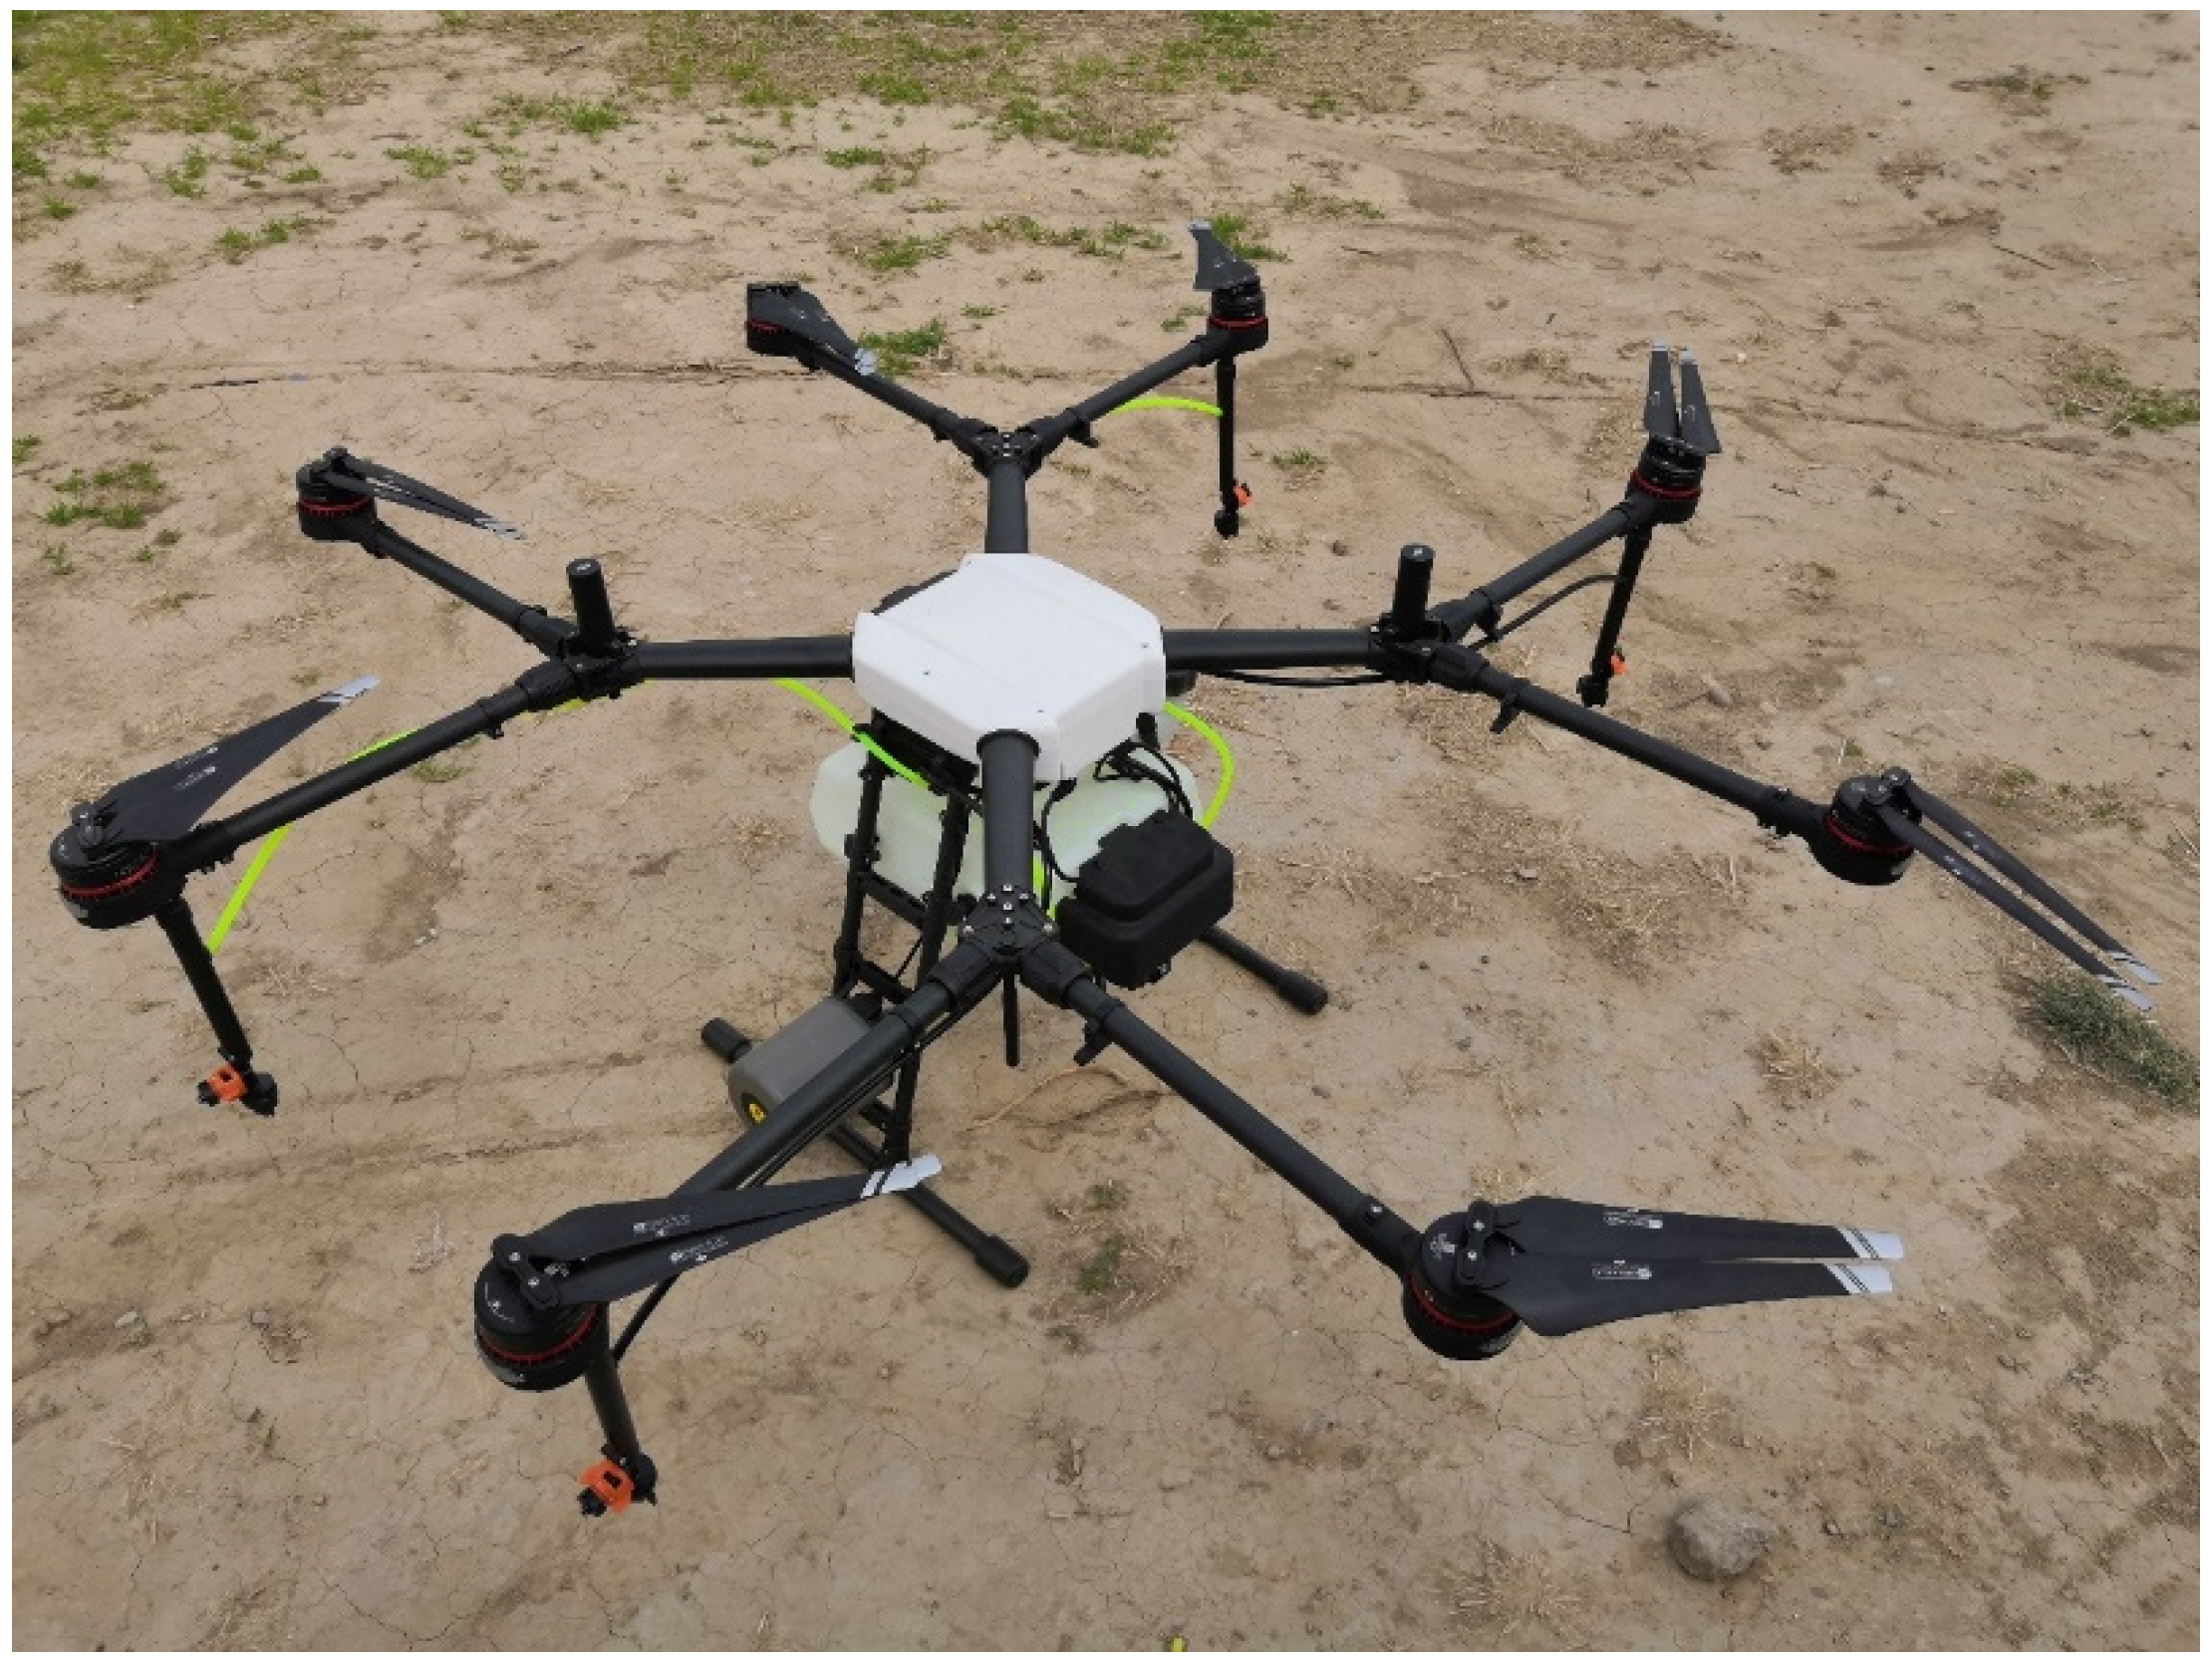
As shown in Figure 1, the unmanned aerial spraying system used in the field trials was an eight-rotor electric UAV sprayer AGRAS MG-1P (SZ DJI Technology Co., Ltd., Shenzhen, China), equipped with two types of nozzles: hollow cone nozzles (HC) TR 80-0067 and air induction flat fan nozzles (AI) IDK 120-015 (Lechler GmbH, Metzingen, Germany). The 8-rotor UASS has an unfolded size of 1460 mm long, 1460 mm width and 616 mm height, and a propeller diameter of 53 cm, equipped with a 10 L spray tank. The net weight (excluding battery) was 10 kg and the max take-off weight was 25 kg. Four nozzles were mounted below the four lateral rotors of the UASS with a horizontal spacing of 146 cm. Prior to all tests, the spraying system was calibrated to obtain a single nozzle flow rate of 0.30 L min−1 for the HC and 0.55–0.60 L min−1 for the AI, providing a nominal application volume of 45 L ha−1 and 90–100 L ha−1, respectively. The UASS flew at an application speed of 2.0 m s−1 and an appropriate working width of 2.0 m during the tests.

2.2. Field Drift Test Bench

The field drift test bench (AAMS-Salvarani BVBA, Maldegem, Belgium) is constructed according to the ISO standard 22401: 2015 about drift reduction. The test bench (TB) consists of several aluminium modules (2.0 m length and 0.5 m width) that can be connected to each other. Bench length depends on the configuration of the sprayer to be tested. With the help of the pneumatic valves and the slideable aluminium covers, the collection trays (0.5 × 0.2 m in size) positioned every 0.5 m along the bench can be closed and opened. These trays with artificial collectors (plastic petri dishes) collect the drifting droplets from the sprayer. The collection trays open when the boom of the ground sprayer touches the dedicated stick or the switch is turned on, and the compressor with the pressure tank then gets a signal to open them. The battery, compressor, and pressure tank are mounted on a convenient trolley with two wheels.
In this study, we used five modules to compose a 10.0 m long test bench (Figure 2). It was placed perpendicular to the flight direction of the UASS with the petri dishes (15 cm diameter, Nantong Fansibei Biological Technology Co., Ltd., Jiangsu, China) 0.3 m above the ground. The first two collectors were positioned 2.0 m away from the edge of the sprayed field (EOF). A total of 40 petri dishes from the test bench were obtained in a single test.

2.3. Test Site and Sampling Layout

UASS spraying applications were performed at Beijing TT Aviation Technology Co. Ltd., Machikou town, Changping district, Beijing, China (40°11′30″ N; 116°10′10″ E). The test site was a flat open field with no obvious obstacles within 200 m, covering a total area of about 1000 m2. The sampling layout is shown in Figure 3. An artificial vineyard in a size of 16 m length, 20 m width, and 2 m height, and three airborne drift collection frames (ACF) in a size of 5.5 × 2.0 m, built in our previous spray deposition, drift, and mass balance study [30], were utilized for these trials.
Except for the test bench, ground petri dish and airborne drift collection frame were applied in order to measure ground spray drift and airborne spray drift, respectively. They were arranged according to the procedure used by Wang et al. [30]. Ten 15 cm diameter plastic petri dishes were placed at 3, 5, 10, 15, and 20 m from the edge of the treated field in the downwind direction. Several metal plates were arranged on the ground to carry the petri dishes, ensuring they remained on the same plane. A total of 50 ground petri dishes (GPD) were collected for each application. Additionally, three frames were positioned parallel to the UASS path with an interval of 5.0 m at 2.0 m downwind from the EOF. Airborne drift collectors, polyethylene (PE) tubes (2 mm in diameter and 2.0 m long), were fixed horizontally on the frame from a height of 0.5 m with an interval of 0.5 m. Thus, thirty PE tubes were obtained for each application.
In order to make full use of the stable natural wind, the artificial vineyard row was set in a northwest–southeast direction according to the local historical wind data, and the metal plates carrying the ground petri dishes and the test bench were arranged symmetrically on both sides of the artificial vineyard. The sampling layout could be quickly switched to start the subsequent trials when the wind direction was reversed. Weather data, such as wind speed and direction, as well as air temperature and relative humidity (RH), were recorded at a sample rate of 1 Hz using a three-dimensional ultrasonic anemometer WindMaster (Gill Instruments, New Milton, UK) and a weather sensor 350-XL (Testo SE & Co. KGaA, Titisee-Neustadt, Germany) mounted 2 m above the ground.
Figure 3. UASS spray drift measurement arrangement using three types of collectors: test bench, ground petri dish and airborne collection frame, and an artificial vineyard [30].
Agronomy 13 00270 g003

2.4. Experimental Methodology

In this work, we performed 13 tests for each nozzle type using the eight-rotor UAV sprayer MG-1P. Thus, twenty-six trials were totally conducted at wind speed from 1.61 m s−1 to 5.22 m s−1 and classified into three wind speed ranges: lower wind speed (LWS, <3.0 m s−1), medium wind speed (MWS, 3.0 ≤ 4.0 m s−1), and higher wind speed (HWS, ≥4.0 m s−1). The flight height of UASS was 3.5 m above the ground and 1.5 m above the top of the artificial canopy. A fluorescent tracer dye pyranine (Simon & Werner, Germany) was dissolved in tap water at a concentration of 0.1% to prepare the spray liquid. The pyranine aqueous solution was sprayed at a pressure of 0.3 MPa during all trials. Spray drift measurements in this study were conducted in acceptable atmospheric conditions in the following ranges: (a) wind speeds of at least 1.0 m s−1 and no more than 10% of wind speed measurements should be less than this value; (b) mean wind direction at 90° ± 30° to the UASS flight routes and no more than 30% of results shall be 90° ± 45°; and (c) temperatures of 5–35 °C.
Even if Grella et al. [28] suggested to use the test bench in nearly absence of wind, and more recently, authors found better results carrying trials indoors [31], due to the detrimental effect of environmental variables [24]; all experimental procedures were in according with both ISO 22866 standard [13] and our previous study in 2021 [30], and details would not be repeated in this paper. The test bench control system was activated to open the sliding cover while the UASS was in operation 20 m prior to the collector array. The test bench was then closed after the first route was performed, and only sampled the droplets from the first route, while the ground petri dishes and the airborne tubes collected the spray drift from all three passes during the application process. A four-rotor drone PHANTOM 4 PRO (SZ DJI Technology Co., Ltd., Shenzhen, China), equipped with a complementary metal-oxide-semiconductor (CMOS) sensor, with a size of 1 inch and a resolution of 20 megapixels, was hovering at 30 m height to record the whole process of flight. All samplers for spray drift were collected within less than 10 min after each test and stored in a box protected from light exposure in order to minimize degradation.

2.5. Sample Processing

In the laboratory, each petri dish collected from the test bench and the ground plates was filled with 60 mL of deionized water and was oscillated for 10 min using an orbital shaker TS-1000 (Haimen Kylin-Bell Lab Instruments Co., Ltd., Nantong, China) at 200 r min−1 (Figure 4). For an airborne drift collector, 100 mL of deionized water was added into the Ziplock bag containing PE tube, and then the bag was placed in an ultrasonic cleaner KM-36C (KJM Lab Instruments, China) for 5 min. The absorption of the tracer eluent was determined with a fluorescence spectrophotometer HITACHI F-2700 (Hitachi High-Technologies Corporation, Tokyo, Japan). The measuring configurations were set as follows: the voltage of 650 V; the excitation wavelength of 400 nm and emission wavelength of 505 nm; and the slit width of 15 nm.

2.6. Droplet Size Measurement

Based on the ISO standard 25358 [17], the droplet size spectrum was measured using a laser diffraction system SprayTec (Malvern Panalytical Ltd., Malvern, UK) in the College of Agricultural Unmanned System, China Agricultural University after field trials. The two types of tested nozzle were fixed 0.5 m above the analyzer between the laser transmitter and the receiver. The spray liquid same with field test was sprayed at 2.5, 3.0, and 4.0 bar with at least 5 valid replicates. The 10th percentile diameter (Dv0.1), VMD (Dv0.5), 90th percentile diameter (Dv0.9), relative span (RS), and spray volume fractions generated with droplets finer than 75, 100, and 200 μm (V75, V100, and V200) were obtained via Spraytec software for Windows V3.30 (Malvern Panalytical Ltd., Malvern, UK).

2.7. Calculation of Spray Drift Values

2.7.1. Spray Drift Percentage

According to ISO standards [13,15], the spray drift percentage (DP) accounted for the actual applied volume from the reading of the fluorimeter of each collector can be calculated in accordance with Equations (1)–(3).
D ij = ρ smpl ρ blk × V dil ρ spray × A col
DP ij = D ij D V / 100 × 100 %
D V = q × 10000 B × v × 60 × 100 %
where Di is the spray drift deposit on a single collector i of collector type j (μL·cm−2); DPij is the DP on a single collector i of collector type j (%); DV is the applied volume (L·ha−1); ρsmpl is the f1uorimeter reading of the sample; ρblk is the is the fluorimeter reading of the blank control; Vdil is the dilution liquid volume used to solute tracer from collector (L); ρspray is the fluorimeter reading of the tank sample; Acol is the collector area (cm2); q is the total flow rate (L·min−1); B is the swath width (m); and v is the flight speed (m·s−1).

2.7.2. Cumulative Drift Percentage

Cumulative drift percentages (CDP) of the three types of collector can be calculated according to Equation (4) [13]. For this study, CDPB and CDPG are the cumulative drift percentages obtained from the field drift test bench and the ground petri dish, respectively, while CDPA is the cumulative airborne drift percentage from the PE tube of the collection frame.
CDP j = a b DP x j dx
where CDPj is the cumulative drift percentage for the collector type j; x is the downwind distance from the EOF or the height from the ground (m); DP(x)j is the drift percentage as a function of downwind distance or height for the collector j (%); and a and b are the start and the end point of the sampling interval, respectively (m).

2.7.3. Drift Reduction Percentage

The drift reduction percentage (DRP, %) derived from CDP value was calculated via the following expression, according to the ISO 22369-1 [32].
DRP = 1 CDP tst CDP ref × 100 %
where CDPtst was the CDP value for each tested configuration; CDPref was the CDP value for the reference configuration, which is hollow cone nozzle trial for nozzle type comparison. The reduction class was also defined by the ISO 22369-1 as follows: A ≥ 99%, B 95 ≤ 99%, C 90 ≤ 95%, D 75 ≤ 90%, E 50 ≤ 75%, and F 25 ≤ 50%.

2.8. Statistical Analysis

All the statistical analyses were performed using IBM SPSS Statistics for Windows V22 (IBM Corp., Armonk, NY, USA). Both two-way and three-way analysis of variance (ANOVA) were applied to investigate the effects of downwind distance, nozzle type, and wind speed via the two different collectors. In all trials, the mean values were compared using the Duncan’s post hoc test. Statistical significance in all cases was when p < 0.05.

3. Results

3.1. Meteorology Conditions and UASS Operation Parameters

Table 1 presents mean values of meteorological conditions and actual operation parameters for each treatment and replicate. During field tests, the temperature ranged from 26.4 °C to 34.3 °C and the RH was between 11.8% and 35.5%. The average wind speed recorded was 1.61–5.22 m s−1, with an average wind direction (degrees from the ideal direction) between −35.4° and 42.6°. Field trials were classified into lower wind speed (HC1-HC4 and AI1-AI7), medium wind speed (HC5-HC10 and AI8-AI10), and higher wind speed (HC11-HC13 and AI11-AI13) according to the mean value of wind speed for further analysis. Consequently, atmospheric conditions monitored met the requirements of ISO standard [13].
From the operation video captured by the photograph drone, flight speed for most of trials ranged from 2.0 m s−1 to 2.2 m s−1, except for HC5, HC6, HC13, and AI9, with a bit higher speed. UASS’s total output was found between 1.21 L min−1 and 1.77 L min−1 for HC trials, and between 2.37 L min−1 and 3.29 L min−1 for AI trials. Therefore, the applied volume was achieved at 38.5–48.8 L ha−1 for HC trials and at 84.6–100.0 L ha−1 for AI trials, while higher flight speed contributed to lower applied volume for two trials (HC5: 35.5 L ha−1 and AI9: 67.5 L ha−1).

3.2. Droplet Size Spectrum

Table 2 shows the mean values of droplet size spectrum parameters Dv0.1, Dv0.5, Dv0.9, RS, V75, V100, V200, and the spray quality classification. Droplet size (Dv0.1, Dv0.5, and Dv0.9) varied with the nozzle type and the pressure. The highest value of VMD (408.4 μm) was obtained at 2.5 bar for HC, while the lowest value (94.6 μm) was obtained at 4.0 bar for AI, indicating a huge difference between these two nozzles. The RS values were found higher for AI (1.64) than HC (1.22). Huge differences were also found between the two nozzles for droplet size distribution parameters V75, V100, and V200, which were proven to be instructive indicators for evaluating spray drift potential in several publications [4,7,18,33]. For all the HC replicates, most of droplets were smaller than 200 μm in diameter (97.6%), and more than half (54.7%) of droplets have a size lower than 100 μm, and 31.8% of droplets were smaller than 75 μm in diameter. For the AI nozzle, V75 and V100 did not reach a proportion of 10%, and only about 20% of droplets had a diameter lower than 200 μm. The spray quality of the HC nozzle at 4.0 bar, and the AI nozzle at 2.5 and 3.0 bar was classified into three categories, ‘Very fine’ (VF), ‘Very Course’ (VC), and ‘Course’ (C), respectively.
Table 2. Droplet size spectrum and spray quality classification of the hollow cone nozzle and the air induction nozzle used in tests.
Nozzle Model Replicate No.Pressure (Bar)DV0.1 (μm)DV0.5 (μm)DV0.9 (μm)RSV75 (%)V100 (%)V200 (%)Spray Quality 1
TR 80-0067, HC1–134.045.594.6161.41.2231.854.797.6VF
IDK 120–015, AI1/2/3/5/132.5130.3408.4798.11.642.95.919.1VC
4/6/7/8/9/10/11/123.0124.8352.6702.91.643.16.123.0C
1 Spray quality was classified according to the ISO standard 25358: extremely fine (EF), VF, very fine (VF); fine (F); medium (M); coarse (C); very coarse (VC); extremely coarse (EC); and ultra coarse (UC) [17].

3.3. Spray Drift Percentage

The spray drift percentage profiles at different downwind distances obtained from the test bench using UASS with HC and AI nozzles at different wind speed ranges are shown in Figure 5. Regardless of which nozzle was assembled, drift percentage from TB mostly peaked at 2.0–5.0 m, and then declined sharply at 5.0–12.0 m downwind with a decreasing decay rate for medium and higher wind speed; under lower wind speed, DP peaked within 3.0 m, followed by a progressive decrease. In the case of the HC nozzle, the highest DP value at LWS ranged from 5% to 6% and DP dropped to less than 1% at 6.0–8.0 m. Buffer zone width can be simply estimated with the criterion that a maximum drift fallout of 1% was allowed, based on deltamethrin data by the Swedish EPA [34]. At MWS and HWS, the peak of DP both exceeded 10% (MWS: 11.9%; HWS: 13.8%), but large differences and poor repeatability between tests were found within a same wind speed range, highlighting the uncertainty of the field spray drift measurements; DP could not fall to less than 1% until the downwind distance reached 6.0 m or farther for most tests. Regarding the AI nozzle, DP values did not surpass 2% for LWS, 5% for MWS, and 8% for HWS, and decreased to less than 1% within 6.0 m. For both two-nozzle types, DP at LWS was obviously reduced at different downwind locations compared to MWS and HWS. In addition, it can be found from the flight parameters in Table 1 that UASS flied faster for HC5, HC13, and AI9, which may be the main factor leading to a higher DP. Moreover, lower spray drift percentage under HWS (AI13) could be obtained with a larger droplet size based on the droplet size spectrum results presented in Table 2.
Figure 6 shows the spray drift percentage profiles at different downwind distances obtained from the test bench using UASS with HC and AI nozzles at lower, medium, and higher wind speed. In all trials, the spray drift percentage decreased continuously from the EOF to 20 m downwind, with a sharp decline at the first 5 m and a steady decline after 10 m. Unlike the test bench, DP from GPD did not show a process of rising to a peak value and then falling. In terms of HC nozzle, at LWS, the maximum value of DP ranged from 4% to 8%, and DP fell to less than 1% at the distance range of 5–10 m; under MWS and HWS, the highest DP value rose to 7–16%, the value dropped below 1% at 15 m downwind or a farther distance. After the replacement of the AI nozzle, drift percentage at LWS did not exceed 2% and declined to below 1% within 5 m; DP at MWS and HWS increased but could not reach 7%, and decreased to less than 1% at 5–10 m. Similar to the TB results, the trial AI13 also had a better anti-drift performance under the highest lateral wind speed, and there was no obvious correlation between the drift value from GPD and the wind speed at the same WSR, as well.
Airborne spray drift percentage profiles at different heights obtained from the airborne collection frame for all the field trials are presented in Figure 7. In all tests, the highest DP was found at the bottom of the frame, and the DP value decreased sharply from 0.5 to 2.0 m above the ground. Even though within a same wind speed range, DP values varied a lot for different tests. With regard to HC nozzle, airborne DP for lower wind speed was found more than 100% near the ground and fell to less than 1% at the height of 2.5–4.0 m; DP for MWS and HWS increased markedly relative to LWS, with a peak value for HC9 close to 300% and values at all collected height more than 1% for HC5/6/7/9/13, implying the severe drift risk for fine droplets. In the case of the AI nozzle, the airborne drift was reduced significantly, with DP value below 7% at LWS and below 20% at MWS and HWS. Meanwhile, the measured airborne drift was also found to be higher for AI9 and lower for AI13, in accordance with the results from the TB and GPD.
The results obtained from the three-way ANOVA analysis are demonstrated in Table 3. The effects of crosswind speed range, nozzle type, and sampling position on DPs were extremely significant for all three techniques (p < 0.001), suggesting the abilities of TB, GPD, and ACF to describe spray drift percentage were generally consistent.

3.4. Cumulative Drift Percentage

Figure 8 provides cumulative drift percentages and drift values calculated from drift results obtained from test bench and ground petri dish with HC and AI nozzles at LWS, MWS, and HWS. The orders of the mean values under different combinations of wind speed and nozzle type measured by the three methods were basically the same. Higher CDP values were observed for HC-HWS and HC-MWS trials, followed by HC-LWS, AI-MWS, and AI-HWS with similar values, and the lowest CDP was always found for AI-LWS. The mean CDP of both HC-HWS and HC-MWS were significantly higher than the other configurations, and no significant difference was found between any other two configurations. With respect to ACF, the CDP values with the HC nozzle were much higher than the other two collection methods at the corresponding wind speeds (at least three times the values obtained from TB and PD). However, this huge difference was not presented when AI nozzles were used, although higher mean CDP was even found at MWS instead of HWS, in agreement with the GPD results.
The two-way ANOVA results for CDPs as affected by wind speed and nozzle type via the three measuring techniques in Table 4 show that WSR had a significant influence on CDP value obtained from both TB and GPD (p < 0.05), but its effect on airborne CDP was not significant (p > 0.05), while a good significant relationship was found between nozzle type and CDP values measured via all three collectors (p < 0.01).

3.5. Drift Reduction Percentage

Comparisons of drift reduction results calculated using CDP between the HC and AI nozzle obtained from the three types of collectors can be seen in Table 5. Regardless of tested wind speed, the highest drift reduction percentage was always found for the airborne collection frame, followed by the test bench and the ground petri dish. For sedimenting drift, DRP results show lower values (less than 70%) at medium and higher wind speeds (>3.0 m/s), indicating a better anti-drift performance was usually achieved at lower wind speed when using the AI nozzle. However, there is not any similar trend for airborne spray drift, and the AI nozzle can save 84.4–94.6% of spray drift compared to the HC nozzle.

3.6. Correlation Analysis Results

The results of the correlational analysis between CDP values and meteorology parameters for the two different nozzle type are presented in Figure 9 and Table A1. For HC nozzles, CDP measured by all three techniques showed a significant positive correlation with wind speed (p < 0.05, ρ > 0), i.e., the higher the wind speed, the higher the cumulative drift percentage. In terms of relative humidity (RH) and wind direction, significant correlations were only observed with the airborne CDP. The airborne CDP, meanwhile, increased as the RH decreased (p < 0.05, ρ < 0) and as the degree from the ideal wind direction increased (p < 0.05, ρ > 0), as well. For AI nozzles, both ground and bench values were significantly positively correlated with wind speed (p < 0.05, ρ > 0), except for airborne percentage. There was a significant negative correlation between CDP value and RH for all three types of collectors (p < 0.05, ρ < 0), consistent with the airborne drift results of HC nozzles. In general, under the test conditions of this study, the correlations between CDPs and crosswind speed and RH were more pronounced, and significant positive and negative correlations were presented, respectively. No relationships (p > 0.05) were detected between CDP values and temperature for all settings in this study, and there was no significant correlation (p > 0.05) between CDP and wind direction under most of circumstances. Correlations between CDPs achieved from two ground collectors and meteorological parameters were comparable. By contrast, the correlation results of airborne drift differed due to the differences in the behaviors and distribution characteristics of airborne droplets.
In addition, Table 6 provides the intercorrelations among the three types of collectors for spray drift. For HC nozzle trials, there was only a significant positive correlation between CDP values obtained from TB and those from GPD (p < 0.01, ρ > 0), but no significant correlation was found between TB results and ACF results and between GPD results and ACF results (p > 0.05). For AI nozzle trials, all three combinations of results were found to be significantly positive correlated with each other (p < 0.01, ρ > 0), showing a good consistency of CDP value for the three types of collectors. Overall, these results suggest that the correlation between each two-drift assessment technique differed when using different types of nozzles.

4. Discussion and Conclusions

Filed drift measurements using the three techniques prove that the test bench is also promising for direct drift determination of the unmanned aerial sprayer in windy conditions (higher than 1 m/s), in addition to being used for spray drift potential evaluation of boom sprayers and airblast sprayers when used in nearly absence of wind. The described methodology enabled classification of different UAV sprayer configurations.
Regarding the distribution characteristics of spray deposition percentage, the results measured by the three collectors were generally consistent, i.e., higher wind speeds and finer droplets produced higher DP values and longer safe downwind distances or higher safe heights. These results are in agreement with those obtained in previous studies related to UASS spray drift [8,30,35]. However, unlike ground petri dish, DP from test bench showed a process of rising to a peak value and then falling under high wind speeds, and meanwhile, in the case of collecting only one route’s spray drift, did not decrease substantially. This result may be explained by the fact that the sampling interval of TB is small and more samples can be obtained for each test. Even though only a single route was collected, a larger amount of direct drifted droplets could be captured to make up for the shortfall in total applied volume, reflecting a higher collection efficiency of the field test bench.
Similar to the DP results, wind speed range and nozzle type had a significant effect on the CDP value measured by the three techniques. Particularly, the WSR did not affect the airborne CDP value significantly, and the aerial CDP of the HC nozzle was very high, at least three times the values obtained from the other two techniques and six times the AI nozzle results. A possible explanation for these results may be fine droplet behaviors. Fine droplets tend to float in the air, and at a downwind distance of more than 2 m, most of airborne spray would be in droplets < 100 μm [36]. Moreover, the collection efficiency of the PE tube for small droplets produced by the HC nozzle is considerably higher than that for large droplets from the AI nozzle. This leads to a too high airborne drift result for the HC nozzle, so the significant correlation between WSR and airborne CDP cannot be distinguished in the two-way ANOVA.
For sedimenting DRP results, a better anti-drift performance was usually achieved at lower wind speed when changing nozzles to provide a coarser spray. However, the findings of the current study do not support the previous research [29,37,38]. This study defined three wind speed ranges. Lower spray drift was observed at low wind speeds, but when the crosswind speed increased to 3.0 m/s, the effect of increased wind speed on the increased drift value was not obvious. Tiny difference could be obtained between MWS and HWS, and AI nozzle’s CDP measured by the GPD at MWS was even higher than that at HWS. This resulted in a decrease in the DRP value when the wind speed increased. However, more replicates are needed to verify whether this result is generalizable.
In general, both wind speed and humidity had significant effects on UASS spray drift at different droplet sizes (Figure 9 and Table A1). The faster the wind speed and the lower the humidity, the higher the drift value. These results are in line with those of previous studies [4,39,40,41,42]. Furthermore, the correlations between the ground drift values and various meteorological factors were consistent for TB and GPD, demonstrating the feasibility of using TB to describe the ground drift characteristics. It is noteworthy that the two ground CDPs were not correlated with RH for the HC nozzle’s fine spray, while a significant negative correlation was found for the AI nozzle’s coarse spray. This could be attributed to the combined effects of droplet size and humidity. Under the tested low humidity conditions (11.8–35.5%), fine droplets evaporate faster, but they have longer settling time, so regardless of how the RH changes, ground collector cannot collect those evaporated droplets. Conversely, for coarse droplets with a longer lifetime, evaporation would bring a reduction in droplet size during movement, increasing the amount of drift [43]. In addition, the ACF is closer to where the droplet is released, and the fine droplets are not completely evaporated when reaching the collector, so the amount of evaporation is still directly related to the humidity. Moreover, as another important factor impacting droplet evaporation, temperature has no significant correlation with CDP values in this study (Table A1). This may be due to the narrow range of the temperature change during the field tests (<10 °C).
With respect to the discordance of the correlation among CDPs obtained from different collectors, there was no significant correlation between sedimenting drift value (TB or GPD) and airborne drift value (ACF) when using HC nozzles (Table 6). These results may be explained by the fact that fine droplets are prone to suspend in the air, drift with the wind, and evaporate, and then the number of droplets can be collected under the influence of changing meteorological conditions is also varying. The trends of the spray drift distribution between the ground and the airborne collector are unlikely to be coincident. Nevertheless, almost all droplets produced by AI nozzle sizes are greater than 100 μm (Table 2). Coarse droplets tend to sediment quickly, so the majority of drifting droplets can be sampled by ground and airborne collectors.
In summary, the test bench can be closed in time after the end of one route’s operation to reduce dust contamination and avoid downwash airflow interference during tests, and the airborne frame has similar advantages. In addition, the TB has higher collection efficiency and reflects drift characteristics at a close downwind distance more comprehensively, making the influence of different factors on the droplet distribution more obvious. Therefore, the use of TB and ACF is able to diminish the sampling distance when comparing the drift risk of different sprayers and configurations, which can not only reduce the requirements for the test site, but also improve the efficiency of the field test.
The external meteorological conditions normally have a serious impact on the completion of the field trials, which eventually leads to a reduction in the number of valid replicates. In this study, more than 20 trials were conducted for each nozzle, but those trials that did not meet the requirements of meteorological conditions, flight parameters, and applied volume were discarded after careful evaluation. Therefore, the accuracy of the field drift tests need to be improved in the further study by increasing the number of tests, finding sites with more stable meteorological conditions, and strengthening pre-planning and inspection during the tests. However, field drift test conditions are ultimately uncontrollable, and direct measurements consume too much time, labor, and material costs. Further work is required to explore the applicability and feasibility of TB in determining spray drift potential of UASS under static wind conditions. A part of experiments was conducted and the results are being processed and analyzed. It can be expected that TB used in this method will further reduce the test conditions required for the UASS drift evaluation.

Author Contributions

Conceptualization, C.W. and X.H.; methodology, C.W., S.W., Z.H. and A.Z.; software, C.W. and L.H.; validation, C.W., C.Y. and J.Z.; formal analysis, C.W.; investigation, W.S.; resources, C.W. and X.H.; data curation, C.W. and A.Z.; writing—original draft preparation, C.W.; writing—review and editing, X.H.; visualization, C.W.; supervision, X.H.; project administration, X.H.; funding acquisition, C.W. and X.H. All authors have read and agreed to the published version of the manuscript.

Funding

This study was supported by the earmarked fund for Project 32202343 supported by National Natural Science Foundation of China, China Agriculture Research System (CARS-28), Chinese Universities Scientific Fund (Grant No. 2022TC128), and the 2115 Talent Development Program of China Agricultural University.

Data Availability Statement

The data presented in this study are available upon request from the corresponding author.

Acknowledgments

The authors would like to thank Yi Yang of Beijing TT Aviation Technology Co. Ltd., Andreas Herbst of Julius Kühn Institute, Tian Li and all other staff of CCAT and CAUS, China Agricultural University for their great contributions to this work.

Conflicts of Interest

The authors declare no conflict of interest.

Appendix A

ISO 22866: This International Standard establishes principles for the measurement of droplet drift from all types of equipment designed for applying plant protection products. Detailed specifications relate to tractor-mounted, trailed, and self-propelled agricultural sprayers operating in arable field crops (boom sprayers) and in bush and tree (including vines, hops, and fruit) crops (including broadcast air-assisted sprayers).
ISO 22856: This International Standard establishes general principles for the measurement of spray drift potential in wind tunnels under controlled laboratory conditions, and it is applicable where comparative assessment or classification of the relative spray drift potential from spray generators or spray liquids is needed.
ISO 22401: This International Standard provides a test method to measure spray sedimentation from horizontal boom sprayers using a test bench. The sedimentation measure gives a value for potential spray drift. These measurements can be used to compare different sprayer setups on the same sprayer.
ISO 25358: This standard specifies procedures for classifying droplet size spectra from atomizers used in spraying for crop protection. It provides a reference system for defining classes of droplet size spectra. Depending on their function principle and individual setup, measuring systems for droplet sizing can give different results. This document provides a means of comparing measured droplet size spectra to reference spectra and enables relative comparisons of droplet size spectra obtained from different measuring systems.
ISO 22369: All parts specify the drift classification of spraying equipment. ISO 22369-1 defines the spray drift reduction classes. The other parts specify the test procedures. The object of these standards is to provide uniform procedures for the determination of the drift reducing performance of spraying equipment.

Appendix B

Table A1. Relationships among cumulative drift percentages (respectively, test bench, ground petri dish, airborne collection frame) and meteorology characteristics (temperature, relative humidity, wind speed, and wind direction) for each nozzle’s 13 field trials (n = 13).
Nozzle TypeCDP SourceTemperatureRelative HumidityWind SpeedWind Direction
p (>F)Sign. aΡ bp (>F)Sign.ρp(>F)Sign.ρp (>F)Sign.ρ
HCTB0.576NS0.1710.514NS−0.1990.045*0.5640.188NS0.539
GPD0.431NS0.2390.319NS−0.3000.031*0.5980.134NS0.663
ACF0.685NS0.1250.029*−0.6040.018*0.6400.032*0.596
AITB0.808NS−0.0750.038*−0.5790.002**0.7710.962NS0.015
GPD0.746NS−0.1000.044*−0.5650.038*0.5790.447NS−0.231
ACF0.984NS−0.0060.038*−0.5800.070NS0.5170.471NS−0.220
a Statistical significance level: NS p > 0.05, * p < 0.05, ** p < 0.01. b Pearson’s coefficient of correlation.

References

  1. He, X. Rapid development of unmanned aerial vehicles (UAV) for plant protection and application technology in China. Outlooks Pest Manag. 2018, 29, 162–167. [Google Scholar] [CrossRef]
  2. He, X.; Bonds, J.; Herbst, A.; Langenakens, J. Recent development of unmanned aerial vehicle for plant protection in East Asia. Int. J. Agric. Biol. Eng. 2017, 10, 18–30. [Google Scholar] [CrossRef]
  3. Wang, C.; Liu, Y.; Zhang, Z.; Han, L.; Li, Y.; Zhang, H.; Wongsuk, S.; Li, Y.; Wu, X.; He, X. Spray performance evaluation of a six-rotor unmanned aerial vehicle sprayer for pesticide application using an orchard operation mode in apple orchards. Pest Manag. Sci. 2022, 78, 2449–2466. [Google Scholar] [CrossRef]
  4. Wang, X.; He, X.; Wang, C.; Wang, Z.; Li, L.; Wang, S.; Bonds, J.; Herbst, A.; Wang, Z. Spray drift characteristics of fuel powered single-rotor UAV for plant protection. Trans. Chin. Soc. Agric. Eng. Trans. CSAE 2017, 33, 117–123. [Google Scholar] [CrossRef]
  5. Wang, X.; He, X.; Song, J.; Wang, Z.; Wang, C.; Wang, S.; Wu, R.; Meng, Y. Drift potential of UAV with adjuvants in aerial applications. Int. J. Agric. Biol. Eng. 2018, 11, 54–58. [Google Scholar] [CrossRef] [Green Version]
  6. Wang, C.; He, X.; Wang, X.; Wang, Z.; Wang, S.; Li, L.; Bonds, J.; Herbst, A.; Wang, Z. Testing method and distribution characteristics of spatial pesticide spraying deposition quality balance for unmanned aerial vehicle. Int. J. Agric. Biol. Eng. 2018, 11, 18–26. [Google Scholar] [CrossRef] [Green Version]
  7. Wang, C.; Zeng, A.; He, X.; Song, J.; Herbst, A.; Gao, W. Spray drift characteristics test of unmanned aerial vehicle spray unit under wind tunnel conditions. Int. J. Agric. Biol. Eng. 2020, 13, 13–21. [Google Scholar] [CrossRef]
  8. Herbst, A.; Bonds, J.; Wang, Z.; Zeng, A.; He, X.; Goff, P. The influence of unmanned agricultural aircraft s ystem design on spray drift. J. Kult. 2020, 72, 1–11. [Google Scholar] [CrossRef]
  9. Wang, G.; Han, Y.; Li, X.; Andaloro, J.; Chen, P.; Hoffmann, W.C.; Han, X.; Chen, S.; Lan, Y. Field evaluation of spray drift and environmental impact using an agricultural unmanned aerial vehicle (UAV) sprayer. Sci. Total Environ. 2020, 737, 139793. [Google Scholar] [CrossRef]
  10. Brown, C.R.; Giles, D.K. Measurement of pesticide drift from unmanned aerial vehicle application to a vineyard. Trans. ASABE 2018, 61, 1539–1546. [Google Scholar] [CrossRef]
  11. Li, L.; Hu, Z.; Liu, Q.; Yi, T.; Han, P.; Zhang, R.; Pan, L. Effect of flight velocity on droplet deposition and drift of combined pesticides sprayed using an unmanned aerial vehicle sprayer in a peach orchard. Front. Plant Sci. 2022, 13, 981494. [Google Scholar] [CrossRef]
  12. Biglia, A.; Grella, M.; Bloise, N.; Comba, L.; Mozzanini, E.; Sopegno, A.; Pittarello, M.; Dicembrini, E.; Alcatrão, L.E.; Guglieri, G.; et al. UAV-spray application in vineyards: Flight modes and spray system adjustment effects on canopy deposit, coverage, and off-target losses. Sci. Total Environ. 2022, 845, 157292. [Google Scholar] [CrossRef] [PubMed]
  13. ISO 22866; Equipment for Crop Protection—Methods for Field Measurement of Spray Drift. ISO: Geneva, Switzerland, 2005.
  14. ISO 22856; Equipment for Crop Protection—Methods for the Laboratory Measurement of Spray Drift—Wind Tunnels. ISO: Geneva, Switzerland, 2008.
  15. ISO 22401; Equipment for Crop Protection—Method for Measurement of Potential Spray Drift from Horizontal Boom Sprayers by the Use of a Test Bench. ISO: Geneva, Switzerland, 2015.
  16. Douzals, J.-P.; Tinet, C.; Goddard, R. Use of a flexible drop counter for a better comparability of potential spray drift measurement protocols in wind tunnels. Asp. Appl. Biol. Int. Adv. Pestic. Appl. 2018, 137, 277–284. [Google Scholar]
  17. ISO 25358; Crop Protection Equipment-Droplet-Size Spectra from Atomizers—Measurement and Classification. ISO: Geneva, Switzerland, 2018.
  18. Van de Zande, J.C.; Holterman, H.J.; Wenneker, M. Nozzle Classification for Drift Reduction in Orchard Spraying; Identification of Drift Reduction Class Threshold Nozzles. Agric. Eng. Int. CIGR E J. 2008, X, 253–260. [Google Scholar] [CrossRef]
  19. Sousa Alves, G.; Kruger, G.R.; da Cunha, J.P.A.R.; Vieira, B.C.; Henry, R.S.; Obradovic, A.; Grujic, M. Spray Drift from Dicamba and Glyphosate Applications in a Wind Tunnel. Weed Technol. 2017, 31, 387–395. [Google Scholar] [CrossRef]
  20. Brusselman, E.; Van Driessen, K.; Steurbaut, W.; Gabriels, D.; Cornelis, W.; Nuyttens, D.; Sonck, B.; Baetens, K.; Nicolai, B.; Verboven, P.; et al. Wind tunnel evaluation of several tracer and collection techniques for the measurement of spray drift. Commun. Agric. Appl. Biol. Sci. 2004, 69, 829–836. [Google Scholar] [CrossRef] [Green Version]
  21. Torrent, X.; Garcerá, C.; Moltó, E.; Chueca, P.; Abad, R.; Grafulla, C.; Román, C.; Planas, S. Comparison between standard and drift reducing nozzles for pesticide application in citrus: Part I. Effects on wind tunnel and field spray drift. Crop Prot. 2017, 96, 130–143. [Google Scholar] [CrossRef] [Green Version]
  22. Balsari, P.; Marucco, P.; Tamagnone, M. A test bench for the classification of boom sprayers according to drift risk. Crop Prot. 2007, 26, 1482–1489. [Google Scholar] [CrossRef]
  23. Wang, X.; He, X.; Herbst, A.; Langenakens, J.; Zheng, J.; Li, Y. Development and performance test of spray drift test system for sprayer with bart. Trans. Chin. Soc. Agric. Eng. Trans. CSAE 2014, 30, 55–62. [Google Scholar] [CrossRef]
  24. Gil, E.; Gallart, M.; Balsari, P.; Marucco, P.; Almajano, M.P.; Llop, J. Influence of wind velocity and wind direction on measurements of spray drift potential of boom sprayers using drift test bench. Agric. For. Meteorol. 2015, 202, 94–101. [Google Scholar] [CrossRef] [Green Version]
  25. Nuyttens, D.; Zwertvaegher, I.; Dekeyser, D. Comparison between drift test bench results and other drift assessment techniques. Int. Adv. Pestic. Appl. Appl. Biol. 2014, 122, 293–302. [Google Scholar]
  26. Nuyttens, D.; Zwertvaegher, I.K.A.; Dekeyser, D. Spray drift assessment of different application techniques using a drift test bench and comparison with other assessment methods. Biosyst. Eng. 2017, 154, 14–24. [Google Scholar] [CrossRef]
  27. Balsari, P.; Gil, E.; Marucco, P.; van de Zande, J.C.; Nuyttens, D.; Herbst, A.; Gallart, M. Field-crop-sprayer potential drift measured using test bench: Effects of boom height and nozzle type. Biosyst. Eng. 2017, 154, 3–13. [Google Scholar] [CrossRef] [Green Version]
  28. Grella, M.; Gil, E.; Balsari, P.; Marucco, P.; Gallart, M. Advances in developing a new test method to assess spray drift potential from air blast sprayers. Span. J. Agric. Res. 2017, 15, e0207. [Google Scholar] [CrossRef] [Green Version]
  29. Grella, M.; Marucco, P.; Balsari, P. Toward a new method to classify the airblast sprayers according to their potential drift reduction: Comparison of direct and new indirect measurement methods. Pest Manag. Sci. 2019, 75, 2219–2235. [Google Scholar] [CrossRef]
  30. Wang, C.; Herbst, A.; Zeng, A.; Wongsuk, S.; Qiao, B.; Qi, P.; Bonds, J.; Overbeck, V.; Yang, Y.; Gao, W.; et al. Assessment of spray deposition, drift and mass balance from unmanned aerial vehicle sprayer using an artificial vineyard. Sci. Total Environ. 2021, 777, 146181. [Google Scholar] [CrossRef]
  31. Grella, M.; Marucco, P.; Manzone, M.; Gallo, R.; Mazzetto, F.; Balsari, P. Indoor test bench measurements of potential spray drift generated by multi-row sprayers. In Proceedings of the 2021 IEEE International Workshop on Metrology for Agriculture and Forestry, Trento, Italy, 3–5 November 2021; pp. 356–361. [Google Scholar] [CrossRef]
  32. ISO 22369-1; Crop Protection Equipment—Drift Classification of Spraying Equipment—Part 1: Classes. ISO: Geneva, Switzerland, 2006.
  33. Tang, Q.; Zhang, R.; Xu, M.; Xu, G.; Yi, T.; Zhang, B.; Chen, L. Droplet spectra and high-speed wind tunnel evaluation of air induction nozzles. Front. Agric. Sci. Eng. 2018, 5, 442–454. [Google Scholar] [CrossRef]
  34. Nilsson, E.; Svensson, S.A. Buffer zones when using plant protection products—A Swedish approach. Annu. Rev. Agric. Eng. 2005, 4, 143–150. [Google Scholar]
  35. Hunter, J.E.; Gannon, T.W.; Richardson, R.J.; Yelverton, F.H.; Leon, R.G. Coverage and Drift Potential Associated with Nozzle and Speed Selection for Herbicide Applications using an Unmanned Aerial Sprayer. Weed Technol. 2019, 34, 235–240. [Google Scholar] [CrossRef]
  36. Miller, P. Spray drift and its measurement. In Application Technology for Crop Protection; Matthews, G.A., Hislop, E.C., Eds.; Centre for Agricultural Bioscience International: Wallingford, UK, 1993; pp. 101–122. [Google Scholar]
  37. Bird, S.L.; Esterly, D.M.; Perry, S.G. Off-Target Deposition of Pesticides from Agricultural Aerial Spray Applications. J. Environ. Qual. 1996, 25, 1095–1104. [Google Scholar] [CrossRef]
  38. Grella, M.; Gallart, M.; Marucco, P.; Balsari, P.; Gil, E. Ground Deposition and Airborne Spray Drift Assessment in Vineyard and Orchard: The Influence of Environmental Variables and Sprayer Settings. Sustainability 2017, 9, 728. [Google Scholar] [CrossRef] [Green Version]
  39. Miller, D.R.; Yendol, W.E.; Ducharme, K.M.; Maczuga, S.; Reardon, R.C.; McManus, M.A. Drift of aerially applied diflubenzuron over an oak forest. Agric. For. Meteorol. 1996, 80, 165–176. [Google Scholar] [CrossRef]
  40. Miller, D.R.; Stoughton, T.E. Response of spray drift from aerial applications at a forest edge to atmospheric stability. Agric. For. Meteorol. 2000, 100, 49–58. [Google Scholar] [CrossRef]
  41. Parkin, C.S.; Walklate, P.J.; Nicholls, J.W. Effect of drop evaporation on spray drift and buffer zones. In Proceedings of the BCPC International Conference—Crop Science and Technology 3C-3, Glasgow, UK, 10–12 November 2003; BCPC: Farnham, UK; pp. 261–266.
  42. Nuyttens, D.; de Schampheleire, M.; Steurbaut, W. Experimental study of factors influencing the risk of drift from field sprayers. Part 1: Meteorological conditions. Int. Adv. Pestic. Appl. Asp. Appl. Biol. 2006, 77, 321–329. [Google Scholar]
  43. Spillman, J.J. Evaporation from freely falling droplets. Aeronaut. J. 1984, 88, 181–185. [Google Scholar] [CrossRef]
Figure 1. DJI AGRAS MG-1P UASS applied in spray drift tests.
Agronomy 13 00270 g001
Figure 2. Field drift test bench and artificial collectors for UASS spray drift measurement.
Agronomy 13 00270 g002
Figure 4. Sample processing procedures of UASS spray drift collectors.
Agronomy 13 00270 g004
Figure 5. Spray drift percentage profiles obtained from the test bench using UASS with HC and AI nozzles at lower wind speed (LWS, <3.0 m s−1), medium wind speed (MWS, 3.0 ≤ 4.0 m s−1), and higher wind speed (HWS, ≥4.0 m s−1).
Agronomy 13 00270 g005
Figure 6. Spray drift profiles obtained from the ground petri dish using UASS with HC and AI nozzles at LWS, MWS, and HWS.
Agronomy 13 00270 g006
Figure 7. Airborne spray drift profiles obtained from the airborne drift collection frame using UASS with HC and AI nozzles at LWS, MWS, and HWS.
Agronomy 13 00270 g007
Figure 8. Cumulative drift percentage in mean ± standard error obtained from test bench, ground petri dish, and airborne collection frame with HC and AI nozzles at LWS, MWS, and HWS. Different letters above the bars represent significant differences among different configurations for each measuring method (Duncan test, α = 0.05).
Agronomy 13 00270 g008
Figure 9. Heat map of Pearson’s coefficient correlation among cumulative drift percentages (respectively, test bench, ground petri dish, and airborne collection frame) and meteorology characteristics (temperature, relative humidity, wind speed, and wind direction).
Agronomy 13 00270 g009
Table 1. Meteorological conditions and experimental parameters of all spray drift tests.
Treatment and ReplicatesTemperature (°C)Relative Humidity (%)Wind Speed (m·s−1)Wind Direction (Degrees from the Ideal Direction)Total Output (L min−1)Flight Speed (m·s−1)Applied Volume (L·ha−1)
HC133.9 33.02.19−1.51.772.1545.7
HC234.131.52.1928.81.212.1347.3
HC332.433.82.634.91.212.1048.1
HC433.2 25.72.652.81.212.1646.6
HC531.718.73.153.71.243.0833.5
HC629.913.43.2828.71.242.6838.5
HC734.1 28.93.3538.41.772.1645.5
HC832.2 30.63.819.41.772.0947.0
HC933.1 29.13.9331.21.772.1645.5
HC1032.2 31.43.9722.41.772.1246.3
HC1133.7 20.94.7731.01.212.1147.9
HC1231.2 23.75.1123.91.212.0748.8
HC1332.316.85.2242.61.242.6139.6
AI130.335.11.61−25.13.292.1684.6
AI230.2 35.51.75−16.93.292.1286.2
AI332.0 32.91.96−25.43.292.1186.4
AI434.2 17.12.32−32.52.372.0596.2
AI533.634.72.59−35.43.292.1585.0
AI634.3 19.42.6515.82.372.0497.0
AI733.7 16.92.82−12.22.372.0098.6
AI831.6 11.83.79−35.32.402.00100.0
AI930.7 14.43.89−23.32.402.9667.5
AI1034.2 17.13.936.32.372.1293.0
AI1132.3 18.14.416.32.372.1193.8
AI1233.313.04.43−16.42.402.00100.0
AI1326.422.64.4835.93.292.0091.4
Table 3. Significance obtained from three-way ANOVAs for DPs as affected by wind speed, nozzle type, and sampling position (downwind distance or height above the ground) using UASS based on test bench, ground petri dish, and airborne collection frame.
Sources of VariationTest BenchGround Petri DishAirborne Collection Frame
p (>F)Sign.p (>F)Sign.p (>F)Sign.
Wind speed range (WSR)0.000*** 1, 20.000***0.000***
Nozzle type (NT)0.000***0.000***0.000***
Sampling position (SP)0.000***0.000***0.000***
WSR × NT0.000***0.001**0.000***
WSR × SP0.000***0.000***0.013*
NT × SP0.000***0.000***0.000***
WSR × NT × SP1.000NS0.880NS0.174NS
1 Statistical significance level: NS p > 0.05, * p < 0.05, ** p < 0.01, and *** p < 0.001; 2 0.000 represents p value lower than 10−4.
Table 4. Significance obtained from two-way ANOVAs for CDPB, CDPG, and CDPA, as affected by wind speed, nozzle type based on test bench, ground petri dish, and airborne drift collection frame.
Sources of VariationCDPBCDPGCDPA
p (>F)Sign.p (>F)Sign.p (>F)Sign.
Wind speed range (WSR)0.016* 10.029* 0.243NS
Nozzle type (NT)0.000*** 20.001**0.000***
WSR × NT0.166NS0.746NS0.387NS
1 Statistical significance level: NS p > 0.05, * p < 0.05, ** p < 0.01, and *** p < 0.001; 2 0.000 represents p value lower than 10−4.
Table 5. Drift reduction percentage and classification when using the AI nozzle based on test bench, ground petri dish and airborne collection frame for the tested wind speed ranges.
DRP SourceWind Speed RangeDRP (%) aReduction Class b
Test benchLWS78.1D
MWS66.2E
HWS63.1E
Ground petri dishLWS60.7E
MWS9.2None
HWS43.4F
Airborne collection frameLWS94.2C
MWS84.4D
HWS94.6C
a Drift reduction percentage values were calculated based on the HC treatment as the reference configuration. b Classification determined by ISO 22369-1: A ≥ 99%, B 95 ≤ 99%, C 90 ≤ 95%, D 75 ≤ 90%, E 50 ≤ 75%, and F 25 ≤ 50%.
Table 6. Correlation among CDP values obtained from different collectors (respectively, test bench, ground petri dish, and airborne collection frame) for the HC and AI nozzle.
Nozzle TypeTB and GPDTB and ACFGPD and ACF
p (>F)Sign.aρ bp (>F)Sign.ρp (>F)Sign.ρ
HC0.001**0.8120.134NS0.4380.069NS0.519
AI0.001**0.8160.005**0.7290.000***0.946
a Statistical significance level: NS p > 0.05, ** p < 0.01, and *** p < 0.001. b Pearson’s coefficient of correlation.
Disclaimer/Publisher’s Note: The statements, opinions and data contained in all publications are solely those of the individual author(s) and contributor(s) and not of MDPI and/or the editor(s). MDPI and/or the editor(s) disclaim responsibility for any injury to people or property resulting from any ideas, methods, instructions or products referred to in the content.

