Article

Methodology for Olive Fruit Quality Assessment by Means of a Low-Cost Multispectral Device

Centro de Investigación en Tecnología, Energía y Sostenibilidad (CITES), Universidad de Huelva, La Rábida, Palos de la Frontera, 21819 Huelva, Spain
*
Author to whom correspondence should be addressed.
Agronomy 2022, 12(5), 979; https://doi.org/10.3390/agronomy12050979
Submission received: 16 March 2022 / Revised: 13 April 2022 / Accepted: 15 April 2022 / Published: 19 April 2022

Abstract

:
The standard methods for determining the quality of olives involve chemical methods that are time-consuming and expensive. These limitations lead growers to homogeneous harvesting based on subjective criteria such as intuition and visual decisions. In recent times, precision agriculture techniques for fruit quality assessment, such as spectroscopy, have been introduced. However, they require expensive equipment, which limit their use to olive mills. This work presents a complete methodology based on a new low-cost multispectral sensor for assessing quality parameters of intact olive fruits. A set of 507 olive samples were analyzed with the proposed device. After data pre-processing, artificial neural network (ANN) models were trained using the 18 reflectance signals acquired by the sensor as input and three olive quality indicators (moisture, acidity, and fat content) as targets. The responses of the ANN models were promising, reaching coefficient-of-determination values of 0.78, 0.86, and 0.62 for fruit moisture, acidity, and fat content, respectively. These results show the suitability of the proposed device for assessing the quality status of intact olive fruits. Its performance, along with its low cost and ease of use, paves the way for the implementation of an olive fruit quality appraisal system that is more affordable for olive growers.

1. Introduction

Olea europaea L. is one of the most important fruit trees cultivated in the Mediterranean basin, where it has been a socio-economic engine. Nowadays, it continues to constitute an economic support for rural areas. In fact, in 2018, European olive groves extended for more than 5 Mha, yielding a production of 13.7 Mt of olives, which represented approximately 65% of the worldwide production that year [1].
Traditionally, olive cultivation has been characterized by limited technological support. Nevertheless, in the last decades, the sector has experienced a modernization aimed at increasing orchard profitability. A key milestone of this evolution has been the conversion of non-irrigated orchards into intensive and super-high-density (SHD) hedgerow systems. In this context, precision agriculture techniques have been introduced in the sector, resulting in modern olive orchards. These new crops are usually drip-irrigated, kept under no-tillage techniques, and planted with quick-growing young olive plantings in rows, allowing for mechanized harvesting [2]. Thus, due to an increase in mechanization and automation, olive orchards with higher yields per ha and reduced managing costs have emerged. However, some production stages still need optimization; a good example of this is the decision of the optimum harvest time.
Water and oil are the major components of olives fruits [3]. The ripening process begins after a period of 25 weeks of fruit growth. After this time, the fruit develops to its final size, keeping the original green skin color. Following that, chlorophyll pigments in the olive skin are progressively replaced by anthocyanins, acquiring the characteristic purple coloration. This change in appearance is also reflected in the chemical composition of the fruits. Indeed, an accumulation of fatty acids occurs, mainly oleic acid, which is responsible for the acidity of the oil. At a certain moment lipogenesis stops, which is a milestone that represents a peak in the quality status of olive fruits, thus being an objectively optimum harvest time [4]. Hence, there are objective parameters such as fat content, moisture, and free acidity that determine quality of olive fruits [5]. As long as the ripening process takes place, these variables can evolve at a diverse pace in the different areas of a field, resulting in a quality indicator heterogeneity that can be managed using precision agriculture techniques.
The determination of the quality parameters in the laboratory is carried out by standard analytical methods [5]. A usual methodology for acidity determination in olive fruits is titration of olive oil. The fat content could be determined by Soxhlet or other techniques such as nuclear magnetic resonance (NMR) [6]. The moisture is normally determined by using a drying oven and Karl Fischer titration [7]. These techniques are expensive, destructive, and provide incomplete information since sampling is based on a limited number of sample points. Furthermore, the results usually take several days, so the decision of the harvest time may therefore be delayed. All the mentioned limitations of traditional olive quality determination techniques lead to a homogeneous harvesting based on subjective criteria such as intuition and visual decisions. We argue that this approach can be improved by objective monitoring of fruit ripening. In order to achieve olives with optimal fruit quality, harvest time should be adapted to the actual conditions of each plot in the field. This reveals the necessity to develop new methods for monitoring the ripening process of olive fruits. These instruments would allow collection of all fruit in an optimum state, assuring a high-quality olive oil and the best economic return for growers.
This research presents a complete methodology based on a new low-cost multispectral sensor for assessing quality parameters of intact olive fruits. In the last decades, numerous studies have focused on the determination of biophysical parameters of vegetation by means of spectroscopy [8,9,10]. Concretely, the use of spectroscopy to estimate the quality status of olive fruits has also been widely studied, with works based on a great variety of spectral sensors and retrieval methods [11,12,13,14,15,16]. Some of these works have reported good results even with spectral data obtained in field conditions [17,18,19,20]. The mentioned studies have demonstrated the suitability of spectroscopy for olive quality assessment under both laboratory and field conditions. However, all these publications have been accomplished using hyperspectral devices. In fact, nowadays there are NIR scanners commercially available for the determination of basic chemical parameters in olives under laboratory conditions [21]. Nevertheless, these instruments are expensive, and because of their operability, they are not an option to be used under field conditions. However, low-cost spectral sensors have recently emerged that are attracting interest for agricultural applications. Trang et al. [22] tested a 7-band VIS sensor to evaluate leaf chlorophyll content. Moreover, Moinard et al. [23] performed a preliminary evaluation of the same three cheap-based sensors (18 bands VIS-NIR) used in this study to estimate vine vigor and NDVI index. These sensors have the potential to provide objective information to growers, so the goal of this research is to continue exploring its potential by assessing the suitability of low-cost devices based on multispectral data to assess quality parameters of intact olive fruits. In spectroscopy studios, the retrieval method used is an important step. Quantification of biophysical parameters of vegetation from spectral data relies on a model, enabling the interpretation of spectral observations and their translation into a biophysical variable. Since the advent of optical remote sensing science, numerous retrieval methods for vegetation attribute extraction emerged [24]. In this work, an artificial neural network (ANN) approach was used. This is a nonlinear non-parametric method (machine learning method). The main strength of this method is its extraordinary ability to link complex spectral information with key parameters without any constraints on the sample distribution. This makes ANN approaches suitable for defining the intricate nonlinear relationships that normally exist between the spectral signatures of vegetation and biophysical parameters [8]. Several authors have reported on the good performance of ANN methods in spectroscopy studios as applied to precision agriculture [10,25,26,27,28,29,30]. The reduced cost of the proposed methodology (including the sensor and the ANN approach) compared to commercially available alternatives would make it more accessible to growers. Thereby, they could assess the quality of their harvest by themselves. This could allow them to decide the harvest time according to the optimum quality state of the olive fruit, so that they could get the best economic return. Furthermore, the limited cost of this device allows for in-field evaluation by either installing the sensors in mobile platforms like agricultural vehicles and autonomous robots, or in the form of a static sensor network.

2. Materials and Methods

2.1. Samples

Olive samples (n = 507) of four varieties (Olea europaea L., cv. Picual (54.2%), cv. Arbequina (28.6%), cv. Arbosana (7.7%), and cv. Verdial (9.5%)) were collected in the olive mill Nuestra Señora de la Oliva located in the village of Gibraleón (Huelva, Andalusia, Spain). During the harvest season 2020–2021, numerous olive growers provided olive samples to the mill for their appraisal. These fruit samples were analyzed with the mill’s resources and subsequently with the proposed device.

2.2. Reference Analyses

The reference data of the target parameters (moisture, acidity, and fat content) were determined by an industrial-standard near-infrared analyzer (OliveScanTM 2, Foss, Hilleroed, Denmark) [31]. The used NIR scanner was subjected to periodic calibrations. This methodology has been widely tested and it has been used as a reference method in numerous research studies [32,33,34,35,36].

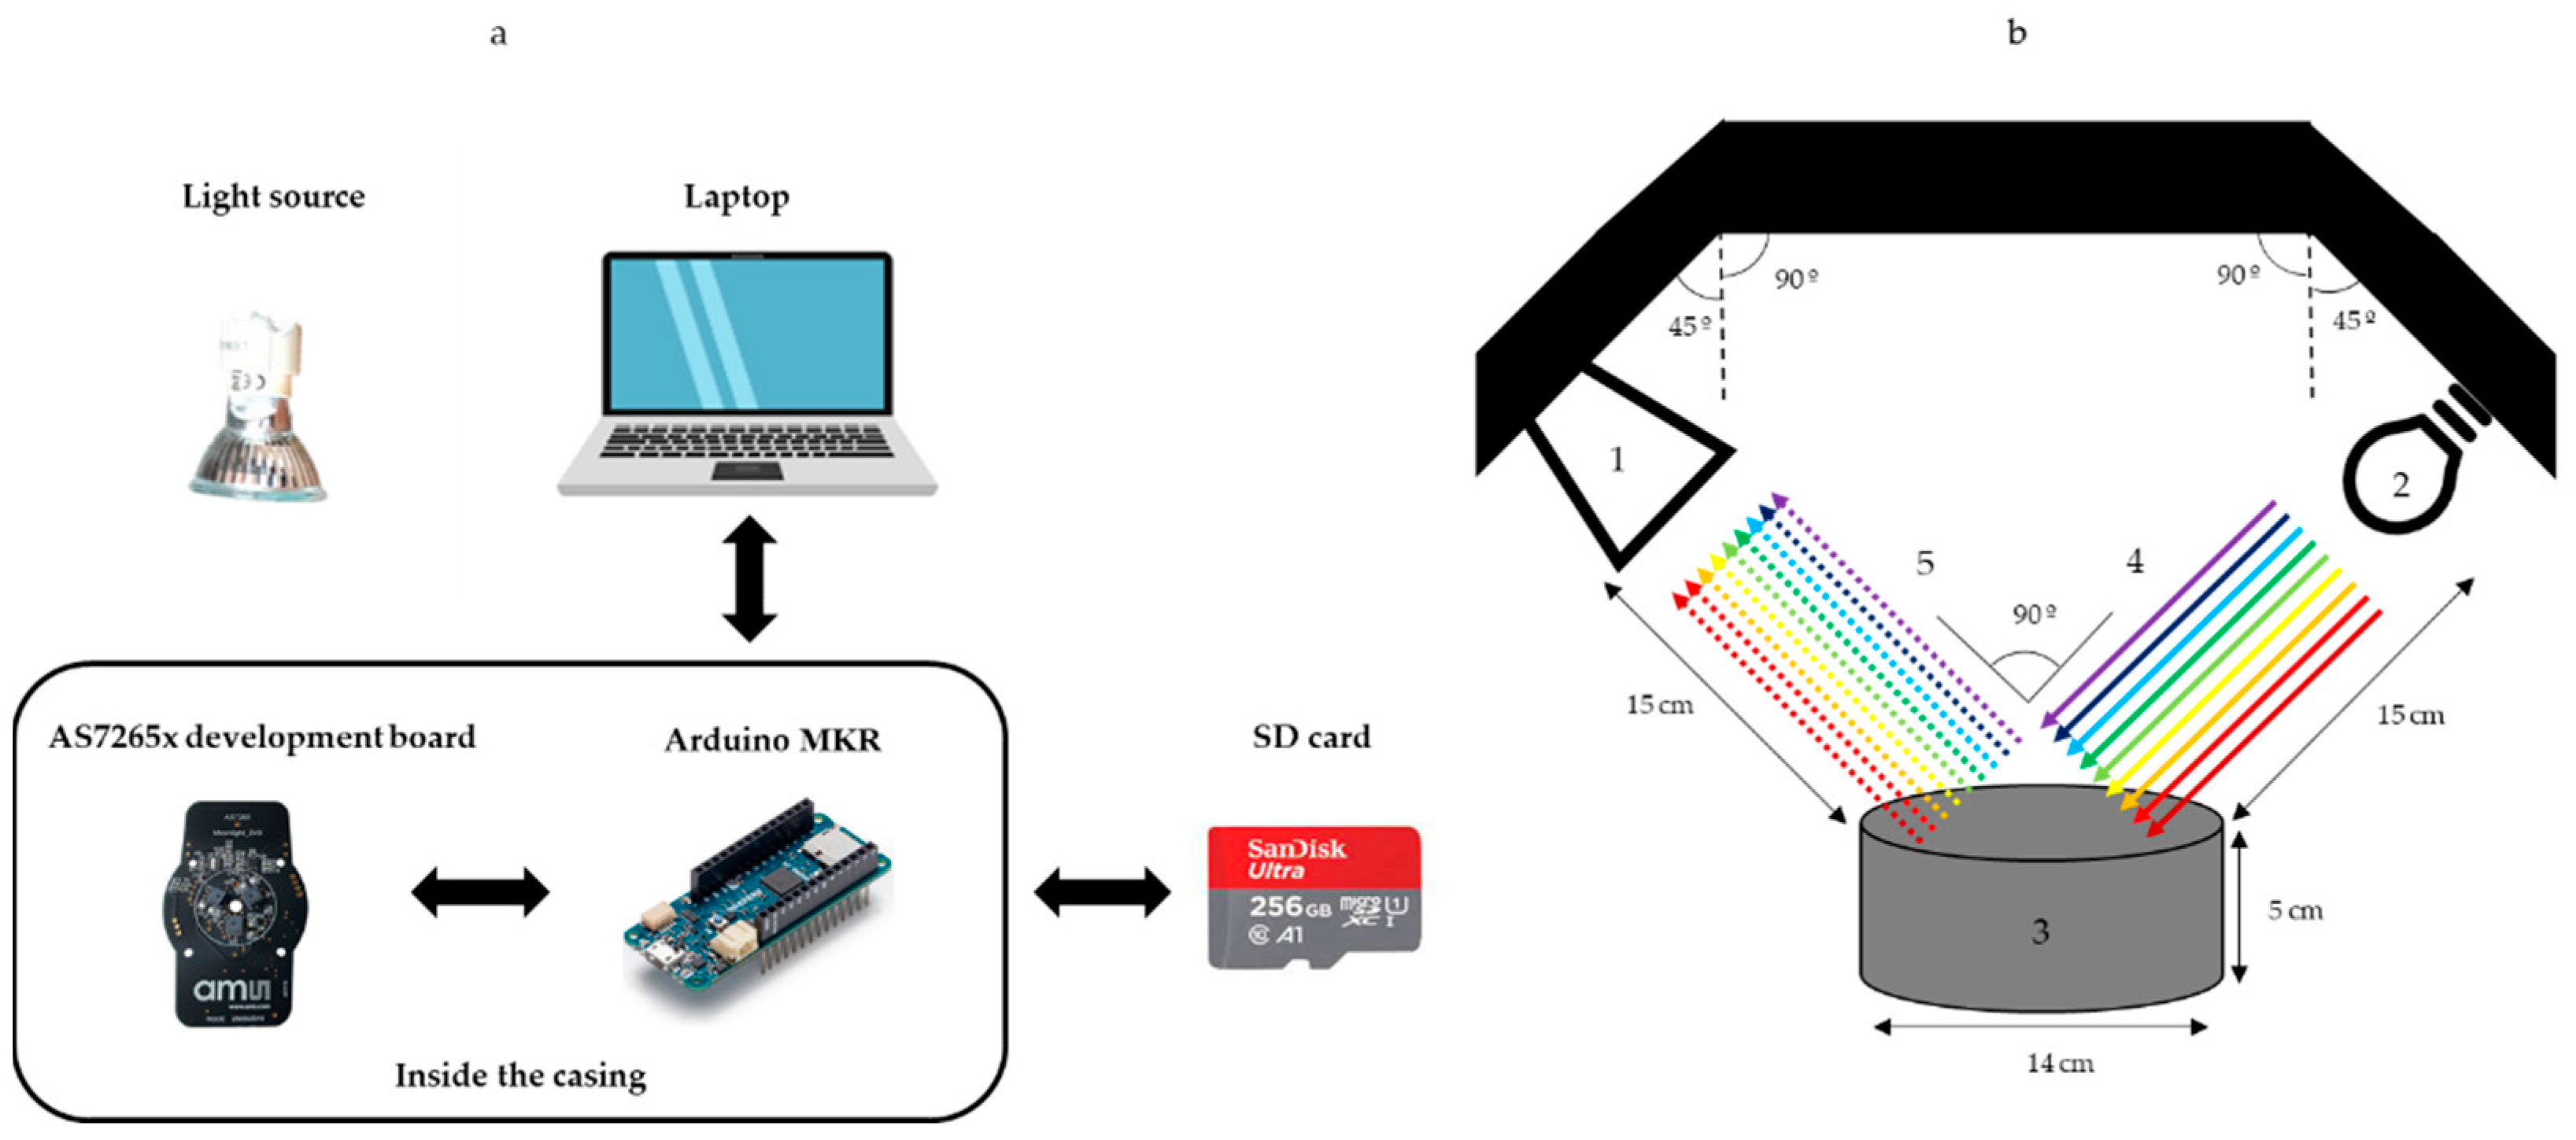
2.3. Spectral System

The proposed spectral system is composed of three main components:
  • Spectral sensor: the AS7265x development board (Figure 1), based on the AS7265x smart spectral sensor family (AMS, AG, Premstätten, Austria), was used. The sensor is composed of three chips, and each of them have six independent on-device optical filters whose spectral response is defined at a range between 410 nm and 940 nm, with full width at half maximum (FWHM) of 20 nm. The combination of the three sensors results in an 18-channel multispectral sensor.
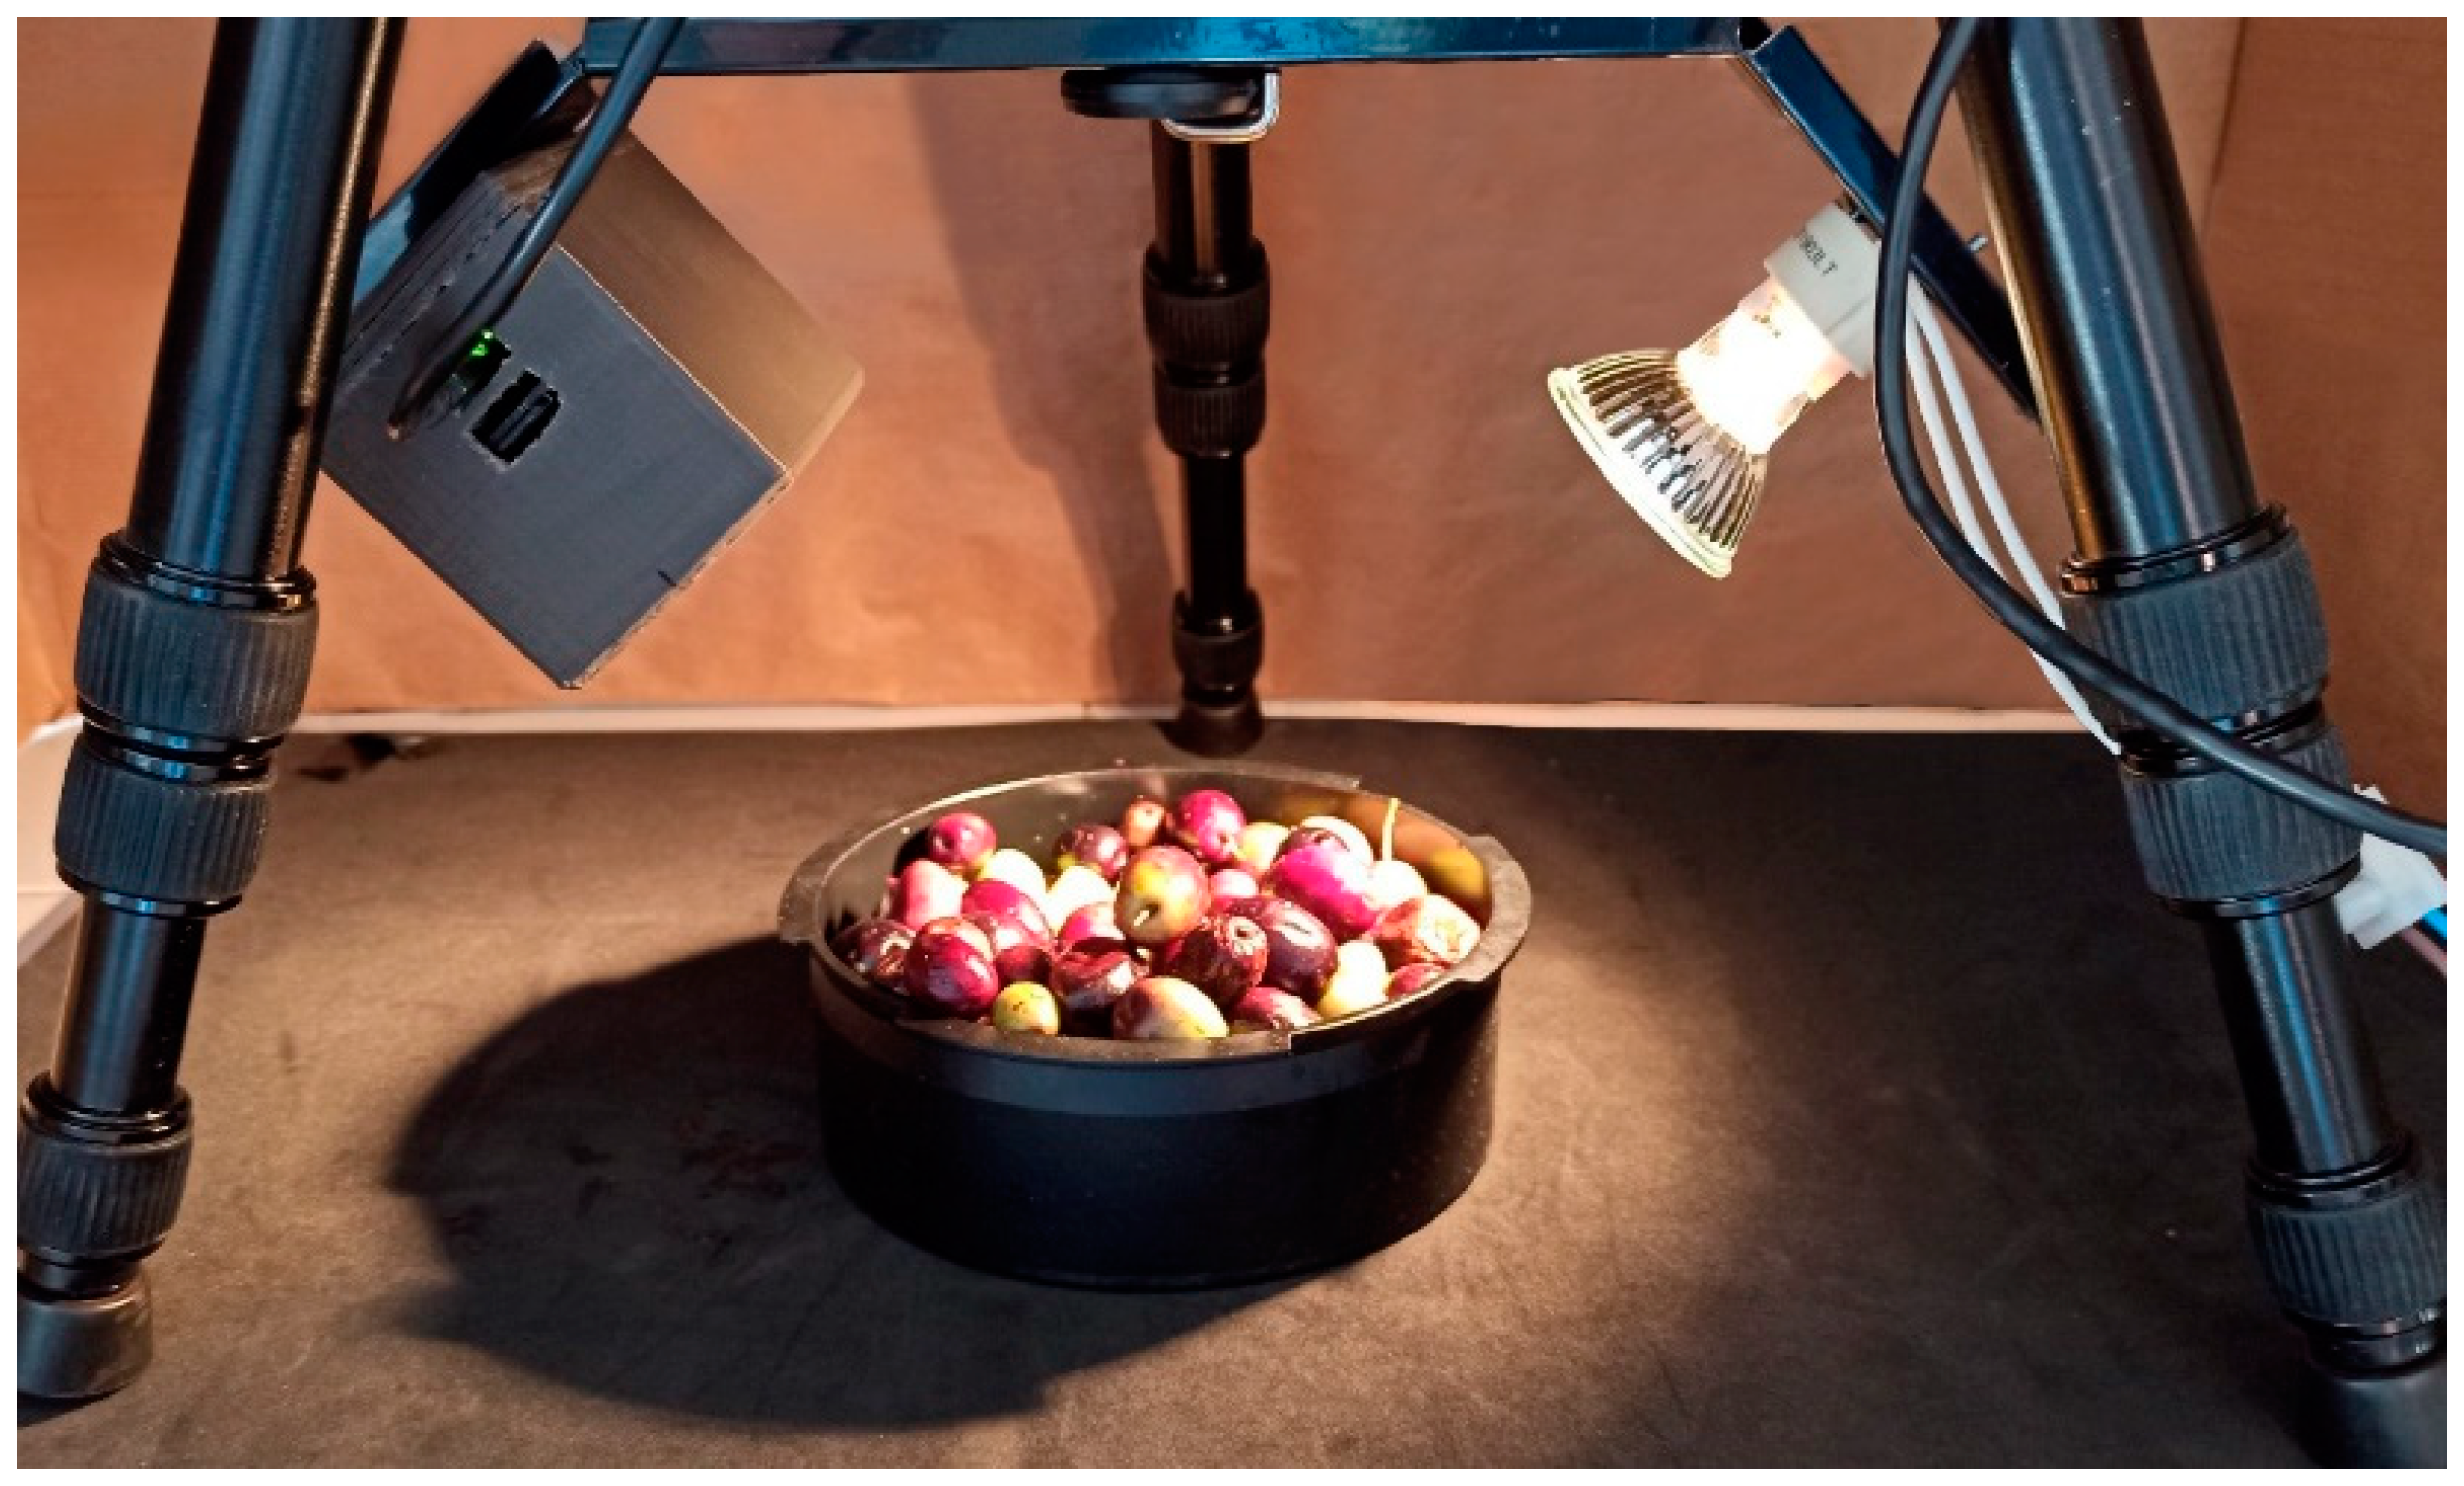
  • Light source: a 35 W dichroic halogen bulb, which offers a broadband spectrum allowing for accurate reflectance measurements, was employed. Halogen lamps have a wider spectral range of emission than that of LEDs, which enabled taking advantage of the sensor capabilities in the NIR domain. Moreover, using a relatively high power reduced the influence of ambient light interference, as the magnitude of the reflectance signal from the olive samples is considerably higher when compared to background and ambient light. Notwithstanding, an acquisition chamber was used to isolate the spectral measurement procedure to minimize signal noise.
  • Controller board: the communication between the spectral sensor and a computer was implemented using an Arduino MKR board (Arduino LLC, Monza, Italy). A custom software was developed for the configuration of the capturing parameters (exposure time and gain). The software awaits user input to capture a sample spectrum. When capturing is triggered, the Arduino board sends the command to the sensor and gathers data. Then, the acquired data are sent to a computer and stored in an SD card for further analysis.
Figure 1 shows the schematic of the components of the developed spectral system. Apart from the previously described elements, a bracket based on a photographic tripod allowed for the setup of the sensor and the light source with a 90° angle of incidence between them and a fixed distance to the olive fruits. This scheme aimed to ensure the capture of the spectral signal by the sensor after being reflected by the samples. In addition, a custom-developed enclosure was designed and 3D-printed to install and protect the electronics. A round thin layer of PTFE was placed in front of the sensor to act as a diffuser and to standardize the spectral signal. The operation of the spectral system was carried out inside an opaque chamber to isolate the measurement from outdoor lighting.

System Components and Cost

The labor required to manufacture, assemble, and test every element of the developed device was about 3 h for circuit board manufacturing and interconnection, 10 h for printing the custom 3D enclosure, and 1 h for final assembling and testing. The cost of the circuit and sensor components are shown in Table 1. Note that the total cost for all the materials needed for the system’s implementation remained below 200€ (this does not include the computer and sensor mount, as they are not exclusive to the system and are usually available for laboratory use).

2.4. Methodology

2.4.1. Multispectral Signal Capture

All the olive samples were stabilized during 24 h at laboratory temperature (25 °C) using air conditioner equipment, as temperature can strongly affect background levels during spectrum acquisition [37].
Once the standard analysis of the olive samples was carried out by the mill’s specialized personnel, the results related to fat content, moisture, and acidity were recorded in writing. Immediately after that, the olive samples were placed in a circular container with 14 cm of diameter, 5 cm of depth, and 500 g of capacity. Then, the olive samples were placed inside the acquisition chamber of the spectral system and positioned under the light source and the multispectral sensor at the same distance from both (15 cm) (Figure 2).
Four spectral captures were taken for each olive sample. Between captures, the olive samples were rotated 90°, being the average reflectance of the four spectra considered as representative data of each sample.

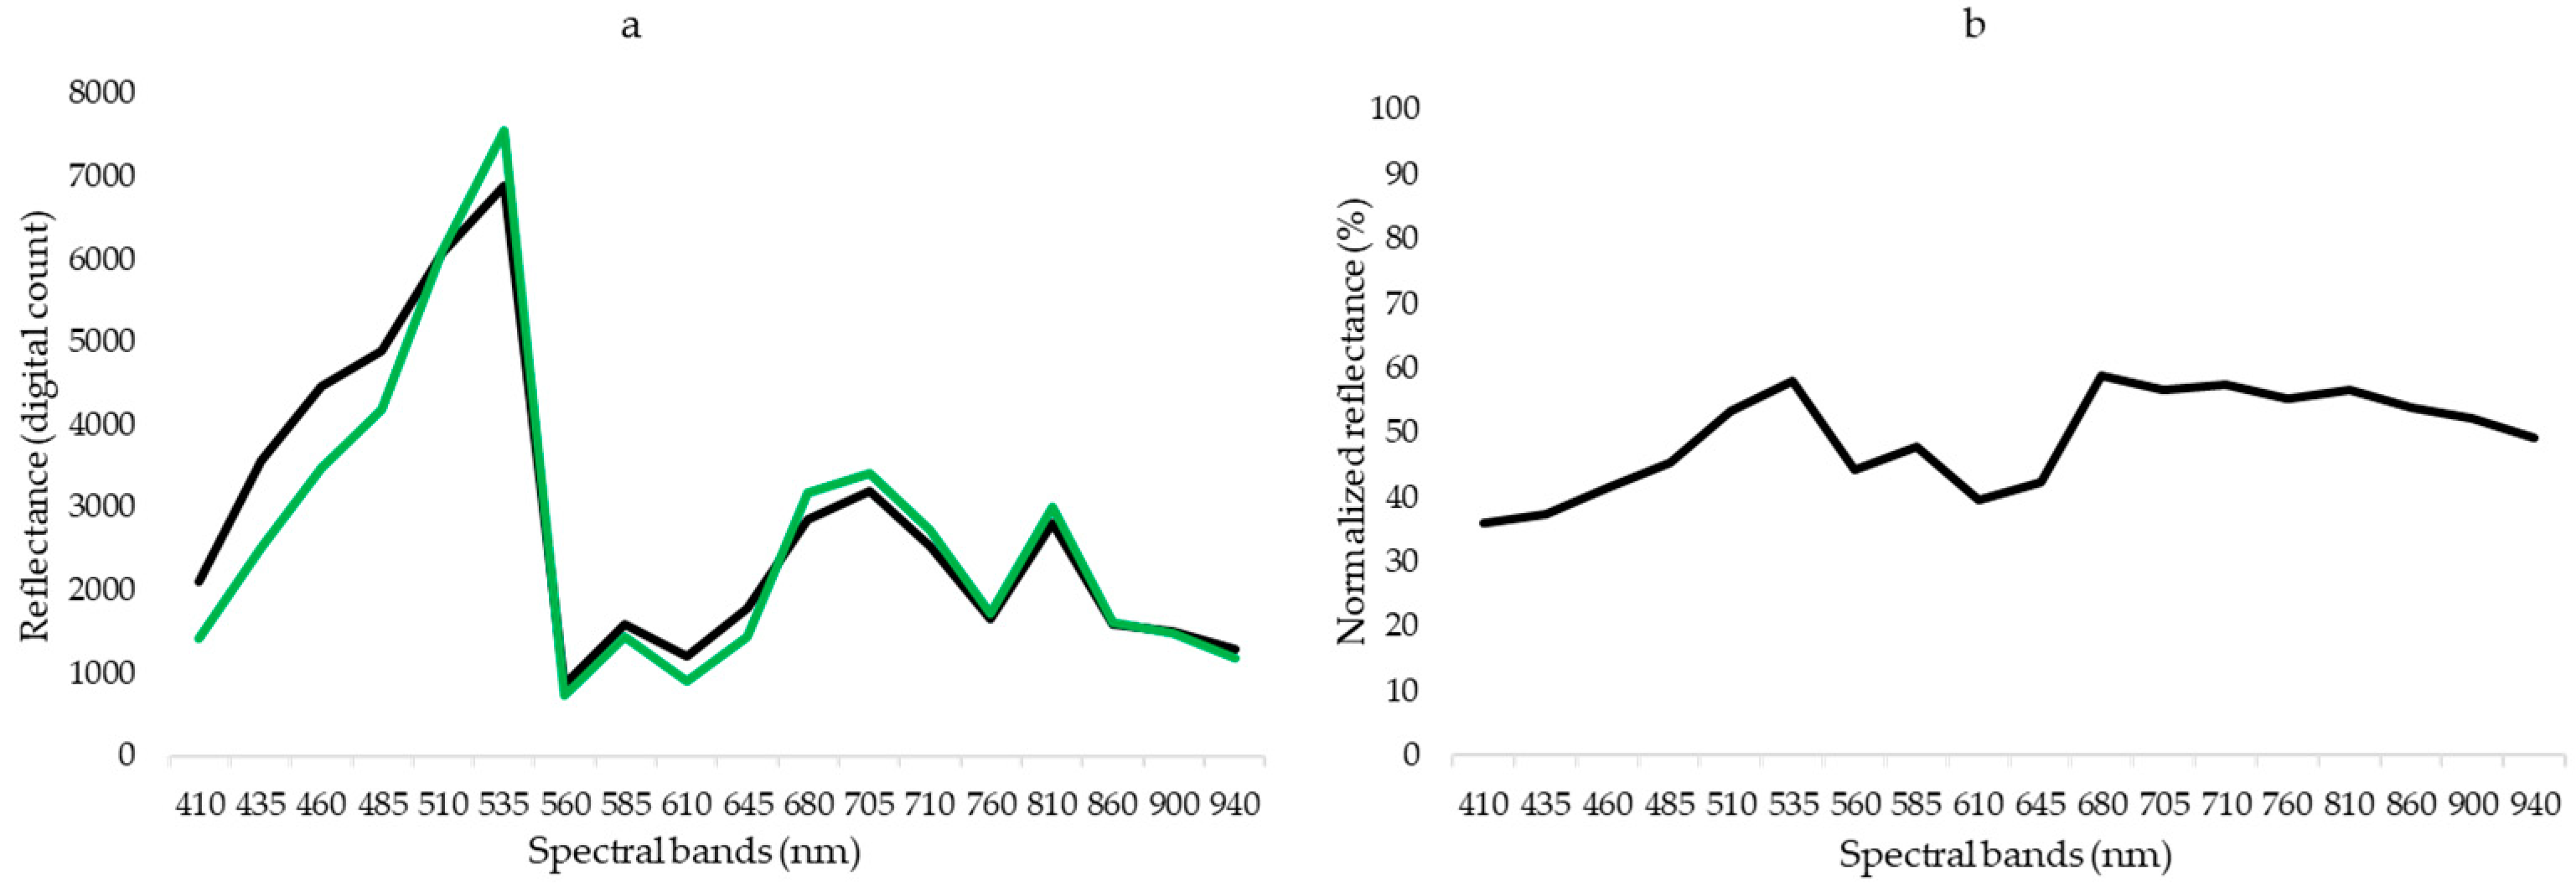
2.4.2. Data Pre-Processing

The reflectance of each olive sample was calibrated to prevent eventual errors due to variations of the light source. For this purpose, a capture of a known reflectance surface (53%) (Labsphere, Inc, North Sutton, NH, USA) was taken every five samples. This level of reflectance allowed obtainment of a better resolution as the reflectance of the samples was less than 50% for all the considered bands. The 18 reflectance signals of the known reflectance surface were used as reference for calibrating the spectral response of the subsequent twenty captures according to the next equation:
R c a l w l = R w l 0.53 R r e f w l ,
where Rwl is the reflectance value measured for a given spectral band in a capture of a sample, Rrefwl is the reflectance value measured for that spectral band in the previous capture of the known reflectance surface, and Rcalwl is the corrected value of reflectance in the sample for the given band. A representation of the spectrum measured from a sample, the calibration pattern for all the bands, and the resulting corrected signal are shown in Figure 3.
Once corrected, the mean reflectance value of the four captures of a given sample for each spectral band (18) were stored.

2.4.3. Reference Parameter Modeling by Means of Multispectral Data

The corrected reflectance of the 18 spectral bands captured by the sensor were used as input variables to train three artificial neural networks (ANN) to estimate the following olive fruit quality parameters: fat content, moisture, and acidity. MATLAB R2020a (The MathWorks Inc.) was used for data processing and ANN training. The complete dataset (n = 507) was randomly divided into three subsets: train (80%), internal validation (10%), and external validation (test) (10%). The ANN architecture was composed of a hidden layer with ten neurons, eighteen inputs, and one output. Thus, each ANN model was trained to estimate a unique olive quality parameter. The Levenberg–Marquardt algorithm was selected as the training algorithm because of the volume and the range of the used dataset. The training process was automatically finished when generalization stopped improving, as indicated by an increase in the mean square error (RMSE) when estimating the fruit quality parameter using the internal validation set.

2.5. Criteria for Model Performance Evaluation

The performance of the quality estimation models was measured by the coefficient of determination (R2) and the root mean square error of prediction (RMSEP). These parameters were calculated using the reference values of fat content, moisture, and acidity obtained by the automatic analyzer and the responses of each model for the estimation of the different parameters in the external validation groups. In order to make the RMSEP value comparable between variables, it was expressed as the percentage of RMSEP with respect to the mean of the observed values. Thus, higher R2 and smaller RMSEP values indicated better model performance. RMSEP can be mathematically formulated as:
RMSEP = i = 1 n ( Y p r e d Y r e f ) 2 n ,
where Y p r e d is the response of the model, Y r e f is the reference data acquired by means of the automatic analyzer, and n is the number of measurements in the respective external validation dataset.

3. Results

3.1. Quality Condition of Samples

A total of 507 olive samples from four olive varieties were considered in this research, including 275 of cv. Picual (54.2%), 145 of cv. Arbequina (28.6%), 39 of cv. Arbosana (7.7%) and 48 of cv. Verdial (9.5%). This experiment was carried out under real conditions in a commercial olive mill. Thus, the olive varieties used in this research represent the most commonly cultivated in western Andalusia. The set of samples was considered as a unique dataset (not dissociating between olive varieties), aiming to increase the volume and the range of the different target quality parameters to consequently improve the predictive models’ generalization.
Table 2 summarizes the statistical details of the full dataset in relation to the target quality parameters. In the case of moisture (expressed as % of water in fresh weight), the olive samples varied between 44.58% and 68.29%, with an average value of 60.40% ± 3.26%. On the other hand, the acidity (expressed as % of oleic acid) of the olive samples ranged between 0.25% and 0.52% with an average value of 0.38% ± 0.06%. Finally, regarding fat content (expressed as % of fat in fresh weight), a variation between 8.92% and 24.43% was observed, with an average value of 16.32% ± 2.45%. The ranges of the different parameters were wide enough, considering that all the olive samples were at an optimum quality state according to the growers’ criteria.

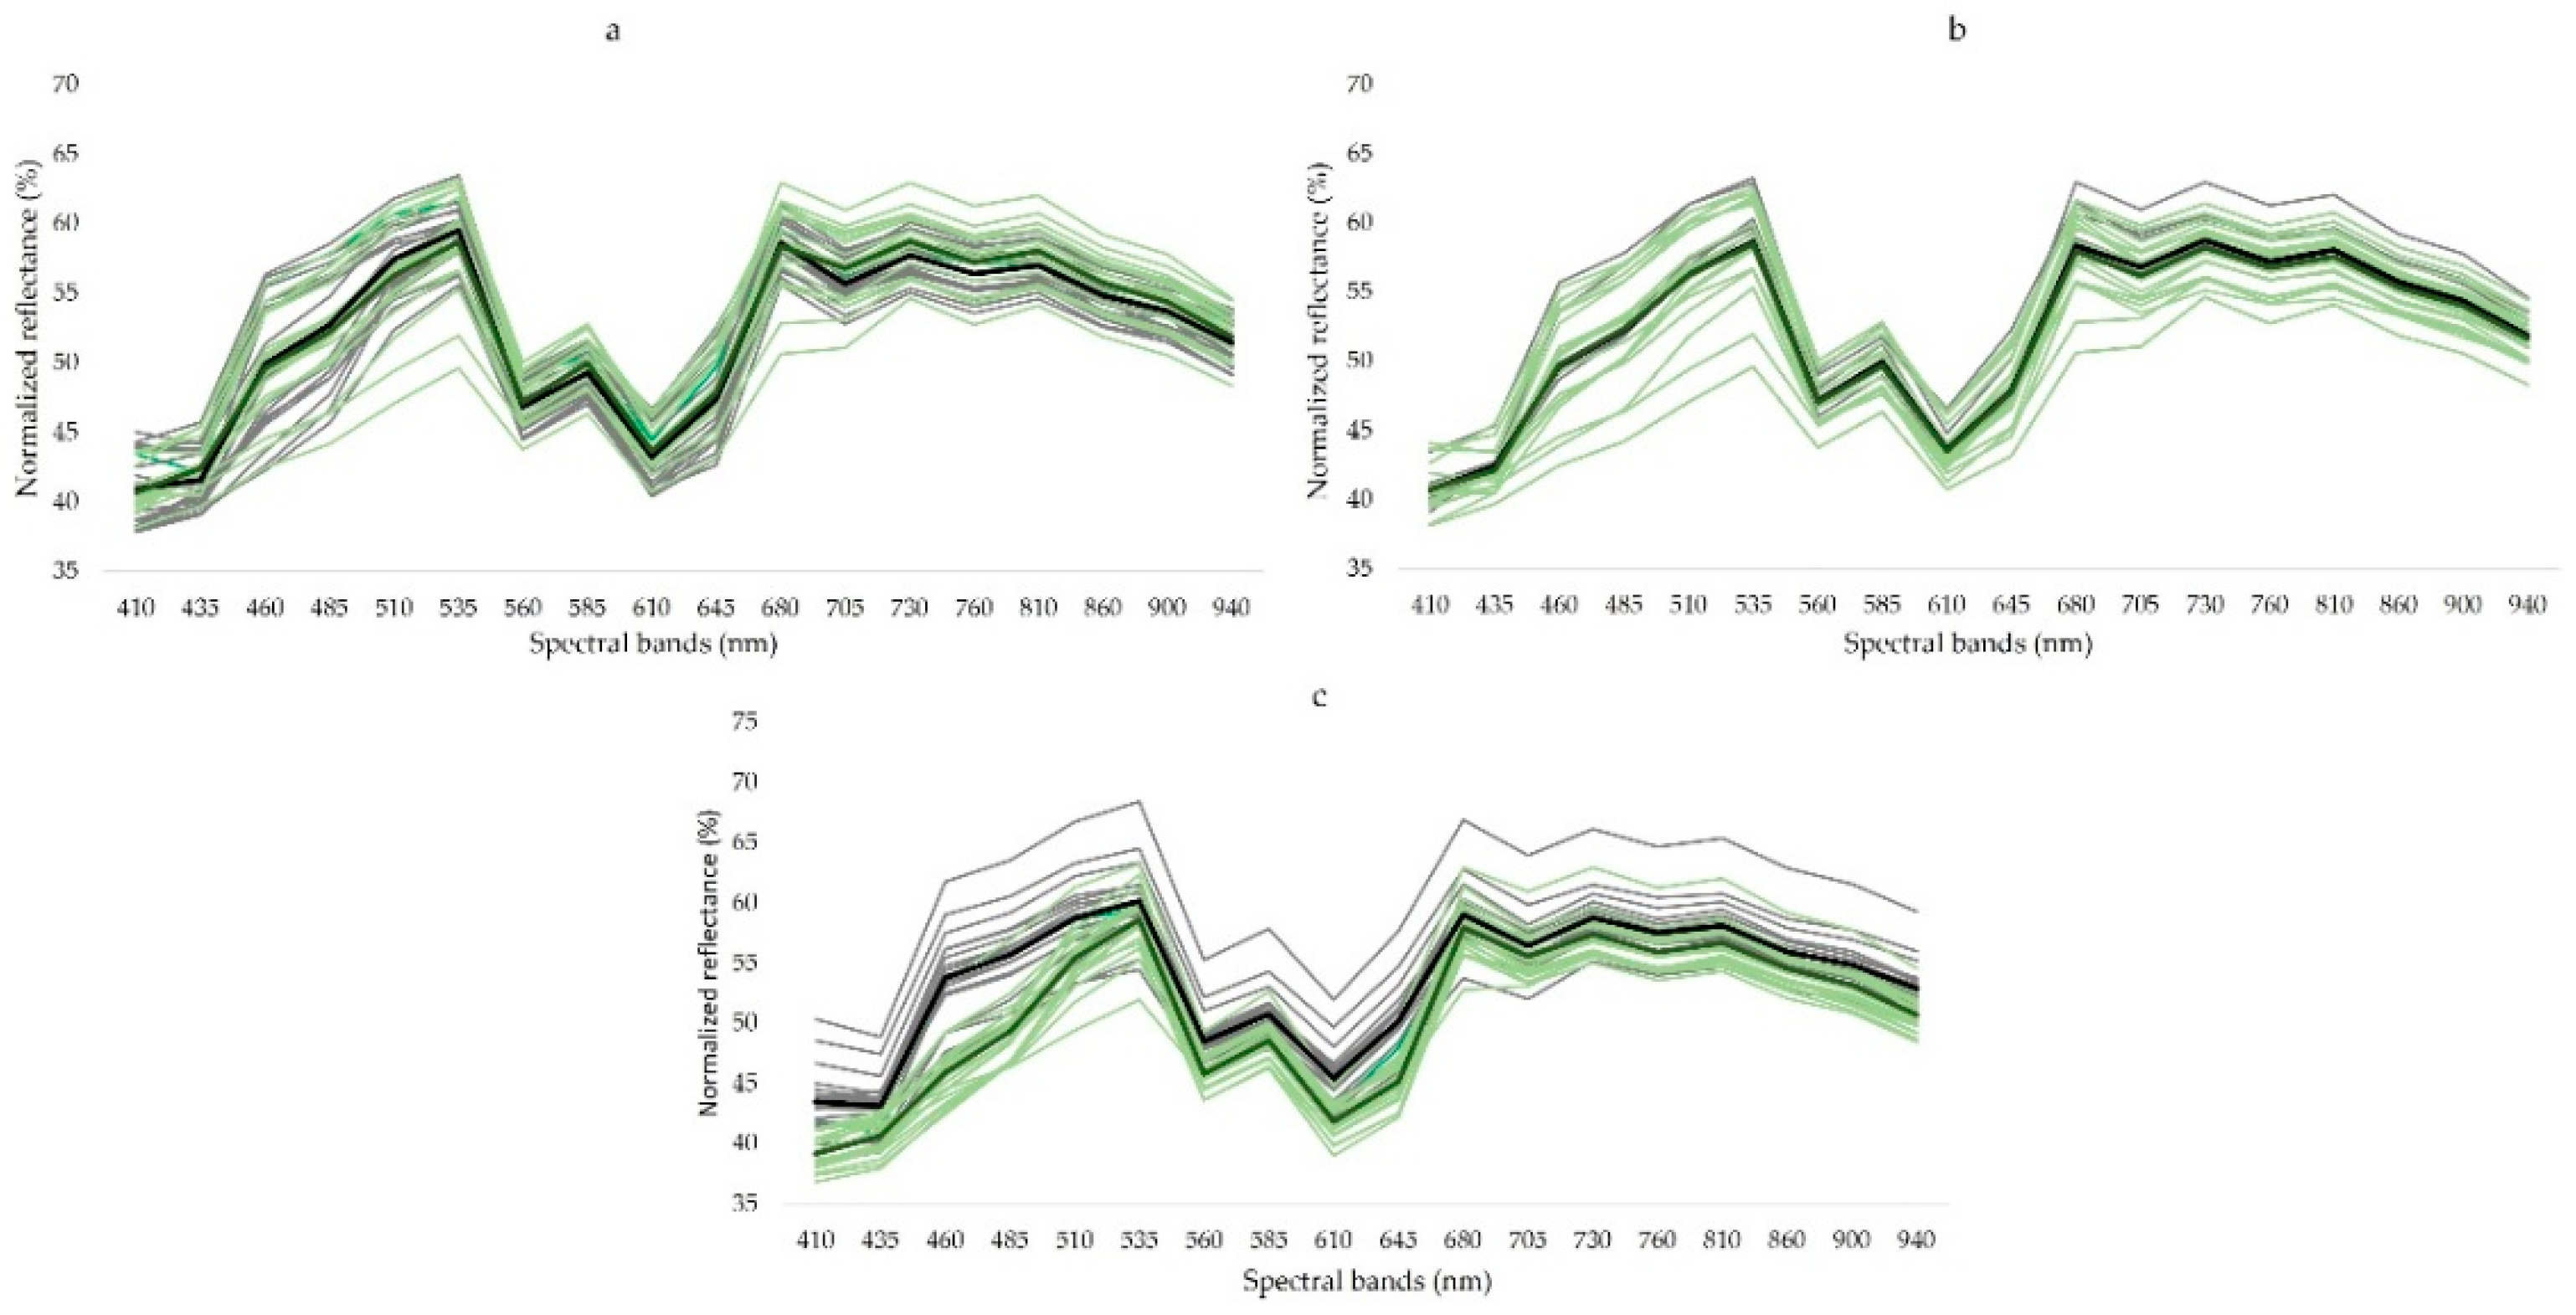
3.2. Spectral Signature of Samples

Figure 4 represents the reflectance responses corresponding to approximately the 5th and above the 95th percentile of the histogram of the studied parameters. Overall responses were similar throughout the measured spectrum, although in the case of acidity (4c), differences between acidity levels can be observed. These reflectance peaks were especially noticeable between 410–535 nm, which includes the first half of the visible domain, until the green region. On the other hand, the differences of the spectral signature of olive fruits relative to its moisture and fat content were more uniform.

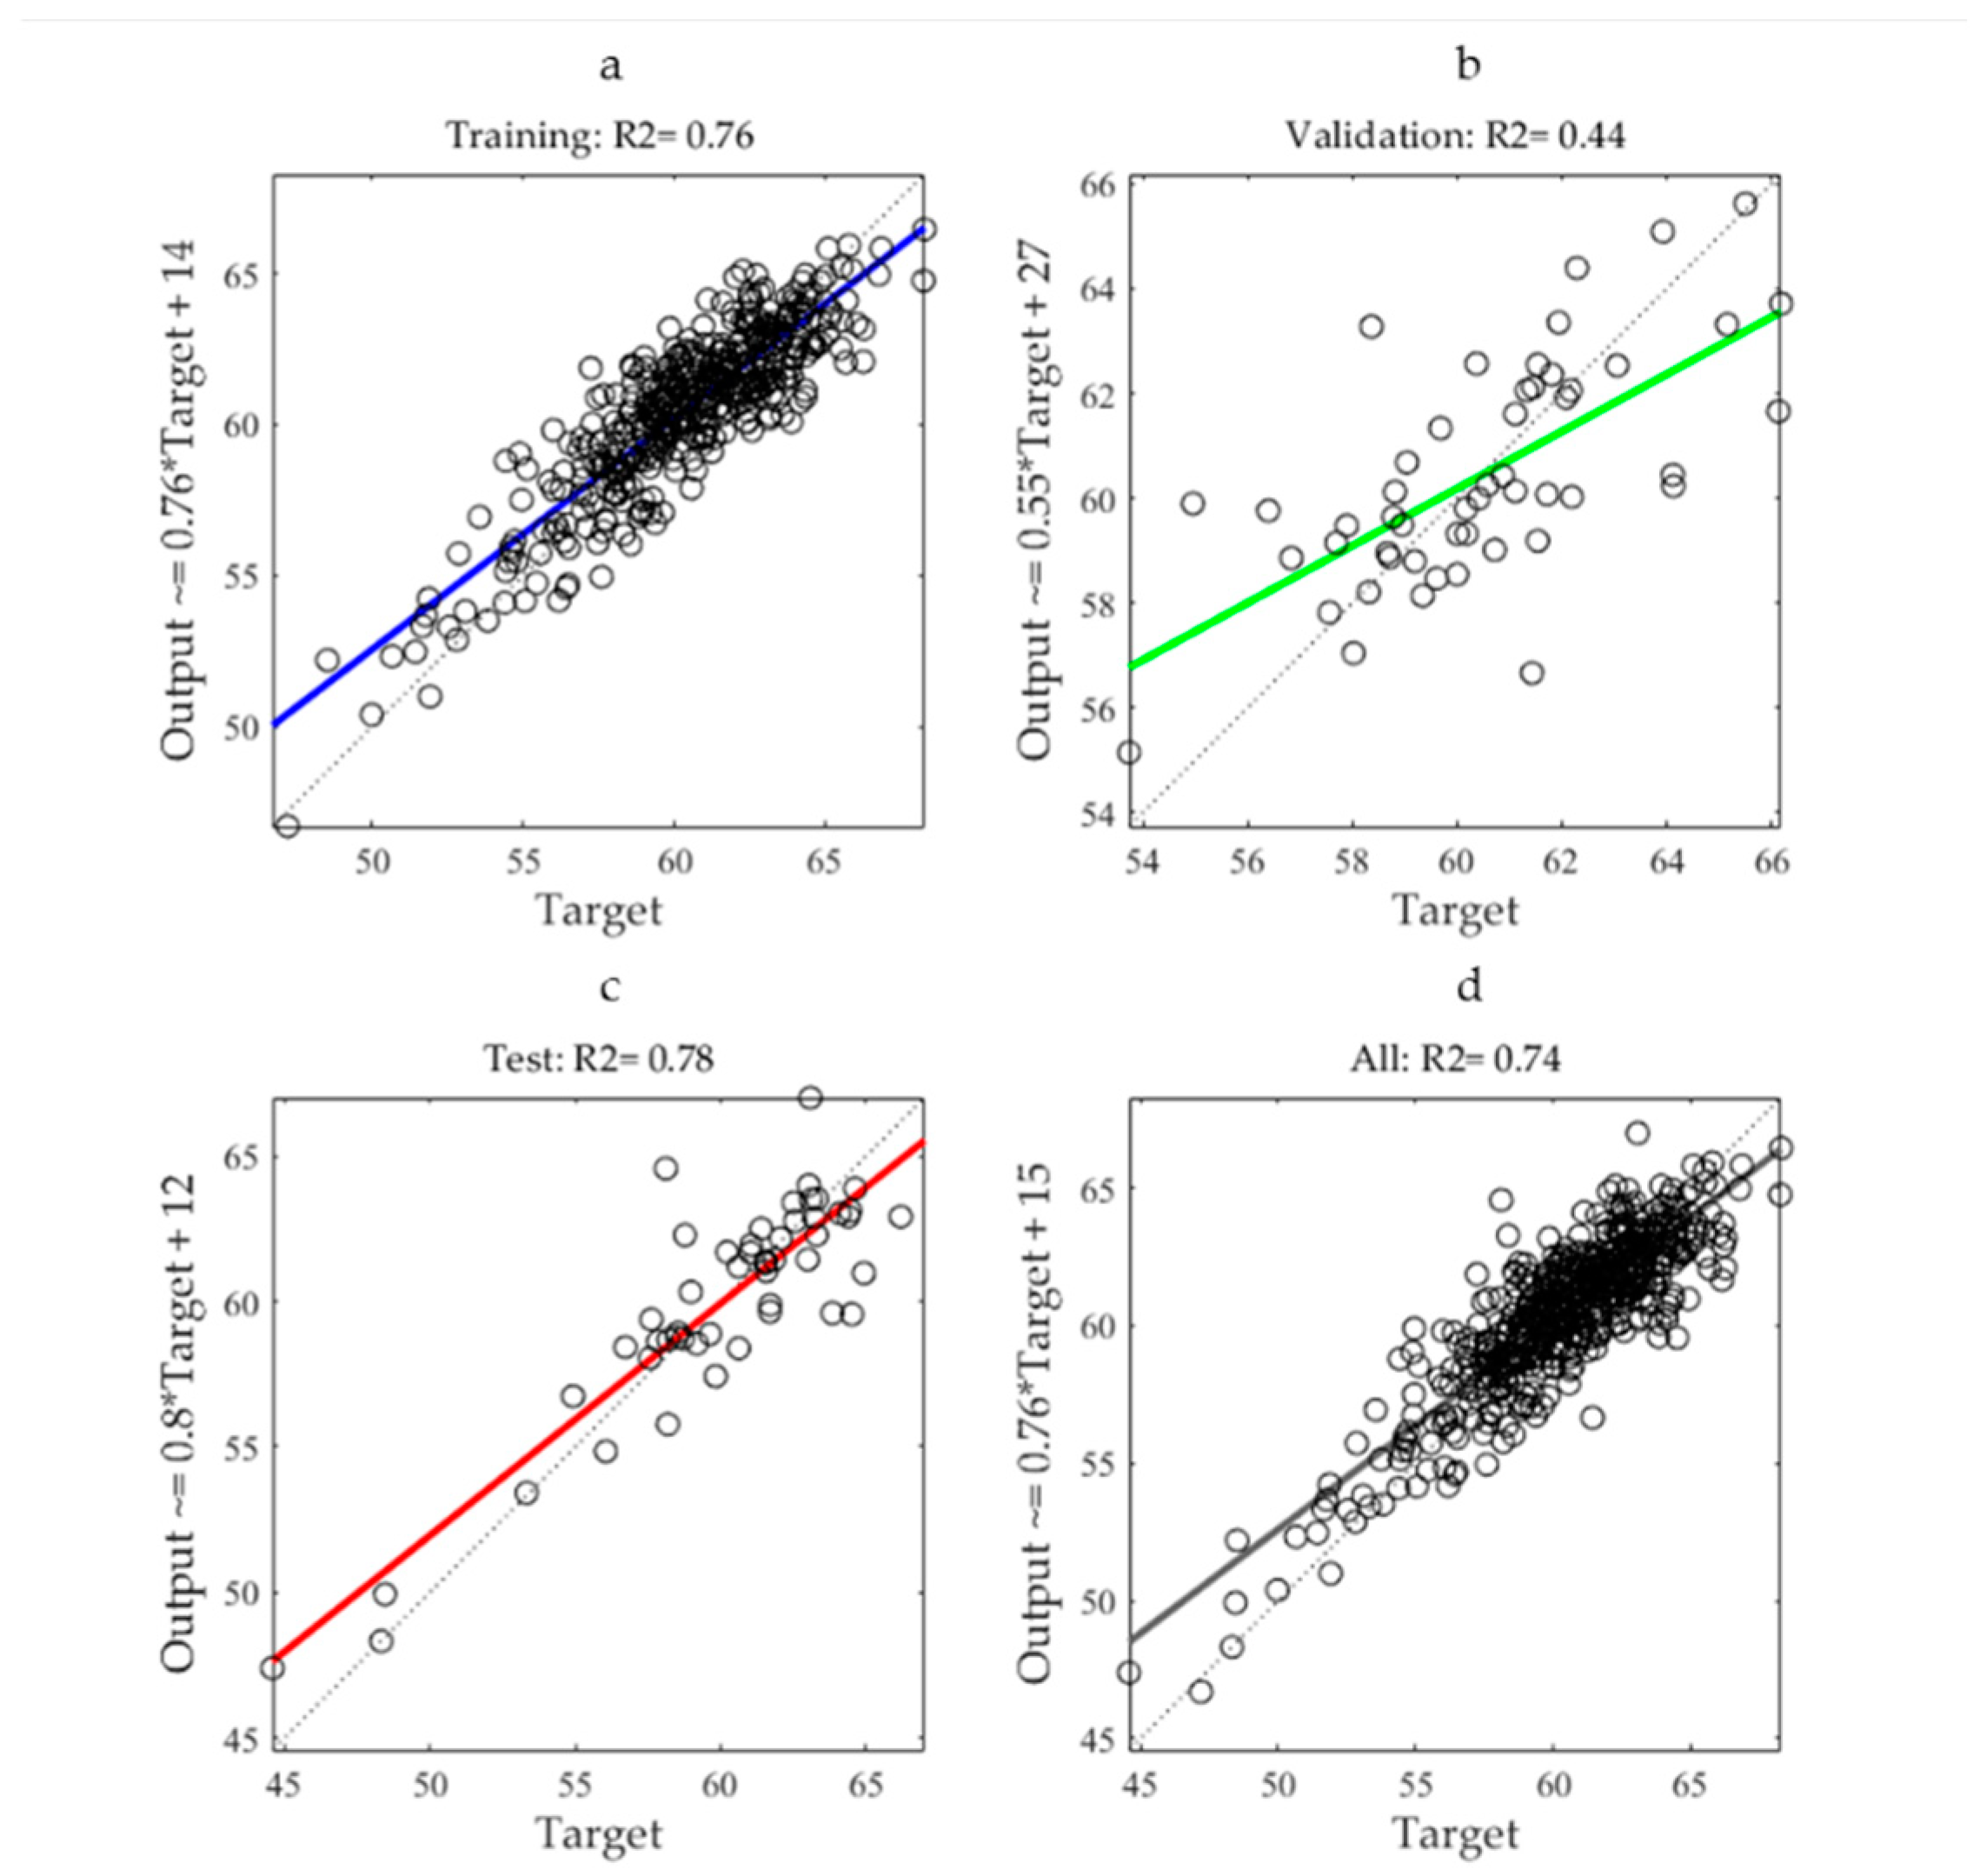
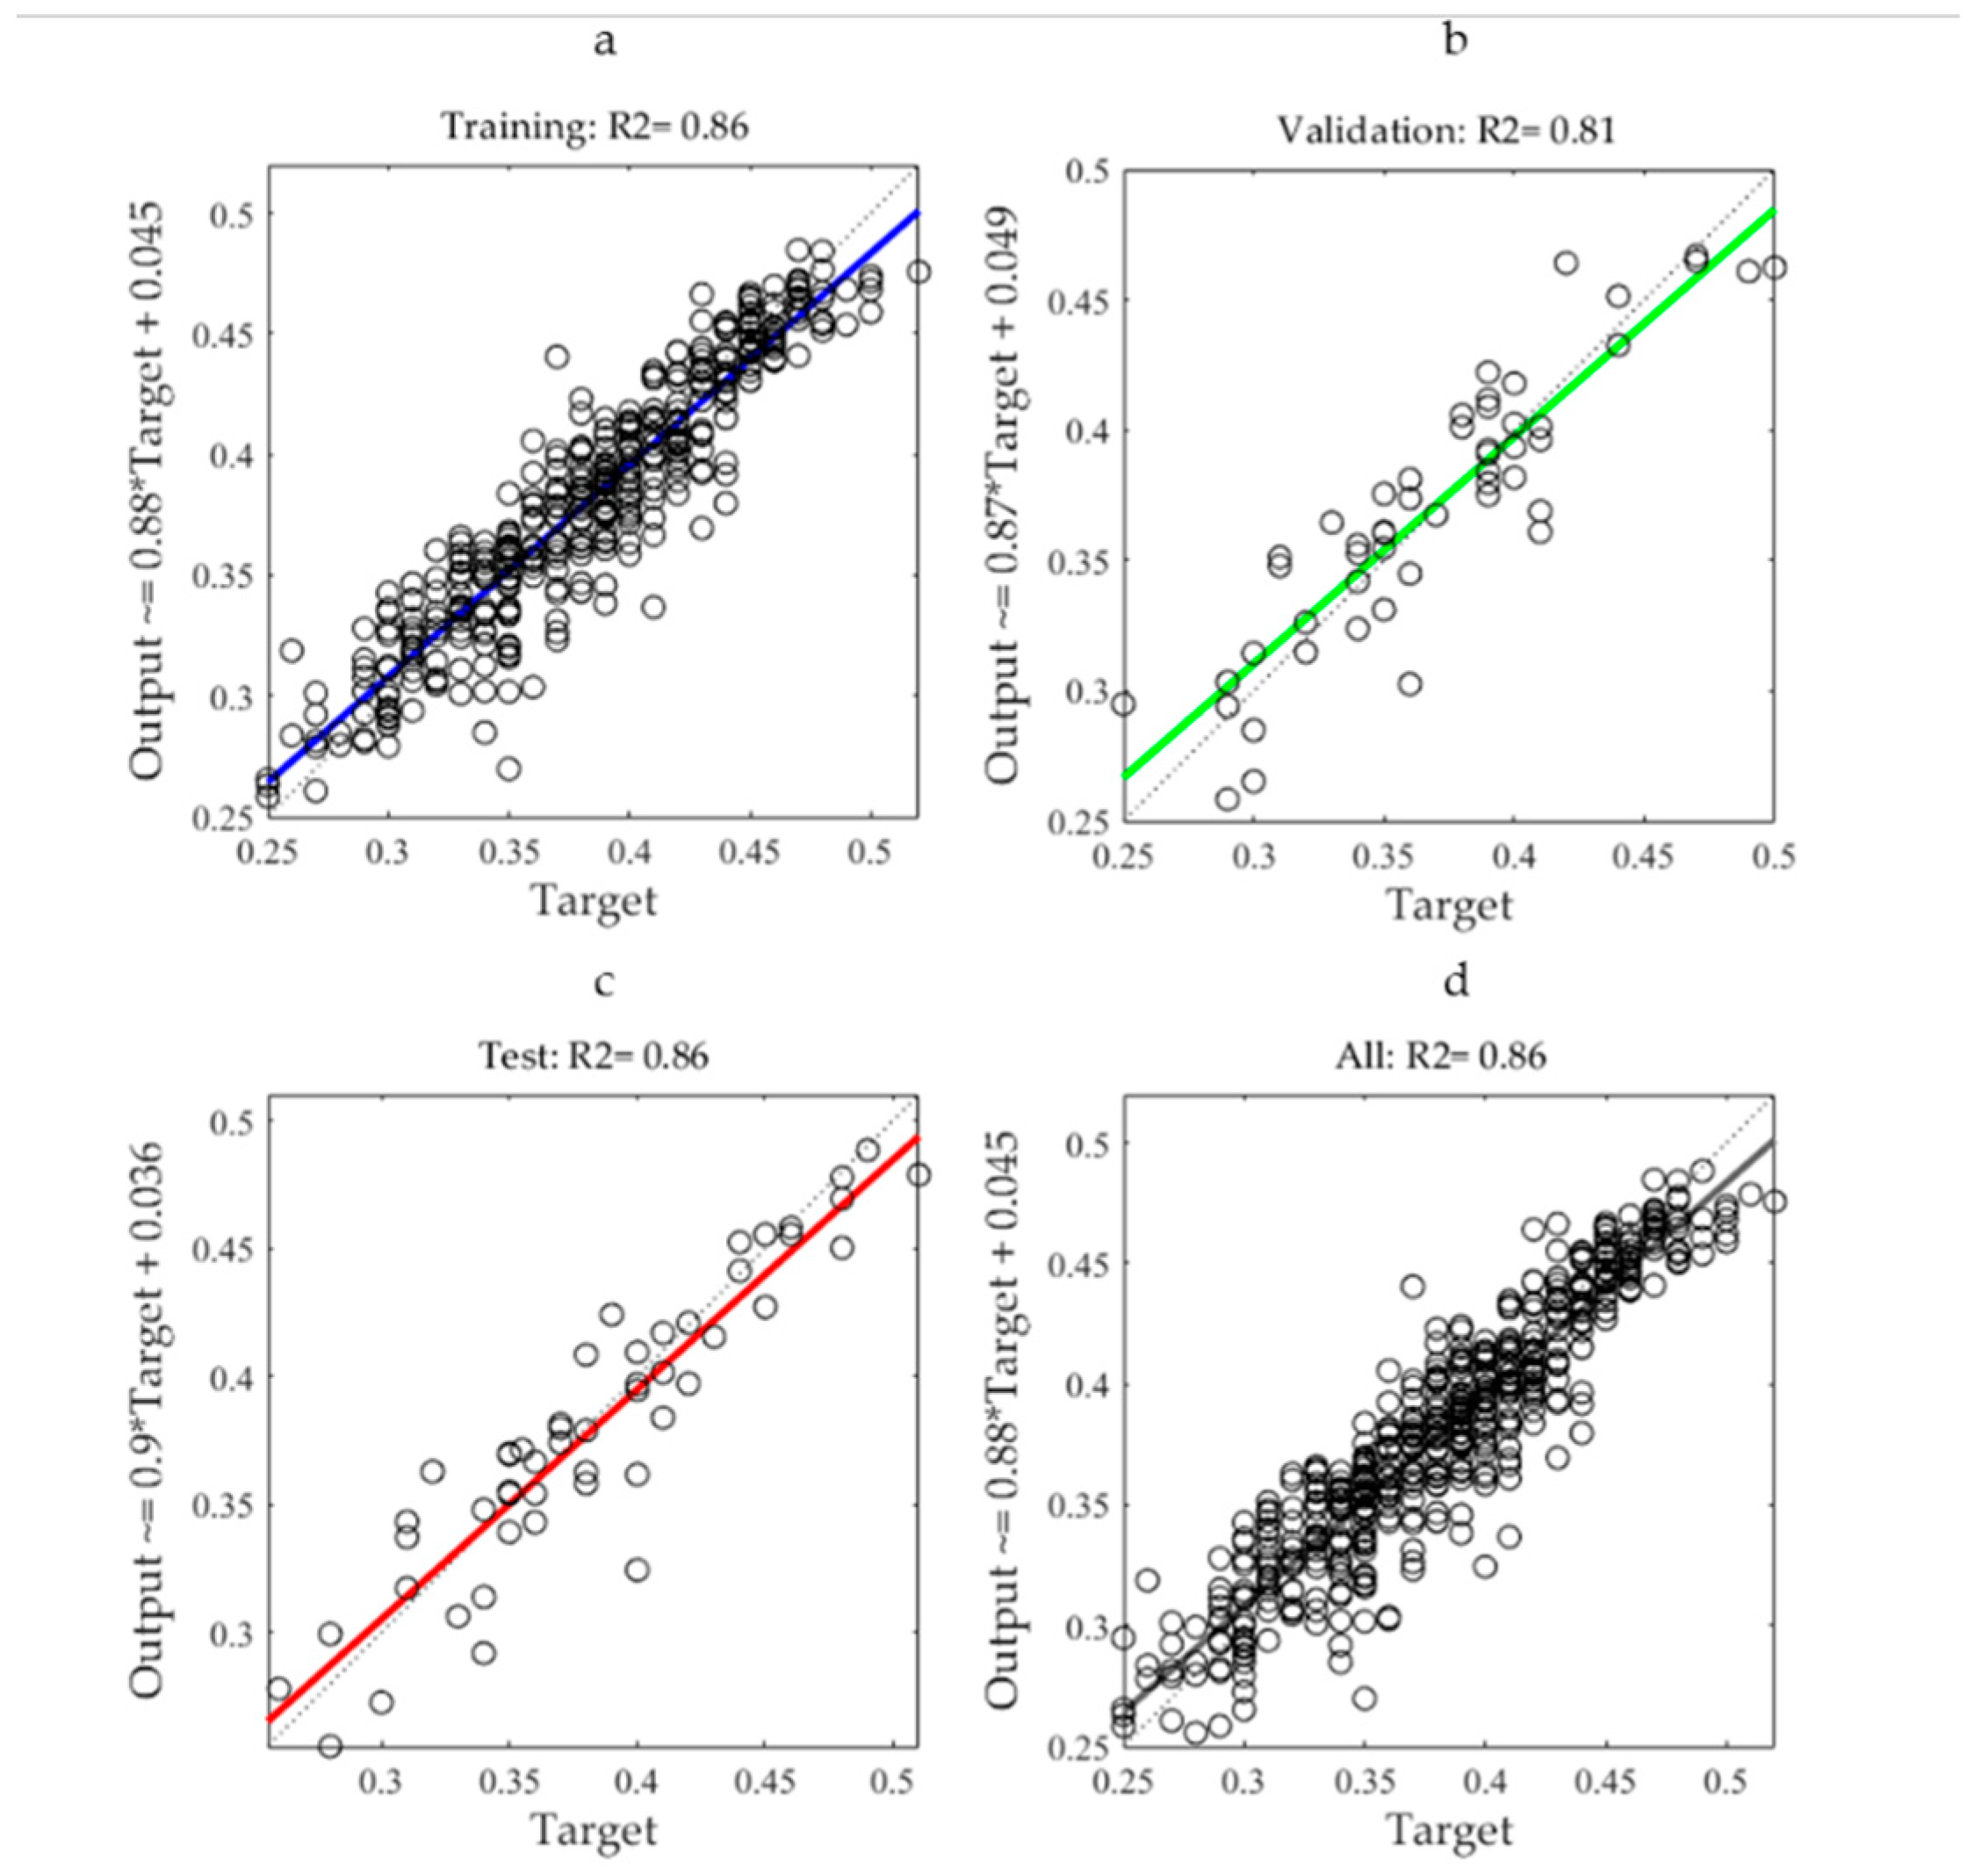
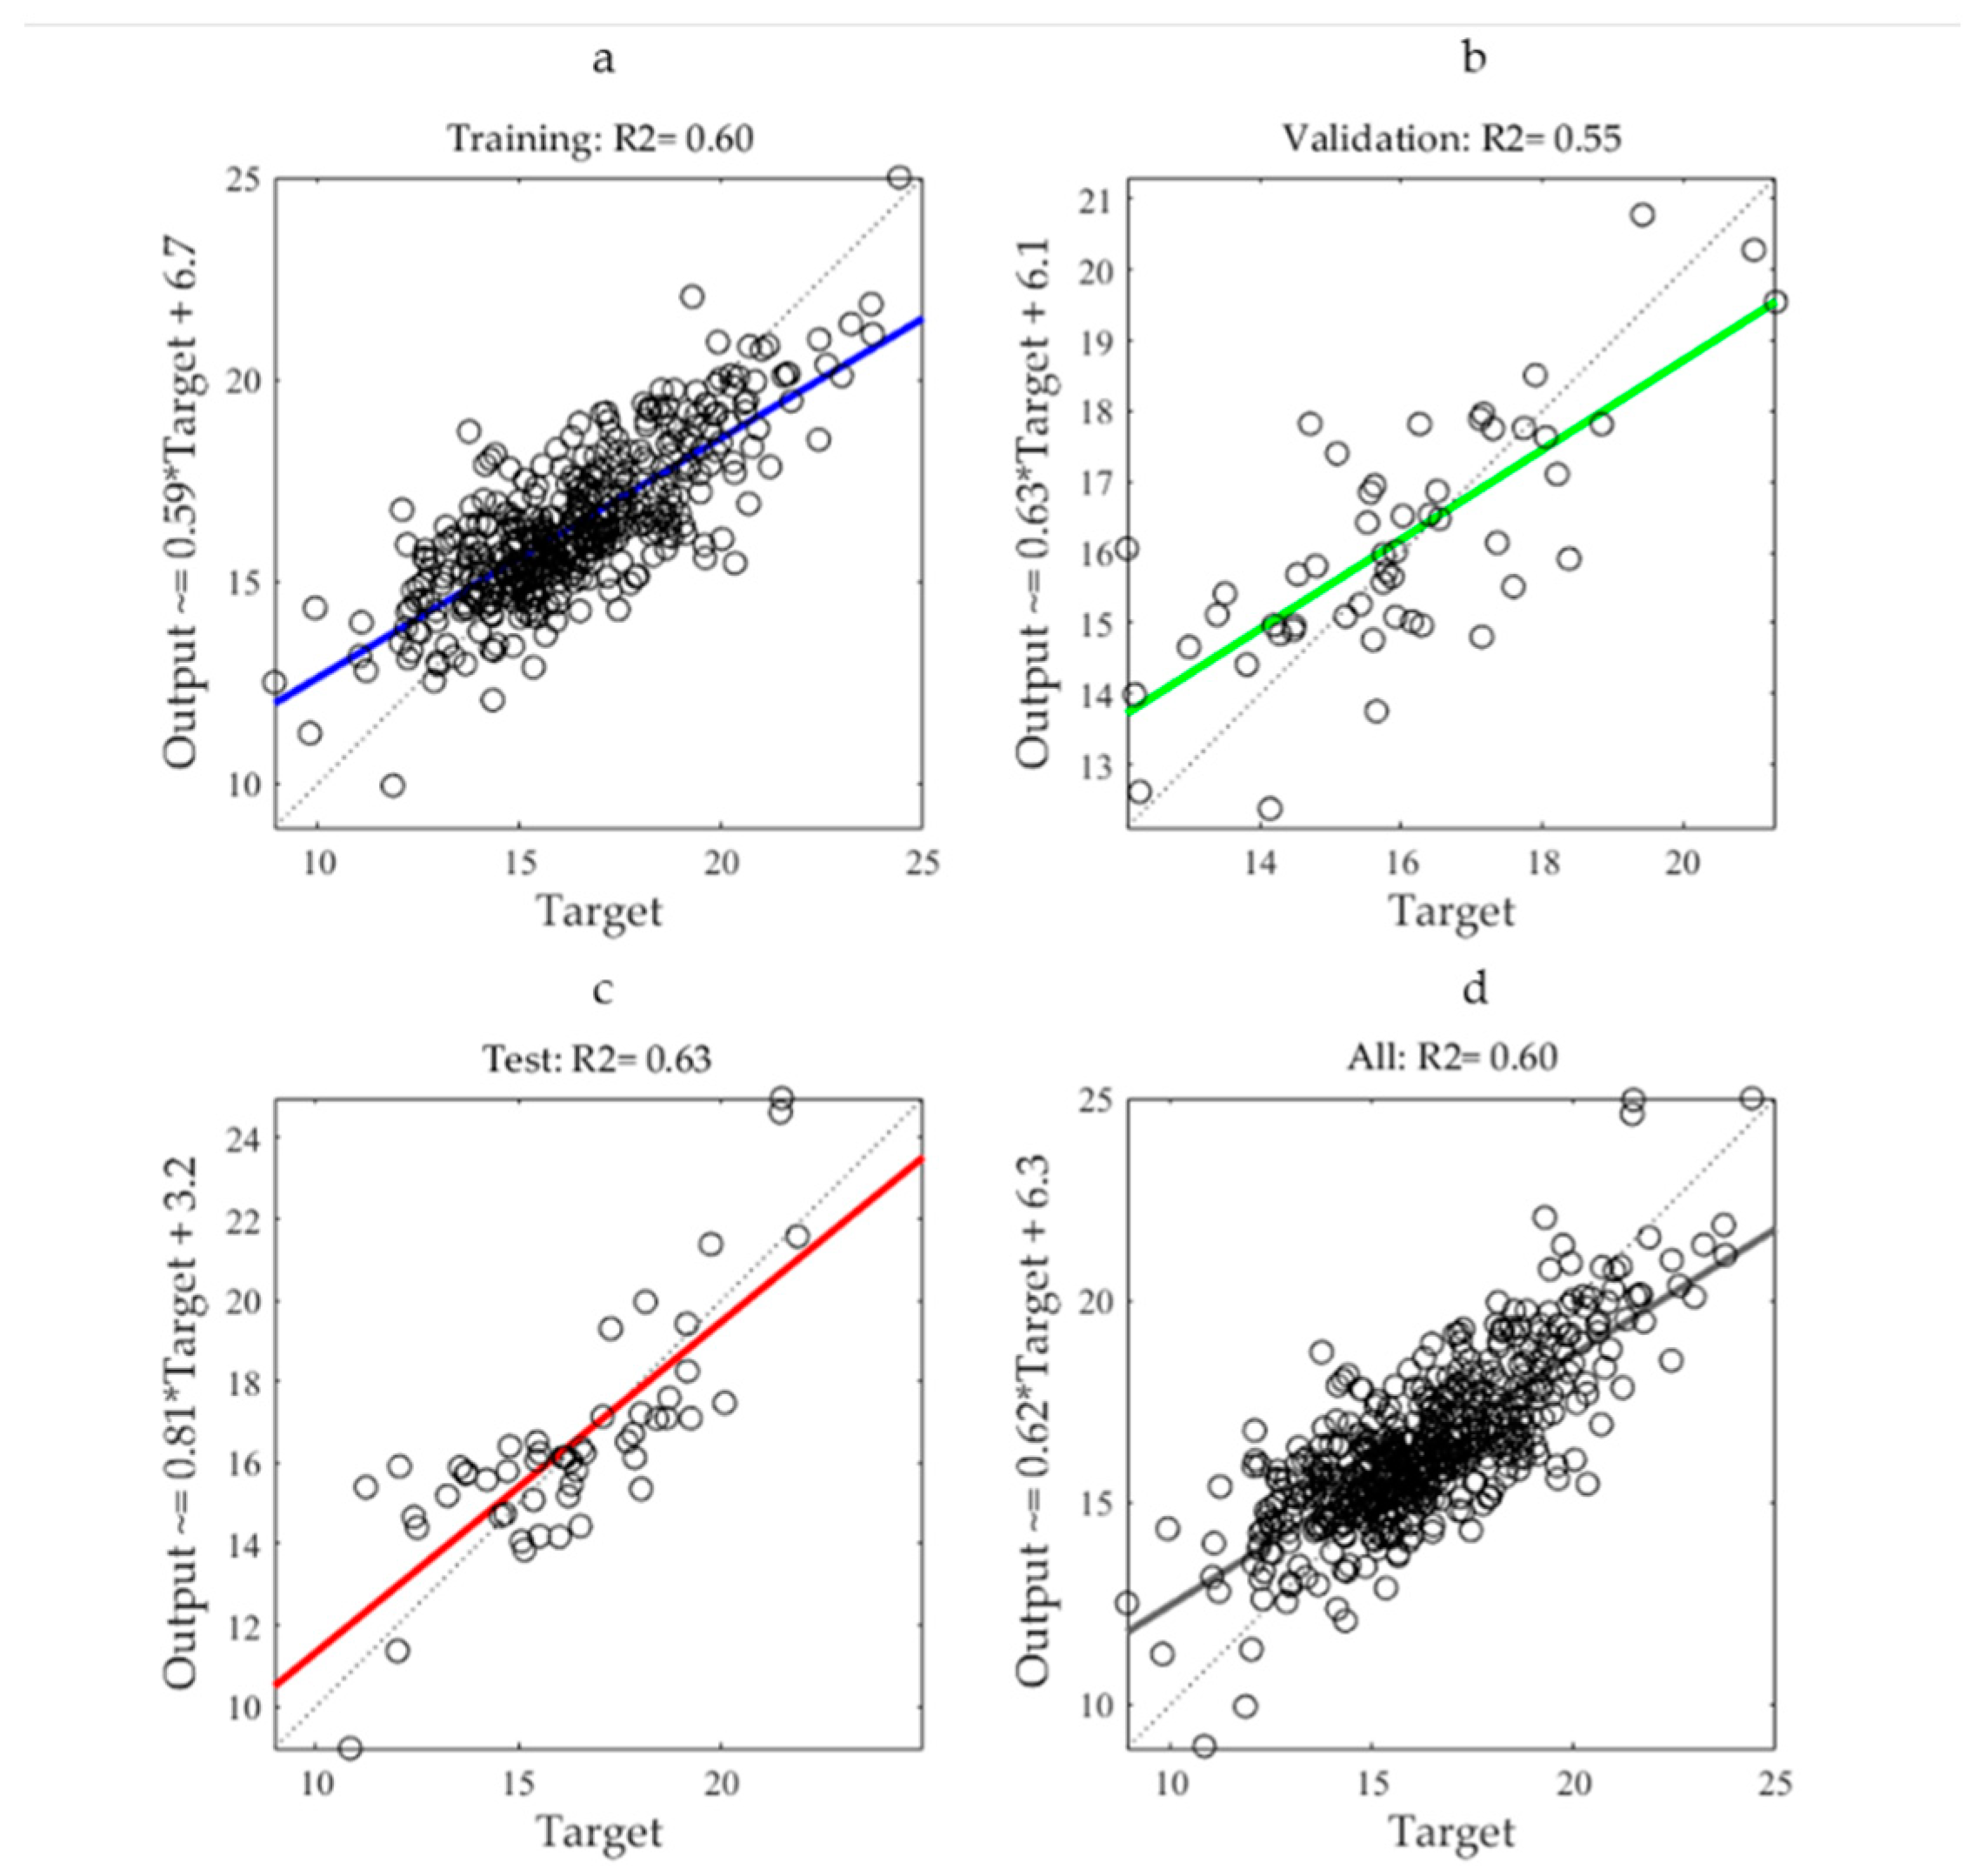
3.3. Performance of Estimation Models

Table 3 shows the accuracy achieved by the proposed ANN models in the estimation of the considered target quality parameters. As it can be observed, the performance of the ANN approaches was suitable in the estimation of the three target parameters. The best result was obtained when estimating olive fruit acidity, with an R2 value of 0.86 and a RMSEP of 5.83% measured on the external validation dataset. On the other hand, the model aimed at estimating olive fruit moisture also reached satisfactory results, giving an R2 value of 0.78 and a RMSEP value of 3.31%. Finally, the performance of the ANN approach for fat content estimation was lower, although considerably valid, yielding an R2 value of 0.62 and a RMSEP of 10.44%.
The linear relationship between fruit moisture (estimated VS reference) for the different datasets (train, internal validation, external validation, and all combined) is shown in Figure 5. The analysis for fruit acidity and fat content for the different datasets is also drawn in Figure 6; Figure 7, respectively.

4. Discussion

The aim of this research is to validate a complete methodology based on a custom-built low-cost multispectral device for monitoring the quality status of intact olive fruits. For this purpose, ANN models were trained to estimate parameters indicative of the quality status of olive fruit (moisture, acidity, and fat content) by using the spectral information acquired by the sensor as input. This work was carried out under laboratory conditions as a first step towards the validation of the use of the proposed device in the field.
Numerous studies have demonstrated the suitability of spectral sensing for the characterization of agronomic parameters of interest for crop management [9,38]. Concretely, the assessment of fruit ripeness by means of remote sensing has received increasing interest, with numerous research studies focused on several crops [39]. Concerning olive fruit, spectroscopy was applied to the olive oil production process to determine the properties of the different products that appear in the process, such as olive fruit, paste, and oil [40,41]. The present work focused on olive fruits, since directly analyzing the fruit implies monitoring olive oil constituents at the beginning of the production process, before the milling phase, and even in the field. To this end, several authors have explored the potential of spectroscopy for olive fruit quality assessment. Table 4 summarizes the results obtained by other research aimed at modeling the same target parameters considered in the present work. Cayuela et al. [13] evaluated the suitability of a portable visible/NIR spectrometer for moisture, free acidity, and fat content prediction of olive fruits by using PLSR for modelling. They reported R2 values for determining the moisture, acidity, and oil content of 0.88, 0.79, and 0.72 and RMSEP of 1.52%, 0.05%, and 7.98%, respectively. Salguero-Chaparro et al. [15] evaluated an NIR diode array installed on a conveyor belt and combined with PLSR to determine moisture, acidity, and oil content in intact olive fruits. They reached coefficient-of-determination (R2) values of 0.88, 0.72, and 0.79, and RMSEP values of 3.3%, 2.7%, and 2.36% between the measured values and the response of the PLSR model in the estimation of moisture, acidity, and oil content, respectively [15]. More recently, Fernández-Espinosa et al. [20] investigated the prediction of moisture, fat content, and free acidity in olive fruits with different ripening states along two consecutive campaigns. They used online NIR spectroscopy combined with chemometric techniques. Concretely, the predictive models were developed by PLSR previous principal component and linear discriminant analyses (PCA and LDA). They obtained coefficient-of-determination (R2) values of 0.88, 0.83, and 0.76 and RMSEP values of 4.98%, 38.8%, and 20%, between the measured and the estimated values of moisture, acidity, and fat content, respectively [20]. In the present work, comparable results to those reviewed were obtained (Table 4). In relation to acidity, the R2 value between the measured data and the response of the ANN model for the external validation group was 0.86, which was better than those obtained by the mentioned works (0.83, 0.72, and 0.79). Regarding RMSEP, it was 5.83%, which is lower than 10%, which could be considered as an acceptable predictive potential [14]. These results were significantly positive considering that acidity is a particularly challenging feature, as it is inherent to olive oil characterization, but not considered for intact olive fruit characterization. On the other hand, according to fruit moisture, the obtained R2 value calculated on the external validation set was 0.78, which was slightly lower than those published in the mentioned works (0.88, 0.88, and 0.88). However, upon considering this value along with that obtained for RMSEP (3.3%), there is an argument for considering the performance of the proposed ANN model satisfactory in this case as well, when estimating fruit moisture from the multispectral data acquired with the developed low-cost device. Finally, regarding fat content, the R2 value yielded when analyzing the external validation set was 0.62, with an RMSEP of 10.44%. In this case, the R2 value obtained when facing the reference measures and the responses of the ANN model was also lower than those noticed by the reviewed works (0.76, 0.79, and 0.72). Furthermore, the obtained RMSEP (10.44%) was higher than those published by Cayuela et al. [13] and Salguero-Chaparro et al. [15] (7.98 and 2.36). However, it was very close to 10%, thus indicating an acceptable assessment potential [14].
In the last decades, the use of low-cost spectral sensors for agricultural applications has been a topic of increasing interest [42]. This is due to a technical boom in the microelectronic industry, which has resulted in a lowering of the cost and an improvement of the features of commercially available components. There are numerous publications centered on Arduino-based devices with applications in the agri-food industry [43,44,45]. However, to our knowledge, no work focused on the quality assessment of intact olive fruit has been reported. In fact, most of the publications aimed at modeling agronomic parameters of interest for crop management by means of spectral data have focused on hyperspectral imaging systems. The works reviewed above are illustrative of this fact. The main advantage of these kinds of devices is their spatial resolution, as they generate images which allow contrasting of different parts of the sample. Furthermore, they offer a very high spectral resolution, as they catch multiple narrow spectral bands. Another characteristic of these devices is their spectral range, as they cover the near infra-red (NIR) band through frequencies distant from those of the red edge. All these features lead to high costs. Unlike these, a new custom-built multispectral device was used in this work, covering the spectral range 410–940 nm, which comprises the visible spectrum (VIS) and a close and narrow band of the near infra-red (NIR); it has a spectral resolution of eighteen bands with full width at half maximum (FWHM) of 20 nm. Compared to NIR spectrophotometers, the proposed multispectral sensor has a considerably lower spectral range and resolution. These more modest features may explain the slightly lower coefficients of determination reached in this work when estimating fruit moisture and fat content compared to the mentioned previous research, as there exist overtones out of the range covered by the proposed device related to the presence of water (1460 and 1920 nm (hydroxyl groups)) and fat content (1145 nm and 1160 nm (aliphatic esters), and 1175 nm, 1185 nm, 1210 nm, 1245 nm, 1260 nm, and 1275 nm (alkyl groups and alkenes)) [46]. Notwithstanding, even assuming this limitation, the results obtained in the present research indicate that the overtones considered are descriptive enough, denotating the suitability of the proposed multispectral device. The good performance displayed by the proposed device takes on a greater importance considering the price gap between it and the NIR spectrometers used in the mentioned research.
These satisfactory results may be due to the high flexibility of the ANN approach, which adjusts more effectively to the feature space, as it enables the non-linearity of data to be modeled using local or specific equations. These features result in an extraordinary ability to link complex spectral information with key parameters without any constraints on the sample distribution. This makes ANN approaches suitable for defining the intricate non-linear relationships that exist between olive fruit spectral signature and the studied quality indicators. This fact is evidenced by the good performance reported by the ANN model in the estimation of olive fruit moisture despite the reduced impact of the variation of this parameter on the spectral signature (Figure 4). Furthermore, the mentioned features of the ANN model allowed us to omit post-processing spectral techniques beyond the normalization based on known reflectance surfaces.
On the other hand, the good performance of ANN models in this work may also be due to the greater simplicity of the input data offered by the proposed multispectral device compared to those coming from hyperspectral systems. This kind of mathematical approach could encounter difficulties in data processing with the large information offered by hyperspectral devices. This is the reason why most of the publications based on hyperspectral systems have used PLSR as their mathematical model (Table 4), since it reduces the large amount of measured collinear spectral variables to non-correlated principal components by using data compression [47].
One widespread problem of ANN approaches is that they are susceptible to overfitting, which results in lower performance and generalization capabilities of the estimation models. In the present study, the annotated values for the coefficient of determination (R2) when confronting reference and estimated values were slightly greater in the case of the external validation group than those resulting from the internal validation during training (Figure 5, Figure 6 and Figure 7), which increases confidence in the adequate training of the net.

5. Conclusions

This work presents a complete methodology based on a low-cost and custom-built multispectral device for assessing quality parameters of intact olive fruits in a non-destructive way under laboratory conditions. ANN models were trained using the fruit moisture, acidity, and fat content as targets. Better results were obtained for the cases of the estimation of fruit moisture and acidity. However, the resulting performance regarding fat content estimation was also promising. The accuracy shown by the ANN models for estimating the mentioned quality parameters by means of the spectral data acquired with the proposed device, along with its low cost and ease of use, paves the way for the implementation of an olive fruit quality appraisal system that is more affordable for olive growers. Continuous monitoring of fruit quality conditions would allow adjustment of the moment of harvest according to objective standards instead of subjective criteria such as a visual judgment. This would improve the oleic sector as olive growers would reach the optimum economic return and olive mills would access better raw material.
Although the results were promising, further work is needed to expand the experimental setup to operate the system under field conditions, where the influence of natural light is a decisive factor.

Author Contributions

J.M.A., M.N., B.M. and A.A. conceived and directed the experimental layout. B.M. manufactured, assembled, and tested the proposed device. M.N. and B.M. carried out the data curation. M.N. developed the methodology for olive fruit quality status estimation from multispectral data. M.N. and B.M. drafted the manuscript, which was revised and edited by J.M.A. and A.A. The project administration and the funding acquisition were accomplished by J.M.A. All authors have read and agreed to the published version of the manuscript.

Funding

This work was supported by grant PID2020-119217RA-I00 funded by MCIN/AEI/ 10.13039/501100011033, and grant IJC2019-040114-I funded by MCIN/AEI/ 10.13039/501100011033, and also by project TIColiVA with grant P18-RTJ-4539 funded by the Regional Government of Andalusia through the “PAIDI, Plan Andaluz de Investigación, Desarrollo e Innovación”.

Data Availability Statement

The data presented in this study are available upon request from the corresponding author.

Acknowledgments

The authors acknowledge Francisco Dominguez Calvo, the Nuestra señora de la oliva manager, for providing the olive samples and reference data on which the study was conducted, as well as Diego Tejada, for his support in the device design.

Conflicts of Interest

The authors declare no conflict of interest. The funders had no role in the design of the study; in the collection, analyses, or interpretation of data; in the writing of the manuscript, or in the decision to publish the results.

References

  1. FAOSTAT. Available online: https://www.fao.org/faostat/en/#data/QV (accessed on 12 January 2022).
  2. López-Granados, F.; Jurado-Expósito, M.; Álamo, S.; García-Torres, L. Leaf nutrient spatial variability and site-specific fertilization maps within olive (Olea europaea L.) orchards. Eur. J. Agron. 2004, 21, 209–222. [Google Scholar] [CrossRef]
  3. Gunstone, F. Vegetable Oils in Food Technology: Composition, Properties and Uses, 2nd ed.; Gunstone, F., Ed.; Wiley-Blackwell: Oxford, UK, 2011; ISBN 9781444339918. [Google Scholar]
  4. Barranco Navero, D.; Fernandez Escobar, R.; Rallo Romero, L. El Cultivo del Olivo, 7th ed.; Mundi-Prensa Libros: Madrid, Spain, 2017. [Google Scholar]
  5. IOC (International Olive Council). Trade Standard Applying to Olive Oils and Olive Pomace Oils. 2019. Available online: https://www.internationaloliveoil.org/wp-content/uploads/2019/12/trade-standard-REV-14-Eng.pdf (accessed on 12 January 2022).
  6. Sánchez, A.G.; Martos, N.R.; Ballesteros, E. Estudio comparative de distintas técnicas analíticas (espectroscopía de NIR y RMN y extracción mediante Soxhlet) para la determinación del contenido graso y de humedad en aceitunas y orujo de Jaén. Grasas y Aceites 2005, 56, 220–227. [Google Scholar]
  7. Ragni, L.; Berardinelli, A.; Cevoli, C.; Valli, E. Assessment of the water content in extra virgin olive oils by Time Domain Reflectometry (TDR) and Partial Least Squares (PLS) regression methods. J. Food Eng. 2012, 111, 66–72. [Google Scholar] [CrossRef]
  8. Verrelst, J.; Malenovský, Z.; Van der Tol, C.; Camps-Valls, G.; Gastellu-Etchegorry, J.P.; Lewis, P.; North, P.; Moreno, J. Quantifying Vegetation Biophysical Variables from Imaging Spectroscopy Data: A Review on Retrieval Methods. Surv. Geophys. 2019, 40, 589–629. [Google Scholar] [CrossRef] [Green Version]
  9. Noguera, M.; Aquino, A.; Ponce, J.M.; Cordeiro, A.; Silvestre, J.; Calderón, R.; Marcelo, M. da E.; Pedro Jordão; Andújar, J.M. Nutritional status assessment of olive crops by means of the analysis and modelling of multispectral images taken with UAVs. Biosyst. Eng. 2021, 211, 1–18. [Google Scholar] [CrossRef]
  10. Fazari, A.; Pellicer-Valero, O.J.; Gómez-Sanchıs, J.; Bernardi, B.; Cubero, S.; Benalia, S.; Zimbalatti, G.; Blasco, J. Application of deep convolutional neural networks for the detection of anthracnose in olives using VIS/NIR hyperspectral images. Comput. Electron. Agric. 2021, 187, 106252. [Google Scholar] [CrossRef]
  11. León, L.; Rallo, L.; Garrido, A. Análisis de aceituna intacta mediante espectroscopia en el Infrarrojo Cercano (NIRS): Una herramienta de utilidad en programas de mejora de olivo. Grasas y Aceites 2003, 54, 41–47. [Google Scholar] [CrossRef]
  12. Kavdir, I.; Buyukcan, M.B.; Lu, R.; Kocabiyik, H.; Seker, M. Prediction of olive quality using FT-NIR spectroscopy in reflectance and transmittance modes. Biosyst. Eng. 2009, 103, 304–312. [Google Scholar] [CrossRef]
  13. Cayuela, J.A.; García, J.M.; Caliani, N. NIR prediction of fruit moisture, free acidity and oil content in intact olives. Grasas y Aceites 2009, 60, 194–202. [Google Scholar] [CrossRef] [Green Version]
  14. Cayuela, J.A.; Camino, M. del C.P. Prediction of quality of intact olives by near infrared spectroscopy. Eur. J. Lipid Sci. Technol. 2010, 112, 1209–1217. [Google Scholar] [CrossRef]
  15. Salguero-Chaparro, L.; Baeten, V.; Fernández-Pierna, J.A.; Peña-Rodríguez, F. Near infrared spectroscopy (NIRS) for on-line determination of quality parameters in intact olives. Food Chem. 2013, 139, 1121–1126. [Google Scholar] [CrossRef] [PubMed]
  16. Salguero-Chaparro, L.; Peña-Rodríguez, F. On-line versus off-line NIRS analysis of intact olives. LWT Food Sci. Technol. 2014, 56, 363–369. [Google Scholar] [CrossRef]
  17. Gracia, A.; León, L. Non-destructive assessment of olive fruit ripening by portable near infrared spectroscopy. Grasas y Aceites 2011, 62, 268–274. [Google Scholar]
  18. Bellincontro, A.; Taticchi, A.; Servili, M.; Esposto, S.; Farinelli, D.; Mencarelli, F. Feasible application of a portable NIR-AOTF tool for on-field prediction of phenolic compounds during the ripening of olives for oil production. J. Agric. Food Chem. 2012, 60, 2665–2673. [Google Scholar] [CrossRef]
  19. Bellincontro, A.; Caruso, G.; Mencarelli, F.; Gucci, R. Oil accumulation in intact olive fruits measured by near infrared spectroscopy-acousto-optically tunable filter. J. Sci. Food Agric. 2013, 93, 1259–1265. [Google Scholar] [CrossRef]
  20. Fernández-Espinosa, A.J. Combining PLS regression with portable NIR spectroscopy to on-line monitor quality parameters in intact olives for determining optimal harvesting time. Talanta 2016, 148, 216–228. [Google Scholar] [CrossRef]
  21. FOSS. Analytical Solutions for Food Quality Improvement and Control. Available online: https://www.fossanalytics.com/en (accessed on 21 April 2021).
  22. Trang, N.M.; Duy, T.K.; Huyen, T.T.N.; Danh, L.V.Q.; Dinh, A. An investigation into the use of a low-Cost NIR integrated circuit spectrometer to measure chlorophyll content index. Int. J. Innov. Technol. Explor. Eng. 2019, 8, 35–38. [Google Scholar]
  23. Moinard, S.; Brunel, G.; Ducanchez, A.; Crestey, T.; Rousseau, J.; Tisseyre, B. Testing the potential of a new low-cost multispectral sensor for decision support in agriculture. In Precision Agriculture ´21; Wageningen Academic Publishers: Wageningen, The Netherlands, 2021; pp. 411–418. [Google Scholar]
  24. Verrelst, J.; Muñoz, J.; Alonso, L.; Delegido, J.; Rivera, J.P.; Camps-Valls, G.; Moreno, J. Machine learning regression algorithms for biophysical parameter retrieval: Opportunities for Sentinel-2 and -3. Remote Sens. Environ. 2012, 118, 127–139. [Google Scholar] [CrossRef]
  25. Kalacska, M.; Lalonde, M.; Moore, T.R. Estimation of foliar chlorophyll and nitrogen content in an ombrotrophic bog from hyperspectral data: Scaling from leaf to image. Remote Sens. Environ. 2015, 169, 270–279. [Google Scholar] [CrossRef]
  26. Wang, F.; Huang, J.; Wang, Y.; Liu, Z.; Peng, D.; Cao, F. Monitoring nitrogen concentration of oilseed rape from hyperspectral data using radial basis function. Int. J. Digit. Earth 2013, 6, 550–562. [Google Scholar] [CrossRef]
  27. Huang, Z.; Turner, B.J.; Dury, S.J.; Wallis, I.R.; Foley, W.J. Estimating foliage nitrogen concentration from HYMAP data using continuum removal analysis. Remote Sens. Environ. 2004, 93, 18–29. [Google Scholar] [CrossRef]
  28. Jensen, R.R.; Hardin, P.J.; Hardin, A.J. Estimating urban leaf area index (LAI) of individual trees with hyperspectral data. Photogramm. Eng. Remote Sensing 2012, 78, 495–504. [Google Scholar] [CrossRef]
  29. García-Martínez, H.; Flores-Magdaleno, H.; Ascencio-Hernández, R.; Khalil-Gardezi, A.; Tijerina-Chávez, L.; Mancilla-Villa, O.R.; Vázquez-Peña, M.A. Corn Grain Yield Estimation from Vegetation Indices, Canopy Cover, Plant Density, and a Neural Network Using Multispectral and RGB Images Acquired with Unmanned Aerial Vehicles. Agriculture 2020, 10, 277. [Google Scholar] [CrossRef]
  30. Liu, W.Y.; Pan, J. A hyperspectral assessment model for leaf chlorophyll content of Pinus massoniana based on neural network. Chinese J. Appl. Ecol. 2017, 28, 1128–1136. [Google Scholar]
  31. Zipori, I.; Bustan, A.; Kerem, Z.; Dag, A. Olive paste oil content on a dry weight basis (OPDW): an indicator for optimal harvesting time in modern olive orchards. Grasas y Aceites 2016, 67, e137. [Google Scholar]
  32. Gracia, P.; Sánchez-Gimeno, A.C.; Benito, M.; Oria, R.; Lasa, J.M. Short communication. Harvest time in hedgerow ‘Arbequina’ olive orchards in areas with early frosts. Span. J. Agric. Res. 2012, 10, 179–182. [Google Scholar] [CrossRef] [Green Version]
  33. Abenoza, M.; Lasa, J.M.; Benito, M.; Oria, R.; Sánchez Gimeno, A.C. The evolution of Arbequina olive oil quality during ripening in a commercial super-high density orchard in north-east Spain. Riv. Ital. Delle Sostanze Grasse 2015, 93, 83–92. [Google Scholar]
  34. Haberman, A.; Dag, A.; Shtern, N.; Zipori, I.; Erel, R.; Ben-Gal, A.; Yermiyahu, U. Significance of proper nitrogen fertilization for olive productivity in intensive cultivation. Sci. Hortic. 2019, 246, 710–717. [Google Scholar] [CrossRef]
  35. Haberman, A.; Dag, A.; Shtern, N.; Zipori, I.; Erel, R.; Ben-Gal, A.; Yermiyahu, U. Long-Term Impact of Potassium Fertilization on Soil and Productivity in Intensive Olive Cultivation. Agronomy 2019, 9, 525. [Google Scholar] [CrossRef] [Green Version]
  36. Ben-Gal, A.; Ron, Y.; Yermiyahu, U.; Zipori, I.; Naoum, S.; Dag, A. Evaluation of regulated deficit irrigation strategies for oil olives: A case study for two modern Israeli cultivars. Agric. Water Manag. 2021, 245, 106577. [Google Scholar] [CrossRef]
  37. Williams, P.C. Handbook of Near Infrared Analysis, 2nd ed.; Burns, D.A., Ciurczak, E.W., Eds.; Marcel Dekker: New York, NY, USA, 2001. [Google Scholar]
  38. Maes, W.H.; Steppe, K. Perspectives for Remote Sensing with Unmanned Aerial Vehicles in Precision Agriculture. Trends Plant Sci. 2019, 24, 152–164. [Google Scholar] [CrossRef] [PubMed]
  39. Li, B.; Lecourt, J.; Bishop, G. Advances in Non-Destructive Early Assessment of Fruit Ripeness towards Defining Optimal Time of Harvest and Yield Prediction—A Review. Plants 2018, 7, 3. [Google Scholar] [CrossRef] [PubMed] [Green Version]
  40. Casale, M.; Simonetti, R. Review: Near infrared spectroscopy for analysingolive oils. J. Near Infrared Spectrosc. 2014, 22, 59–80. [Google Scholar] [CrossRef]
  41. Guzmán, E.; Baeten, V.; Pierna, J.A.F.; García-Mesa, J.A. A portable Raman sensor for the rapid discrimination of olives according to fruit quality. Talanta 2012, 93, 94–98. [Google Scholar] [CrossRef] [PubMed]
  42. Walsh, K.B.; Blasco, J.; Zude-Sasse, M.; Sun, X. Visible-NIR ‘point’ spectroscopy in postharvest fruit and vegetable assessment: The science behind three decades of commercial use. Postharvest Biol. Technol. 2020, 168, 111246. [Google Scholar] [CrossRef]
  43. Di Nonno, S.; Ulber, R. Portuino—A Novel Portable Low-Cost Arduino-Based Photo- and Fluorimeter. SSRN Electron. J. 2022, 12. [Google Scholar] [CrossRef]
  44. Poh, J.J.; Wu, W.L.; Goh, N.W.J.; Tan, S.M.X.; Gan, S.K.E. Spectrophotometer on-the-go: The development of a 2-in-1 UV–Vis portable Arduino-based spectrophotometer. Sensors Actuators A Phys. 2021, 325, 112698. [Google Scholar] [CrossRef]
  45. Noguera, M.; Millán, B.; Pérez-Paredes, J.J.; Ponce, J.M.; Aquino, A.; Andújar, J.M. A New Low-Cost Device Based on Thermal Infrared Sensors for Olive Tree Canopy Temperature Measurement and Water Status Monitoring. Remote Sens. 2020, 12, 723. [Google Scholar] [CrossRef] [Green Version]
  46. Westad, F.; Schmidt, A.; Kermit, M. Incorporating chemical band-assignment in near infrared spectroscopy regression models. J. Near Infrared Spectrosc. 2008, 16, 265–273. [Google Scholar] [CrossRef]
  47. Wold, S.; Sjöström, M.; Eriksson, L. PLS-regression: A basic tool of chemometrics. Chemom. Intell. Lab. Syst. 2001, 58, 109–130. [Google Scholar] [CrossRef]
Figure 1. (a) Schematic of the components of the developed low-cost device based on a multispectral sensor. (b) Basic diagram of the developed device: (1) spectral detector, (2) light source, (3) sample, (4) incident light, and (5) reflected light.
Agronomy 12 00979 g001
Figure 2. Example of an olive sample measurement taken during the spectral data acquisition.
Agronomy 12 00979 g002
Figure 3. Pre- and post-processed spectrum (410–940 nm) of a given sample. (a) Raw spectrum of the known reflectance surface (black), and raw spectrum of the given sample (green). (b) Calibrated spectrum of the given sample based on the reflectance of the known reference surface.
Agronomy 12 00979 g003
Figure 4. Reflectance responses of olive fruits in the upper limit (grey) and the lower limit (green) of moisture (a), fat content (b), and acidity (c). Each graph includes 40 samples (corresponding to approximately the 5th and above the 95th percentile respectively for each parameter). Furthermore, the mean reflectance curve of the 20 samples in the upper limit (black) and the 20 samples in the lower limit (dark green) are represented.
Agronomy 12 00979 g004
Figure 5. Linear regression between fruit moisture target values and those estimated through ANN model. Each subfigure represents the dataset of training (a), validation (b), test (c), and the whole dataset (d).
Agronomy 12 00979 g005
Figure 6. Linear regression between fruit acidity target values and those estimated through ANN model. Each subfigure represents the dataset of training (a), validation (b), test (c), and the whole dataset (d).
Agronomy 12 00979 g006
Figure 7. Linear regression between fruit fat content target values and those estimated through ANN model. Each subfigure represents the dataset of training (a), validation (b), test (c), and the whole dataset (d).
Agronomy 12 00979 g007
Table 1. List of the developed device components and associated cost.
DescriptionApprox. Cost (€)
AS7265x development board150
Arduino MKR24
Light source3
Other components (PTFE disc, PLA for device enclosure, etc.)10
Total187
Table 2. Statistics for the olive fruit dataset in relation to moisture, acidity, and fat content.
RangeMeanSD
Moisture (%)44.58–68.2960.403.26
Acidity (%)0.25–0.520.380.06
Fat content (%)8.92–24.4316.322.45
Table 3. R2 and RMSEP between reference values of olive fruit moisture, acidity, and fat content and those estimated values based on ANN approaches.
Moisture (%)Acidity (%)Fat Content (%)
R20.780.860.62
RMSEP3.315.8310.44
Table 4. Summary of articles addressing the estimation of olive fruit moisture, acidity, and fat content by means of spectral data.
This WorkFernández-Espinosa (2016) [20]Salguero-Chaparro et al., (2013) [15]Cayuela et al., (2009) [13]
ChemometricANNPCA-PLSPCA-PLSPCA-PLS
Range410–9401000–2300380–16901100–2300
StatisticsR2RMSEPR2RMSEPR2RMSEPR2RMSEP
Moisture0.783.310.884.980.883.30.881.52
Acidity0.865.830.8338.80.722.70.790.05
Fat content0.6210.440.76200.792.360.727.98
Publisher’s Note: MDPI stays neutral with regard to jurisdictional claims in published maps and institutional affiliations.

