Article

Allelic Complementation in Hybrid Superiority of Popcorn to Multiple Foliar Diseases

by
Divino Rosa dos Santos Junior
*,
Rodrigo Moreira Ribeiro
,
Antônio Teixeira do Amaral Junior
,
Marcelo Vivas
,
Julio Cesar Gadice Saluce
,
Jhean Torres Leite
,
Rosimeire Barboza Bispo
,
Valter Jário de Lima
,
Danielle Leal Lamego
,
Kevelin Barbosa Xavier
,
Kátia Fabiane Medeiros Schmitt
,
Samuel Henrique Kamphorst
*,
Flávia Nicácio Viana
,
Alexandre Pio Viana
and
Messias Gongaza Pereira
Laboratory of Plant Breeding, Center of Agricultural Science and Technology, Darcy Ribeiro State University of Northern Rio de Janeiro, Av. Alberto Lamego, 2000, Campos dos Goytacazes 28013-602, RJ, Brazil
*
Authors to whom correspondence should be addressed.
Agronomy 2022, 12(12), 3103; https://doi.org/10.3390/agronomy12123103
Submission received: 31 October 2022 / Revised: 1 December 2022 / Accepted: 5 December 2022 / Published: 7 December 2022
(This article belongs to the Special Issue Research Progress on Pathogenicity of Fungus in Crop)

Abstract

:
Popcorn cultivation has been growing in and has positively affected the Brazilian economy. However, these crops are grown with genotypes susceptible to diseases, generating high losses. Thus, studies aimed at obtaining resistant genotypes are particularly interesting, as popcorn is susceptible to several pathogens. The most efficient, environmentally correct, and economical method of disease control is using resistant cultivars. The present study aimed to evaluate the performance of inbred lines of popcorn and their respective testcross hybrids in terms of diseases caused by fungi. For this purpose, 15 S7 inbred lines were crossed with five testers, four with a narrow genetic basis (inbred lines L270, L651, P1, and L70) and one with a broad genetic basis (open pollination variety PARA 172). The arrangement of treatments in incomplete blocks (lattice 10 × 10) with three replications was used. The testcross was efficient in the discrimination per se of the progenies and the testers. The inbred lines L685, L691, L696, and L684 and the PARA 172 tester showed potential resistance to P. polysora, B. maydis, and E. turcicum. The GT biplot method proved reliable in identifying efficient, responsive, and resistant inbred lines and revealing the hybrid 56 as the ideal genotype.

1. Introduction

Popcorn is a food that has a famous nutraceutical value, in addition to its high added value, moving a market of more than one billion dollars annually in the USA. Brazil is a major consumer and importer of the product. The scarcity of cultivars developed by institutions established in Brazil does not favor adaptation in the cultivation of imported genotypes, which have, in the attack of diseases, become the main obstacle to increasing grain yield [1,2,3,4,5,6].
In Brazil, the most significant aggravation of the incidence and severity of diseases in popcorn are foliar ones, whose leading causes come from cultivation throughout the year under irrigation, using, in most cases, susceptible cultivars, resulting in drastic reductions in yield and the quality of the popping expansion of the grains, culminating in the depreciation of the commercial value of the popcorn [1,3,4,7,8,9,10]. In popcorn, foliar diseases reduce the photosynthetic capacity of plants resulting in a shortening of the life cycle and a reduction in the productive potential of the crops, with a decrease in leaf area, vigor, and grain weight [11].
Using cultivars with genetic resistance is the most viable, environmentally correct, and economical method of disease control [11,12,13]. Therefore, the development of resistant hybrid cultivars should receive special attention from popcorn breeders, as it is a promising effort to produce the best cultivars for disease resistance [6,13].
Studies have demonstrated significant effects of oligogenic and quantitative resistance to foliar diseases in maize and popcorn, which makes their breeding procedures a highly consistent prospect for obtaining superior genotypes [3,13,14,15,16,17,18,19,20]. Therefore, testcrosses are feasible options as they allow the estimation of the average performance of inbred lines in a series of crosses (general combining ability). The specific combining ability refers to the positive/negative genetic value added to the expected average performance of the inbred lines involved due to the interaction between those particular genotypes, which may help in identifying good hybrid combinations in addition to allowing the obtaining of estimates that allow the knowing of the inheritance of resistance of fundamental importance for the implementation of more efficient breeding programs [21,22].
This study aimed to evaluate the effects of the general and specific combining ability and assess the performance of inbred lines (S7) and their respective popcorn hybrids from crosses with testers regarding the incidence and severity of diseases caused by the fungi Puccinia polysora, Exserohilum turcicum, and Bipolaris maydis, which are associated with agronomic traits of economic importance—grain yield and popping expansion—as new crop options for Brazilian agribusiness.

2. Materials and Methods

2.1. Genetic Material

Fifteen S7 inbred lines from the open-pollinated variety UENF-14 adapted to tropical conditions were used after six cycles of recurrent intrapopulation selection in the north and northwest regions of the State of Rio de Janeiro, Brazil [1,23,24,25]. The inbred lines were crossed with four testers with a narrow genetic base—inbred lines L70, P1, L270, and L651—and one with a broad genetic base—open pollination variety PARA 172 (Table 1).
The L70 tester was derived from the BRS Angela population, developed by Embrapa Milho e Sorgo from a recurrent selection in the CMS-43 compound, to increase the popping expansion [26], with it having been identified as a promising source of resistance to B. maydis and P. polysora [3,4,27,28]. Line P1 came from the triple hybrid Zélia [26] and was highlighted as a provider of favorable alleles for resistance to P. polysora, Fusarium ssp., and B. maydis by Kurosawa et al. (2017) [3,4], Mafra et al. (2018) [27], and Santos et al. (2019) [28]. Line 651 was extracted from the ARZM-13050 population, whose variety was susceptible to B. maydis by Kurosawa et al. (2017) [3,4], having been originally from Argentina and donated to UENF by CIMMYT. Line L270 was extracted from the open-pollinated variety PARA 172—used here as a tester with a broad genetic base—whose population was described by Kurosawa et al. (2017) [3,4] as a source of resistance alleles to E. turcicum, B. maydis, and P. polysora.
The whole procedure to obtain the hybrids was performed in a manually directed way following the methodology applied in the Laboratory of Plant Genetic Breeding (LMGV) of the Universidade Estadual do Norte Fluminense Darcy Ribeiro (UENF). Specifically, after establishing all the hybrid combinations to be carried out, ears of each female parent were covered with plastic bags before a single stigma-style structure emerged from the leaf to avoid any contamination. When these were ready to be crossed, the tassels were covered, whose pollen was already being released, using a kraft paper bag.
The directed crosses were made the day after the tassel covering using the paper bags with the pollen grains of each male parent to quickly and carefully pollinate and subsequently protect the ears of each female parent. In the following step, the pollinations were performed on approximately 40 ears per cross to achieve an adequate number of seeds for evaluating the hybrids.

2.2. Experimental Design

The field trial consisted of a total of 100 treatments, with 75 hybrids and their parents in addition to five controls, designated as L51, L88, ARZM 13050, UFV-M2 Barão of Viçosa, and the cultivar UENF HS02, registered from the UENF in 2017 at the Ministry of Agriculture, Livestock, and Food Supply. Not only ARZM 13050 but also the UFV-M2 Barão de Viçosa population and the L51 and L88 inbred lines were characterized by Kurosawa et al. (2017) [3,4], Santos et al. (2017) [28], and Mafra et al. (2018) [27] as susceptible to the study diseases. The cultivar UENF HS02 was used as a control due to its good performance for grain yield and popping expansion, allowing the assessment of the potential of hybrids for these traits [21].
The field trial was installed at Colégio Agrícola Antônio Sarlo, in Campos dos Goytacazes, State of Rio de Janeiro, Brazil. The treatments were randomized following an incomplete block design with three replications in a 10 × 10 lattice arrangement totaling 300 experimental units. Each experimental unit consisted of 25 plants spaced 0.20 m apart and with 0.90 m between rows, resulting in a density of 55,000 plants ha−1. The entire experimental unit was bordered with the L80 variety, which was susceptible to the diseases naturally evaluated here, so that all experimental units had the same inoculum reception conditions and that there was a source of infection throughout the area since the occurrence of the disease would happen without inoculation.

2.3. Traits Evaluated

2.3.1. Agronomic

The following traits were evaluated: (i) grain yield (GY), obtained by measuring the mass of grains in each plot after the cob removal, expressed in kg·plot−1, later transformed to kg·ha−1; and (ii) popping expansion (PE), which was determined in the laboratory by using an Electrolux microwave oven, model MEF41, placing 30 g of seeds in a unique kraft paper bag for popping at 1000 W for two minutes and twenty seconds, and, afterward, the volume of popcorn expanded was measured. Two replicates per treatment were used.

2.3.2. Foliar Diseases

The identification and estimation of symptoms quantified the reaction of genotypes to leaf diseases. To this end, two strategies were adopted to obtain the estimates: measurement of the percentage of symptoms along the plant and measurement of the percentage of symptoms along the leaf immediately below the first ear, comprising, respectively, incidence on the plant and severity on the leaf.

2.3.3. Puccinia polysora

To assess the incidence of P. polysora—IPp—in the entire plant, the diagrammatic scale adopted by Agroceres (1996) [29] was used, which has a range of grades between 1 and 9: grade 1 refers to 0% incidence; grade 2, up to 0.5% incidence; grade 3, up to 10% incidence; grade 4, up to 30% incidence; grade 5, up to 50% incidence; grade 6, up to 70% incidence; grade 7, up to 80% incidence; grade 8, up to 90% incidence; and grade 9, up to 100% incidence. To assess the severity of P. polissora—SPp—the leaf below the first ear was used, adopting the modified Cobb scale (Chester, 1950) [30] with gradations ranging from 5 to 100%.

2.3.4. Bipolaris maydis

The incidence in the plant of B. maydis—IBm—was measured with the aid of the diagrammatic scale of notes proposed by Agroceres (1996) [29]. The severity of B. maydis—SBm—was measured with the aid of a diagrammatic scale proposed by James (1971) [31].

2.3.5. Exserohilum turcicum

The incidence in the plant of E. turcicum—IEt—was measured with the aid of the diagrammatic scale of notes proposed by Agroceres (1996) [29]. To classify the severity of E. turcicum—SEt—the diagrammatic scale suggested by Vieira et al. (2012) [14] was used.

2.4. Statistical and Genetic Analysis of Traits

2.4.1. Variance Analysis

The analysis of variance model in incomplete blocks was based on the linear expression Yijk = m + Gi + rj + bk(j) + eijk, where Yijk = observed value of treatment i in block k (k = 10) within repetition j; m = general trait constant; Gi = fixed effect of genotype i, i = 1, 2,..., 100 considering NID (0, ΦG); rj = fixed effect of repetition j, where j = 1, 2, 3; bk(j) = random effect of incomplete block k (k = 1, 2,…, 10) ranked within repetition j considering NID (0, σ2B); and eijk = experimental error associated with the observation Yijk, where NID (0, σ2). The variance components were estimated considering the random effects of blocks and the effects of genotypes were fixed using the SAS software [32].

2.4.2. Partial Diallel

The means of the adjusted treatments were considered using the model proposed by Griffing (1956) [33] through the Genes Program [34]. The hybrid combinations were evaluated with p S7 progenies (Group I) and q testers (Group II). Based on the variance analysis, the treatment squares were decomposed in terms of general combining ability via the statistical model: g i ^ = 1 q + 4 [ Y i . + 2 Y i 0 1 p ( Y H + 2 Y ( 1 ) ) ] ; g j ^ = 1 q + 4 [ Y . j + 2 Y 0 j 1 q ( Y H + 2 Y ( 2 ) ) ] , and in terms of specific combining ability via the statistical model: S i j ^ = Y i j [ m ^ + g i ^ + g j ^ + 1 2 ( d 1 ^ + d 2 ^ ) ] , in which g i ^ is effect of the general combining ability of the i-th parent of Group I; g j ^ is effect of the general combining ability of the j-th parent of Group II; S i j ^ is effect of the specific combining ability of the j-th parent of Group II; Y i j is the mean of the cross involving the i-th parent of Group I and the j-th parent of Group II; Y i 0 is the mean of the i-th parent in Group I; Y 0 j is the average of the j-th parent of Group II; m ^ is the diallel overall mean; and d 1 and   d 2   are   contrasts involving the means of Groups I and II and the overall mean. The statistical model YIJ = μ + gi + gj + SIj + εij was used, in which YIJ = average value of the hybrid combination between the i-th inbred line S7 of Group I and the j-th tester of Group II; μ = general trait constant; gi = effect of the general combining ability of the i-th parent in Group I; gj = effect of the general combining ability of the j-th parent in Group II; SIj = effect of the specific combining ability of the hybrids formed from Groups I and II, respectively; and εij = mean experi-mental error. The effect of progenies and testers was considered fixed.

2.4.3. GT Biplot

The dispersions were constructed concerning the phenotypic means of each hybrid for the agronomic traits—GY and PE—and the incidence and severity of P. polysora, B. maydis, and E. turcium. The model used for the multivariate analysis GT biplot [35] was: T ij   T ¯ IJ S j = λ 1 ζ i 1 τ j 1 +   λ 2 ζ i 2 τ j 2 + ε i , where T_ij is the value observed in the i-th genotype and j-th trait; T ¯ _IJ represents the average of all genotypes in the trait j; λ_1 and λ_2 are the singular eigenvalues for PC1 and PC2, respectively; ζ_i1 and ζ_i2 are the PC1 and PC2 scores, respectively, for the genotype i; τ_j1 and τ_j2 are the PC1 and PC2 scores, respectively, for trait j; εi is the model residue associated with genotype and trait; and Sj is the standard deviation estimate.
Statistical analyses were performed using the R software [36] and the GGEBiplotGUI package. To generate the genotypes vs. traits biplot analysis (GT biplot) graph, the scores assigned to the pathogenic traits (incidence and severity) were inverted since the genotypes with the lowest observations of pathogen attack were assigned the lowest scores for the traits, as shown in the diagrammatic tables.

3. Results

3.1. Analysis of Variance

There were statistically significant differences (p ≤ 0.01) for the agronomic traits, incidence, and severity among the diseases studied in the comparison between treatments (Table 2), which demonstrated the existence of genetic variability.
The contrast between female parents and testers based on mean squares estimates showed a significant difference for all the agronomic traits evaluated (Table 2). Considering the incidence and severity of the diseases under study, genetic variability was observed for the incidence of P. polysora and B. maydis and the severity of E. turcicum. For the other traits—IEt, SPp, and SBm—the groups of parents and testers showed similar behavior, which did not differ statistically.
Alluding to the effects of GCA, parent groups I and II behaved similarly, showing significant estimates for the evaluated agronomic traits and the incidence and severity of P. polysora and E. turcium. As for the hybrid crosses, the estimates of the effects of SCA for agronomic traits were highly significant (GY and PE), which was similarl to what happened for the incidence of B. maydis and the severity of P. polysora, while a significance at p ≤ 0.05 was observed for the SCA of incidence of P. polysora and the severity of E. turcicum. The incidence of E. turcicum and the severity of B. maydis did not reveal significance at p ≤ 0.05.

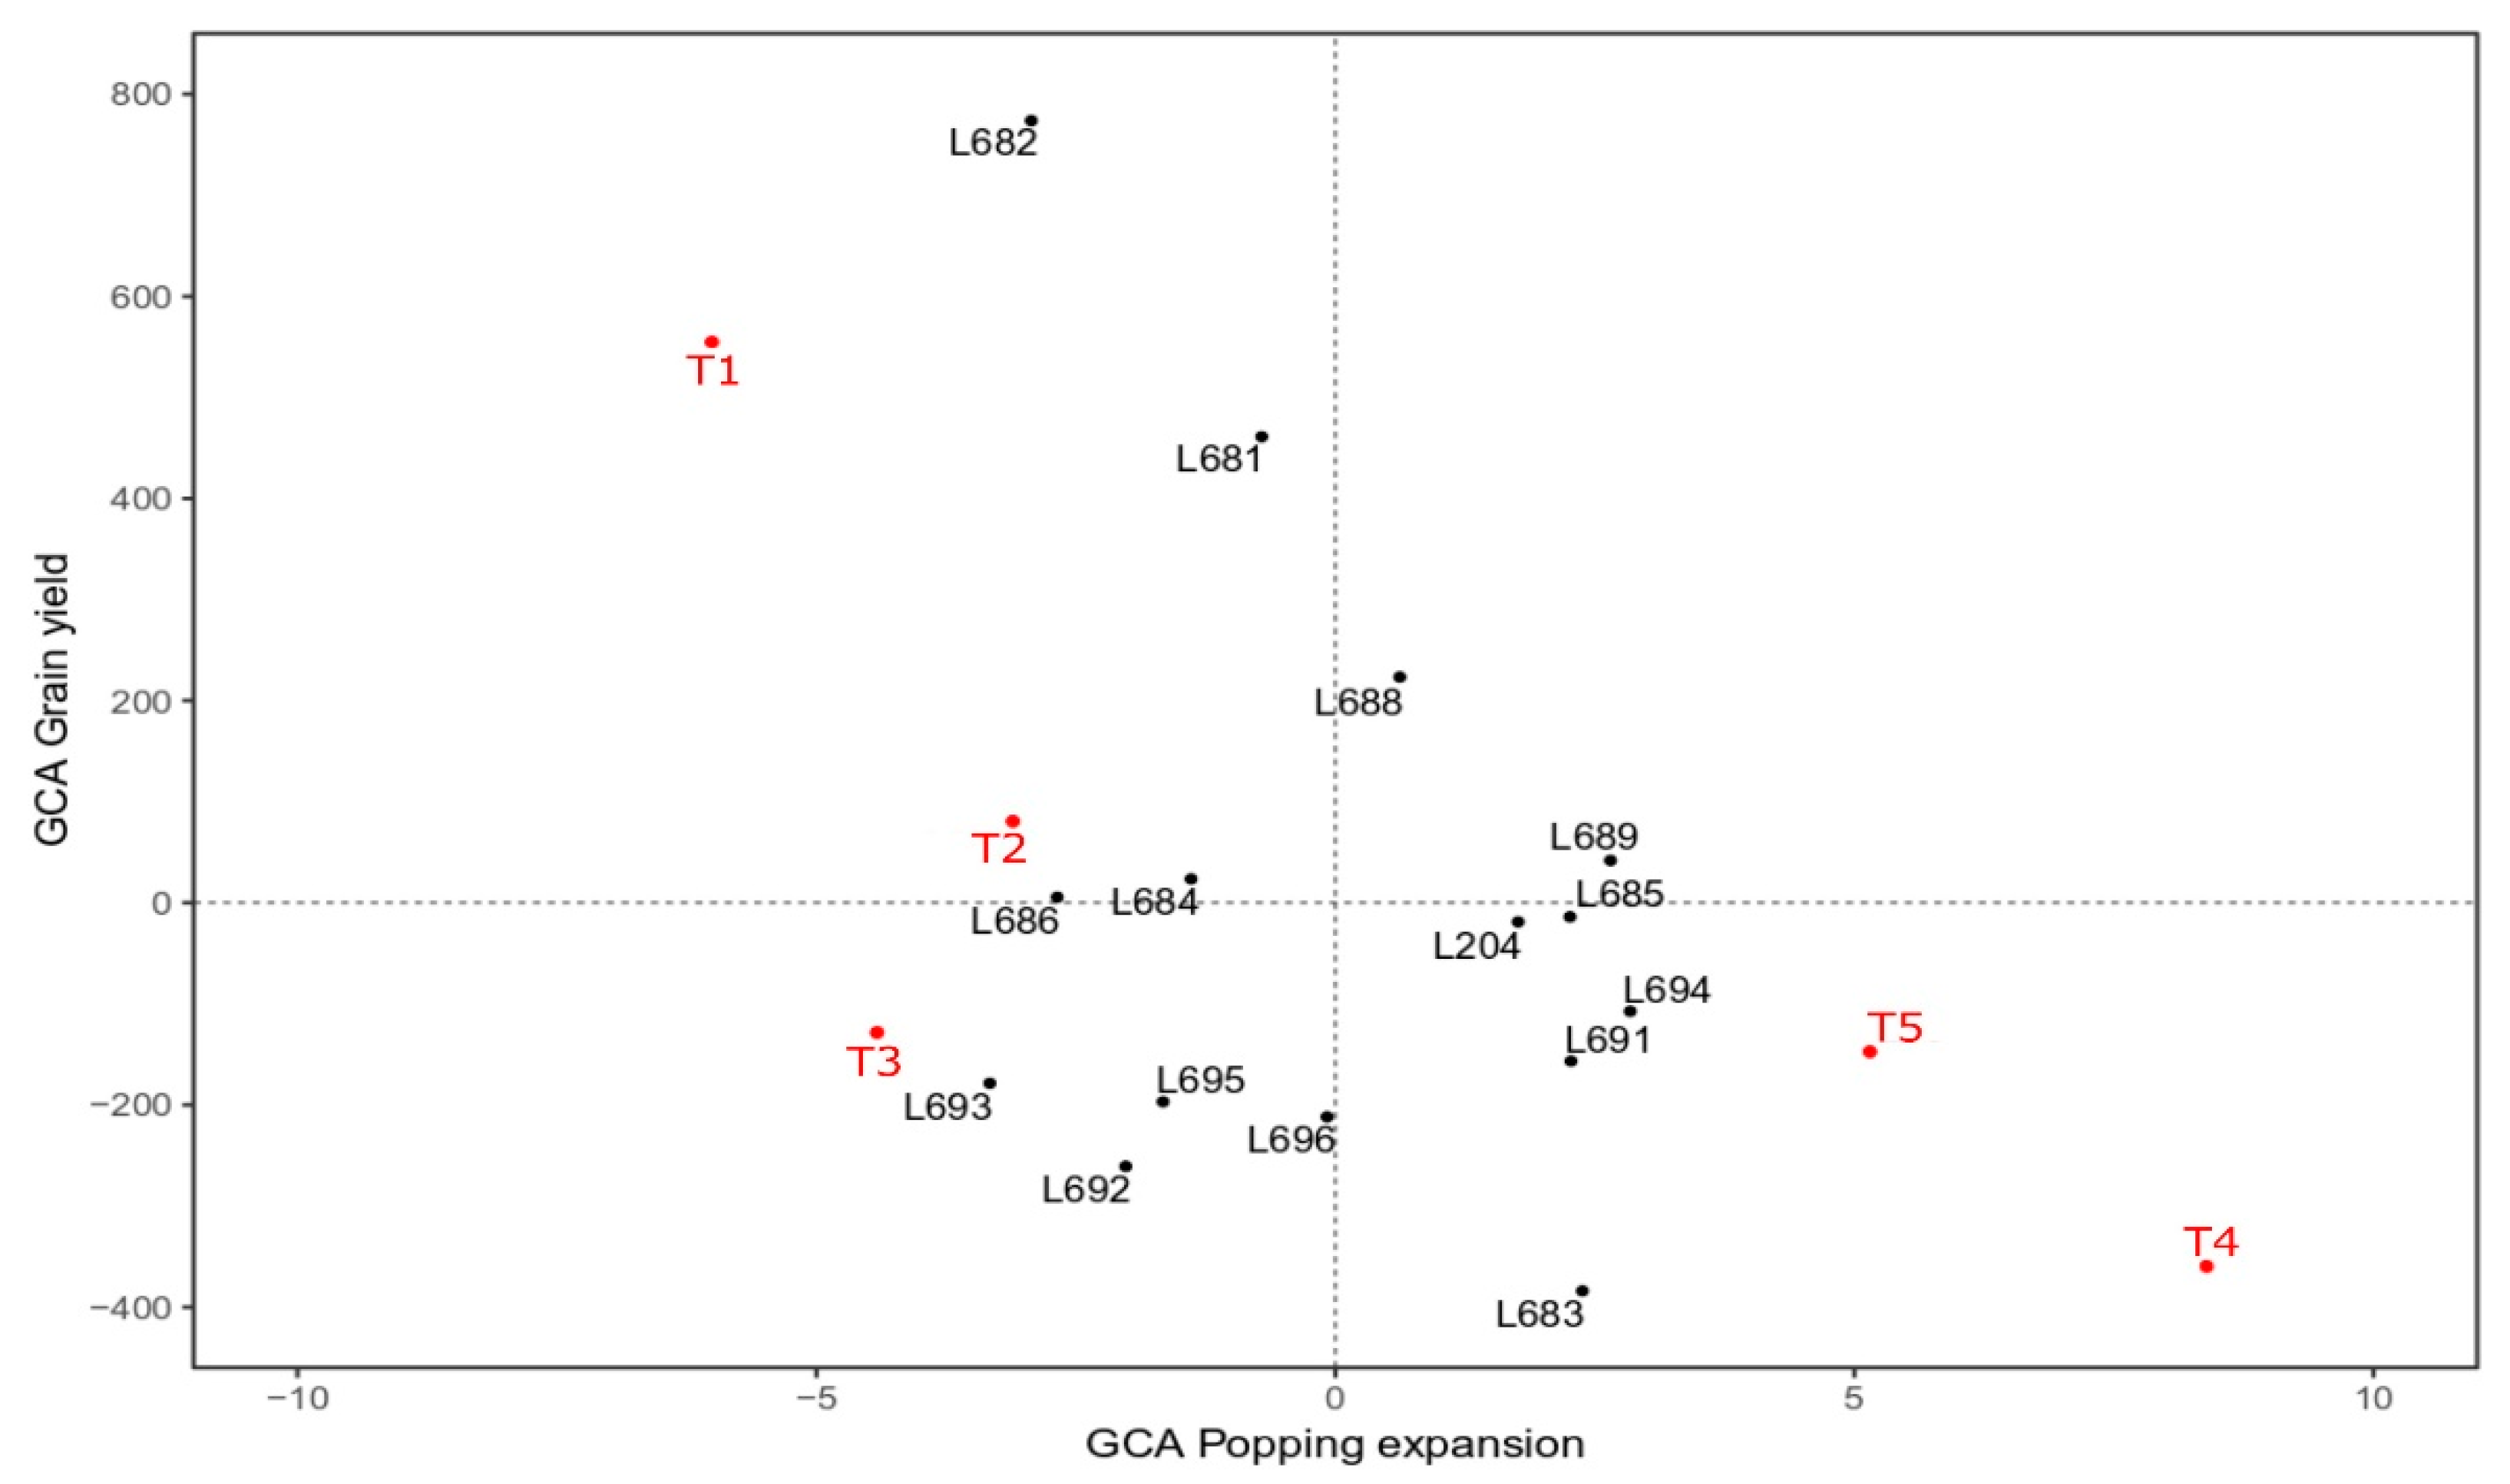
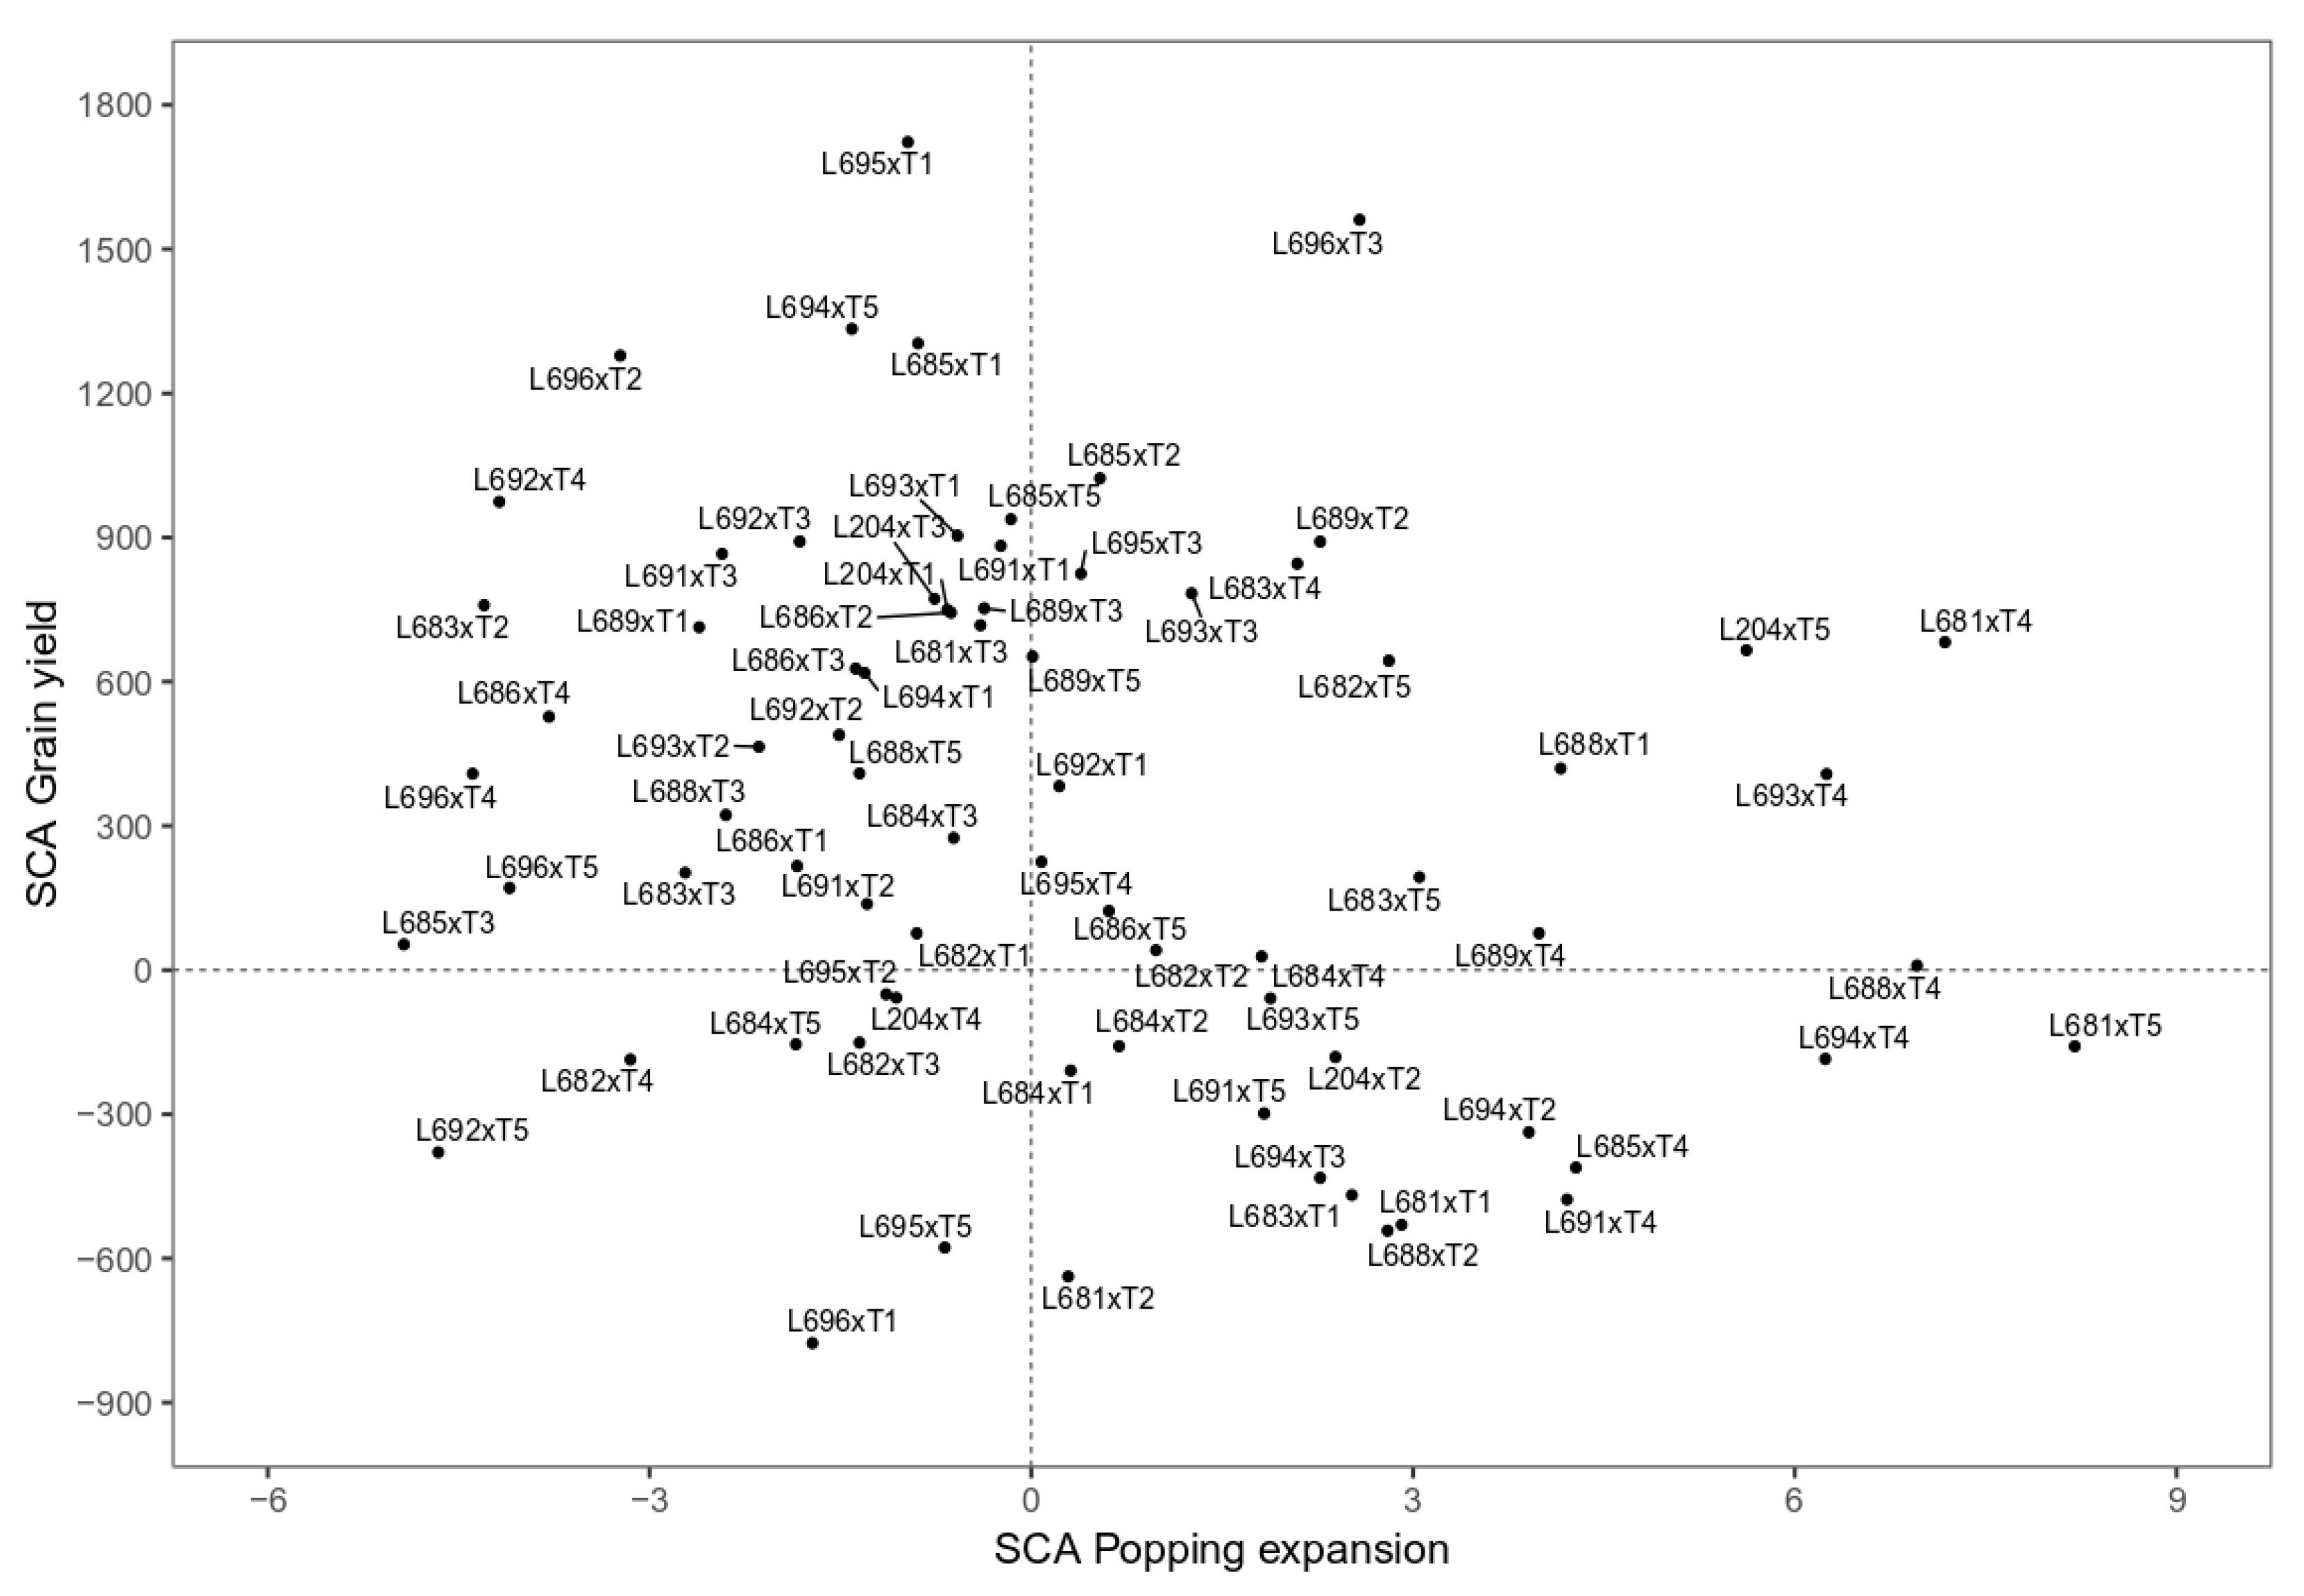
3.2. Estimates of Combinatorial Capabilities

The effects of GCA for the traits studied expressed values whose signs varied between negative and positive depending on the parent used (Figure 1). Among the fifteen inbred lines tested per se, six expressed positive values for GY, namely: L682, L681, L688, L689, L684, and L686. As for the testers, only two showed positive values, which occurred with the PARA 172 population and the L270 line.
For the trait PE, seven tested inbred lines showed positive values: L694, L689, L683, L691, L685, L204, and L688. As for the testers, only two showed positive values, in this case, P1 and L70. The inbred lines L688 and L689 showed positive values for both traits.
As for the incidence of P. polysora (IPp), nine genotypes of the tested inbred lines (Group I) showed negative values for GCA—L682, L685, L696, L681, L684, L686, L688, L692, and L691—and seven were harmful to severity (SPp)—L696, L685, L682, L688, L684, L91, and L681. Five of these genotypes were similar in the signal direction: L696, L685, L682, L684, and L681. In the case of testers for these same traits, PARA 172 and L270 were the only ones that showed negative values for both IPp and SPp (Table 3).
Regarding Helminthosporiosis, having B. maydis as the causative agent and taking into account the estimates of the GCA incidence of Group I (IBm) of this pathogen, it was found that six genotypes expressed negative values—L696, L683, L685, L691, L684, and L204—these being the ones that tended to reduce the reaction of the disease in the offspring. As for the severity of B. maydis (SBm), eight genotypes with negative GCA estimates were identified: L685, L683, L681, L692, L684, L693, L696, and L691. Considering, in a unifying way, IBm and SBm, five inbred lines—L685, L683, L681, L684, and L691—expressed the desired effects for incidence and severity. Regarding IBm, only two testers showed negative values, namely L270 and L70. As for SBm, three testers expressed negative estimates: PARA 172, L651, and P1 (Table 3).
The specific combining ability (SCA) effects for GY and PE revealed 20 hybrids with positive values for both traits (Figure 2). Predominantly, among the hybrid combinations, at least one parent was registered with a positive SCA value for GY or PE. However, three combinations that shared the same tester did not present any parent with positive SCA estimates: L693 × L651, L695 × L651, and L696 × L651.
For GY, it was possible to identify 52 hybrid combinations with positive SCA values (Figure 2) ranging from 9.32 to 1722.87. The six hybrid combinations that exhibited the highest estimates for this trait were L695 × PARA 172, L696 × L651, L694 × L70, L685 × PARA 172, L696 × L270, and L685 × L270. Considering PE, 35 combinations expressed positive estimates for SCA (Figure 2). Among these combinations, the pairs with the highest magnitudes were L681 × L70, L681 × P1, L688 × P1, L693 × P1, and L694 × P1.
Considering the SCA values for IPp, 39 hybrids showed negative values, especially L684 × L70, L688 × P1, L682 × L70, L683 × P1, and L681 × L70, for exhibiting the most negative values of -15.11, -12.59, -10.98, -10.96, and -9.75, respectively. Regarding SPp, 40 hybrid combinations showed negative estimates, and the hybrids with the most relevant values were L204 × L651, L204 × PARA 172, L204 × L270, L685 × P1, and L694 × PARA 172 (Table 4).
The SCA estimates for IBm revealed fifty-two hybrids with negative estimates, and the five combinations with the most expressive values were L694 × L651, L691 × P1, L689 × P1, L688 × L651, and L688 × L270. Concerning SBm, there were thirty-three hybrids with negative values, and the five superior crosses were L695 × L270, L689 × PARA 172, L204 × L651, and L695 × L651 (Table 4).
Concerning SCA for IEt, the estimates obtained revealed forty-seven hybrids with negative values, among which the five superior ones were L692 × P1, L694 × L70, L691 × L270, L685 × L270, and L695 × L270 (Table 4). Regarding SEt, 40 hybrids were identified with negative values, the most expressive pairs being L270, L683 × L270, L694 × L70, L204 × L270, and L688 × L270.

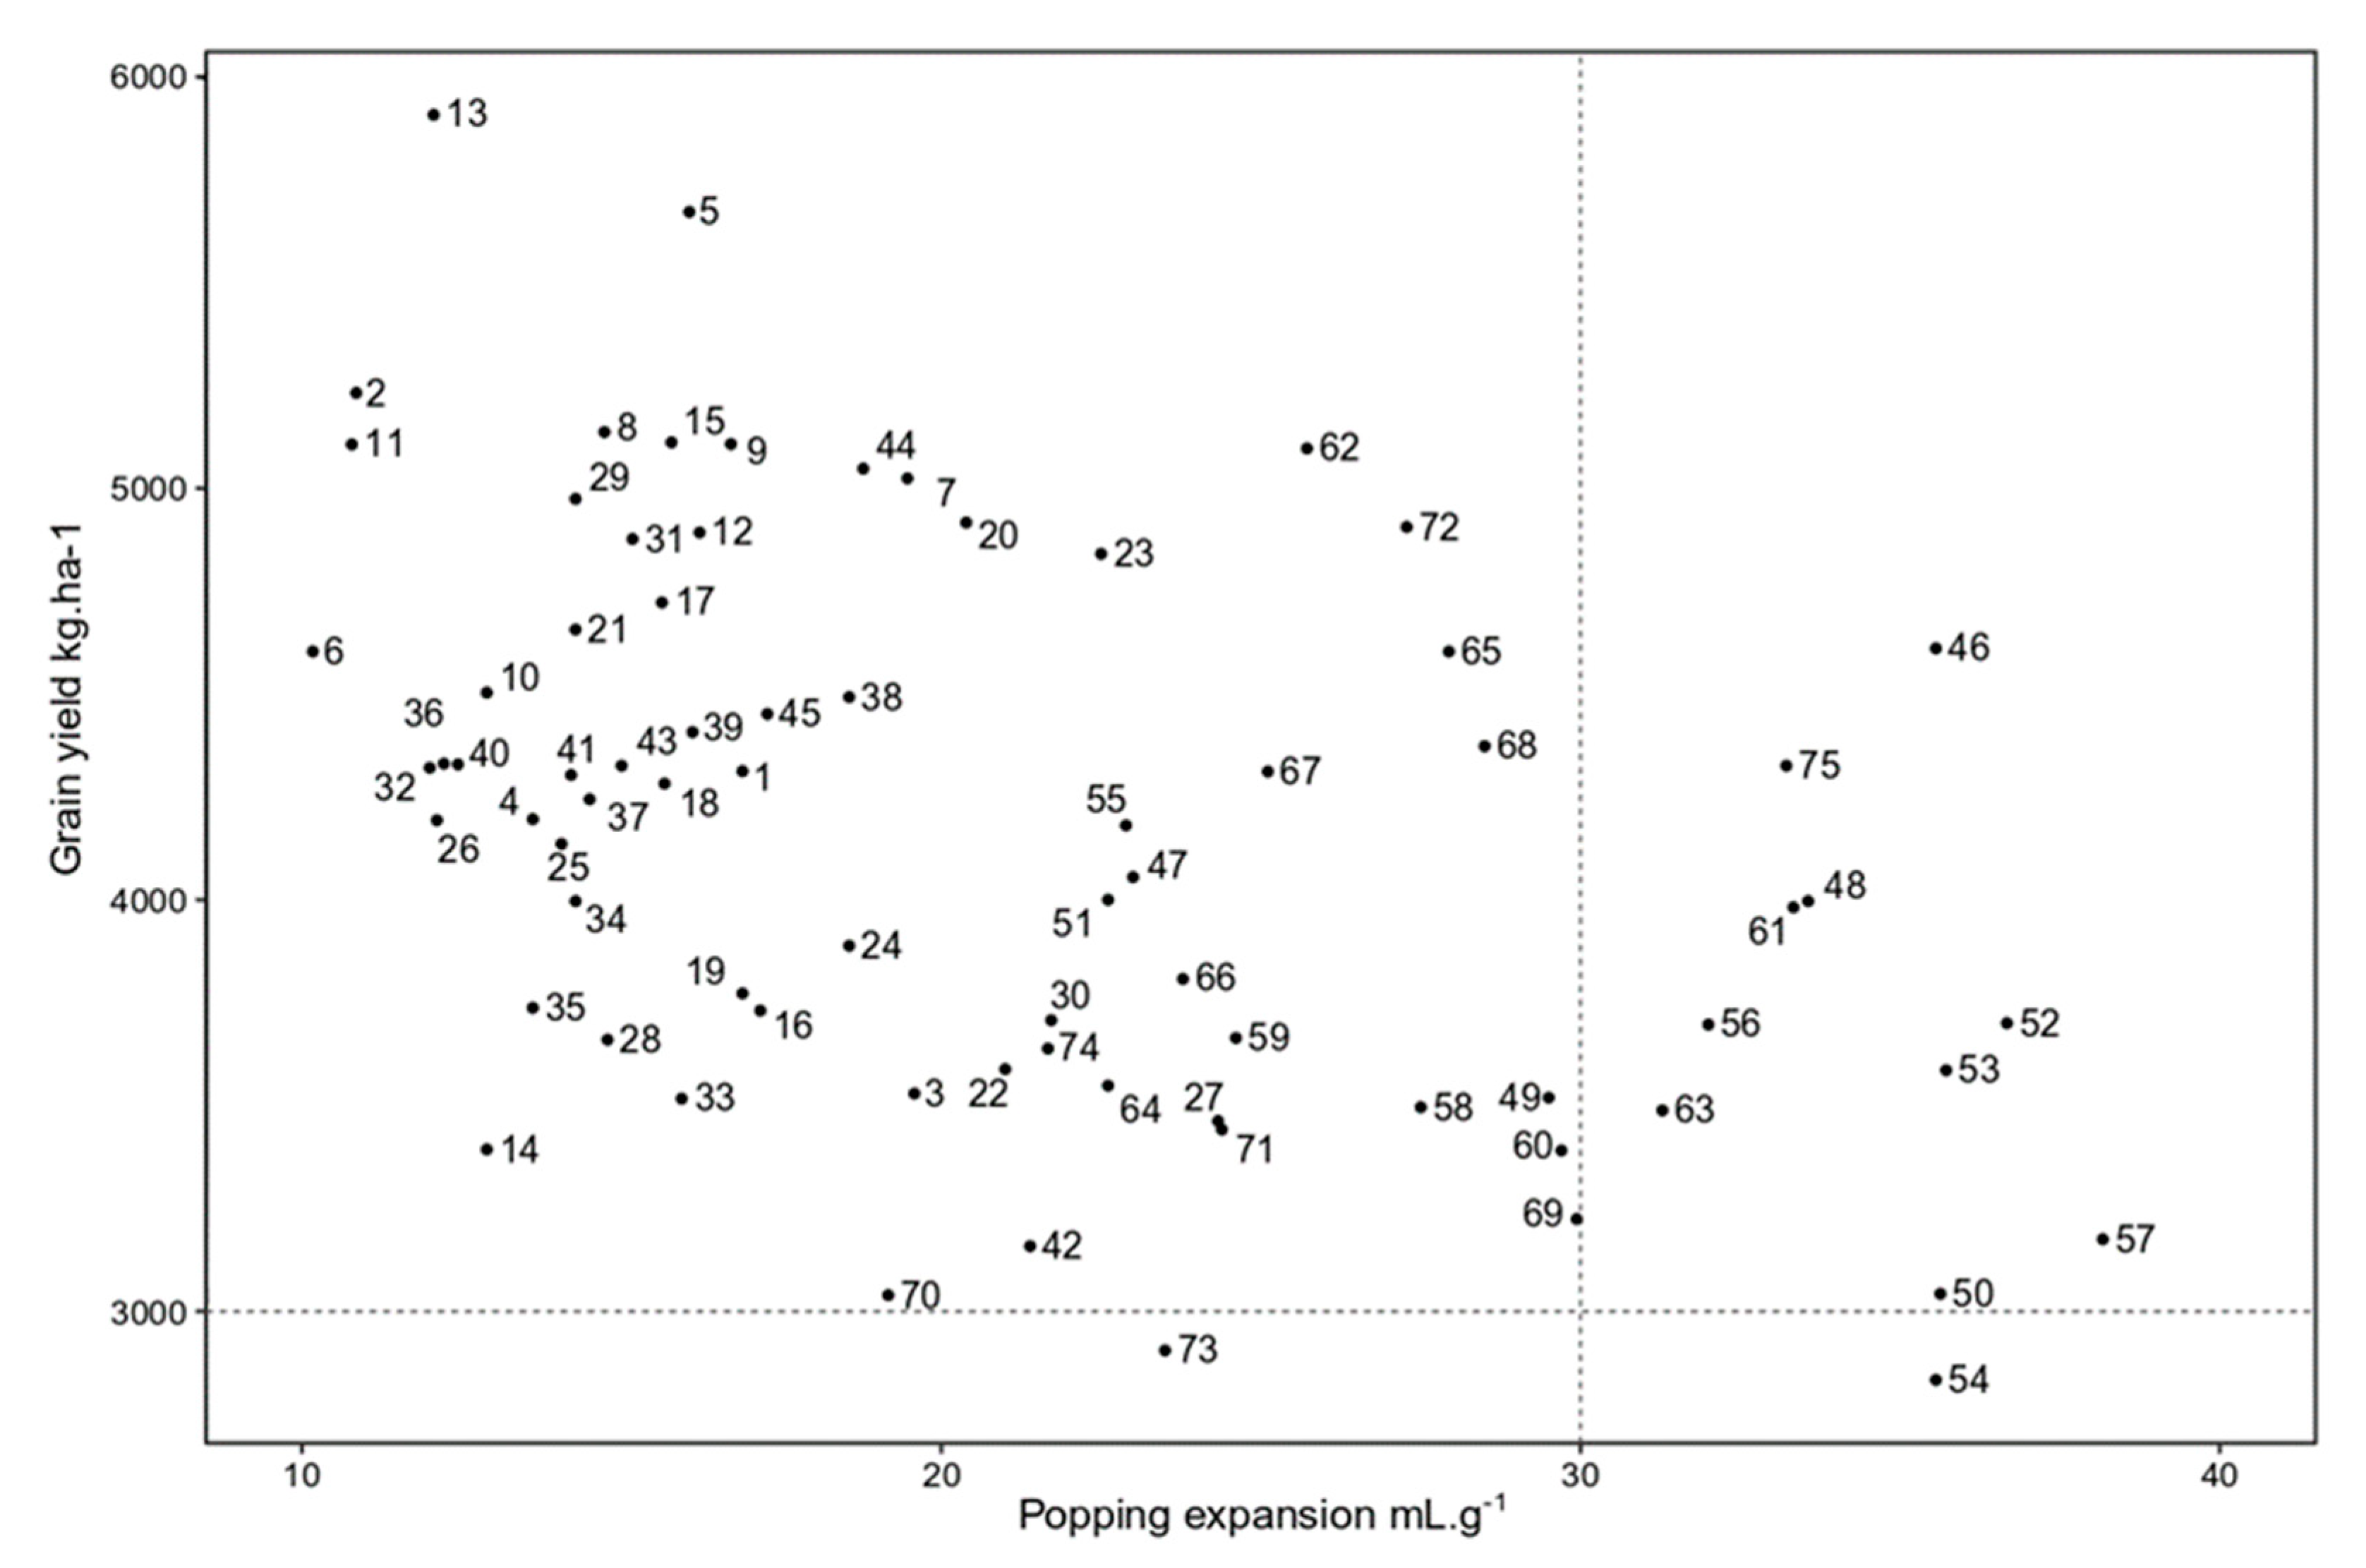
3.3. The Best Hybrids Based on Means of GY and PE

There was a significant difference between the hybrid combinations (p ≤ 0.01). The general average estimate for grain yield was 4152.48 kg ha−1; for popping expansion, it was 20.98 mL g−1 (Table 5).
Considering the genetic variability and identifying hybrids with a predominance of superiority for grain yield and popping expansion, a genotype dispersion chart was prepared based on the two main agronomic traits of the popcorn (Figure 3).
The values of 3000 kg ha−1 determined the cut-off points for GY and 30 mL g−1 for PE, which refer to the minimum required cultivar registration at the Ministry of Agriculture, Livestock and Food Supply (MAPA). GY estimates for the hybrid combinations ranged from 2833.97 to 5907.50 kg ha−1, and 97.33% of these allelic combinations showed grain yields higher than the minimum required for cultivar registration. For popping expansion, there was a variation from 10.16 to 38.16 mL g−1, with 14.66% of the hybrids presenting an estimated popcorn volume higher than the minimum value necessary for registration in MAPA.
Correlated to the superiority of GY and PE (Figure 3), ten hybrids stood out, namely L681 × P1 (46), L688 × P1 (52), L689 × P1 (53), L694 × P1 (57), L683 × P1 (48), L693 × P1 (56), L685 × P1 (50), L681 × L70 (61), L683 × L70 (63), and L204 × L70 (75). The highlight was the hybrid 46 (L681 × P1), in the upper right quadrant, which presented itself as the most prominent for agronomic traits, with expressive means of GY and PE—4610.83 kg ha−1 and 35, 56 mL g−1—among the selected genotypes.

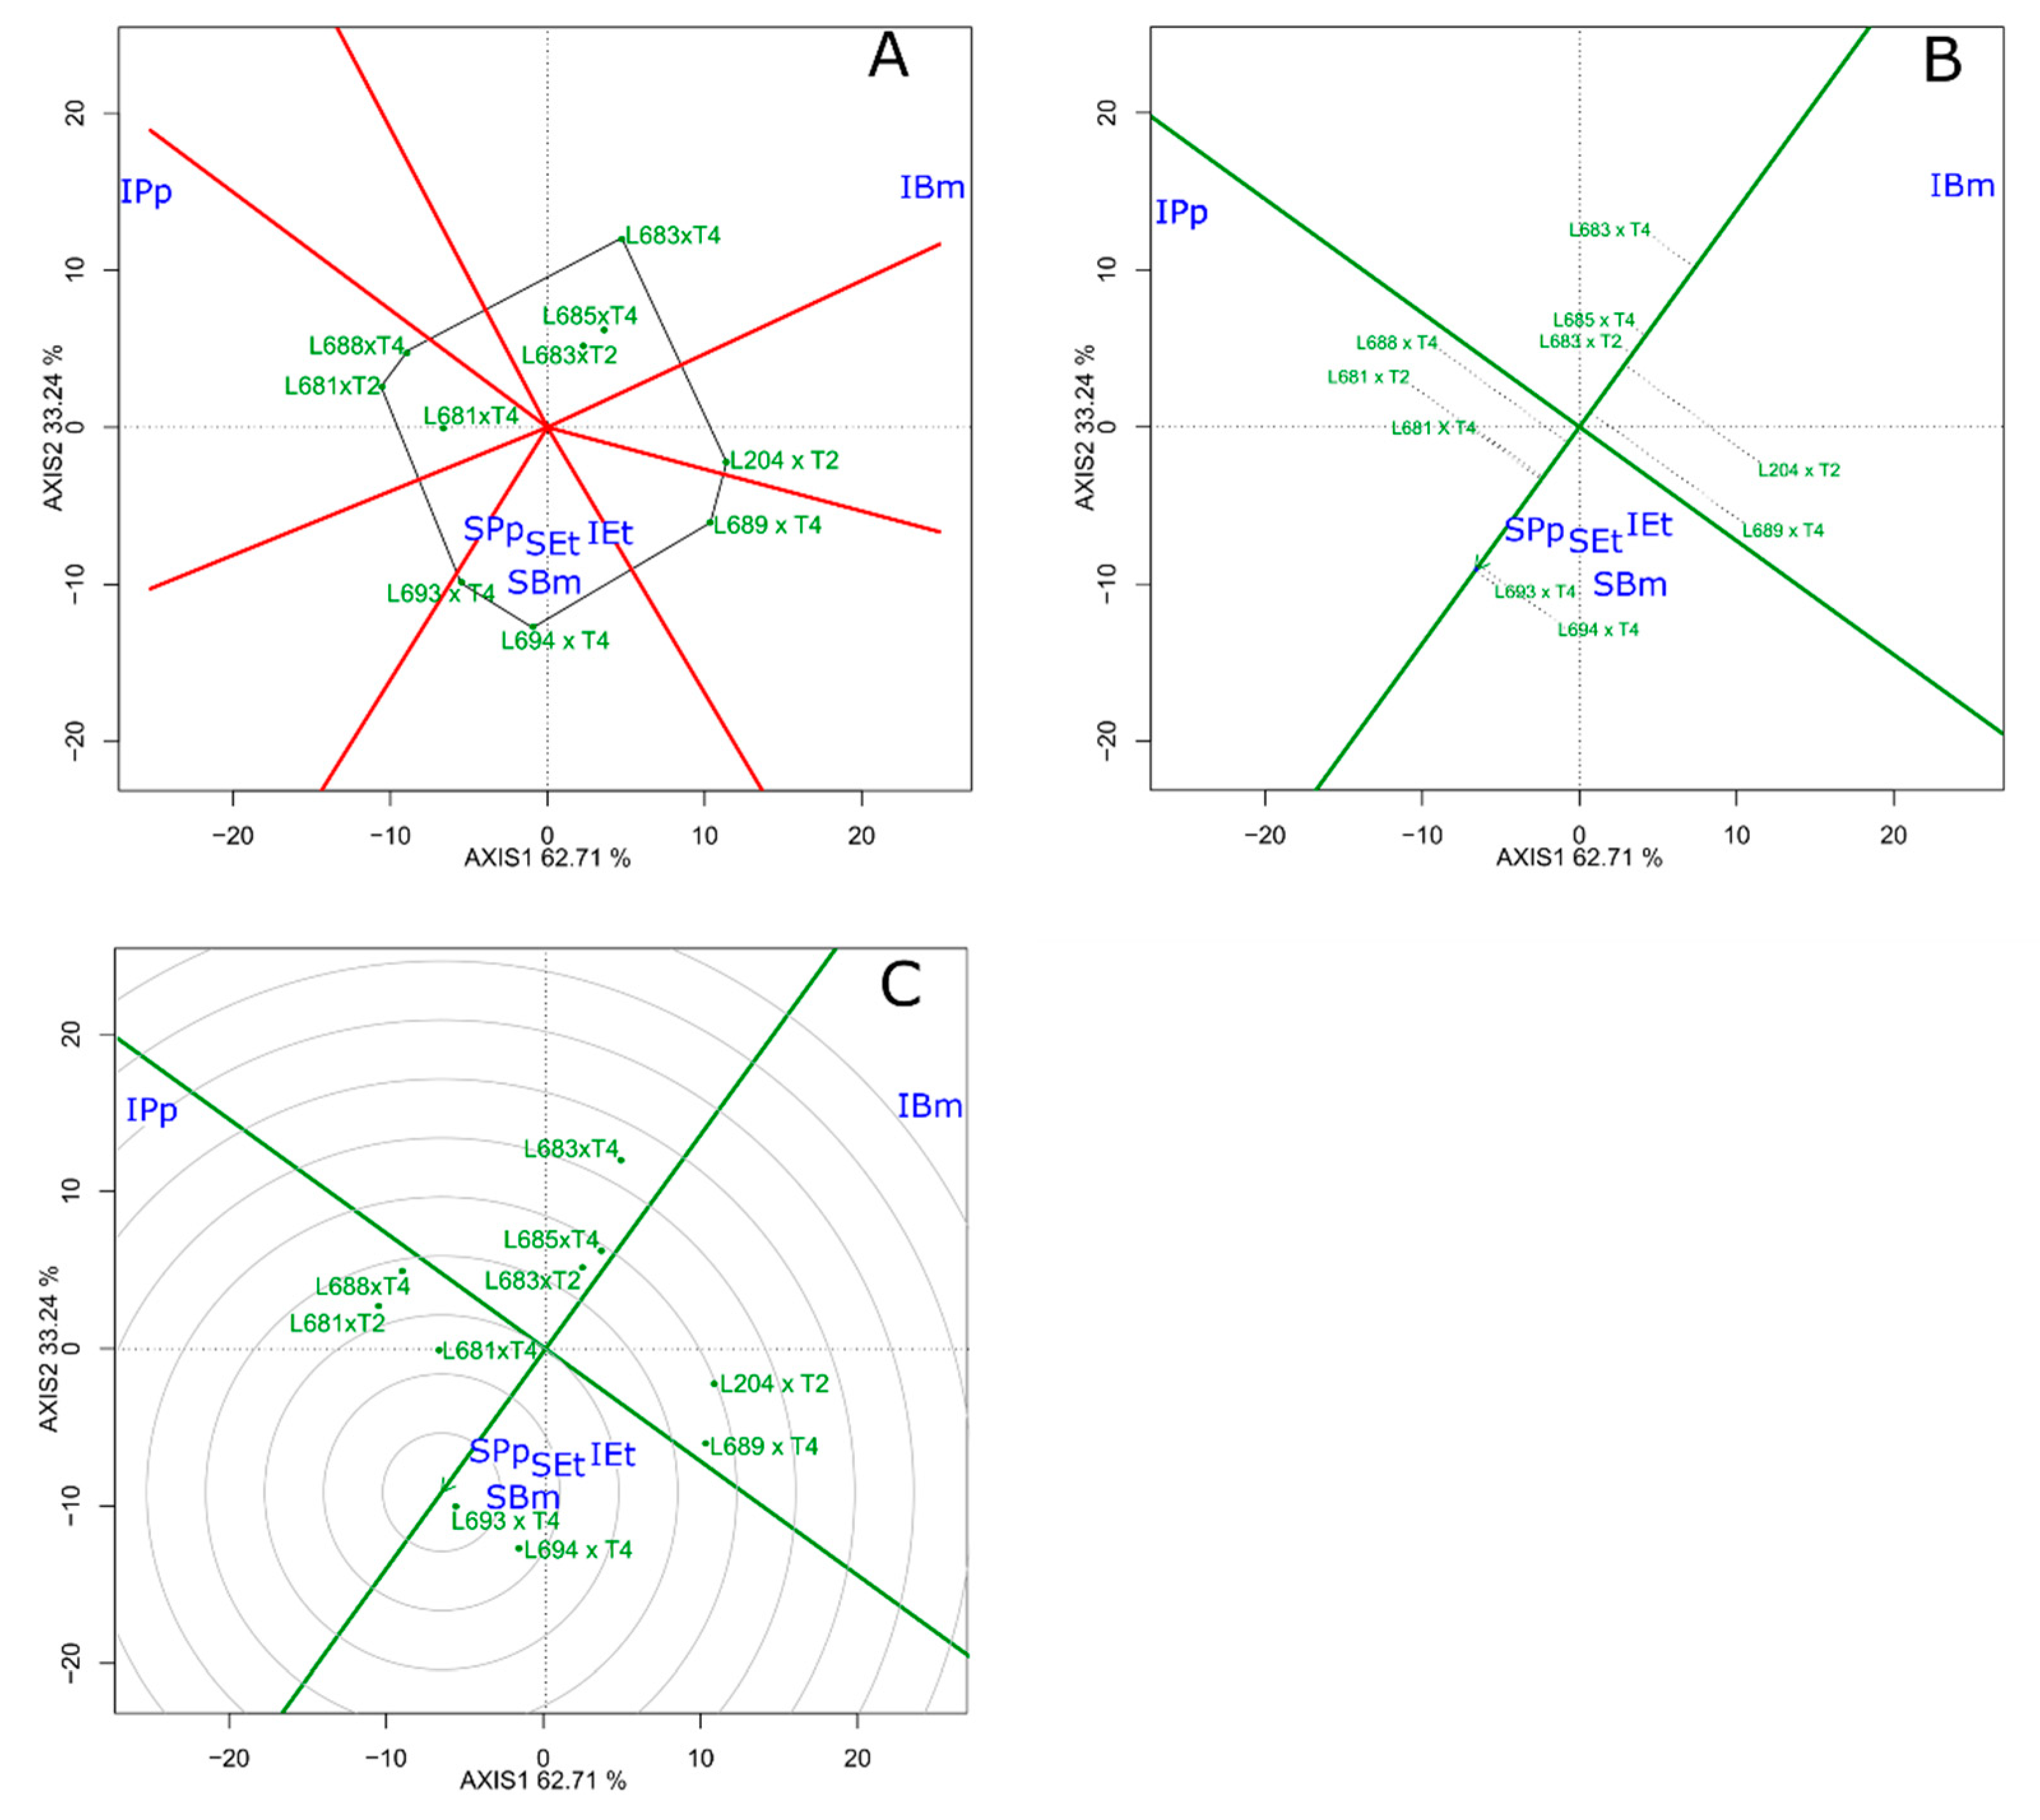
3.4. GT-Biplot Analysis of the Identification of the Superior Genotypes for Multiple Diseases

The multivariate GT biplot procedure provided a comprehensive picture of the response of the hybrids to the different pathogens studied. In this case, the main component 1 (PC1) comprised 62.71% of the total variation. The second main component (PC2) retained 33.24% of the variation, making up 95.95% of the total trait variations evaluated (Figure 4A–C).
For this set of traits, the graphic dispersion GT biplot revealed a polygon with the constitution of five groups, three of which were of interest (Figure 4A). That said, the first group consisted of the traits of E. turcicum incidence (IEt), B. maydis severity (SBm), P. polysora severity (SPp), and E. turcicum severity (SEt). The polygon comprised two hybrid combinations—L693 × T4 and L694 × T4—where both occupied the vertices. However, the emphasis fell on L694 × T4 due to its more pronounced geographic distance from the vertex concerning the origin of the graph.
The second group was referenced by the low incidence of P. polysora (IPp), having been constituted by a polygon encompassing three hybrid combinations, which revealed two as the most responsive due to the positioning of these closer to the vertices, namely, L681 × T5 and L688 × T4, in this hierarchical order; the hybrid L681 × T4 was allocated more inside the polygon.
The third group was constituted of the genotypes that presented lower incidence values of B. maydis (IBm). The polygon involved three hybrid combinations. The L683 × T4 pair was considered the most responsive for this trait due to its position closer to the vertex and its greater spatial distance from the center of origin of the graph. The combinations L685 × T4 and L683 × T5 were spatially located closer to the center of the polygon.
The dispersion of hybrids revealed by the graph of means versus stabilities highlighted the combinations L683 × T5, L685 × T4, and L693 × T4 as the most stable. As for representativeness, the hybrids L693 × T4 and L694 × T4 stood out, with the combination L693 × T4 being the most outstanding based on its allocation in the graph due to it having higher averages and being more stable among the genotypic combinations (Figure 4B).
In the ideotype analysis, hybrid 56 (L693 × T4) was graphically allocated with amplitudes closer to the ideal genotype, followed by the combination L694 × T4 (Figure 4C).

4. Discussion

The significance at 1% probability by the F test for all traits, except for SBm (Table 1), revealed genetic differences between the hybrid combinations evaluated. These results indicated that the parents were sufficiently different from each other and that they provided favorable and diverse allelic combinations favoring the expectation of future gains with selection [37,38].
The significance of the mean squares of the GCA of the groups associated with the surpassing of the magnitudes of the mean squares of the GCA of Group II concerning Group I indicated that it was possible to express a greater quantum of additive alleles in the group of testers (Table 2). Therefore, it was hypothesized that the testers had a broad genetic background with a predominance of additive alleles. Similar results were found by Lima et al. (2016) [39] when working with testcrosses of partially inbred S3 progenies in popcorn.
The significant difference for SCA showed different degrees of allelic complementation between the evaluated groups, indicating hybrid combinations with different phenotypic performance than expected based on the effects of GCA, a situation also verified by Pinto et al. (2007) [40] and Lima et al. (2016) [39] when evaluating diallel popcorn–corn hybrids.
The selection of superior genotypes in popcorn, which contain a series of favorable attributes to meet the needs of the producer and the consumer, is not an easy task. This is because the two main traits—grain yield and popping expansion—have a predominance of negative association, thus hindering gains from simultaneous selection [41,42,43,44]. According to the values expressed for GCA in the group of testers, there was a predominance of a negative correlation between GY and PE, except for L651 (Figure 1). These results were in line with those obtained by Santos et al. (2017) [5] when using the L70 tester, in which a value with a negative sign was detected for GY and a positive one for PE; similarly, Mafra et al. (2018) [27], working with the tester line P1, also detected a negative estimation expression for GY and a positive one for PE. However, the results of Group I revealed that the inbred lines L688 and L689 stood out for their positive values for these main economic traits of popcorn (Figure 1).
Among the test inbred lines used, only L688 and L689 presented high positive estimates of ĝi for GY and PE (Figure 1). It is common to identify inbred lines with high GCA values for GY and low ones for PE, or vice versa, due to the already mentioned negative correlation between these traits. However, it was possible to observe that these two inbred lines presented high and positive values for both traits; therefore, they are inbred lines of interest to be used in future breeding programs aiming to obtain simultaneous gains in GY and PE.
In a breeding program aimed at obtaining superior hybrid combinations, the production of inbred lines begins with the artificial self-pollination of hundreds of plants. The main consequence of this process is inbreeding depression and the consequent significant gains in the exploitation of heterosis with hybrid production [39,45]. In this approach, using the scatter plot of the 75 hybrids based on agronomic traits, 97.33% of the genotypes showed grain yields above the minimum value established by MAPA for registering a new cultivar, with the most productive combination (hybrid 13) showing a grain yield value of 5907.50 kg ha−1 (Figure 3), thus denoting an exponential effect of dominance on allelic complementation. In contrast, due to the negative correlation between PE and GY, only 14.66% of the hybrids presented a popcorn volume higher than the minimum established by MAPA for registration and, therefore, only 10 hybrids stood out with the desired superiority for both traits, which were L681 × P1, L683 × P1, L685 × P1, L688 × P1, L689 × P1, L693 × P1, L694 × P1, L683 × L70, L681 × L70, and L204 × L70.
The selection of diallel parental inbred lines can interfere with the predominant expression of the genetic effects responsible for hybrid efficiency [46]. This is because both inbred lines, which have a narrow genetic base, and varieties, which are characteristically genotypes with a broad genetic base, can be used, as shown by Hallauer et al. (2010) [37]. Therefore, each parent can contribute differently depending on the frequency of favorable alleles, providing contrasting results concerning the predominant gene activity for a given trait. The degree of genetic distance between the parental inbred lines also interferes with the genetic effects since, together with the dominance deviations, it is part of the heterosis estimation, which will culminate in the identification of hybrids with superior traits [37,44,47].
Pinho et al. (1999) [48], as well as Costa et al. (2012) [49] and Ramirez-Cabral et al. (2017) [50], reported yield losses of up to 65% in corn production mainly caused by P. polysora infestation; therefore, the selection of resistant genotypes is extremely important. These calls make the results found here extremely important since, among the hybrids that showed similarity in the lowest SCA estimates for IPp (Table 4), there was the participation of at least one parent with an optimistic estimate of GCA (Table 3), which allowed the prescribing of the identification of reliably superior genotypes, confirming what was found by Cruz et al. (2012), for which the best hybrid combinations were those with the greatest SCA effect and that came from at least one parent with a desirable GCA effect.
The inbred lines (Group I) that presented negative values for the estimates of the effects of the general combining ability concomitantly for IBm and SBm—L683, L684, L685, L691, and L696 (Table 3)—could be indicated for crossing in programs where it is desired to obtain a reduction in the damage levels of helminthsporiosis caused by B. maydis, in line with what has already been expressed by Santos et al. (2017) [5], Kurosawa et al. (2017) [3,4], and Mafra et al. (2018) [27].
According to Vieira et al. (2011) [51] and Mafra et al. (2018) [27], additive effects are highly relevant in the expression of resistance of genotypes to P. polysora. In this sense, since significance was detected at a 1% of probability for GCA regarding the incidence of P. polysora (Table 2) for the inbred lines, as well as for the same level of significance for the severity of this same causal agent for inbred lines and testers and, finally, at a 5% probability for the incidence of this fungal species for the testers, it was confirmed that the additive effects were relevant in the expression of these effects. These significances expressed the variability in the group of parents and testers and are a premise for selecting superior parents or segregants in advanced generations [27]. The inbred lines L681, L682, L684, L685, L688, L691, and L696 were the genotypes that showed a concomitant tendency to express a reduction in the incidence and severity of P. polysora, and, among the testers, PARA 172 and L270 (Table 3) were those that showed the greatest tendency to reduce the incidence and severity of this fungus.
Regarding the testers, considering the GCA estimates, the opposite occurred; that is, the genotypes that presented negative values for IBm expressed positive values for SBm and vice versa (Table 3). The signal contrariety between IBm and SBm, in its broadest sense, was justified by the very concept of tolerance, defined as the host’s ability to withstand the attack of the pathogen or the regeneration of tissues, branches, or tillers, or by any other means, so that the pathogen attack does not cause a significant loss in the quantity and quality of the final product [37]. In the case of the positive values for IBm, this attested that the pathogen was present but that there was also no evolution of severity since these same genotypes expressed negative values of ĝis for SBm. This was evident for the genotypes PARA 172, L651, and P1. PARA 172 is an accession from Paraguay and has the potential for resistance to foliar diseases [3,4], it being, not by chance, a good option for line extraction.
In the set of traits evaluated for GCA, the inbred lines L691 and L685, which showed positive values for almost all agronomic traits, also showed negative signs of GCA3 for all disease-resistance traits. In turn, L696 and L684 expressed negative signals of ĝi for all traits related to the diseases studied but, on the other hand, with negative estimates of GCA for agronomic traits. It was concluded, therefore, that the inbred lines with primacy for both agronomic traits and those related to diseases were L691 and L685, these being, therefore, materials with the potential to generate superior segregants.
The effects of specific combining ability (SCA) for grain yield (Figure 2) revealed 52 hybrids with positive values, ranging from 9.32 to 1722.87. The six hybrid combinations that exhibited the highest estimates for this trait were L695 × PARA 172, L696 × L651, L694 × L70, L685 × PARA 172, L696 × L270, and L685 × L270.
The GT biplot dispersion revealed reliable results, since the first two principal components explained 95.95% of the total variation. Figure 4A denotes three groups of interest, the first being formed by the traits incidence of E. turcicum (IEt), the severity of B. maydis (SBm), the severity of P. polysora (SPp), and the severity of E. turcicum (SEt). This group consisted of two hybrid combinations—L693 × T4 and L694 × T4—with emphasis on L694 × T4. The second group, referenced by the low incidence of P. polysora (IPp), comprised three hybrid combinations—L681 × T5, L688 × T4, and L681 × T4. The third group was constituted by the pairs L683 × T4, L685 × T4, and L683 × T5, which presented lower values of incidence of B. maydis (IBm). Therefore, these genotypes are likely sources of favorable alleles, showing potential for use as parents in genetic recombination programs to increase the frequency of favorable alleles. These results agreed with Kurosawa et al. (2018), who initially selected these testers as resistant to E. turcicum and B. maydis.
The dispersion of hybrids in Figure 4B made it possible to highlight the combinations L683 × T2, L685 × T4, and L693 × T4 as the most stable, as they were hierarchically allocated with the smallest geographical distances concerning the straight line representing PC1. The combinations L693 × T4 and L694 × T4 were the ones that showed the greatest proximity concerning the general average, represented by the arrow on PC2. From a simultaneous analysis, the hybrid L693 × T4 stood out, which graphically stood out as having a superior average estimate and being part of the most stable combinations.
Based on Figure 4C, the ideotype was defined as the genotype allocated in a graphic position closest to the constant arrow in the center of the concentric circles [52,53,54]. Thus, was conceived that the hybrid L693 × T4 was graphically allocated with amplitudes closer to the ideal genotype, followed by the combination L694 × T4. In terms of percentage estimates of leaf area affected, the hybrid L694 × T4 exhibited a value of 33.33% for IPp, 46.66% for IBm, and 8.50% for IEt. In turn, the hybrid L693 × T4 expressed the following percentages for these scales: 20.00% for IPp, 43.33% for IBm, and 3.5% for IEt. That said, the allelic complementation L693 × T4 seemed to be a good option for registration in MAPA, considering its average estimates for GY and PE and the relevance of resistance to the multiple diseases studied.
Thus, for the set of traits evaluated, it was deduced that the pairs L696 × L651, L689 × L270, and L683 × P1 have a greater perspective of being indicated for the extraction of inbred lines that can generate more productive hybrids, especially L682 × L70 and L683 × P1, to reduce the incidence and severity of P. polysora; L696 × L270 to reduce the severity of B. maydis and E. turcicum; and L681 × L651 for reduction in these three diseases.

5. Conclusions

The significance of the GCA mean squares for most of the evaluated traits showed a predominance of additive effects. The significance of the SCA mean squares was higher for B. maydis severity, and the Group I inbred lines were higher for GY, demonstrating the predominance of non-additive effects for these traits. Thus, the best strategy for obtaining efficient and productive genotypes involves exploring heterosis through the identification of superior popcorn–corn hybrids, using parents that provide the accumulation of additive genes that promote resistance to foliar diseases.
The inbred lines L685, L691, L696, L684, and the tester PARA 172 had the potential for resistance to P. polysora, B. maydis, and E. turcicum.
The hybrids that stood out for GY and PE were L681 × P1, L688 × P1, L689 × P1, L694 × P1, L683 × P1, L693 × P1, L685 × P1, L681 × L70, L683 × L70, and L204 × L70.
It was possible to select resistant hybrids that presented high grain yield expansion volumes. In this sense, the graphic analysis of the GT biplot method made it possible to reliably identify the performance of promising and stable hybrids, this being a recommended method to improve the efficiency of the identification of superior genotypes. The GT biplot procedure highlighted, among the selected hybrids, L693 × P1 and L694 × P1 as promising for SPp, IEt, Set, and SBm. In addition, it highlighted the hybrids L681 × P1, L688 × P1, and L681 × L70 for low incidence to P. polysora (IPp) and the hybrids L683 × P1, L685 × P1, and L683 × L70 with lower incidence values to B. maydis (IBm). The hybrid L693 × P1 was considered as the ideal genotype.
Gene complementarity between the inbred lines is important for hybrid combinations to show resistance to foliar diseases.

Author Contributions

Conceptualization, A.T.d.A.J. and M.V.; methodology, D.R.d.S.J.; software, V.J.d.L.; formal analysis, D.R.d.S.J. and R.M.R.; investigation, D.R.d.S.J., J.C.G.S., J.T.L., R.B.B., V.J.d.L., D.L.L., K.B.X., K.F.M.S., S.H.K., F.N.V., A.P.V. and M.G.P.; resources, A.T.d.A.J.; data curation D.R.d.S.J.; writing—original draft preparation, D.R.d.S.J., R.M.R. and A.T.d.A.J.; writing—review and editing, D.R.d.S.J., R.M.R., A.T.d.A.J., M.V., A.P.V. and M.G.P.; supervision, A.T.d.A.J. and M.V.; project administration, A.T.d.A.J.; funding acquisition, A.T.d.A.J. All authors have read and agreed to the published version of the manuscript.

Funding

This study was financed in part by the Coordenação de Aperfeiçoamento de Pessoal de Nível Superior—Brazil (CAPES)—Finance Code 001.

Data Availability Statement

Not applicable.

Acknowledgments

The authors gratefully acknowledge the financial support of the institutes CAPES, FAPERJ, CNPq and UENF.

Conflicts of Interest

The authors declare no conflict of interest.

References

  1. Ribeiro, R.M.; Amaral Júnior, A.T.; Pena, G.F.; Vivas, M.; Kurosawa, R.N.; Gonçalves, L.S.A. History of Northern Corn Leaf Blight Disease in the Seventh Cycle of Recurrent Selection of an UENF-14 Popcorn Population. Acta Sci. Agron. 2016, 38, 447. [Google Scholar] [CrossRef] [Green Version]
  2. Kurosawa, R.N.F.; do Amaral Junior, A.T.; Silva, F.H.L.; dos Santos, A.D.; Vivas, M.; Kamphorst, S.H.; Pena, G.F. Multivariate Approach in Popcorn Genotypes Using the Ward-MLM Strategy: Morpho-Agronomic Analysis and Incidence of Fusarium spp. Genet. Mol. Res. 2017, 16, 1–12. [Google Scholar] [CrossRef] [PubMed]
  3. Kurosawa, R.D.N.F.; Vivas, M.; Amaral, A.T.D.; Ribeiro, R.M.; Miranda, S.B.; Pena, G.F.; Leite, J.T.; Mora, F. Popcorn Germplasm Resistance to Fungal Diseases Caused by Exserohilum Turcicum and Bipolaris Maydis. Bragantia 2017, 77, 36–47. [Google Scholar] [CrossRef] [Green Version]
  4. Kurosawa, R.D.N.F.; Amaral, A.T.D., Jr.; Vivas, J.M.S.; Guimarães, A.G.; Miranda, S.B.; Dias, V.M.; Scapim, C.A. Potential of Popcorn Germplasm as a Source of Resistance to Ear Rot. Bragantia 2017, 76, 378–385. [Google Scholar] [CrossRef] [Green Version]
  5. Santos, J.S.; Júnior, A.T.A.; Vivas, M.; Mafra, G.S.; Pena, G.F.; Silva, F.H.L.; Guimarães, A.G. Genetic Control and Combining Ability of Agronomic Attributes and Northern Leaf Blight-Related Attributes in Popcorn. Genet. Mol. Res. 2017, 16, 1–11. [Google Scholar] [CrossRef] [PubMed]
  6. Pena, G.F.; Mafra, G.S.; do Amaral Júnior, A.T.; Alfenas, R.F.; Bhering, L.L.; Santos, J.S.; Kamphorst, S.H.; de Lima, V.J.; de Oliveira Santos, T.; Bispo, R.B.; et al. Mixed Modeling in Genetic Divergence Study of Elite Popcorn Hybrids (Zea Mays Var. Everta). Agriculture 2022, 12, 910. [Google Scholar] [CrossRef]
  7. Schwantes, I.A.I.A.; do Amaral Júnior, A.T.; Gerhardt, I.F.S.I.F.S.; Vivas, M.; de Lima e Silva, F.H.F.H.; Kamphorst, S.H.S.H. Diallel Analysis of Resistance to Fusarium Ear Rot in Brazilian Popcorn Genotypes. Trop. Plant Pathol. 2017, 42, 70–75. [Google Scholar] [CrossRef]
  8. Schwantes, I.A.; Amaral, A.T.D., Jr.; Vivas, M.; de Almeida Filho, J.E.; Kamphorst, S.H.; Guimarães, A.G.; Khan, S. Inheritance of Resistance to Fusarium Ear Rot in Popcorn. Crop Breed. Appl. Biotechnol. 2018, 18, 81–88. [Google Scholar] [CrossRef] [Green Version]
  9. Amaral, A.T.D., Jr.; de Poltronieri, T.P.S.; dos Santos, P.H.D.; Vivas, M.; Gerhardt, I.F.S.; Carvalho, B.M.; da Freitas, C.S.; da Silveira, S.F. Reaction of Popcorn Lines (S7) Cultivated in Distinct Phosphorus Levels to Bipolaris Maydis Infection. Summa Phytopathol. 2019, 45, 18–22. [Google Scholar] [CrossRef]
  10. Santos, J.S.; de Souza, M.V.Y.P.; Amaral, A.T.D., Jr.; de Almeida, R.N.; Saluci, J.C.G.; Mafra, G.S.; de Oliveira, F.T.; Khan, S.; Vivas, J.M.S. Resistance of Popcorn Hybrid (Zea Mays) to Multiple Diseases and Correlation between Leaf Disease Intensity and Agronomic Traits. Aust. J. Crop Sci. 2020, 11, 1800–1809. [Google Scholar] [CrossRef]
  11. Carlos, M.C.; Vivas, M.; Costa, A.C.; Vasconcelos, L.C.; de Lima, W.L.; de Almeida, R.N.; Valadares, F.V. Resistance to Multiple Leaf Diseases in Popcorn Lines with Potential for Baby Corn Production. Acta Sci. Agron. 2022, 44, e55857. [Google Scholar] [CrossRef]
  12. Santos, J.S.; Souza, Y.P.; Vivas, M.; Amaral, A.T.D., Jr.; Almeida Filho, J.E.; Mafra, G.S.; Viana, A.P.; Gravina, G.A.; Ferreira, F.R.A.; Saltires Santos, J.; et al. Genetic Merit of Popcorn Lines and Hybrids for Multiple Foliar Diseases and Agronomic Properties. Funct. Plant Breed. J. 2020, 2, 33–47. [Google Scholar] [CrossRef]
  13. Do Kurosawa, R.N.F.; Amaral, A.T.D., Jr.; Vivas, M.; Almeida, R.N.; Vivas, J.M.S.; Lima, V.J.; da Silveira, S.F. Diallel Analysis for Resistance to Northern Leaf Blight in Popcorn under Contrasting Nitrogen Availability. Agron. J. 2021, 113, 1029–1038. [Google Scholar] [CrossRef]
  14. Vieira, R.A.; Scapim, C.A.; Moterle, L.M.; Tessmann, D.J.; do Amaral, A.T., Jr.; Gonçalves, L.S.A. The Breeding Possibilities and Genetic Parameters of Maize Resistance to Foliar Diseases. Euphytica 2012, 185, 325–336. [Google Scholar] [CrossRef]
  15. Wang, H.; Xiao, Z.X.; Wang, F.G.; Xiao, Y.N.; Zhao, J.R.; Zheng, Y.L.; Qiu, F.Z. Mapping of HtNB, a Gene Conferring Non-Lesion Resistance before Heading to Exserohilum Turcicum (Pass.), in a Maize Inbred Line Derived from the Indonesian Variety Bramadi. Genet. Mol. Res. 2012, 11, 2523–2533. [Google Scholar] [CrossRef]
  16. Hurni, S.; Scheuermann, D.; Krattinger, S.G.; Kessel, B.; Wicker, T.; Herren, G.; Fitze, M.N.; Breen, J.; Presterl, T.; Ouzunova, M.; et al. The Maize Disease Resistance Gene Htn1 against Northern Corn Leaf Blight Encodes a Wall-Associated Receptor-like Kinase. Proc. Natl. Acad. Sci. USA 2015, 112, 8780–8785. [Google Scholar] [CrossRef] [Green Version]
  17. Galiano-Carneiro, A.L.; Miedaner, T. Genetics of Resistance and Pathogenicity in the Maize/Setosphaeria Turcica Pathosystem and Implications for Breeding. Front. Plant Sci. 2017, 8, 1–13. [Google Scholar] [CrossRef] [Green Version]
  18. Atanda, S.A.; Olsen, M.; Burgueño, J.; Crossa, J.; Dzidzienyo, D.; Beyene, Y.; Gowda, M.; Dreher, K.; Zhang, X.; Prasanna, B.M.; et al. Maximizing efficiency of genomic selection in CIMMYT’s tropical maize breeding program. Theor. Appl. Genet. 2021, 134, 279–294. [Google Scholar] [CrossRef]
  19. Abdelsalam, N.R.; Balbaa, M.G.; Osman, H.T.; Ghareeb, R.Y.; Desoky, E.-S.M.; Elshehawi, A.M.; Aljuaid, B.S.; Elnahal, A.S.M. Inheritance of Resistance against Northern Leaf Blight of Maize Using Conventional Breeding Methods. Saudi J. Biol. Sci. 2022, 29, 1747–1759. [Google Scholar] [CrossRef]
  20. Ma, W.; Gao, X.; Han, T.; Mohammed, M.T.; Yang, J.; Ding, J.; Zhao, W.; Peng, Y.-L.; Bhadauria, V. Molecular Genetics of Anthracnose Resistance in Maize. J. Fungi 2022, 8, 540. [Google Scholar] [CrossRef] [PubMed]
  21. Pena, G.F.; Amaral, A.T.D., Jr.; Gonçalves, L.S.A.; Vivas, M.; Ribeiro, R.M.; Mafra, G.S.; dos Santos, A.; Scapim, C.A. Comparison of Testers in the Selection of S3 Families Obtained from the UENF-14 Variety of Popcorn. Bragantia 2016, 75, 135–144. [Google Scholar] [CrossRef] [Green Version]
  22. De Almeida, R.N.; Vivas, M.; dos Santos Junior, D.R.; Saluci, J.C.G.; Carlos, M.C.; Santos, J.S.; Amaral, A.T.D., Jr.; Scapim, C.A. Combining Abilities Analysis for Ear Rot Resistance in Popcorn Hybrids Development. Rev. Ceres 2021, 68, 61–70. [Google Scholar] [CrossRef]
  23. Amaral, A.T.D., Jr.; Gonçalves, L.S.A.; de Freitas Júnior, S.P.; Candido, L.S.; Vittorazzi, C.; Pena, G.F.; Ribeiro, R.M.; de Silva, T.R.C.; Pereira, M.G.; Scapim, C.A.; et al. UENF 14: A New Popcorn Cultivar. Crop. Breed. Appl. Biotechnol. 2013, 13, 218–220. [Google Scholar] [CrossRef] [Green Version]
  24. Guimarães, A.G.; Amaral, A.T.D., Jr.; de Lima, V.J.; Leite, J.T.; Scapim, C.A.; Vivas, M. Genetic Gains and Selection Advances Of The Uenf-14 Popcorn Population. Rev. Caatinga 2018, 31, 271–278. [Google Scholar] [CrossRef]
  25. Guimarães, A.G.; Amaral, A.T.D., Jr.; Pena, G.F.; de Almeida Filho, J.E.; Pereira, M.G.; Santos, P.H.A.D. Genetic Gains in the Popcorn Population Uenf-14: Developing the Ninth Generation of Intrapopulation Recurrent Selection. Rev. Caatinga 2019, 32, 625–633. [Google Scholar] [CrossRef]
  26. Vittorazzi, C.; Júnior, A.T.A.; Guimarães, A.G.; Silva, F.H.L.; Pena, G.F.; Daher, R.F.; Gerhardt, I.F.S.; Oliveira, G.H.F.; Santos, P.H.A.D.; Souza, Y.P.; et al. Evaluation of Genetic Variability to Form Heterotic Groups in Popcorn. Genet. Mol. Res. 2018, 17, 1–17. [Google Scholar] [CrossRef]
  27. Mafra, G.S.; Amaral, A.T.D., Jr.; Vivas, M.; dos Santos, J.S.; Silva, F.H.D.L.E.; Guimarães, A.G.; Pena, G.F. The Combining Ability of Popcorn S7 Lines for Puccinia Polysora Resistance Purposes. Bragantia 2018, 77, 519–526. [Google Scholar] [CrossRef]
  28. Santos, J.S.; Vivas, M.; Amaral, A.T.D., Jr.; Ribeiro, R.M.; Mafra, G.S.; Pena, G.F. Gene Effects from Bipolaris Maydis Incidence and Severity on Popcorn. Rev. Bras. De Ciênc. Agrár.—Braz. J. Agric. Sci. 2019, 14, 1–7. [Google Scholar] [CrossRef] [Green Version]
  29. Agroceres. Guia Agroceres de Sanidade; Sementes Agroceres: São Paulo, Brazil, 1996; Volume 2, pp. 1–72. [Google Scholar]
  30. Chester, K.S. Plant Disease Losses: Their Appraisal and Interpretation; Forgotten Books: London, UK, 1950; Volume 1, pp. 1–193. [Google Scholar]
  31. James, W.C. Manual of Assessment Keys for Plant Diseases; American Phytopathological Society: Saint Paul, MN, USA, 1971; ISBN 0890540810. [Google Scholar]
  32. Rodriguez, R.N. Statistical Model Building for Large, Complex Data: Five New Directions in SAS/STAT® Software. In Proceedings of the SAS Global Forum Conference, Las Vegas, NV, USA, 18–21 April 2016; Available online: http://support.sas.com/resources/papers/proceedings16/SAS4900-2016.pdf (accessed on 8 July 2022).
  33. Griffing, B. Concept of General and Specific Combining Ability in Relation to Diallel Crossing Systems. Aust. J. Biol. Sci. 1956, 9, 462–493. [Google Scholar] [CrossRef] [Green Version]
  34. Cruz, C.D. GENES—A Software Package for Analysis in Experimental Statistics and Quantitative Genetics. Acta Sci. Agron. 2013, 35, 271–276. [Google Scholar] [CrossRef]
  35. Yan, W.; Rajcan, I. Biplot Analysis of Test Sites and Trait Relations of Soybean in Ontario. Crop. Sci. 2002, 42, 11–20. [Google Scholar] [CrossRef] [PubMed]
  36. R Core Team. R: Integrated Development for R. R Core Team, 2018. [Google Scholar]
  37. Hallauer, A.R.; Carena, M.J.; Miranda Filho, J.B. Quantitative Genetics in Maize Breeding; Springer: New York, NY, USA, 2010; ISBN 978-1-4419-0765-3. [Google Scholar]
  38. Barreta, D.; Nardino, M.; Konflanz, V.A.; de Pelegrin, A.J.; Ferrari, M.; Szareski, V.J.; Carvalho, I.R.; de Souza, V.Q.; de Oliveira, A.C.; da Maia, L.C. Diallelic Analysis of Endogamic Maize Lines with Emphasis on Agronomic Traits of Tassel in Different Environments. J. Crop. Sci. Biotechnol. 2019, 22, 101–111. [Google Scholar] [CrossRef]
  39. De Lima, V.J.; do Amaral Junior, A.T.; Kamphorst, S.H.; Pena, G.F.; Leite, J.T.; Schmitt, K.F.M.; Vittorazzi, C.; de Almeida Filho, J.E.; Mora, F. Combining Ability of S3 Progenies for Key Agronomic Traits in Popcorn: Comparison of Testers in Top-Crosses. Genet. Mol. Res. 2016, 15, 1–14. [Google Scholar] [CrossRef] [PubMed]
  40. Pinto, R.J.B.; Kvitschal, M.V.; Scapim, C.A.; Fracaro, M.; Bignotto, L.S.; Souza Neto, I.L. Análise Dialélica Parcial de Linhagens de Milho-Pipoca. Rev. Bras. Milho Sorgo 2007, 6, 325–337. [Google Scholar] [CrossRef]
  41. Daros, M.; Amaral, A.T.D., Jr.; Pereira, M.G.; Santos, F.S.; Gabriel, A.P.C.; Scapim, C.A.; de Paiva Freitas, S., Jr.; Silvério, L. Recurrent Selection in Inbred Popcorn Families. Sci. Agric. 2004, 61, 609–614. [Google Scholar] [CrossRef]
  42. Kamphorst, S.H.; Amaral, A.T.D., Jr.; de Lima, V.J.; Carena, M.J.; Azeredo, V.C.; Mafra, G.S.; Santos, P.H.A.D.; Leite, J.T.; Schmitt, K.F.M.; dos Santos Junior, D.R.; et al. Driving Sustainable Popcorn Breeding for Drought Tolerance in Brazil. Front. Plant Sci. 2021, 12, 1–20. [Google Scholar] [CrossRef]
  43. Amaral, A.T.D., Jr.; dos Santos, A.; Gerhardt, I.F.S.; Kurosawa, R.N.F.; Moreira, N.F.; Pereira, M.G.; Gravina, G.d.A.; Silva, F.H.d.L. Proposal of a Super Trait for the Optimum Selection of Popcorn Progenies Based on Path Analysis. Genet. Mol. Res. 2016, 15, 1–9. [Google Scholar] [CrossRef]
  44. Schwantes, I.A.; do Amaral Júnior, A.T.; Almeida Filho, J.E.; Vivas, M.; Silva Cabral, P.D.; Gonçalves Guimarães, A.; Lima e Silva, F.H.; Araújo Diniz Santos, P.H.; Gonzaga Pereira, M.; Pio Viana, A.; et al. Genomic Selection Helps Accelerate Popcorn Population Breeding. Crop Sci. 2020, 60, 1373–1385. [Google Scholar] [CrossRef]
  45. Simon, G.A.; Scapim, C.A.; Pacheco, C.A.P.; Pinto, R.J.B.; Braccini, A.D.L.E.; Tonet, A. Depressão Por Endogamia Em Populações de Milho-Pipoca. Bragantia 2004, 63, 55–62. [Google Scholar] [CrossRef] [Green Version]
  46. Gerhardt, I.F.S.; Teixeira do Amaral Junior, A.; Ferreira Pena, G.; Moreira Guimarães, L.J.; de Lima, V.J.; Vivas, M.; Araújo Diniz Santos, P.H.; Alves Ferreira, F.R.; Mendonça Freitas, M.S.; Kamphorst, S.H. Genetic Effects on the Efficiency and Responsiveness to Phosphorus Use in Popcorn as Estimated by Diallel Analysis. PLoS ONE 2019, 14, e0216980. [Google Scholar] [CrossRef]
  47. Mafra, G.S.; de Almeida Filho, J.E.; do Amaral Junior, A.T.; Maldonado, C.; Kamphorst, S.H.; de Lima, V.J.; dos Santos Junior, D.R.; Leite, J.T.; Santos, P.H.A.D.; de Oliveira Santos, T.; et al. Regional Heritability Mapping of Quantitative Trait Loci Controlling Traits Related to Growth and Productivity in Popcorn (Zea mays L.). Plants 2021, 10, 1845. [Google Scholar] [CrossRef] [PubMed]
  48. Pinho, R.G.V.; Ramalho, M.A.P.; Silva, H.P.; Resende, I.C.; Pozar, G. Danos Causados Pelas Ferrugens Polissora e Tropical Do Milho. Fitopatol. Bras. 1999, 24, 400–409. [Google Scholar]
  49. Costa, D.F.; Vieira, B.S.; Lopes, E.A.; Moreira, L.C.B. Application of Fungicides in the Control of Foliar Diseases in Maize Crop. Rev. Bras. Milho Sorgo 2012, 11, 108–115. [Google Scholar]
  50. Ramirez-Cabral, N.Y.Z.; Kumar, L.; Shabani, F. Global Risk Levels for Corn Rusts (Puccinia Sorghi and Puccinia Polysora) under Climate Change Projections. J. Phytopathol. 2017, 165, 563–574. [Google Scholar] [CrossRef]
  51. Vieira, R.A.; Scapim, C.A.; Tessmann, D.J.; Hata, F.T. Diallel Analysis of Yield, Popping Expansion, and Southern Rust Resistance in Popcorn Lines. Rev. Ciênc. Agron. 2011, 42, 774–780. [Google Scholar] [CrossRef] [Green Version]
  52. Akcura, M.; Kokten, K. Variations in Grain Mineral Concentrations of Turkish Wheat Landraces Germplasm. Qual. Assur. Saf. Crops Foods 2017, 9, 153–159. [Google Scholar] [CrossRef]
  53. Kaplan, M.; Baran, O.; Unlukara, A.; Kale, H.; Arslan, M.; Kara, K.; Beyzi, S.B.; Konca, Y.; Ulas, A. The Effects Of Different Nitrogen Doses and Irrigation Levels on Yield, Nutritive Value, Fermentation and Gas Production of Corn Silage. Turk. J. Field Crops 2016, 21, 100. [Google Scholar] [CrossRef]
  54. Yang, L.; Fountain, J.C.; Ji, P.; Ni, X.; Chen, S.; Lee, R.D.; Kemerait, R.C.; Guo, B. Deciphering Drought-Induced Metabolic Responses and Regulation in Developing Maize Kernels. Plant Biotechnol. J. 2018, 16, 1616–1628. [Google Scholar] [CrossRef]
Figure 1. Scatter plot of estimates of general combining ability (GCA) effects associated with S7 progenies tested—black dots (Group I)—and testers—red dots (Group II)—for grain yield and expandability traits. The T terms refer to the testers, these being T1 = PARA 172; T2 = L270; T3 = L651; T4 = P1; and T5 = L70.
Agronomy 12 03103 g001
Figure 2. Scatter plot of estimates of specific combining ability (SCA) effects associated with 75 hybrids from testcross for grain yield (GY) and popping expansion (PE) traits. The T terms refer to the testers, these being T1 = PARA 172; T2 = L270; T3 = L651; T4 = P1; and T5 = L70.
Agronomy 12 03103 g002
Figure 3. Graphical dispersion of 75 popcorn hybrids based on grain yield and popping expansion.
Agronomy 12 03103 g003
Figure 4. GT biplot plots, where (A) refers to the “which-won-where” dispersion, (B) refers to the averages versus stabilities containing the ranking of ten popcorn–corn hybrids with their respective stabilities, and (C) refers to the estimate of an ideal genotype.
Agronomy 12 03103 g004
Table 1. Description of inbred lines and testers regarding the response to the pathogenic agents E. turcicum, B. maydis, and P. polysora.
Male Parents
GenotypesTypeObtainerReaction to
E. turcicumB. maydisP. polissora
T1 (PARA 172)PopulationCIMMYTResistantResistantResistant
T2 (L270)Inbred lineUENFUnknownUnknownUnknown
T3 (L651)Inbred lineUENFUnknownUnknownUnknown
T4 (P1)Inbred lineUEMIntermediarySusceptibleIntermediary
T5 (L70)Inbred lineUEMSusceptibleResistantIntermediary
Female parents
L204Inbred lineCIMMYTUnknownUnknownUnknown
L681Inbred lineUENF 14UnknownUnknownUnknown
L682Inbred lineUENF 14UnknownUnknownUnknown
L683Inbred lineUENF 14UnknownUnknownUnknown
L684Inbred lineUENF 14UnknownUnknownUnknown
L685Inbred lineUENF 14UnknownUnknownUnknown
L686Inbred lineUENF 14UnknownUnknownUnknown
L688Inbred lineUENF 14UnknownUnknownUnknown
L689Inbred lineUENF 14UnknownUnknownUnknown
L691Inbred lineUENF 14UnknownUnknownUnknown
L692Inbred lineUENF 14UnknownUnknownUnknown
L693Inbred lineUENF 14UnknownUnknownUnknown
L694Inbred lineUENF 14UnknownUnknownUnknown
L695Inbred lineUENF 14UnknownUnknownUnknown
L696Inbred lineUENF 14UnknownUnknownUnknown
Table 2. Mean squares estimates (parents and F1′s) of general (GCA) and specific combining ability (SCA) and experimental residue for evaluated agronomic traits and incidence and severity of P. polysora, B. maydis, and E. turcicun.
SVDFMS
Agronomic Traits
GYPE
Treatments944,544,342.76 **155.49 **
Group I vs. Group II1129,010,910.71 **60.61 **
GCA (Group I)142,374,624.59 **136.23 **
GCA (Group II)46,863,585.00 **2310.54 **
SCA I × II753,166,109.61 **45.40 **
Residue188311,266.007.71
Disease incidence
IPpIBmIEt
Treatments94425.02 **809.35 **66.16 **
Group I vs. Group II14500.17 **10,505.13 **0.84 ns
GCA (Group I)14871.43 **1725.05 **149.31 **
GCA (Group II)4529.47 *3666.27 **272.75 **
SCA I × II75281.78 *356.78 **40.49 ns
Residue188184.68133.631.81
Disease severity
SPpSBmSEt
Treatments9427.45 **60.72 ns19.31 **
Group I vs. Group II11.57 ns131.74 ns67.64 *
GCA (Group I)1463.43 **52.09 ns20.80 *
GCA (Group II)497.07 **17.77 ns82.36 **
SCA I × II7517.37 **63.68 ns15.03 *
Residue1888.5463.9410.37
SV: source of variation. DF: degrees of freedom; MS: mean squares; GY: grain yield (kg ha−1); PE: popping expansion (mL g−1); Group I refers to the tested inbred lines; Group II refers to testers; IPp: incidence of Puccinia polysora; IBm: incidence of Bipolaris maydis; IEt: incidence of Exserohilum turcicum; SPp: Puccinia polysora severity; SBm: Bipolaris maydis severity; SEt: severity of Exserohilum turcicum; mean square effect, followed by ns, * and **: when not significant or significant at 5% and 1%, respectively, by the F test, respectively.
Table 3. Estimates of the effects of general combining ability (ĝi) associated with S7 progenies (Group I) and testers (Group II) for agronomic traits and associated with P. polysora, B. maydis, and E. turcicum.
Effect of GCA Associated with Group I—Progenies S7
S7IPpIBmIEtSPpSBmSEt
L681−5.158.260.11−0.29−1.15−0.11
L682−7.17.141.4−1.672.70.7
L6831.67−9.67−1.360.37−1.59−0.35
L684−3.13−7.49−2.89−0.84−0.77−0.65
L685−6.26−9.15−1.8−2.02−2.56−0.75
L686−2.786.77−0.621.040.681.07
L688−2.623.44−0.93−1.260.02−0.53
L6895.835.66−0.391.291.24−0.56
L691−0.71−8.41−1.63−0.78−0.09−0.73
L692−2.025.295.830.57−0.981.59
L6936.6491.40.33−0.680.83
L6948.637.294.181.751.131.52
L69510.71.59−1.841.351.23−0.61
L696−5.73−13.19−0.56−2.64−0.64−0.68
L2042.03−6.54−0.892.811.45−0.74
Effect of GCA Associated with Group II—Testers
TestersIPpIBmIEtSPpSBmSEt
T1 (PARA172)−0.147.40−1.28−0.89−0.5−1.03
T2 (L270)−5.10−5.323.50−1.830.902.00
T3(L651)2.4811.94−2.290.75−0.41−0.76
T4 (P1)0.614.34−0.031.25−0.09−0.33
T5 (L70)2.14−3.570.090.720.10.12
IPp: incidence of Puccinia polysora; IBm: incidence of Bipolaris maydis; IEt: incidence of Exserohilum turcicum; SPp: severity of Puccinia polysora; SBm: severity of Bipolaris maydis; and SEt: severity of Exserohilum turcicum.
Table 4. Estimates of the specific combining ability (SCA) effects between the hybrids from fifteen S7 progenies (Group I) and five testers (Group II) for the traits IPp, IBm, IEt, SPp, SBm, and SEt, evaluated in test crosses with popcorn under the partial diallel scheme.
CruzamentosIPpIBmIEtSPpSBmSEt
L681 × T1 (1)−5.813.17−1.58−0.531.650.07
L682 × T1 (2)−3.204.28−2.880.014.19−0.45
L683 × T1 (3)−4.47−2.24−0.12−0.640.370.59
L684 × T1 (4)3.84−1.09−0.252.521.000.45
L685 × T1 (5)−3.203.910.32−0.751.280.72
L686 × T1 (6)8.32−8.69−0.860.094.87−1.38
L688 × T1 (7)14.82−5.35−0.551.94−4.290.33
L689 × T1 (8)6.382.430.42−0.72−7.130.36
L691 × T1 (9)−0.42−1.83−1.34−0.59−5.070.42
L692 × T1 (10)−4.10−10.540.861.942.59−0.85
L693 × T1 (11)−1.10−0.913.450.86.90.20
L694 × T1 (12)0.254.13−3.99−2.29−4.24−1.61
L695 × T1 (13)8.17−6.830.362.83−1.620.30
L696 × T1 (14)1.27−3.39−0.920.15−2.140.37
L204 × T1 (15)−7.99−5.20−2.08−4.355.050.43
L681 × T2 (16)0.821.091.801.52−4.470.65
L682 × T2 (17)−5.2315.532.010.511.621.24
L683 × T2 (18)10.5−2.65−1.73−1.64−1.81−2.89
L684 × T2 (19)−4.690.16−4.874.3−3.35−2.3
L685 × T2 (20)−2.9−8.17−5.96−0.92−3.17−2.59
L686 × T2 (21)−4.88−0.76−4.14−0.64−2.69−3.58
L688 × T2 (22)−6.71−14.1−5.330.838.53−2.59
L689 × T2 (23)−5.163.68−4.20−0.612.75−2.56
L691 × T2 (24) 1.38−2.25−6.290.637.64−2.22
L692 × T2 (25)−3.80.729.25−1.34−3.250.51
L693 × T2 (26)−5.97−6.32−1.332.576.735.83
L694 × T2 (27)21.88−7.9510.891.983.534.97
L695 × T2 (28)13.14−8.91−5.920.72−8.85−2.51
L696 × T2 (29) −0.43−2.475.800.26−5.04−2.27
L204 × T2 (30)5.31−10.78−0.37−3.522.71−2.60
L681 × T3 (31)−5.09−6.18−0.581.16−2.16−0.47
L682 × T3 (32)3.36−8.4−1.874.20−5.292.73
L683 × T3 (33)−8.755.092.39−1.450.890.61
L694 × T3 (34)9.396.230.922.27−2.920.08
L685 × T3 (35)2.52−2.1−0.170.391.580.18
L686 × T3 (36)5.715.310.150.39−2.66−1.64
L688 × T3 (37)8.88−14.690.46−0.094.620.18
L689 × T3 (38)10.43−6.923.09−0.694.730.10
L691 × T3 (39)3.80−2.84−0.34−0.293.010.16
L692 × T3 (40)1.620.12−4.636.69−1.32−0.89
L693 × T3 (41)−3.556.42−0.371.65−3.680.27
L694 × T3 (42)−0.70−17.21−2.98−0.8811.34−1.82
L695 × T3 (43)15.56−9.51−0.131.19−5.420.03
L696 × T3 (44)−1.011.94−1.410.189.610.11
L204 × T3 (45)−2.27−4.71−1.08−4.72−6.370.28
L681 × T4 (46)−3.06−8.58−2.84−0.181.30.71
L682 × T4 (47)5.399.200.70−0.75−3.82−0.65
L683 × T4 (48)−10.96−7.01−0.22−0.733.461.47
L684 × T4 (49)11.42−7.84−1.34−1.010.710.47
L685 × T4 (50)1.22−11.17−2.43−2.340.05−0.25
L686 × T4 (51)−0.592.904.38−0.393.97−1.85
L688 × T4 (52)−12.59−7.103.03−1.70−1.47−0.48
L689 × T4 (53)12.29−15.99−2.345.471.250.78
L691 × T4 (54)−1.17−16.910.400.59−2.42−0.17
L692 × T4 (55)10.154.39−7.06−1.591.80−2.49
L693 × T4 (56)−5.19−2.65−2.63−1.07−4.00−1.00
L694 × T4 (57)6.162.39−0.411.670.804.19
L695 × T4 (58)10.76−5.24−0.892.913.48−0.4
L696 × T4 (59)−7.65−3.8−2.17−0.334.35−0.11
L204 × T4 (60)−7.08−3.782.99−1.33−7.240.01
L681 × T5 (61)−9.752.670.051.754.11−0.9
L682 × T5 (62)−10.98−6.22−2.58−1.32−3.850.41
L683 × T5 (63)−8.250.60−2.99−0.30−1.45−0.66
L684 × T5 (64)−15.1111.740.05−0.48−1.60−0.80
L685 × T5 (65)−8.640.070.45−0.69−1.26−0.59
L686 × T5 (66) −5.620.81−2.23−0.419.50−1.80
L688 × T5 (67)2.54−5.85−1.920.500.72−0.93
L689 × T5 (68)−5.90−8.07−2.45−0.110.06−0.67
L691 × T5 (69)10.63−4.000.450.850.28−0.61
L692 × T5 (70)5.45−7.707.66−0.223.288.34
L693 × T5 (71)6.78−8.072.250.024.36−2.06
L694 × T5 (72)17.97−6.37−7.03−0.29−5.00−2.70
L695 × T5 (73)9.23−10.67−1.011.50−0.76−0.46
L696 × T5 (74)−4.35−5.892.55−0.40−5.18−0.77
L204 × T5 (75)11.23−2.54−0.29−2.191.01−0.60
IPp: incidence of Puccinia polysora; IBm: incidence of Bipolaris maydis; IEt: incidence of Exserohilum turcicum; SPp: severity of Puccinia polysora; SBm: severity of Bipolaris maydis; and SEt: severity of Exserohilum turcicum.
Table 5. Summary of analysis of variance and average estimates of evaluated agronomic traits.
Agronomic Traits Evaluated
SVDFGYPE
Blocks2416.521.02829.326
Hybrids (H)741,374,847.550 **172.859 **
Residue148338.768.9736.390
Means 4.152.48920.983
SV: source of variation; DF: degrees of freedom; MS: mean squares; GY: grain yield (kg ha−1); PE: popping expansion (mL g−1); ** significant at 1% level probability by the F test, respectively.
Publisher’s Note: MDPI stays neutral with regard to jurisdictional claims in published maps and institutional affiliations.

