Article

The Effects of Winter Cover Crops on Maize Yield and Crop Performance in Semiarid Conditions—Artificial Neural Network Approach

1
Faculty of Agriculture, University of Novi Sad, Dositej Obradović Square 8, 21000 Novi Sad, Serbia
2
Institute of General and Physical Chemistry, University of Belgrade, Studentski trg 12/V, 11000 Belgrade, Serbia
3
Faculty of Technology Novi Sad, University of Novi Sad, Bulevar cara Lazara 1, 21000 Novi Sad, Serbia
*
Author to whom correspondence should be addressed.
Agronomy 2022, 12(11), 2670; https://doi.org/10.3390/agronomy12112670
Submission received: 5 October 2022 / Revised: 21 October 2022 / Accepted: 24 October 2022 / Published: 28 October 2022

Abstract

:
Maize is the most widespread and, along with wheat, the most important staple crop in the Republic of Serbia, which is of great significance for ensuring national food security. With the increasing demand for food and forage, intensive agricultural practices have been adopted in the maize production systems. In this direction, considerable research efforts have been made to examine the effects of different types of cover crops as a green manure on maize productivity; however, no consistent conclusions have been reached so far. Therefore, the objective of the present study is to examine the possibility of predicting the effects of winter cover crops (CC) integrated with different management practices on the morphological traits, yield, and yield components of maize. The experiment was carried out on chernozem soil from 2016 to 2020 as a randomized complete block design arranged as a split-split-plot with three replicates. The pea as a sole crop (P) and the mixture of pea and triticale (PT) are sown as winter CC with the following subplots: (i) CC used as green manure, and (ii) CC used as forage and removed before maize sowing. The artificial neural network is used for exploring nonlinear functions of the tested parameters and 13 categorical input variables for modeling according to the following factors: CC, way of using CC, N fertilization, and year. The computed maximums of plant height, number of leaves, number of internodes, plant density, number of ears, grain yield, 1000-grain weight, hectolitre weight, dry matter harvest residue, harvest index, leaves percentage, stems percentage, and ears percentage are as follows: 232.3 cm; 9.7; 10.2; 54,340 plants ha−1; 0.9; 9.8 t ha−1; 272.4 g; 67.0 kg HL−1; 9.2 t ha−1; 0.52; 18.9%; 36.0%, and 45.1%, respectively. The optimal result is obtained with peas used as green manure, with 50 kg N ha−1 and in the climatic conditions of 2018. Consequently, maize production under subsequent sowing periods can be successfully optimized by adapting selected management options for higher yield accomplishment.

1. Introduction

The main challenge for agriculture in the 21st century will be to increase food production with minimal environmental impact [1,2]. Therefore, it is necessary to analyze the current approach to agriculture and gradually introduce new solutions and technologies. Conventional farming over a long time has been proven to lead to soil degradation, reducing soil buffering capacity in the variable environmental conditions [3], and increasing sensitivity to extreme weather events [4]. This coincides with the state of the arable land-use systems in the Pannonian Plain, where significant changes in soil properties have been reported (soil organic matter loss, deterioration of physical and biological properties, salinization, etc.) [5,6,7]. An additional concern arises from the limited use of manure, which is attributed to decreased livestock numbers [8] and narrow crop rotations. The tendency for more efficient use of soil, nutrients, and water has made it increasingly important to adapt current cropping technology. Incorporating cover crops (CC) in crop rotation is one of the solutions for soil conservation and improvement, focusing on the better utilization of agroecological conditions [9,10].
CCs in cropping systems could provide economic and environmental benefits and play an important role in adjusting the cropping systems toward sustainable production [11,12,13,14,15] and climate-smart agriculture. For example, the introduction of CCs may result in the reduction of the use of mineral nitrogen (N) fertilizers due to biologically fixed N [16,17,18]; preserving soil moisture content and preventing nutrient leaching [19,20]; erosion control [21,22]; maintaining water quality [10]; increasing organic matter content, improvement of soil structure and biological soil properties [23,24,25]; as well as in the preservation of biodiversity [26], and agroecosystem health in general [12,27].
The selection of suitable cover crop species in semi-arid conditions of the Pannonian Plain is crucial for achieving multiple benefits in sustainable agricultural production. Considering the risk of extremely unfavorable years and the projected increase in the variability of climatic conditions [28], CCs have a great potential to be combined with existing cultivation systems, because during the winter season (November–February), the fields remain bare. Therefore, winter CCs can regulate soil conditions and water accessibility for the subsequent crops [29,30]. In the northeastern U.S. dairy farms, winter CCs that showed higher potential are different types of hairy vetch, clovers, winter wheat, and rye [31]. The same authors point out that winter triticale is increasingly present in production as a CC that can be used as a quality ruminant feed in the spring. Conversely, in Southeastern Europe, Ćupina et al. [32] found the lowest yield of silage maize for two consecutive years following triticale due to the higher water consumption. In addition to forage production, winter CCs are increasingly used as green manure [33,34] or as living mulch. The benefits of green manuring are closely related to the C:N ratio in cover crop biomass. Thus, leguminous CCs used as green manure ensure N for the subsequent crop [35], while for increased soil organic matter, priority should be given to grasses because of their higher C:N ratio [36]. Sustainable agricultural practices also favor late spring plowing or reduced tillage, as well as direct maize sowing into living mulch [37]. A meta-analysis based on 268 literature findings showed a 13% increase in maize yields with the CC mixture compared to the control [15]. Therefore, Vojnov et al. [38] suggest that it would be beneficial to include CCs in maize management practice through a strategic concept that would foresee subsidies, which would enable all the positive effects of this important ecological measure on farming in general.
The artificial neural network (ANN) was recently recognized as an attractive mathematical method for exploring maize production from the subsequent sowing period systems [39,40,41]. The ANN model does not need concrete model parameters but still embraces a capacity to obtain results from the experimental data, handle the complex system with nonlinearities and elaborate on the synergies between variables [42]. The uses of ANN models cover numerous investigations of agricultural production studies [43]. Agricultural production expenses are not low; therefore, they need to be predicted numerically as much as possible. One of the ways of cost reduction is using fitting tools that predict agricultural production and variations in crop properties through breeding. Moreover, the involved agro-technology level in the cultivation, particularly fertilization with nitrogen, influences crop features and is challenging to prognosticate. The multi-objective optimization (MOO) for adjusting the parameters of agricultural production in order to maximize the yields was presented in the study by [44]. In that study, 13 ANN models coupled with ant colony optimization were developed to optimize the parameters of the biodiesel production process.
In accordance with this study, the MOO analysis combined with ANNs and genetic algorithm (GA) was implemented in the maize production, keeping in mind that there might not be a unique solution due to the contradictory objective functions [39,45,46]. As a part of this study, the solution of the MOO was estimated by introducing a Pareto optimal method [39].
Based on all of the above, the goal of this study was to examine the possibility of predicting morphological traits, grain yield and yield components, and some crop performance of maize; i.e., the following 13 variables: the plant height (H), number of leaves (NL), number of internodes (NI), plant density (PD), number of ears (NE), grain yield (GY), 1000-grain weight (TGW), hectolitre weight (HW), dry matter harvest residue (DMHR), harvest index (HI), leaves percentage (L), stems percentage (S) and ears percentage (E); as a function of cover crops type (CC), way of using cover crops (WUCC), N fertilization (NF), and year of maize production (YEAR) under semiarid conditions of the experimental site.

2. Materials and Methods

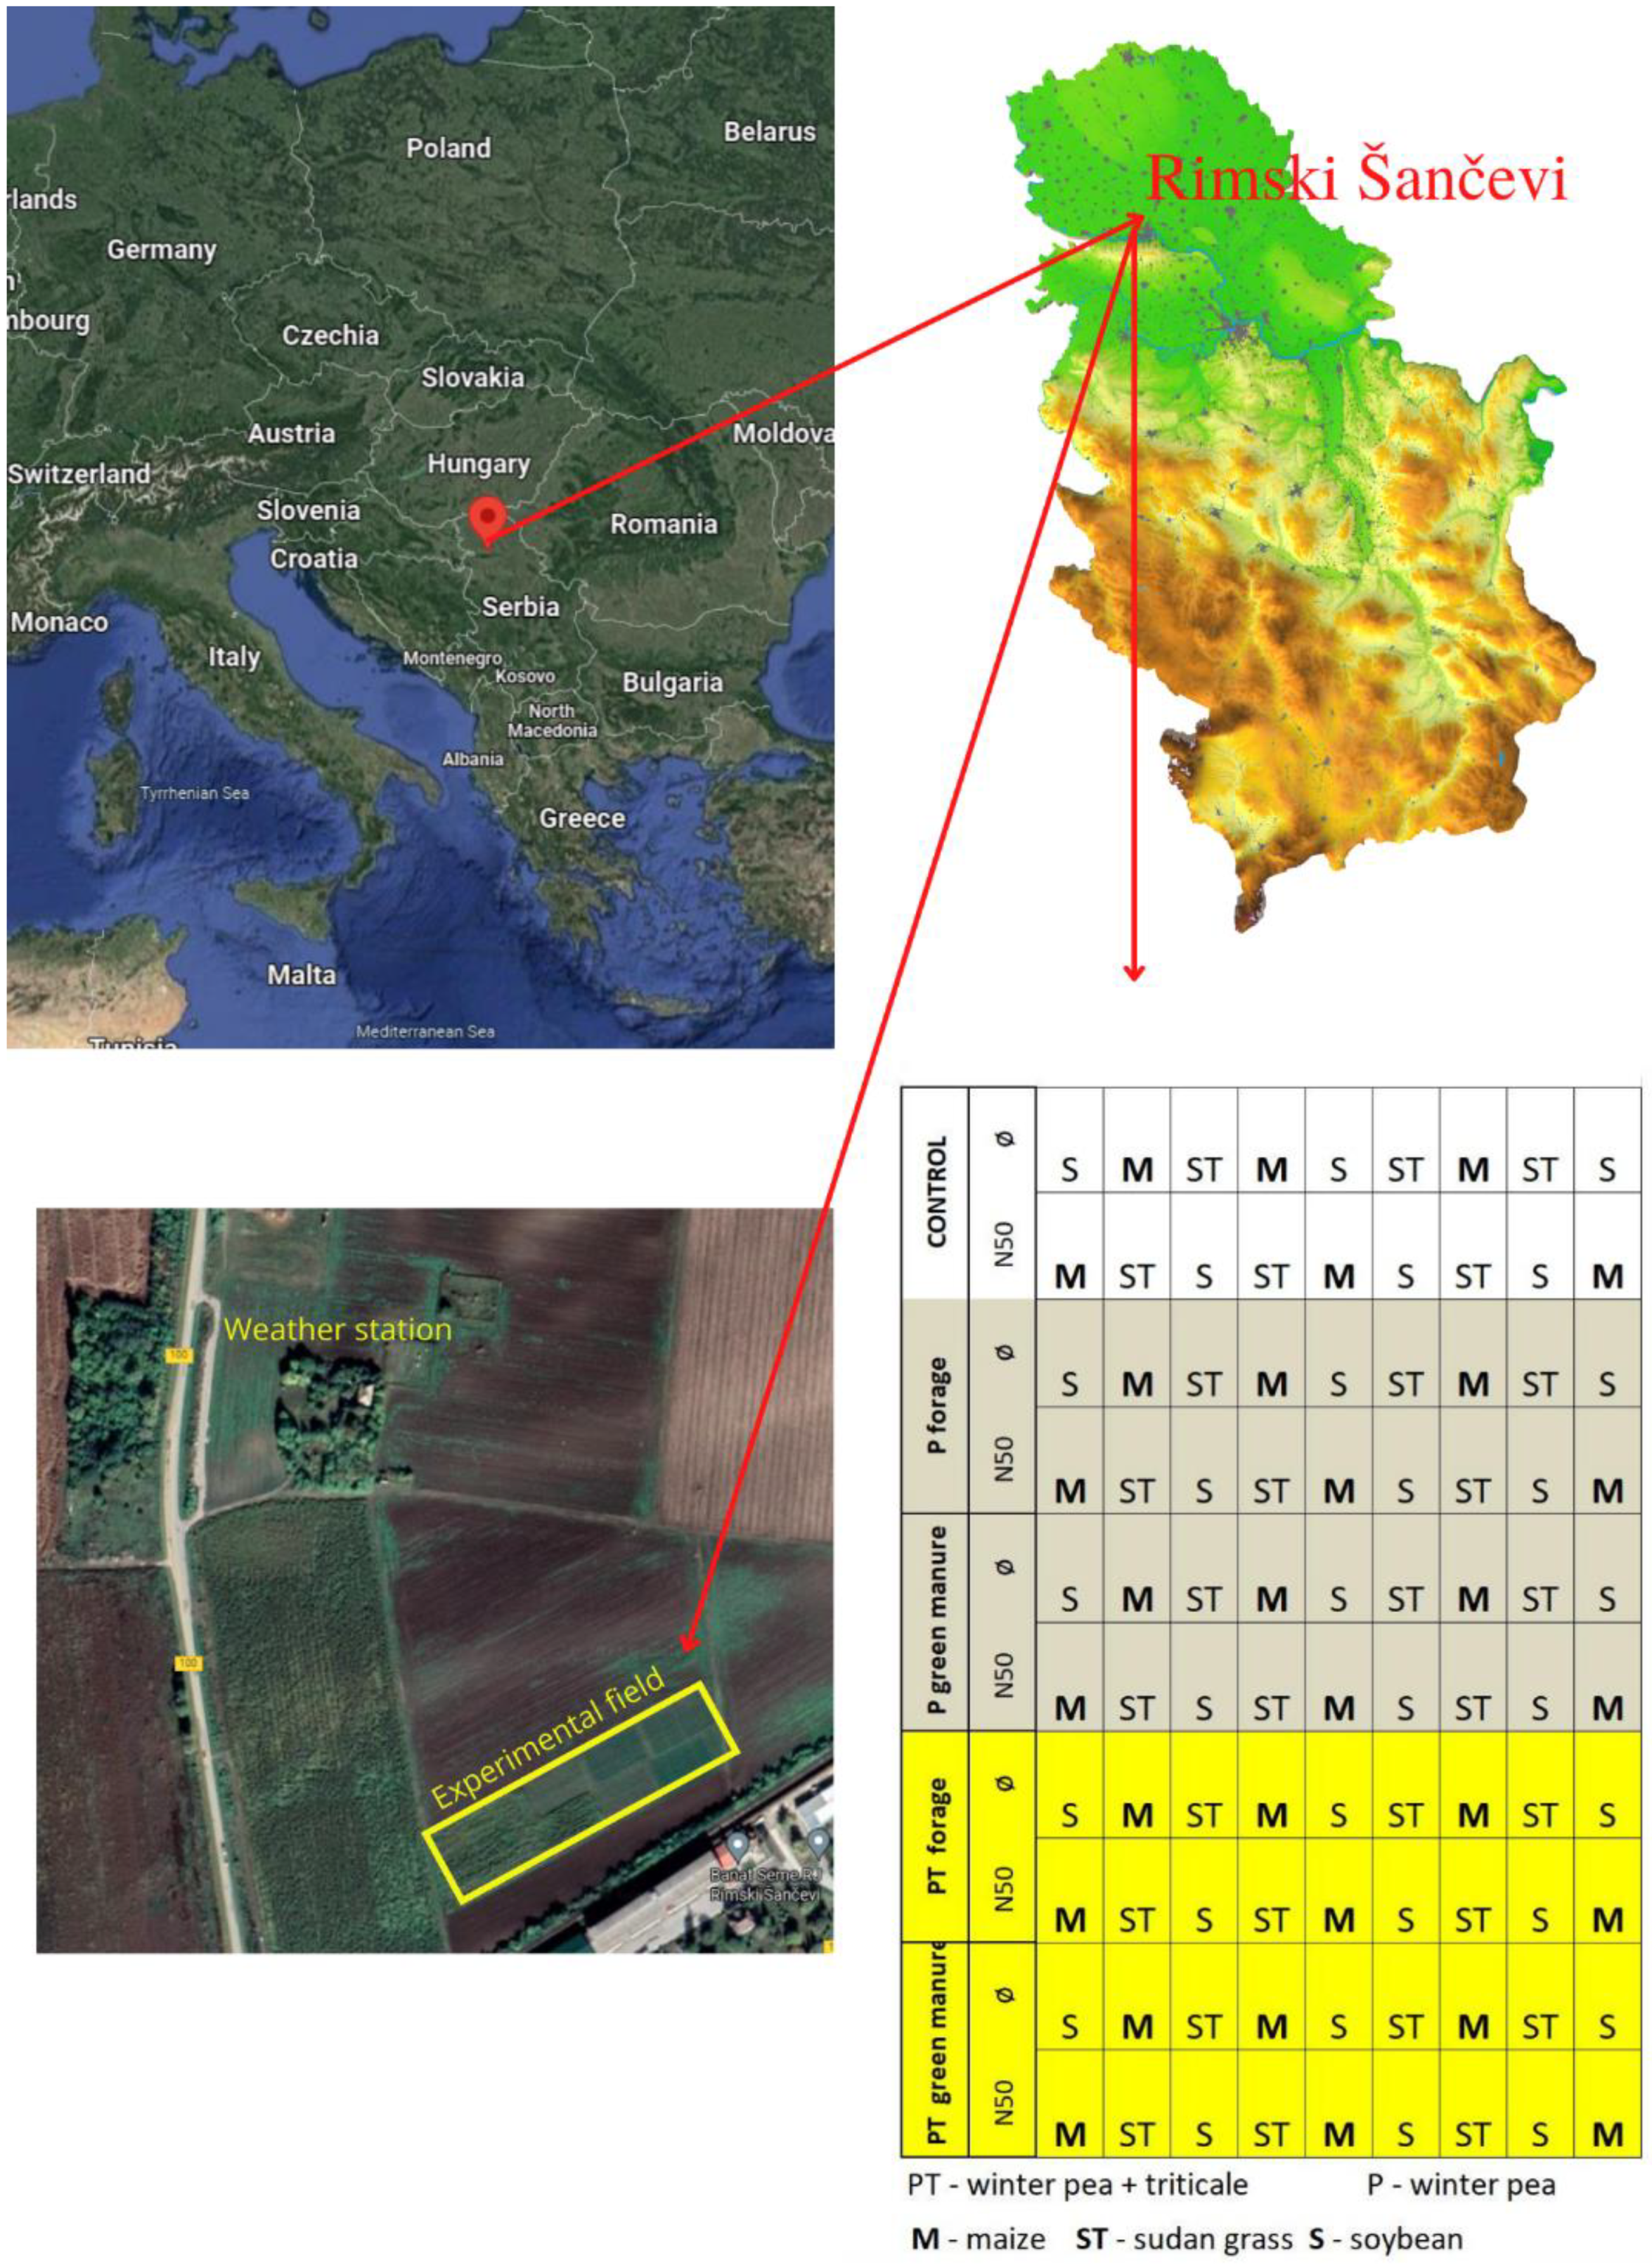
2.1. Experimental Site Description—Location, Climate and Soil Characteristics

The research was carried out in the period from 2016 to 2020, at the Rimski Šančevi experimental station (45°19′ N; 19°50′ E; 80 m a.s.l.) of the Institute of Field and Vegetable Crops in Novi Sad; the National Institute of the Republic of Serbia (in Vojvodina, Northern Province of Serbia), in the typical chernozem zone of the southern part of the Pannonian Plain (Figure 1). According to the WRB classification (2014), the soil type is medium-deep chernozem, formed on loess and loess-like sediments; is classified as Calcareous Chernozem (aric, loamic, pachic), abbreviated as CH-cc-ai.lo.ph.
The climate is characterized as a moderate continental climate with extreme seasonal variability in temperature and precipitation. Based on long-term data (1970–2017), the mean annual air temperature is 11.4 °C and the total annual precipitation sum is 640.5 mm. Monthly precipitation and temperature data were collected from the weather station at Rimski Šančevi experimental field (Figure 1).

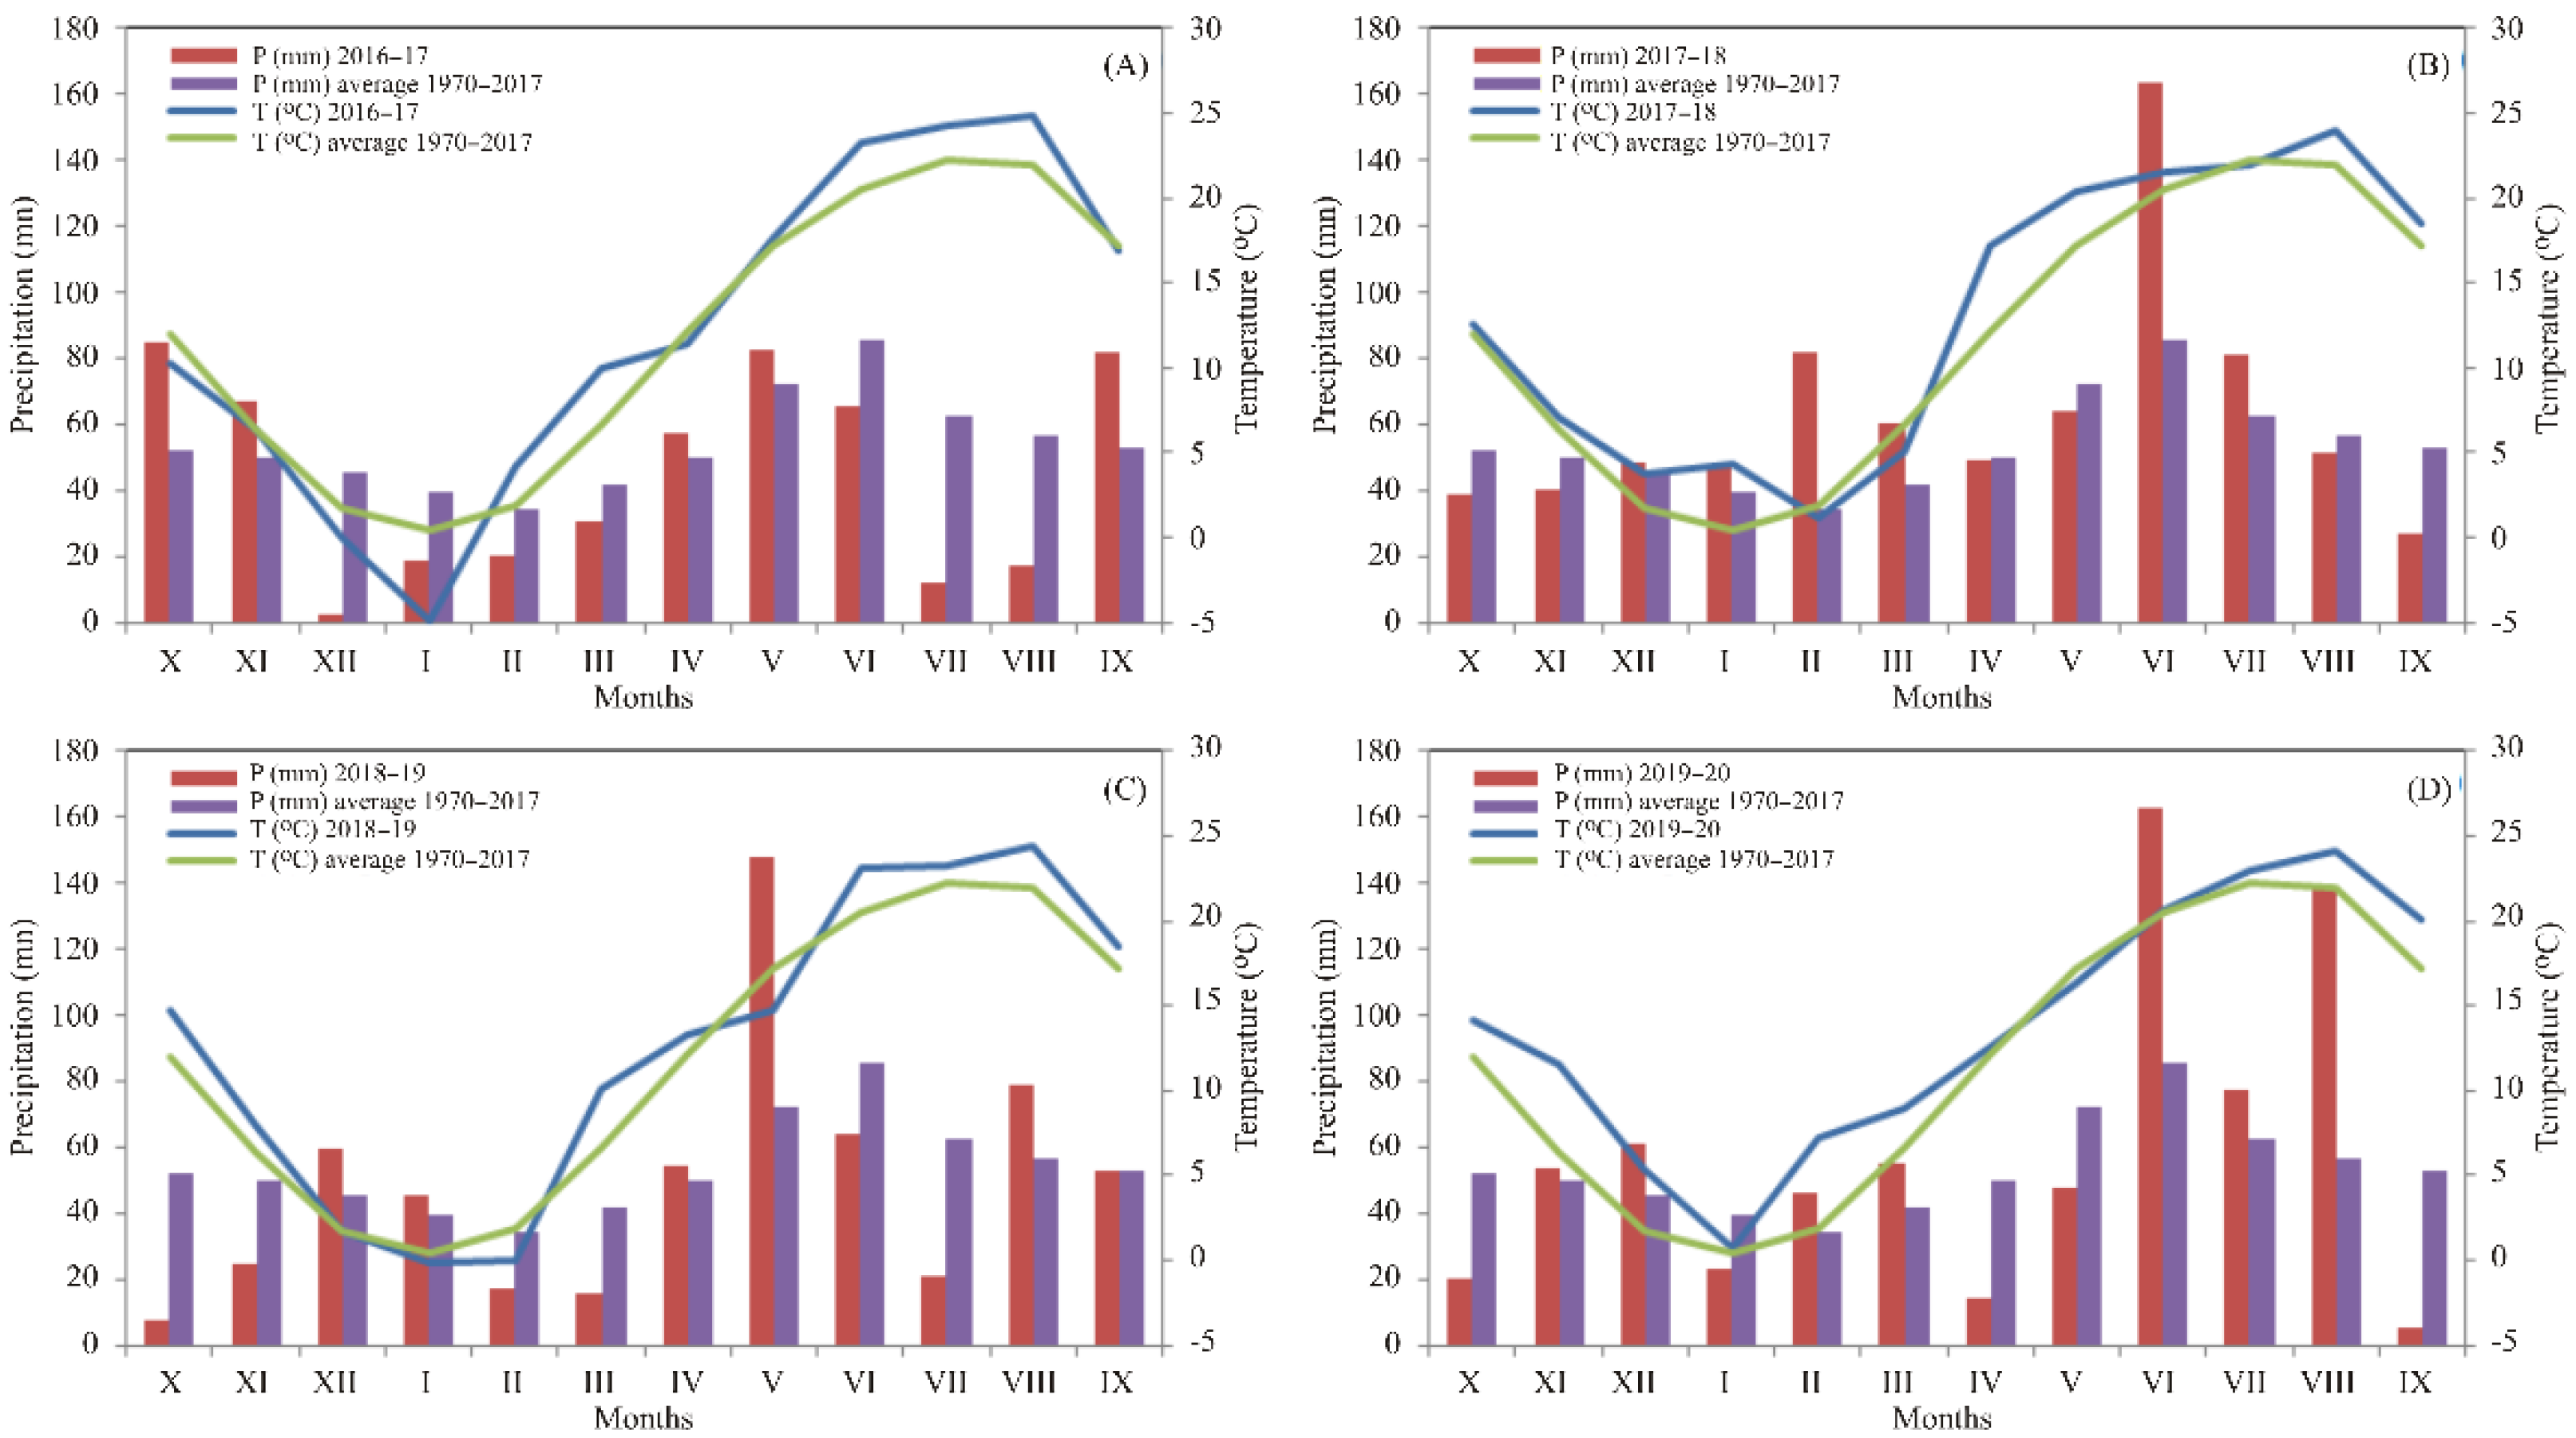
Weather Conditions during the Research Period

During the investigated period, temperatures, and precipitation showed differences among investigated growing seasons and deviations from the long-term averages (LTA) (Figure 2). At the beginning of the experiment, from December 2016 to March 2017, the lower precipitation was recorded compared with the LTA (1970–2017). That caused a shortage of water in the soil, and drought continued in summer 2017 (July–August), while in autumn 2017 precipitation increased. Temperatures in the period October–September 2017/18 were higher by 1.4 °C compared with LTA. The amounts of precipitation during the winter period compensated for the lack of soil moisture in 2017 and provided sufficient soil moisture during the spring season of 2018. Total precipitation in the hydrological year 2017/18 (753.4 mm) was above the average values for the experimental site. The small amount of precipitation (7.4 mm) at the beginning of the hydrological year 2018/19 (October) resulted in decreased soil moisture in autumn 2018. In February and March, a period with a lower amount of precipitation continued, and from the spring the precipitation increased, particularly in May (147.6 mm). Total precipitation for the hydrological year 2018/19 was lower by 42.9 mm than the LTA. Based on the meteorological conditions, 2019 was the warmest in the last 50 years, with an average annual temperature of 13.4 °C. During the hydrological year of 2019/20, the amount of precipitation was 72.5 mm higher than LTA. In June and August, the amount of precipitation (163 and 138 mm, respectively) was significantly above the average values. Significant deviations from the monthly temperatures were recorded in November and December 2019, as well as in February 2020. The warmest month in 2020 was August, with an average monthly temperature of 24.1 °C.

2.2. Experimental Design

The experimental plots were established using a randomized complete block design (RCBD) arranged as a split-split-plot, with 3 replicates (Figure 1). Maize was grown in a 3-year rotation with Sudan grass and soybean. Cover crops (CC) were considered as the main plots, which consisted of the following: (a) the winter pea (Pisum sativum ssp. Arvense L.) (P), (b) the mixture of winter pea + triticale (×Triticosecale) (PT), and (c) control treatment (Ø, without CC). The CC plots were divided into the following two sub-plots (way of using cover crops, WUCC): in the first sub-plot, winter CC was used as green manure with plowing, while in the second, the cover crops were mowed and forage was taken away. Based on above factors, the trial anticipated 5 treatments as follows: (i) winter pea + triticale (PT) for green manure, (ii) winter pea + triticale (PT) for forage, (iii) winter pea as a sole crop (P) for green manure, (iv) winter pea (P) for forage, and (v) control (Ø)-without CC. All sub-plots were additionally divided into two sub-sub-plots (N fertilization), namely, with nitrogen fertilizer of 50 kg ha−1 (N50), and without N fertilizer application (NØ). The dimensions of each individual basic plot were 6 × 4 m, i.e., 24 m2. Winter CC was sown in autumn, in the last week of October/beginning of November, and cutting for forage and plowing as green manure was performed in May. After plowing and seedbed preparation, in the first decade of June, maize (hybrid NS-4051) was sown at a distance of 23 cm between plants in a row and 70 cm between rows, with a seeding rate of 62,000 plants ha−1. Nitrogen (Urea, 46% N) was applied in maize vegetative phase BBCH 34, and the harvest was performed in October. The description of field operations by analyzed years is shown in Table 1.

2.3. Measurements and Analytical Determination

The disturbed field moist soil samples (1 kg of soil per plot) were collected from the topsoil (0–30 cm) in autumn, after maize harvest (Table 2). The pH value of the soil was determined in the suspension of soil in KCl and H2O, by Metrel MA 3657 pH meter. Humus content was determined by oxidizing organic matter with potassium bichromate [47]. Calcium carbonate (CaCO3) content was determined volumetrically using Scheibler calcimeter. Mineral N in the soil was extracted using 2 M KCl (1:4 soil-to-solution ratio, on weight basis) and determined by steam distillation [48]. The available phosphorus (P) and potassium (K) content were measured by the Ammonium-Lactate (AL) method. The concentration of P2O5 was measured by spectrophotometry, while the concentration of K2O was measured by flame photometry [49].
The dry matter yield of aboveground biomass of cover crops (t ha−1) was evaluated before incorporation by cutting the crop to a stubble height of 5 cm. Samples were collected from 1 m2 from each basic CC plot and each replicate. Samples were taken from the central part of each plot. The dry matter yield of cover crops was obtained by drying samples to a constant mass at 105 °C in the oven. The morphological traits and yield components of maize were measured at the maize-harvesting time (October) by randomly choosing 15 plants from each plot in 3 repetitions. Grain yield was adjusted to a moisture content of 14%.
The following variables, i.e., performances of maize plants and crops were recorded: plant height (H; cm), number of leaves (NL), number of internodes (NI), plant density (PD; number of plants ha−1), number of ears (NE), grain yield (GY; t ha−1), 1000-grain weight (TGW; g), hectolitre weight (HW; kg HL−1), dry matter harvest residue (DMHR; t ha−1), harvest index (HI), and leaf (L), stem (S), and ear (E) percentage.

2.4. ANN Modelling

A multi-layer perception model (MLP), with three layers (input, hidden, and output) was implemented to construct 13 ANN models for the following output variables: H, NL, NI, PD, NE, GY, TGW, HW, DMHR, HI, L, S, and E; according to the following factors: cover crops type (CC), way of using cover crops (WUCC), N fertilization (NF) and YEAR. This format of the ANN model is approved for its high potential of estimating nonlinear functions [50,51,52,53].
Before the ANN model’s computation, input and output data should be normalized to enhance the outcome of the ANN [54]. Throughout the ANN model’s building, input data are repeatedly inserted in the network [55,56,57]. The training process of the network was replicated 100,000 times, testing the various structures of the ANN model, including a diverse number of neurons in the hidden and the output layers (1–20), alternative activation functions (such as the following: logarithmic, logistic, tangent hyperbolic, or identity), and with random starting values of weight coefficients and biases. The ANN structure optimization was accomplished by achieving the minimal validation error. The Broyden–Fletcher–Goldfarb–Shanno algorithm (BFGS) was implemented for resolving the unconstrained nonlinear optimization problem throughout the ANNs construction [54].
The maize crop performance database, which was employed for the 13 ANN models, was stochastically segmented into the following: training, cross-validation, and testing data (70%, 15%, and 15% of experimental data, respectively). The training data set was applied during the learning cycle of the ANNs calculation and also used to evaluate the optimal number of neurons in the hidden layer and compute the weight coefficient of individual neurons in the network [58]. The weight coefficients and biases connected to the hidden and output layers of the ANN models were recorded in matrices and vectors W1 and B1, and W2 and B2, individually. The neural network model can be displayed by the following matrix equation:
Y = f 1 ( W 2 f 2 ( W 1 X + B 1 ) + B 2 )
where Y is the matrix of the outputs, f1 and f2 are transfer functions in the hidden and output layers, respectively, and X is the matrix of inputs [59]. The elements of matrices W1 and W2 for each ANN model were computed during the learning cycle, in which the elements are constantly introduced applying an optimization method to minimize the disagreement between the data and the models [54,60,61]. The BFGS algorithm was implemented to enhance the evaluation and stabilize the solution’s convergence [62]. The coefficients of determination were utilized as parameters to monitor the execution of the achieved ANN model. The ANN model was created to foresee and optimize the following parameters: H, NL, NI, PD, NE, GY, TGW, HW, DMHR, HI, L, S, and E, according to the following treatments (factors): CC, WUCC, NF, and YEAR.

2.5. Global Sensitivity Analysis

The Yoon’s global sensitivity formula for the obtained ANN model was exploited to evaluate the relative influence of the input parameters on output variables, based on weight coefficients of the developed ANN models [63].
R I i j ( % ) = k = 0 n ( w i k w k j ) i = 0 m | k = 0 n ( w i k w k j ) | 100 %
where: w—weight coefficient in ANN models, i—input variable, j—output variable, k—hidden neuron, n—number of hidden neurons, m—number of inputs.

2.6. Error Analysis

The numerical confirmation of the developed model was investigated applying the coefficient of determination (R2), reduced chi-square (χ2), mean bias error (MBE), root mean square error (RMSE), and mean percentage error (MPE). These frequently used parameters can be obtained according to the following equations [64]:
χ 2 = i = 1 N ( x exp , i x p r e , i ) 2 N n ,
R M S E = [ 1 N i = 1 N ( x p r e , i x exp , i ) 2 ] 1 / 2 ,
M B E = 1 N i = 1 N ( x p r e , i x exp , i ) ,
M P E = 100 N i = 1 N ( | x p r e , i x exp , i | x exp , i )
where xexp,i marks the experimental values and xpre,i present value computed by the model, N and n are the number of observations and constants, accordingly.

2.7. Multi-Objective Optimization

The obtained ANN models were employed for multi-objective optimization (MOO) calculation, with the aim to gain the specific set of production parameters, which would extract the maximal values of PD, GY, TGW, HW, DMHR, and HI. The final result of MOO was derived using a Pareto front algorithm, which existed in the case of one objective function improvement without deteriorating the others [39]. The genetic algorithm (GA) was used to find the solutions to the MOO problem by a stochastic method inspired by natural evolution applying the mutation, selection, inheritance, and crossover [65]. For the MOO computation, MATLAB software (version 7.10.0 (2010), The MathWorks Inc., Natick, MA, USA) was used, and gamultiobj algorithm was used for MOO optimization. The primary population is formed by chance and then introduced to a set of points in the design area. The populations of the next generations were determined using distance measures and non-dominated ranking of the particular points within the existing generation [39,45,46]. Modeling, statistical analysis, and multi-objective optimization of the collected data in this study were processed statistically using the software package STATISTICA version 14.0. (TIBCO Software Inc., Palo Alto, CA, USA).

3. Results

3.1. Dry Matter Yield of Cover Crops
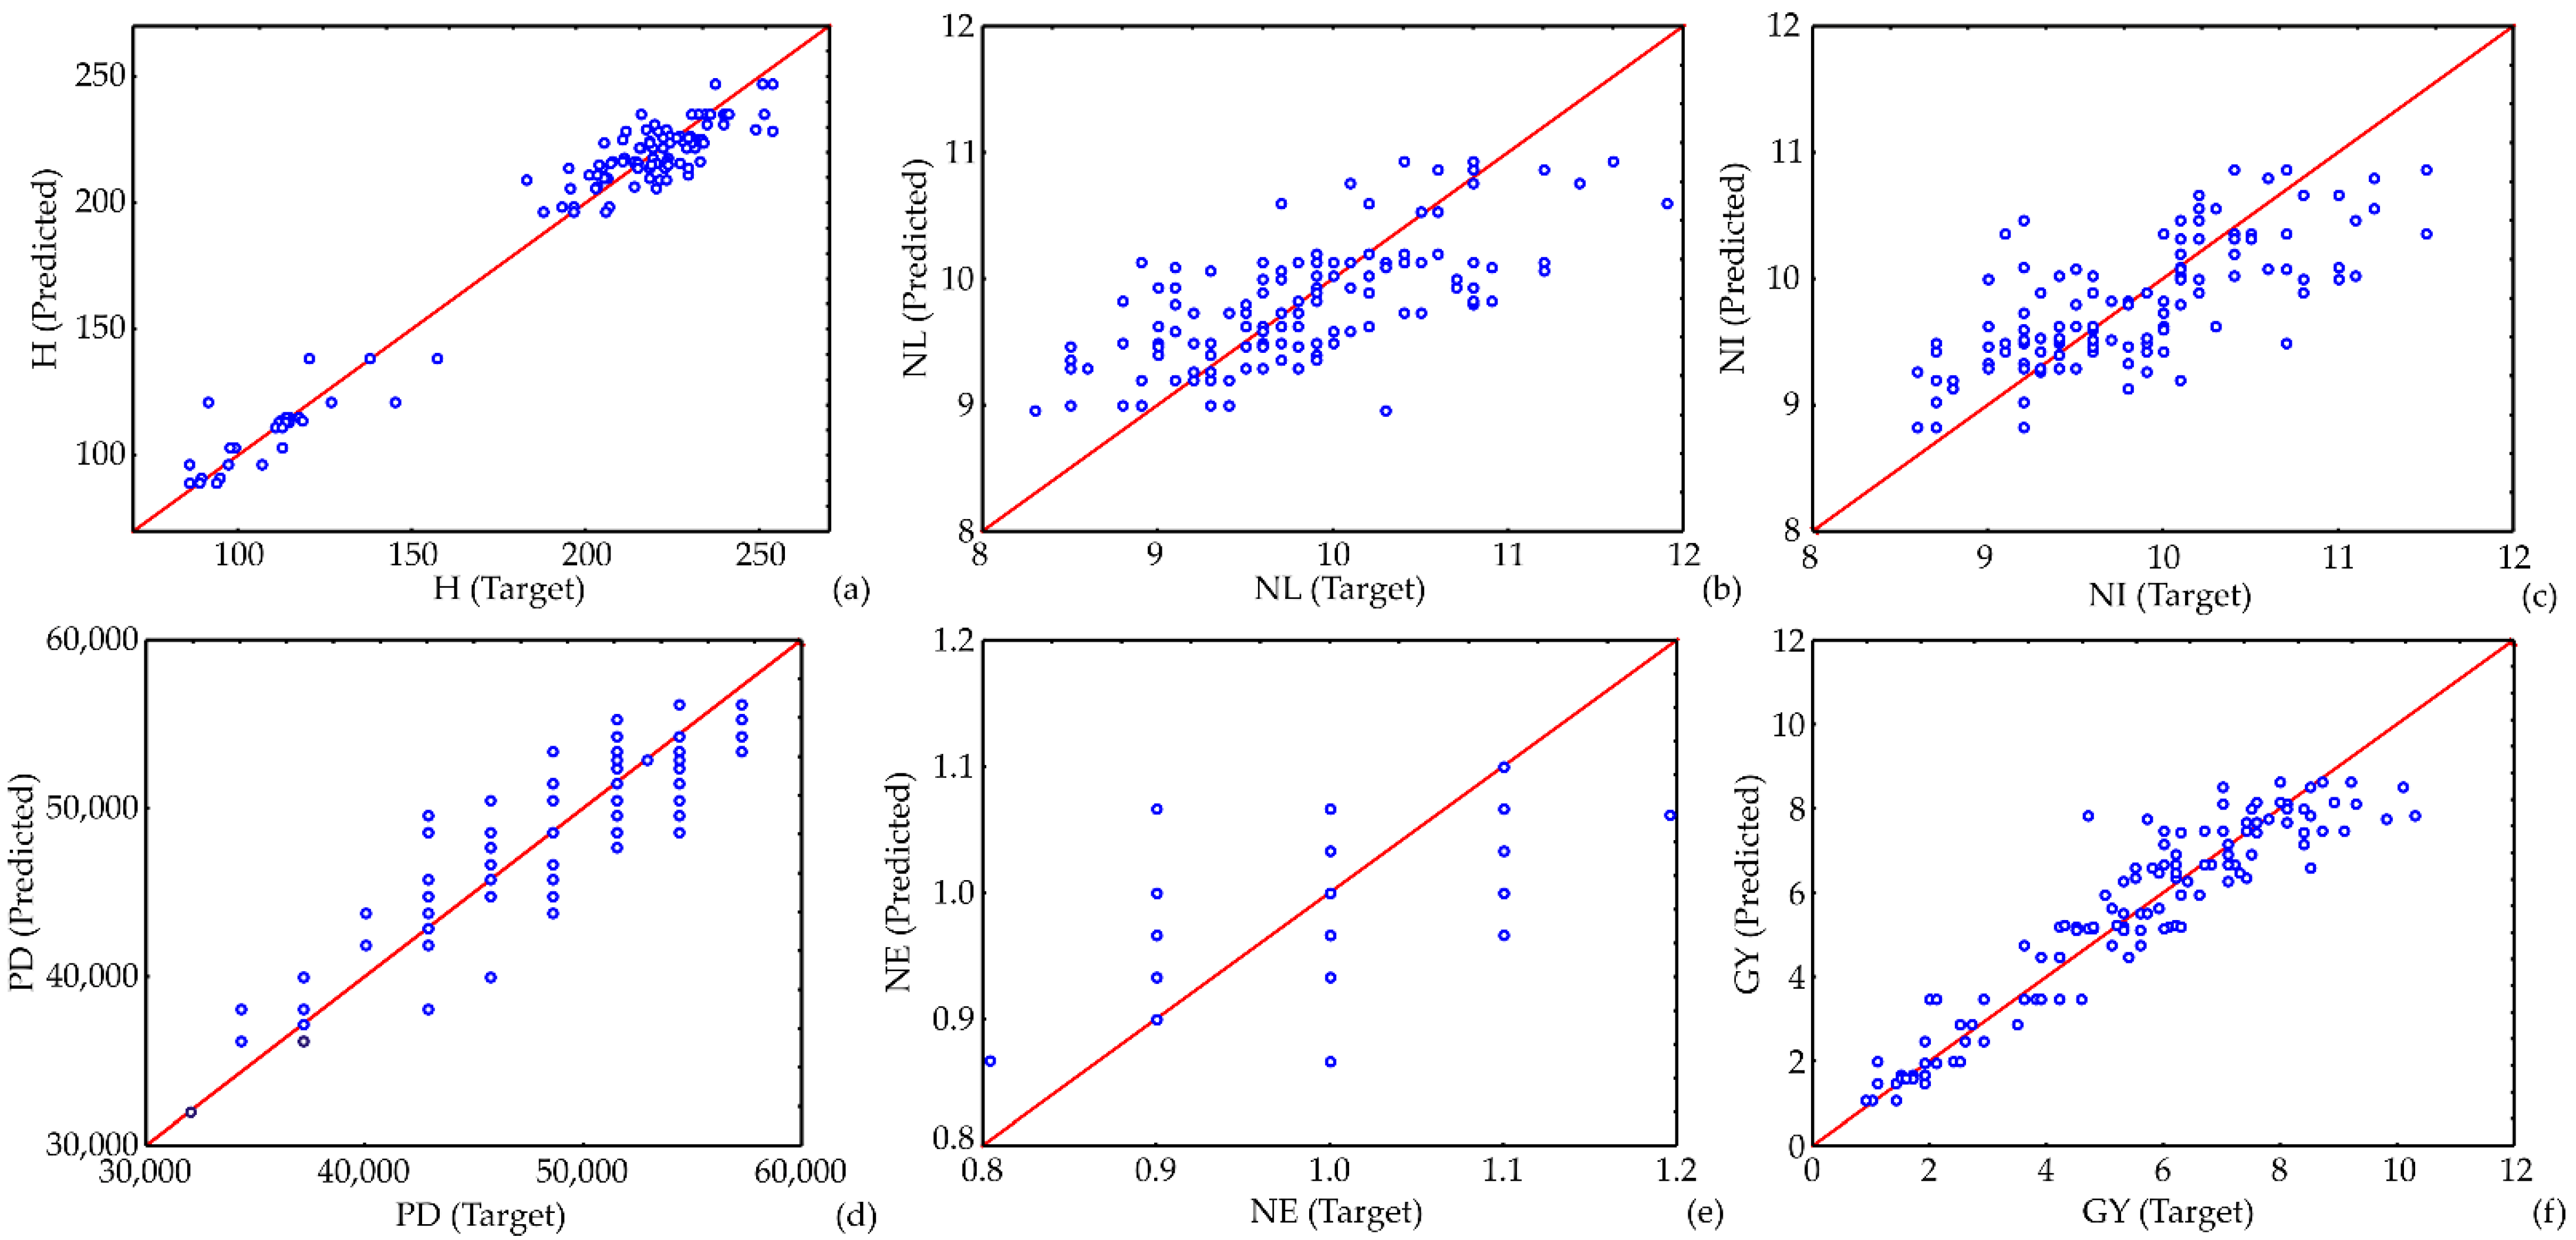
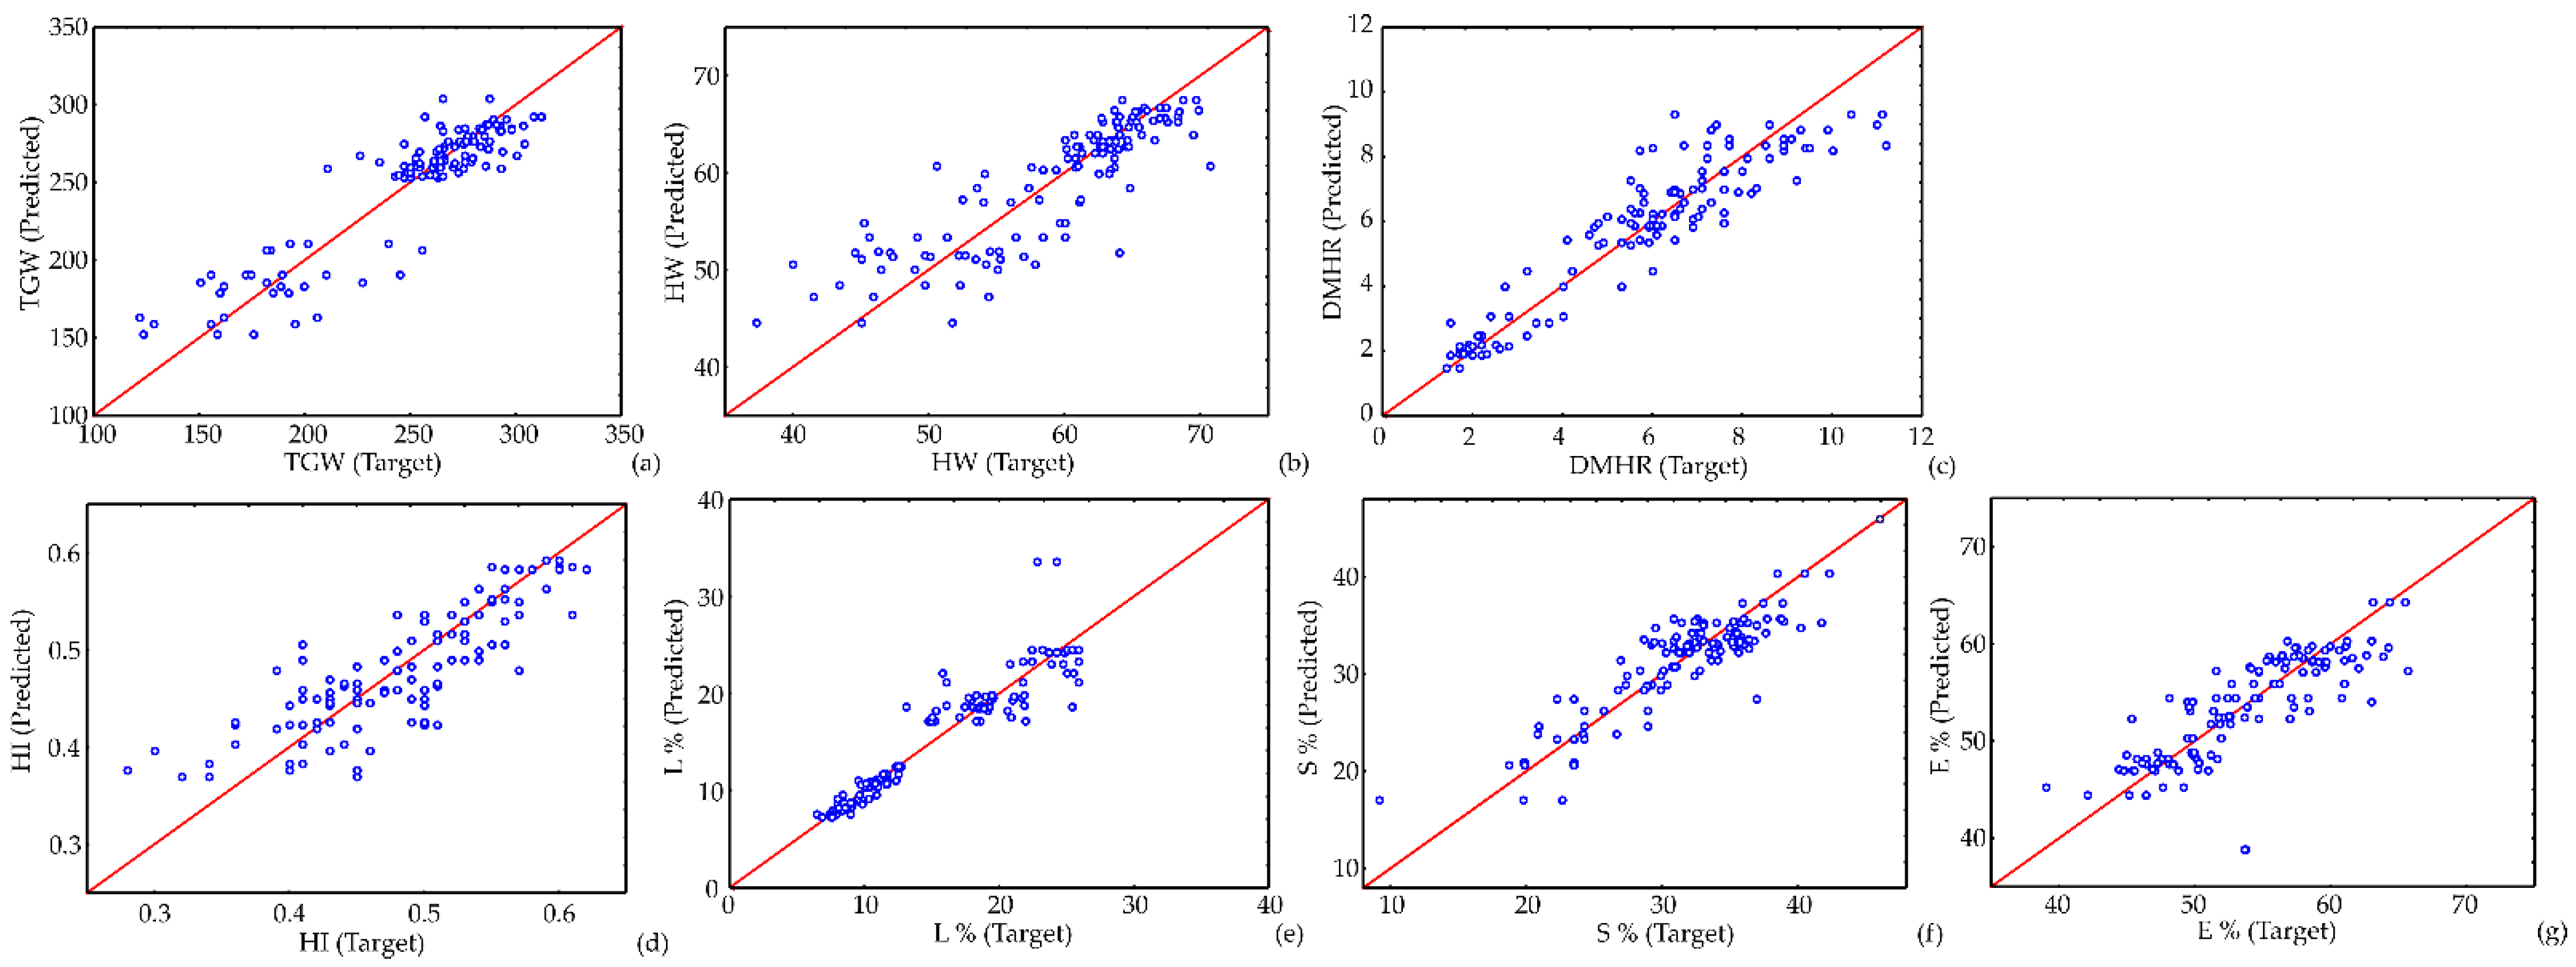
The dry matter yield of cover crops differed and depended on a complex interaction of years and CC. Due to favorable weather conditions, the highest dry matter yield of CC was achieved in 2020 with the mixture of PT (4.4 t ha−1) and was higher by 0.9 t ha−1 compared to the sole pea crop (Figure 3). The lowest yield of CC dry matter was achieved in 2017, in the pea crop (1.2 t ha−1), which differed by 0.5 t ha−1 in relation to the mix PT. In the years 2018, 2019, and 2020, the CC yield was higher than in 2017. The yield of PT was higher by 1.7 t ha−1 in 2018, i.e., by 2.7 t ha−1 in 2020 compared to the yield in 2017.

3.2. ANN Model

The attained ANN models showed sufficient generalization ability for experimental data prediction. Based on the ANN models’ performance, the optimal number of neurons in the hidden layer for calculation of the following selected parameters: H, NL, NI, PD, NE, GY, TGW, HW, DMHR, HI, L, S, and E, the prediction was between 5 and 10 to attain the required high values of R2 (in the range from 0.487 to 0.966, for the training period) and as low as possible sum of squares (SS) values (Table 3 and Table 4).
The goodness of fit among experimental computations and model estimated outputs, described as the ANN models’ performance (sum of R2 within measured and calculated parameters), through training, testing, and validation actions, are displayed in Table 4.
The used ANN models predicted the experimental variables quite well for a wide range of the process parameters (which can be seen in Figure 4 and Figure 5, where the experimentally estimated and predicted values of the ANN models are shown).
The R2 values within experimental and ANN model outputs for H, NL, NI, PD, NE, GY, TGW, HW, DMHR, HI, L, S, and E, were 0.966; 0.487; 0.508; 0.793; 0.508; 0.891; 0.838; 0.713; 0.855; 0.698; 0.855; 0.773; 0.621, accordingly, throughout the training period.

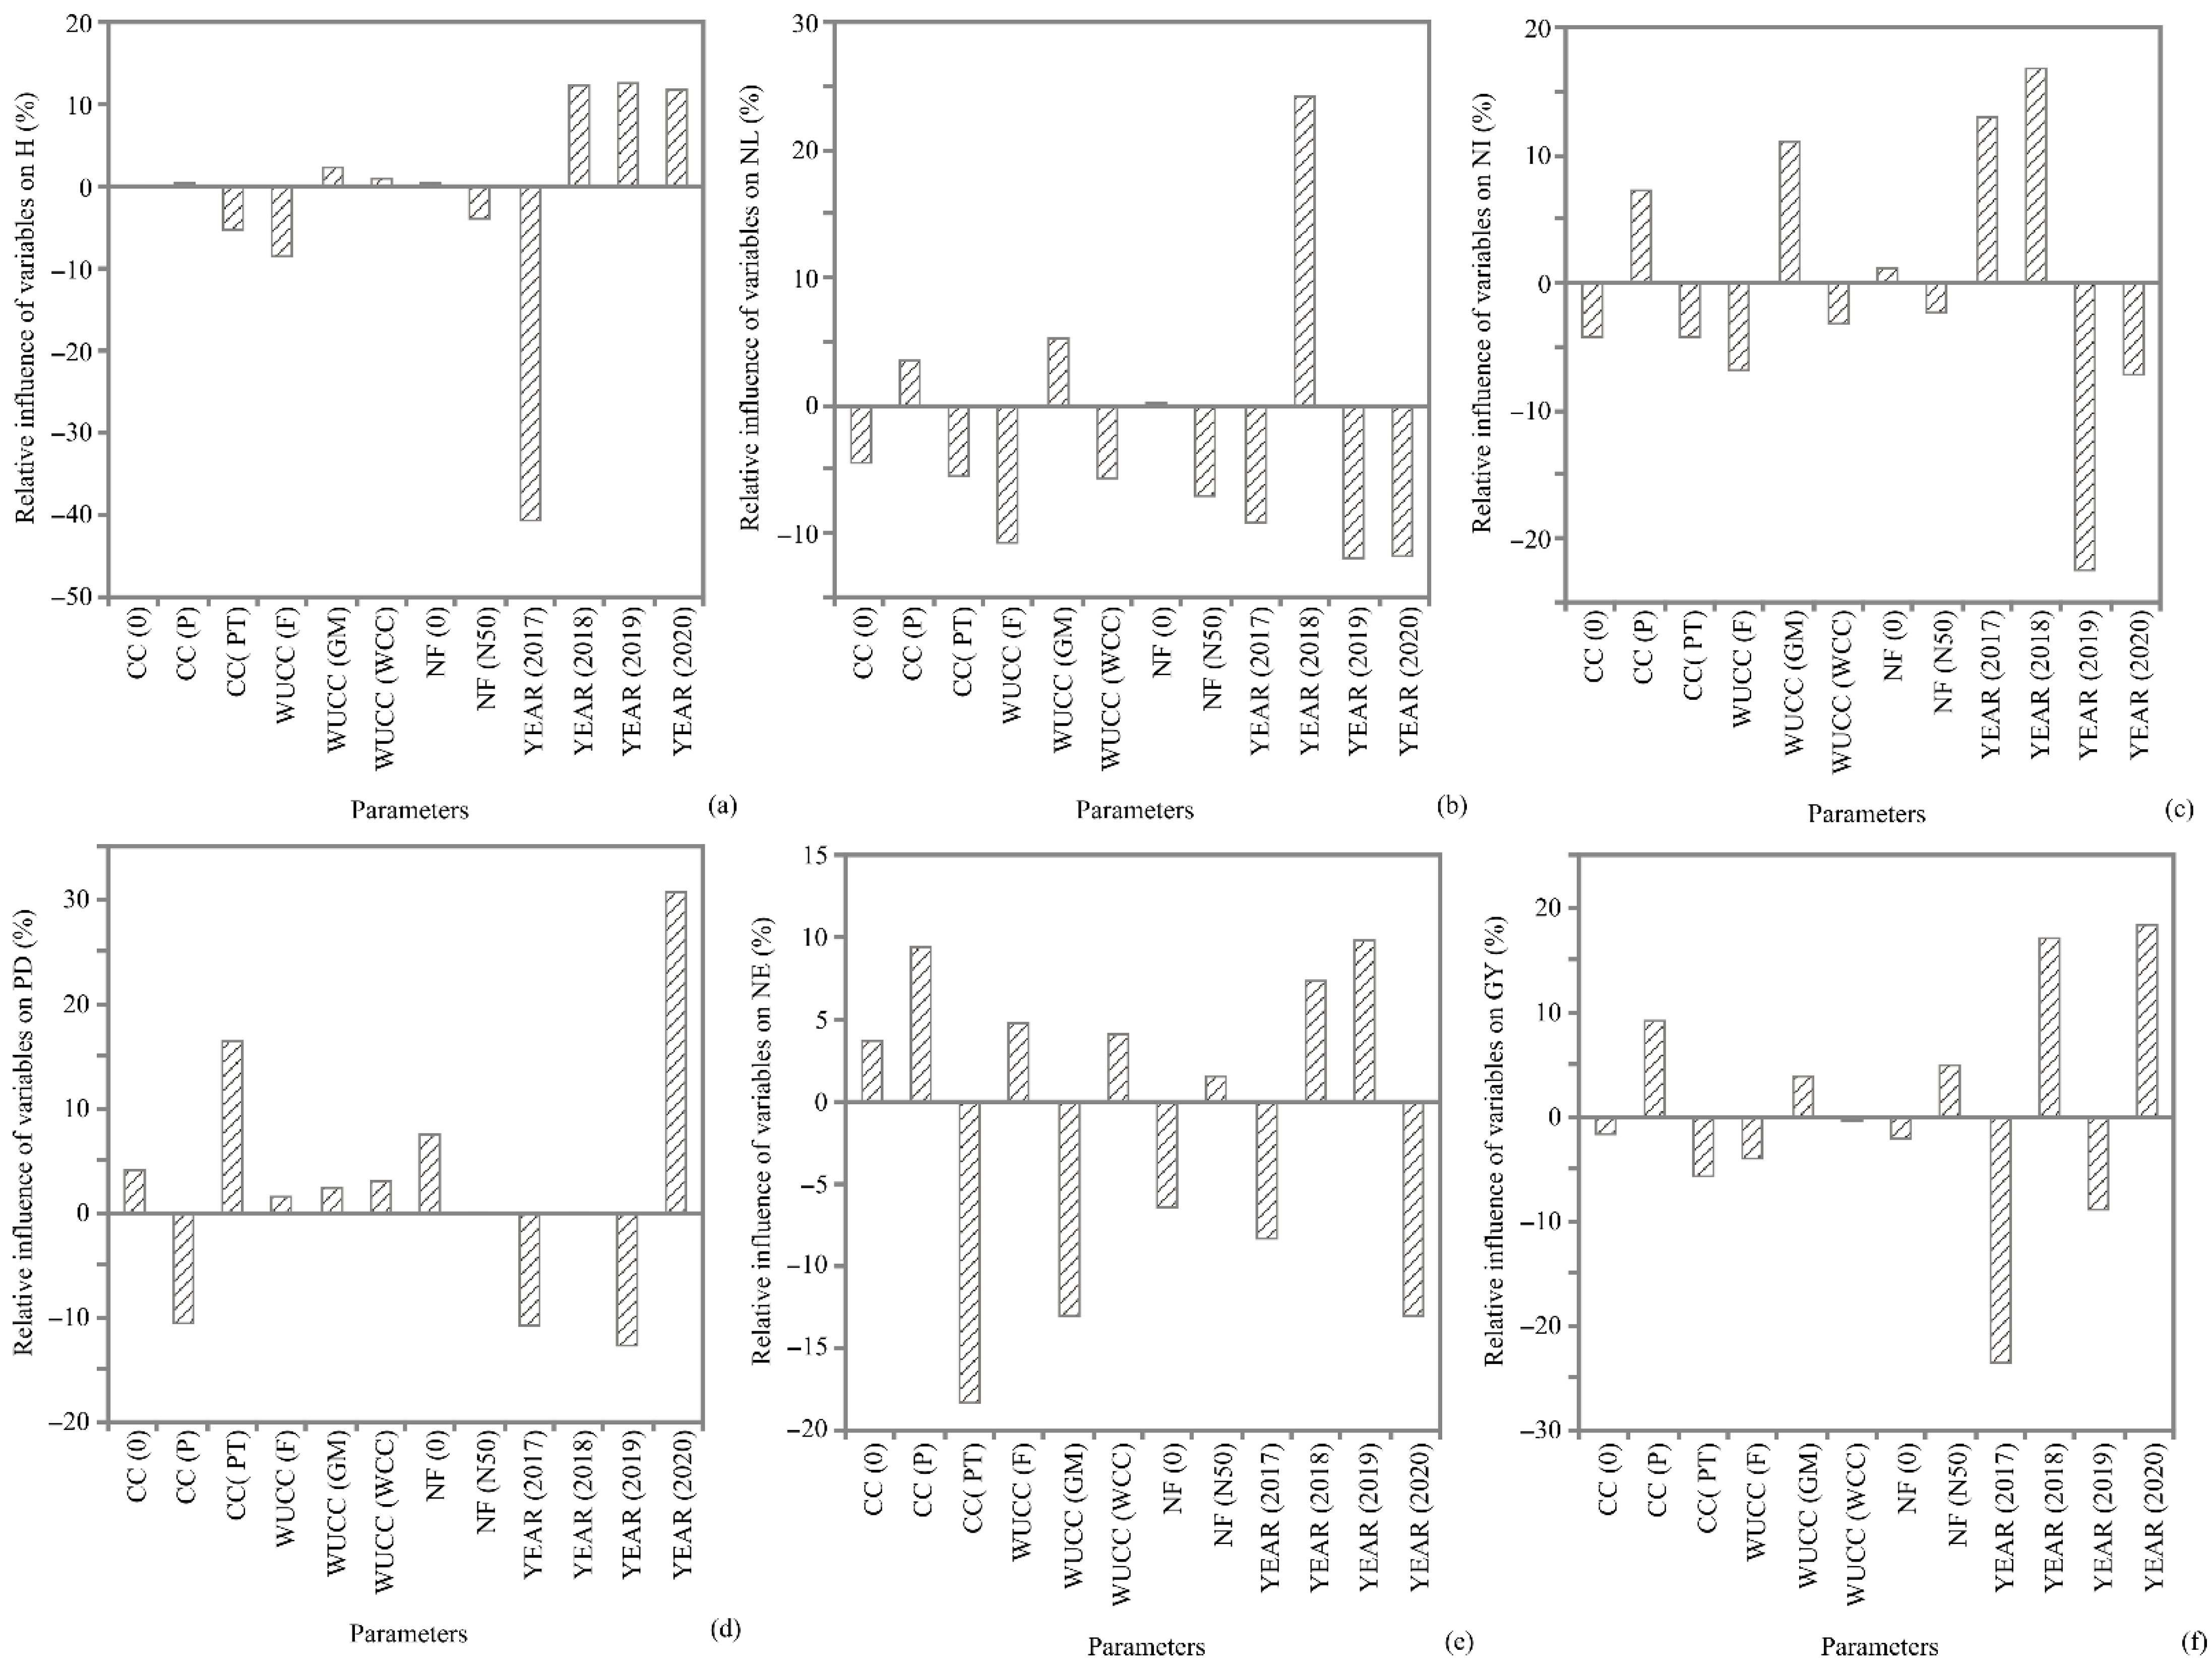
3.3. Global Sensitivity Analysis—Yoon’s Interpretation Method

In this segment, the impact of input variables (i.e., factors CC, WUCC, NF, and YEAR) on H, NL, NI, PD, NE, GY, TGW, HW, DMHR, HI, L, S, and E, throughout the maize production, the Yoon’s interpretation method of the generated ANN models were analyzed. The graphical display of the ANN model results is shown in Figure 6.
As presented in Figure 6a,f, 2017 is the most negatively influential parameter on H and GY, with a relative importance of −40.78% and −23.69%, respectively; while the influence of the year 2018 on the NL was quite the opposite, with a relative influence of +24.23% (Figure 6b). The arid period during the summer months of 2017 (Figure 2a) affected the slow growth and development of maize plants, as well as grain yield. The results show that optimal conditions for maize production can be achieved if winter peas are incorporated into the soil as green manure, along with nitrogen fertilization (50 kg N ha−1), and in years with a favorable precipitation distribution; such as in 2018. NI was mainly influenced by the 2019 year, with a relative importance of −22.64% (Figure 6c), while the year 2020 was the most significant parameter for plant density (Figure 6d), with a relative influence of 30.68%. On the other hand, according to Figure 6e, the number of ears was negatively influenced by the mixture of pea and triticale, using cover crops as green manure, and the year 2020, with a relative importance of −18.36%, −13.11%, and −13.02%, respectively.
The maize yield dependence on the investigated factors is reflected in 1000-grain weight and hectolitre weight. According to Figure 7a,c,f, the year 2017 had a negative effect on 1000-grain weight, dry matter harvest residue, and stem percentage, with a relative importance of −33.48%, −23.02%, and −26.60%, respectively. The year 2019 had a positive impact on the hectolitre weight (+16.55%) and ear percentage (+29.14%), while it showed a negative impact of −23.18% on the harvest index (Figure 7b,d,g). High temperatures affected the 1000-grain weight due to the rapid ripening in dry years such as in 2017. The influence of peas as a cover crop on leaf percentage was negative, with a relative importance of −27.55% (Figure 7e). The result indicates higher effects of the winter pea treatment on the ear and stem percentage, which is made possible by the greater availability of soil moisture and nitrogen.

3.4. Multi-Objective Optimization (MOO) of the Outputs of ANN

One of the main goals of this research was to optimize PD, GY, TGW, HW, DMHR, and HI throughout different field management practices and years, synchronously, employing the ANN models and varying input variables. These numerical assignments were solved for the ANN models by applying the MOO computation in Matlab. The MOO method was set to obtain the best combinations of different parameters by maximizing the output variables in the ANN models. The optimization method’s constraints were used in the experimental series of parameters. The number of generations achieved was 723 for the ANN models, while the population dimension was set to 200 for all input variables. Thus, the number of points on the Pareto front was 69 for the ANN models. The computed maximums of H, NL, NI, PD, NE, GY, TGW, HW, DMHR, HI, L, S, and E were the following: 232.3 cm; 9.7; 10.2; 54.340 plants ha−1; 0.9; 9.8 t ha−1; 272.4 g; 67.0 kg HL−1; 9.2 t ha−1; 0.52; 18.9%; 36.0%, and 45.1%, respectively. The optimal result was obtained with the following parameters: peas used as green manure, with an application of 50 kg N ha−1, and in the climatic conditions of 2018.

4. Discussion

Our study showed that climatic conditions significantly modified overall cover crop performance while increasing the sensitivity of the main crop to weather conditions (Figure 3). This is particularly noticeable in 2017, when the lack of precipitation (first during the winter period, and later during the spring) suppressed their growth, and decreased the yield. During the four years of research, the average dry matter yield of cover crops was higher in the mixture of pea and triticale (3.4 t ha−1) compared to peas as a sole crop (2.1 ha−1) (Figure 3). Similar to our results, Ref. [66] states that mixed cover crops have a higher forage yield and a better nutrient balance for ruminant feed than sole cropping. On the other hand, the plowing of a cereal/legume mixture results in a larger amount of dry matter incorporated into the soil as green manure [67], which affects the soil’s physical properties and soil air regime [68].
The selection of proper cover crops and timely incorporation of winter CCs can increase or adversely affect the crop yield of the subsequent crop in rotation. Chen et al. [69] registered an increased maize yield from 1.60 to 2.43 t ha−1 following CC, which is consistent with the results of our study. Increased maize yield was also obtained in the research of [70], in which a mean increase of grain yield was 78, 91, and 66% with the inclusion of cowpea, pigeon pea, and hemp, compared with the fallow system. On the contrary, Ref. [71] reported a decrease in the yield of cash crops (maize and sunflower) by 0.5–3.0 t ha−1. In our study, the sowing of maize was performed after the recommended date to give CCs more time to produce higher biomass. Currently, there is a lack of information on crop cultivation in the subsequent sowing period in the temperate conditions of Vojvodina province. Nevertheless, the assumption is that hybrids of shorter FAO maturity groups can be established significantly later than the optimal term with acceptable risks. Mahama et al. [70] confirm that the sowing delay of main summer crops is related to the necessity to provide time for winter CCs growth and higher biomass production, and in the case of legumes, to accumulate N. However, in this study, it was shown that this practice could be successfully implemented for the winter cover crops. Out of four years of research; only in 2017 arid periods were recorded in July and August with 29.4 mm of precipitation (90 mm less than the LTA).
Consequently, the yield components of maize were lower and affected the yield accomplishment. In conditions with uncertain amounts of precipitation necessary for the plants’ growth and development, it is essential to make a trade-off between the benefits provided by CCs and the possibility of obtaining a reduced yield of the main crop. Given that the average maize yield in our experiment is not considerably lower than the average grain yield of the recommended sowing dates, this approach could be a crucial point in designing future cropping systems in semiarid conditions.
ANN models can help predict maize behavior under our experimental setup. In most cases, the predicted values were approaching the desired R2 value for the ANN models. The SS achieved by the ANN models is of the same order of magnitude as experimental errors for H, NL, NI, PD, NE, GY, TGW, HW, DMHR, HI, L, S, and E, which were also observed in similar studies [54,62,72]. The ANN protocols are challenging (71–141 weights-biases) due to the high nonlinearity of the studied system [54,73]. Nevertheless, the character of the ANN models fit as observed in Table 4, where χ2, MBE, RMSE, and MPE were lower [64]. The residual analysis of the developed model was additionally conducted to provide insight into maize response to key variables and the limitations of ANN analyses. In addition, skewness was used to estimate the deviation of the distribution from regular symmetry. Skewness showed different values for some variables (NI, L, H, HI, E, etc.), indicating asymmetrical distributions, although normal distributions are ideally symmetrical. Accordingly, these indicators are developed as a consequence of complex interactions between the observed parameters. The data set was checked for kurtosis (the “peakeness” of a distribution). In our study, leaf and ear percentages are distinct in kurtosis values compared with other parameters, indicating heavier tails than normal distribution, with high peaks and outliers. This can be explained by the occurrence of smaller maize plants in which sudden maturation occurs in specific years. A high R2 is suggestive that the variation was estimated, and that the data fitted satisfactorily to the suggested model [74,75]. Marcillo and Miguez [15] in a meta-analysis of maize yield dependence on intercrops, concluded that CC from the Poaceae family neither positively nor negatively affected maize yield, while leguminous plants and their mixture showed a significant impact. Similar results were observed in our experiment as CC and years showed positive effects on the yield of subsequent maize crops.
In our study, the smaller number of ears of maize can be explained by the soil’s lower moisture content on the plots with the combined sowing of winter peas and triticale. However, this is contrary to the study of [76], who determined higher soil moisture after legume CCs compared with the mixture with cereal, while the lowest moisture content was in the soil after triticale. As shown in Figure 6, nitrogen fertilization had the lowest impact on the plant height, number of leaves and internodes, plant density, number of ears, and grain yield, while years were the most influential. The assumption is that fresh biomass mineralization can be sufficient for the N-demand of latter-sown maize. Refs. [77,78] found that plant density (the number of plants per unit area) is a decisive factor in maize production, but the optimal plant density is not always the same, but rather varies depending on the year. In recent decades, maize grain yield has become increasingly dependent on climatic conditions during plant growth and development [79]. Therefore, predicting optimal plant density represents a challenging task. The maize yield in the subsequent sowing directly depends on the water spent by the winter CCs and precipitation distribution during subsequent crop cultivation [80,81]. According to [82], CCs may have a more significant potential to reduce drought stress in maize after long-term use in systems with less soil disturbance. Rosa et al. [83] found that CCs in semi-arid conditions did not contribute to the increase in maize grain yield, and most CC types are associated with a reduction in maize yield. The same authors relate this consequence to the lack of soil moisture and nitrogen availability during the maize growing season. Despite many benefits, ref. [84] points out that the benefits of CCs in practice are still limited because the effects on productivity and economic return are variable. In addition to that, for conclusive CCs assessment and compliance with main crops, it requires multi-location trials and ideotype selection of both CC and crop sequence. In the work of [85], ANN was used to predict the role of individual nutrients on various parameters of rice plants. Contrary to our results, the authors determined that nitrogen is the most limiting nutrient among the studied nutrients in terms of obtaining the maximum grain yield of rice, regardless of the season and variety. They observed an improvement in plant height, number of tillers, and dry matter, indicating an important role of N in vegetative growth. According to Figure 2, there are differences in the amount of precipitation and their distribution during the growing period of maize, with 2018 and 2020 being higher in precipitation for the period June-September. The authors [85,86] point out that environmental variables, such as air temperature, total precipitation, insolation, and soil properties, significantly influence plant parameters and crop performance prediction using ANN models.
The main limitations of this and similar studies are that, although each of the analyzed treatments (factors) in ANN models has a specific role in the growth and development of plants, complex interactions among them often make it difficult to understand the separate actions of individual factors. Moreover, it is almost impossible to fully assess the individual effects of input parameters on the final performance of plants and crops. This is particularly pronounced in field conditions, where crop performance is subjected to a very complex environment, with sudden variations in climatic parameters such as temperature, precipitation, relative air humidity, etc. In addition, statistical models are often criticized for failing to provide a scientific understanding of the processes being studied.

5. Conclusions

This study indicates that empirical artificial neural network models could be successfully utilized to predict plant-examined parameters. The prediction of those variables using parameters such as cover crops, way of using cover crops, N fertilization, and year showed high accuracy in estimating with the artificial neural network model. The obtained models provided a good fit to experimental data and were adequate to predict the output variables successfully, showing a reasonably good predictive capability (overall R2 for plant height, number of leaves, number of internodes, plant density, number of ears, grain yield, 1000-grain weight, hectolitre weight, dry matter harvest residue, harvest index, leaf percentage, stem percentage, and ear percentage were 0.791; 0.791; 0.878; 0.960; 0.818; 0.700; 0.843; 0.691, accordingly). The computed maximums of plant height were 232.3 cm, number of leaves 9.7, number of internodes 10.2, plant density 54,340 plant ha−1, number of ears 0.9, grain yield 9.8 t ha−1, 1000-grain weight 272.4 g, hectolitre weight 67.0 kg HL−1, dry matter harvest residue 9.2 t ha−1, harvest index 0.52, percentage of leaf 18.9%, stem 36%, and ear 45.1%, respectively. Our study implies that subsequent maize production in rainfed conditions can be performed with winter pea cover crops used for green manure, supplementary nitrogen addition of 50 kg ha−1, and under a rainfall amount of >330 mm (June-September). The developed mathematical models give satisfactory accuracy for potential practical application in maize production and enable the proper selection of cropping management for the farmers. Given the scope of this work, it would be essential to suggest cover crops as necessary agroecological measures that would amplify the positive outcomes of other field management practices in field crop production.

Author Contributions

B.V. and G.J.; conceptualization, methodology, investigation, writing—original draft preparation, writing—reviewing and editing; S.Š.; supervision, validation; L.P.; conceptualization, data curation, visualization, writing—reviewing and editing; B.L.; conceptualization, data curation, visualization, writing—original draft preparation; Đ.K.; supervision, methodology, validation; S.V.; investigation, writing—reviewing and editing; B.Ć.; project administration, supervision, writing—reviewing. All authors have read and agreed to the published version of the manuscript.

Funding

This research was funded by the Ministry of Education, Science and Technological Development of the Republic of Serbia, grant number 451-03-68/2022-14/200117; Provincial Secretariat for Higher Education and Scientific Research of the Autonomous Province of Vojvodina, Republic of Serbia, grant number 142-451-2551/2021-01/2.

Institutional Review Board Statement

Not applicable.

Informed Consent Statement

Not applicable.

Data Availability Statement

Not applicable.

Acknowledgments

Sincere gratitude to the Institute of Field and Vegetable Crops, Novi Sad for technical, and logistical support in conducting the experiment.

Conflicts of Interest

The authors declare no conflict of interest.

References

  1. Foley, A.; Ramankutty, N.; Brauman, A.; Cassidy, S.; Gerber, S.; Johnston, M.; Mueller, N.D.; O’Connell, C.; Ray, D.K.; West, P.C.; et al. Solutions for a cultivated planet. Nature 2011, 478, 337–342. [Google Scholar] [CrossRef] [PubMed] [Green Version]
  2. Wittwer, A.; Dorn, B.; Jossi, W.; van der Heijden, M.G. Cover crops support ecological intensification of arable cropping systems. Sci. Rep. 2017, 7, 41911. [Google Scholar] [CrossRef] [Green Version]
  3. Obalum, S.E.; Chibuike, G.U.; Peth, S.; Ouyang, Y. Soil organic matter as sole indicator of soil degradation. Environ. Monit. Assess. 2017, 189, 176. [Google Scholar] [CrossRef] [PubMed]
  4. Schrama, M.; De Haan, J.J.; Kroonen, M.; Verstegen, H.; Van der Putten, W.H. Crop yield gap and stability in organic and conventional farming systems. Agric. Ecosyst. Environ. 2018, 256, 123–130. [Google Scholar] [CrossRef]
  5. Ličina, V.; Nešić, L.; Belić, M.; Hadžić, V.; Sekulić, P.; Vasin, J.; Ninkov, J. The soils of Serbia and their degradation. Ratar. I Povrt. Field Veg. Crops Res. 2011, 48, 285–290. [Google Scholar] [CrossRef]
  6. Šeremešić, S.; Ćirić, V.; Milošev, D.; Vasin, J.; Djalovic, I. Changes in soil carbon stock under the wheat-based cropping systems at Vojvodina province of Serbia. Arch. Agron. Soil Sci. 2017, 63, 388–402. [Google Scholar] [CrossRef]
  7. Grujić, G.; Vasin, J.; Belić, M. Soil salinisation in Vojvodina-the Republic of Serbia. Curr. Opin. Environ. Sustain. 2021, 50, 149–158. [Google Scholar] [CrossRef]
  8. Ćupina, B.; Manojlović, M.; Krstić, D.; Čabilovski, R.; Mikić, A.; Ignjatović-Ćupina, A.; Erić, P. Effect of winter cover crops on the dynamics of soil mineral nitrogen and yield and quality of Sudan grass (Sorghum bicolor (L.) Moench). Aust. J. Crop Sci. 2011, 5, 839–845. [Google Scholar]
  9. Ćupina, B.; Erić, P.; Mihailović, V.M.; Mikić, A.M. The importance and role of cover crops in sustainable agriculture. Zb. Rad. Inst. Za Ratar. I Povrt. 2004, 40, 419–430. [Google Scholar]
  10. Blanco-Canqui, H. Cover crops and water quality. Agron. J. 2018, 110, 1633–1647. [Google Scholar] [CrossRef]
  11. Ruffo, M.; Bullock, D.; Bollero, G. Soybean yield as affected by biomass and nitrogen uptake of cereal rye in winter cover crop rotations. Agron. J. 2004, 96, 800–805. [Google Scholar] [CrossRef]
  12. Clark, A. Managing Cover Crops Profitably; DIANE Publishing: Collingdale, PA, USA, 2008. [Google Scholar]
  13. Blanco-Canqui, H.; Shaver, M.; Lindquist, L.; Shapiro, A.; Elmore, W.; Francis, A.; Hergert, W. Cover crops and ecosystem services: Insights from studies in temperate soils. Agron. J. 2015, 107, 2449–2474. [Google Scholar] [CrossRef]
  14. Yang, H.; Niu, J.; Tao, J.; Gu, Y.; Zhang, C.; She, S.; Yin, H. The Impacts of Different Green Manure on Soil Microbial Communities and Crop Health. Preprints 2016. [Google Scholar] [CrossRef] [Green Version]
  15. Marcillo, G.; Miguez, F. Corn yield response to winter cover crops: An updated meta-analysis. J. Soil Water Conserv. 2017, 72, 226–239. [Google Scholar] [CrossRef] [Green Version]
  16. Klonsky, K. Comparison of production costs and resource use for organic and conventional production systems. Am. J. Agric. Econ. 2012, 94, 314–321. [Google Scholar] [CrossRef] [Green Version]
  17. Bedoussac, L.; Journet, E.P.; Hauggaard-Nielsen, H.; Naudin, C.; Corre-Hellou, G.; Jensen, E.S.; Justes, E. Ecological principles underlying the increase of productivity achieved by cereal-grain legume intercrops in organic farming. A review. Agron. Sustain. Dev. 2015, 35, 911–935. [Google Scholar] [CrossRef]
  18. Blesh, J. Functional traits in cover crop mixtures: Biological nitrogen fixation and multifunctionality. J. Appl. Ecol. 2018, 55, 38–48. [Google Scholar] [CrossRef] [Green Version]
  19. Gabriel, J.L.; Munoz-Carpena, R.; Quemada, M. The role of cover cropsin irrigated systems: Water balance, nitrate leaching and soil mineral nitrogen accumulation. Agric. Ecosyst. Environ. 2012, 155, 50–61. [Google Scholar] [CrossRef] [Green Version]
  20. Shah, S.; Hookway, S.; Pullen, H.; Clarke, T.; Wilkinson, S.; Reeve, V.; Fletcher, J. The role of cover crops in reducing nitrate leaching and increasing soil organic matter. Asp. Appl. Biol. 2017, 134, 243–251. [Google Scholar]
  21. Kaspar, C.; Radke, K.; Laflen, M. Small grain cover crops and wheel traffic effects on infiltration, runoff, and erosion. J. Soil Water Conserv. 2001, 56, 160–164. [Google Scholar]
  22. Mazzoncini, M.; Sapkota, B.; Barberi, P.; Antichi, D.; Risaliti, R. Long-term effect of tillage, nitrogen fertilization and cover crops on soil organic carbon and total nitrogen content. Soil Tillage Res. 2011, 114, 165–174. [Google Scholar] [CrossRef]
  23. McDaniel, D.; Tiemann, K.; Grandy, S. Does agricultural crop diversity enhance soil microbial biomass and organic matter dynamics? A meta-analysis. Ecol. Appl. 2014, 24, 560–570. [Google Scholar] [CrossRef] [Green Version]
  24. Blanco-Canqui, H.; Jasa, P.J. Do grass and legume cover crops improve soil properties in the long term? Soil Sci. Soc. Am. J. 2019, 83, 1181–1187. [Google Scholar] [CrossRef]
  25. Lehman, M.; Ducey, T.; Jin, V.; Acosta-Martinez, V.; Ahlschwede, C.; Jeske, E.; Drijber, R.A.; Cantrell, K.B.; Frederick, J.R.; Fink, D.; et al. Soil microbial community response to corn stover harvesting under rain-fed, no-till conditions at multiple US locations. BioEnergy Res. 2014, 7, 540–550. [Google Scholar] [CrossRef]
  26. Golawski, A.; Kasprzykowski, Z.; Jobda, M.; Duer, I. The importance of winter catch crops compared with other farmland habitats to birds wintering in Poland. Pol. J. Ecol. 2013, 61, 357–364. [Google Scholar]
  27. Ugrenović, V.; Filipović, V. Cover crops: Achievement of sustainability in the ecological systems of agriculture. In Sustainable Entrepreneurship and Investments in the Green Economy; Vasile, A.J., Nicolò, D., Eds.; IGI Global: Hershey, PA, USA, 2017; pp. 257–281. [Google Scholar]
  28. Daničić, M.; Pejić, B.; Mačkić, K.; Lalić, B.; Maksimović, I.; Putnik-Delić, M. The predicted impact of climate change on maize production in Northern Serbia. Maydica 2020, 65, 1–10. Available online: https://journals-crea.4science.it/index.php/maydica/article/view/2218 (accessed on 29 September 2021).
  29. Nielsen, D.C.; Lyon, D.J.; Hergert, G.W.; Higgins, R.K.; Calderón, F.J.; Vigil, M.F. Cover crop mixtures do not use water differently than single-species plantings. Agron. J. 2015, 107, 1025–1038. [Google Scholar] [CrossRef]
  30. Ćupina, B.; Vujić, S.; Krstić, Đ.; Djurić, B.; Aliu, S.; Manojlović, M.; Čabilovski, R.; Lombnaes, P. Performance of legume–grass mixtures in the West Balkan region. Acta Agric. Scand. Sect. B—Soil Plant Sci. 2017, 67, 1–11. [Google Scholar] [CrossRef]
  31. Ketterings, Q.M.; Swink, S.N.; Duiker, S.W.; Czymmek, K.J.; Beegle, D.B.; Cox, W.J. Integrating cover crops for nitrogen management in corn systems on northeastern US dairies. Agron. J. 2015, 107, 1365–1376. [Google Scholar] [CrossRef] [Green Version]
  32. Ćupina, B.; Vujić, S.; Krstić, D.; Radanović, Z.; Čabilovski, R.; Manojlović, M.; Latković, D. Winter cover crops as green manure in a temperate region: The effect on nitrogen budget and yield of silage maize. Crop Pasture Sci. 2017, 68, 1060–1069. [Google Scholar] [CrossRef] [Green Version]
  33. Florentín, A.; Peñalva, M.; Calegari, A.; Derpsch, R. Green manure/cover crops and crop rotation in conservation agriculture on small farms. In Integrated Crop Management; Food and Agriculture Organization: Rome, Italy, 2011; Volume 12-2010, pp. 1–97. Available online: http://www.fao.org/fileadmin/user_upload/agp/icm12.pdf (accessed on 26 May 2021).
  34. Baddeley, J.A.; Pappa, V.A.; Pristeri, A.; Bergkvist, G.; Monti, M.; Reckling, M.; Schläfke, N.; Watson, C.A. Legume-based green manure crops. In Legumes in Cropping Systems; Murphy-Bokern, D., Stoddard, F.L., Watson, C.A., Eds.; CABI International: Wallingford, UK, 2017; pp. 125–138. [Google Scholar] [CrossRef]
  35. Thorup-Kristensen, K.; Magid, J.; Jensen, L.S. Catch crops and green manures as biological tools in nitrogen management in temperate zones. Adv. Agron. 2003, 79, 227–302. [Google Scholar]
  36. Diekow, J.; Mielniczuk, J.; Knicker, H.; Bayer, C.; Dick, D.P.; Kogel-Knabner, I. Soil C and N stocks as affected by cropping systems and nitrogen fertilization in a Southern Brazil Acrisol managed under no-tillage for 17 years. Soil Tillage Res. 2005, 81, 87–95. [Google Scholar] [CrossRef]
  37. Kramberger, B.; Gselman, A.; Janzekovic, M.; Kaligaric, M.; Bracko, B. Effects of cover crops on soil mineral nitrogen and on the yield and nitrogen content of maize. Eur. J. Agron. 2009, 31, 103–109. [Google Scholar] [CrossRef]
  38. Vojnov, B.; Ćupina, B.; Krstić, D.; Vujić, S.; Babec, B.; Vasiljević, S.; Šeremešić, S. Doprinos međuuseva poboljšanju kvaliteta zemljišta u sistemima organske poljoprivrede. Ann. Agron. 2020, 44, 1–10. [Google Scholar]
  39. Voća, N.; Pezo, L.; Peter, A.; Šuput, D.; Loncar, B.; Kricka, T. Modelling of corn kernel pre-treatment, drying and processing for ethanol production using artificial neural networks. Ind. Crops Prod. 2021, 162, 113293. [Google Scholar] [CrossRef]
  40. Zhang, C.; Di, L.; Hao, P.; Yang, Z.; Lin, L.; Zhao, H.; Guo, L. Rapid in-season mapping of corn and soybeans using machine-learned trusted pixels from Cropland Data Layer. Int. J. Appl. Earth Obs. 2021, 102, 102374. [Google Scholar] [CrossRef]
  41. Javanmardi, S.; Ashtiani, S.H.M.; Verbeek, F.J.; Martynenko, A. Computer-vision classification of corn seed varieties using deep convolutional neural network. J. Stored Prod. Res. 2021, 92, 101800. [Google Scholar] [CrossRef]
  42. Zhang, J.J.; Ma, Q.; Cui, X.; Guo, H.; Wang, K.; Zhu, D.H. High-throughput corn ear screening method based on two-pathway convolutional neural network. Comput. Electron. Agric. 2020, 175, 105525. [Google Scholar] [CrossRef]
  43. Chouaibi, M.; Daoued, K.B.; Riguane, K.; Rouissi, T.; Ferrari, G. Production of bioethanol from pumpkin peel wastes: Comparison between response surface methodology (RSM) and artificial neural networks (ANN). Ind. Crops Prod. 2020, 155, 112822. [Google Scholar] [CrossRef]
  44. Silitonga, A.S.; Mahlia, T.M.I.; Shamsuddin, A.H.; Ong, H.C.; Milano, J.; Kusumo, F.; Sebayang, A.H.; Dharma, S.; Ibrahim, H.; Husin, H.; et al. Optimization of Cerbera manghas biodiesel production using artificial neural networks integrated with ant colony optimization. Energies 2019, 12, 3811. [Google Scholar] [CrossRef] [Green Version]
  45. Kojić, J.S.; Ilić, N.M.; Kojić, P.S.; Pezo, L.L.; Banjac, V.V.; Krulj, J.A.; Solarov, M.I.B. Multiobjective process optimization for betaine enriched spelt flour based extrudates. J. Food Process Eng. 2018, 42, e12942. [Google Scholar] [CrossRef] [Green Version]
  46. Silitonga, A.S.; Masjuki, H.H.; Ong, H.C.; Sebayang, A.H.; Dharma, S.; Kusumo, F.; Siswantoro, J.; Milano, J.; Daud, K.; Mahlia, T.M.I.; et al. Evaluation of the engine performance and exhaust emissions of biodiesel-bioethanol-diesel blends using kernel-based extreme learning machine. Energy 2018, 159, 1075–1087. [Google Scholar] [CrossRef]
  47. Simakov, V.N.; Tsyplenkov, V.P. Procedures for the simultaneous determination of carbon, nitrogen, and oxidation degree in soil. Agrokhimiya 1969, 6, 127–134. [Google Scholar]
  48. Bremner, J.M. Nitrogen availability indexes. In Methods of Soil Analysis. Part 2.; Black, C.A., Ed.; American Society of Agronomy: Madison, WI, USA, 1965; pp. 1324–1345. [Google Scholar]
  49. Enger, H.; Riehm, H.; Domingo, W.R. Untersuchungen über die shemische bodenanalyse als grundlage für die beurteilung des nährstoffzustandes der böden. II Chemische extrationsmethoden zur phosphur- und kaliumbestimmung. Kungl. Lantbr. Högsk. Ann. 1960, 26, 199–215. [Google Scholar]
  50. Bakhshipour, A.; Zare, D. A generalized artificial neural network model for deep-bed drying of paddy. Agric. Eng. 2017, 20, 05. [Google Scholar] [CrossRef]
  51. Hosseinizand, H.; Sokhansanj, S.; Lim, C.J. Studying the drying mechanism of microalgae Chlorella vulgaris and the optimum drying temperature to preserve quality characteristics. Dry. Technol. 2018, 36, 1049–1060. [Google Scholar] [CrossRef]
  52. Oliveira, S.M.; Brandão, T.R.S.; Silva, C.L.M. Influence of drying processes and pretreatments on nutritional and bioactive characteristics of dried vegetables: A review. Food Eng. Rev. 2016, 8, 134–163. [Google Scholar] [CrossRef]
  53. Turanyi, T.; Tomlin, A.S. Analysis of Kinetics Reaction Mechanisms; Springer: Berlin/Heidelberg, Germany, 2014. [Google Scholar]
  54. Pezo, L.; Curcic, B.; Filipovic, V.; Nicetin, M.; Koprivica, G.; Misljenovic, N.; Levic, L. Artificial neural network model of pork meat cubes osmotic dehydration. Hem. Ind. 2013, 67, 465–475. [Google Scholar] [CrossRef]
  55. Helgadóttir, Á.; Suter, M.; Gylfadóttir, T.Ó.; Kristjánsdóttir, T.A.; Lüscher, A. Grass–legume mixtures sustain strong yield advantage over monocultures under cool maritime growing conditions over a period of 5 years. Ann. Bot. 2018, 122, 337–348. [Google Scholar] [CrossRef]
  56. Anwar, Z.; Gulfraz, M.; Irshad, M. Agro-industrial lignocellulosic biomass a key to unlock the future bio-energy: A brief review. J. Radiat. Res. Appl. Sci. 2014, 7, 163–173. [Google Scholar] [CrossRef]
  57. Dakanalis, A.; Carrà, G.; Calogero, R.; Fida, R.; Clerici, M.; Zanetti, M.A.; Riva, G. The developmental effects of media-ideal internalization and self-objectification processes on adolescents’ negative body-feelings, dietary restraint, and binge eating. Eur. Child Adolesc. Psychiatry 2015, 24, 997–1010. [Google Scholar] [CrossRef] [PubMed]
  58. Adiredjo, A.L.; Navaud, O.; Muños, S.; Langlade, N.B.; Lamaze, T.; Grieu, P. Genetic control of water use efficiency and leaf carbon isotope discrimination in sunflower (Helianthus annuus L.) subjected to two drought scenarios. PLoS ONE 2014, 9, e101218. [Google Scholar] [CrossRef] [PubMed] [Green Version]
  59. Kollo, T.; Von Rosen, D. Advanced Multivariate Statistics with Matrices; Springer: Dordrecht, The Netherlands, 2005. [Google Scholar]
  60. Trelea, I.C.; Raoult-Wack, A.L.; Trystram, G. Application of neural network modelling for the control of dewatering and impregnation soaking process (osmotic dehydration). Food Sci. Technol. Int. 1997, 3, 459–465. [Google Scholar] [CrossRef]
  61. Mohieddin, J.; Yinyin, W.; Ali, A.; Jing, T. Unsupervised Learning and Multipartite Network Models: A Promising Approach for Understanding Traditional Medicine. Front. Pharmacol. 2020, 11, 1319. [Google Scholar] [CrossRef]
  62. Basheer, I.A.; Hajmeer, M. Artificial neural networks: Fundamentals, computing, design, and application. J. Microbiol. Meth. 2000, 43, 3–31. [Google Scholar] [CrossRef]
  63. Yoon, Y.; Swales, G.; Margavio, T.M. A Comparison of Discriminant Analysis versus Artificial Neural Networks. J. Oper. Res. Soc. 2017, 44, 51–60. [Google Scholar] [CrossRef]
  64. Arsenovic, M.; Pezo, L.; Stankovic, S.; Radojevic, Z. Factor space differentiation of brick clays according to mineral content: Prediction of final brick product quality. Appl. Clay Sci. 2015, 115, 108–114. [Google Scholar] [CrossRef]
  65. Goldberg, D.E. Genetic Algorithms in Search, Optimization and Machine Learning, 1st ed.; Addison-Wesley Longman Publishing Co., Inc.: Boston, MA, USA, 1989. [Google Scholar]
  66. Wang, S.; Chen, G.; Yang, Y.; Zeng, Z.; Hu, Y.; Zang, H. Sowing ratio determines forage yields and economic benefits of oat and common vetch intercropping. Agron. J. 2021, 113, 2607–2617. [Google Scholar] [CrossRef]
  67. Thapa, R.; Poffenbarger, H.; Tully, K.L.; Ackroyd, V.J.; Kramer, M.; Mirsky, S.B. Biomass production and nitrogen accumulation by hairy vetch–cereal rye mixtures: A meta-analysis. Agron. J. 2018, 110, 1197–1208. [Google Scholar] [CrossRef]
  68. Haruna, S.I.; Anderson, S.H.; Udawatta, R.P.; Gantzer, C.J.; Phillips, N.C.; Cui, S.; Gao, Y. 2020. Improving soil physical properties through the use of cover crops: A review. Agrosystems Geosci. Environ. 2020, 3, e20105. [Google Scholar] [CrossRef]
  69. Chen, G.; Weil, R.R. Root growth and yield of maize as affected by soil compaction and cover crops. Soil Tillage Res. 2011, 117, 17–27. [Google Scholar] [CrossRef]
  70. Mahama, G.Y.; Prasad, P.V.; Roozeboom, K.L.; Nippert, J.B.; Rice, C.W. Response of maize to cover crops, fertilizer nitrogen rates, and economic return. Agron. J. 2016, 108, 17–31. [Google Scholar] [CrossRef] [Green Version]
  71. Meyer, N.; Bergez, J.E.; Justes, E.; Constantin, J. Influence of cover crop on water and nitrogen balances and cash crop yield in a temperate climate: A modelling approach using the STICS soil-crop model. Eur. J. Agron. 2022, 132, 126416. [Google Scholar] [CrossRef]
  72. Khoshnevisan, B.; Rafiee, S.; Omid, M.; Mousazadeh, H. Development of an intelligent system based on ANFIS for predicting wheat grain yield on the basis of energy inputs. Inf. Process. Agric. 2014, 1, 14–22. [Google Scholar] [CrossRef] [Green Version]
  73. Krulj, J.; Markov, S.; Bočarov-Stančić, A.; Pezo, L.; Kojić, J.; Ćurčić, N.; Janić-Hajnal, E.; Bodroža-Solarov, M. The effect of storage temperature and water activity on aflatoxin B1 accumulation in hull-less and hulled spelt grains. J. Sci. Food Agric. 2019, 99, 3703–3710. [Google Scholar] [CrossRef] [PubMed]
  74. Rupp, D.E.; Schmidt, J.; Woods, R.A.; Bidwell, V.J. Analytical assessment and parameter estimation of a low-dimensional groundwater model. J. Hydrol. 2009, 377, 143–154. [Google Scholar] [CrossRef]
  75. Šovljanski, O.; Tomić, A.; Pezo, L.; Ranitović, A.; Markov, S. Prediction of denitrification capacity of alkalotolerant bacterial isolates from soil—An artificial neural network model. J. Serb. Chem. Soc. 2020, 85, 1417–1427. [Google Scholar] [CrossRef]
  76. Krstić, Đ.; Vujić, S.; Jaćimović, G.; D’Ottavio, P.; Radanović, Z.; Erić, P.; Ćupina, B. The effect of cover crops on soil water balance in rain-fed conditions. Atmosphere 2018, 9, 492. [Google Scholar] [CrossRef] [Green Version]
  77. Li, J.; Xie, R.Z.; Wang, K.R.; Ming, B.; Guo, Y.Q.; Zhang, G.Q.; Li, S.K. Variations in maize dry matter, harvest index, and grain yield with plant density. Agron. J. 2015, 107, 829–834. [Google Scholar] [CrossRef]
  78. Assefa, Y.; Carter, P.; Hinds, M.; Bhalla, G.; Schon, R.; Jeschke, M.; Paszkiewicz, S.; Smith, S.; Ciampitti, I.A. Analysis of long term study indicates both agronomic optimal plant density and increase maize yield per plant contributed to yield gain. Sci. Rep. 2018, 8, 4937. [Google Scholar] [CrossRef] [Green Version]
  79. Bekavac, G.; Purar, B.; Jocković, Đ.; Stojaković, M.; Ivanović, M.; Malidža, G.; Đalović, I. Proizvodnja kukuruza u uslovima globalnih klimatskih promena. Ratar. I Povrt. 2010, 47, 443–450. [Google Scholar]
  80. Vujić, S.; Krstić, D.; Mačkić, K.; Čabilovski, R.; Radanović, Z.; Zhan, A.; Ćupina, B. Effect of winter cover crops on water soil storage, total forage production, and quality of silage corn. Eur. J. Agron. 2021, 130, 126366. [Google Scholar] [CrossRef]
  81. Rosa, A.T.; Creech, C.F.; Elmore, R.W.; Rudnick, D.R.; Lindquist, J.L.; Fudoling, M.; Butts, L.; Werle, R. Implications of cover crop planting and termination timing on rainfed maize production in semi-arid cropping systems. Field Crops Res. 2021, 271, 108251. [Google Scholar] [CrossRef]
  82. Hunter, M.C.; Kemanian, A.R.; Mortensen, D.A. Cover crop effects on maize drought stress and yield. Agric. Ecosyst. Environ. 2021, 311, 107294. [Google Scholar] [CrossRef]
  83. Rosa, A.T.; Creech, C.F.; Elmore, R.W.; Rudnick, D.R.; Lindquist, J.L.; Fudoling, M.; Butts, L.; Werle, R. Contributions of individual cover crop species to rainfed maize production in semi-arid cropping systems. Field Crops Res. 2021, 271, 108245. [Google Scholar] [CrossRef]
  84. Wittwer, R.A.; van der Heijden, M.G. Cover crops as a tool to reduce reliance on intensive tillage and nitrogen fertilization in conventional arable cropping systems. Field Crops Res. 2020, 249, 107736. [Google Scholar] [CrossRef]
  85. Shankar, T.; Malik, G.C.; Banerjee, M.; Dutta, S.; Praharaj, S.; Lalichetti, S.; Mohanty, S.; Bhattacharyay, D.; Maitra, S.; Gaber, A.; et al. Prediction of the Effect of Nutrients on Plant Parameters of Rice by Artificial Neural Network. Agronomy 2022, 12, 2123. [Google Scholar] [CrossRef]
  86. Hara, P.; Piekutowska, M.; Niedbała, G. Selection of independent variables for crop yield prediction using artificial neural network models with remote sensing data. Land 2021, 10, 609. [Google Scholar] [CrossRef]
Figure 1. Location of the trail and experimental design showing the main analyzed factors: cover crops (CC) type and way of using CC (PT: winter pea + triticale, for green manure and for forage; P: winter pea as a sole crop, for green manure, and for forage; Ø: control treatment-without CC), and N fertilization treatments (N50: with N fertilizer of 50 kg ha−1, NØ: without N fertilizer application).
Agronomy 12 02670 g001
Figure 2. Long-term average (LTA) and total monthly precipitation (P) and average monthly air temperature (T) for hydrological years (A) 2016−2017, (B) 2017−2018, (C) 2018−2019, and (D) 2019−2020. Bars and left y−axis represent precipitation, and right y−axis and lines represent temperature data.
Agronomy 12 02670 g002
Figure 3. Dry matter yield of different type of CC−winter pea + Triticale (PT) and winter pea (P). Vertical bars on columns represent standard error (SE) of the mean.
Agronomy 12 02670 g003
Figure 4. Comparison of experimentally obtained values of (a) H, (b) NL, (c) NI, (d) PD, (e) NE, and (f) GY, with ANN predicted values.
Agronomy 12 02670 g004
Figure 5. Comparison of experimentally obtained values of (a) TGW, (b) HW, (c) DMHR, (d) HI, (e) L, (f) S, and (g) E, with ANN predicted values.
Agronomy 12 02670 g005
Figure 6. The relative influence (%) of CC, WUCC, NF and YEAR on (a) H, (b) NL, (c) NI, (d) PD, (e) NE, and (f) GY, determined using Yoon’s interpretation method.
Agronomy 12 02670 g006
Figure 7. The relative influence (%) of CC, WUCC, NF, and YEAR on (a) TGW, (b) HW, (c) DMHR, (d) HI, (e) L, (f) S, and (g) E, determined using Yoon’s interpretation method.
Agronomy 12 02670 g007
Table 1. Time of field operations during the season 2016–17, 2017–18, 2018–19, and 2019–20.
Field/Year2016–172017–182018–192019–20
Cover CropsCover Crop Seeding Rates (kg ha−1)
Winter Pea120
Winter Pea + Triticale90 + 30
Field OperationDate
Cover crop sowing28 October8 November7 November15 November
Cover crops plowing5 May18 May22 May18 May
Maize sowing1 June15 June11 June25 May
Fertilization (Urea, 46%)15 June1 July25 June10 June
Maize harvest26 October18 October23 October16 October
Soil sampling29 October20 October25 October20 October
Table 2. Average soil chemical characteristics of experimental site after maize crop harvest.
YearpH
(KCl)
pH
(H2O)
CaCO3
(%)
Humus
(%)
N
(%)
(mg 100 g−1 of Soil)
P2O5K2O
2016 *7.21 ± 0.107.95 ± 0.148.57 ± 0.192.61 ± 0.190.13 ± 0.0116.65 ± 3.0420.31 ± 2.01
20177.48 ± 0.068.14 ± 0.078.96 ± 1.422.59 ± 0.080.19 ± 0.0117.13 ± 1.0523.67 ± 0.52
20187.43 ± 0.108.11 ± 0.068.68 ± 2.642.53 ± 0.150.19 ± 0.0118.41 ± 3.0323.43 ± 2.21
20197.23 ± 0.038.12 ± 0.059.48 ± 2.012.69 ± 0.190.20 ± 0.0114.54 ± 1.9523.21 ± 2.05
20207.33 ± 0.058.21 ± 0.059.11 ± 1.732.54 ± 0.130.18 ± 0.0114.62 ± 1.8823.02 ± 1.53
* 2016 was taken as initial soli properties before experimental setup. The data in the table represent the mean ± standard deviation (SD).
Table 3. ANN models summary (performance and errors), for training, testing, and validation cycles.
VariableNetwork
Name
PerformanceErrorTraining
Algorithm
Hidden
Activation
Output
Activation
TrainingTestingValidationTrainingTestingValidation
HMLP 12-7-10.9660.9490.95341.58341.37241.244BFGS 179TanhExponential
NLMLP 12-9-10.4870.4950.4850.1240.1210.120BFGS 127LogisticIdentity
NIMLP 12-9-10.5080.5010.5020.1160.1140.112BFGS 135TanhTanh
PDMLP 12-5-10.7930.7960.808397.146395.384389.697BFGS 315TanhExponential
NEMLP 12-10-10.5080.5150.5180.0010.0010.001BFGS 139LogisticTanh
GYMLP 12-10-10.8910.9020.8900.3090.3050.301BFGS 237ExponentialExponential
TGWMLP 12-7-10.8380.8250.828168.655171.050168.741BFGS 122TanhLogistic
HWMLP 12-6-10.7130.7100.7237.3917.5167.588BFGS 248LogisticIdentity
DMHRMLP 12-7-10.8550.8540.8410.4210.4210.414BFGS 185TanhLogistic
HIMLP 12-9-10.6980.6890.6940.0010.0010.001BFGS 103TanhTanh
LMLP 12-5-10.8550.8500.8403.4893.4393.501BFGS 383LogisticTanh
SMLP 12-8-10.7730.7640.7753.2593.2143.196BFGS 129LogisticExponential
EMLP 12-10-10.6210.6280.6268.2818.3708.277BFGS 173ExponentialTanh
Table 4. The “goodness of fit” tests for the developed ANN models.
Variableχ2RMSEMPESSEAARDR2Skew.Kurt.St.Dev.Var.
H91.4199.1203.69511,975.8671075.8000.966−0.2020.9169.15183.747
NL0.2720.4973.87635.588115.6670.4860.1240.1760.4990.249
NI0.2550.4823.72933.452132.6670.5050.2690.8050.4840.234
PD8.7 × 1062.8 × 1034.6621.1 × 1098.2 × 1050.788−0.127−0.1972.8 × 1038.0 × 106
NE0.0030.0533.5290.40014.6670.5070.0750.7880.0530.003
GY0.6790.78612.65388.940184.4000.885−0.1651.7260.7890.622
TGW370.78418.3666.01548,572.7673704.6670.8350.1690.96418.430339.670
HW16.2493.8455.1552128.660607.0000.716−0.0751.0123.85814.886
DMHR0.9250.91813.658121.240105.4000.854−0.0870.6320.9210.848
HI0.0020.0406.9050.2285.2870.699−0.1990.2100.0400.002
L7.6712.6427.5171004.840197.8670.8532.36926.1492.6517.027
S7.1652.5536.873938.633287.4670.7730.0610.9592.5626.564
E18.2064.0706.4822384.947356.4670.621−1.92920.4424.08416.678
Publisher’s Note: MDPI stays neutral with regard to jurisdictional claims in published maps and institutional affiliations.

