Article

Metabolomics Analysis Reveals Potential Mechanisms in Bupleurum L. (Apiaceae) Induced by Three Levels of Nitrogen Fertilization

1
College of Chemistry, Chemical Engineering and Resource Utilization, Northeast Forestry University, Harbin 150040, China
2
Biological Science and Technology Department, Heilongjiang Vocational College for Nationalities, Harbin 150066, China
3
School of Pharmacy, Heilongjiang University of Chinese Medicine, Harbin 150040, China
4
Botany and Microbiology Department, Faculty of Science, Menoufia University, Shebeen El-Kom 32511, Egypt
*
Authors to whom correspondence should be addressed.
Agronomy 2021, 11(11), 2291; https://doi.org/10.3390/agronomy11112291
Submission received: 6 October 2021 / Revised: 8 November 2021 / Accepted: 9 November 2021 / Published: 12 November 2021

Abstract

:
Bupleurum (Apiaceae) is widely used in traditional Chinese medicine to treat inflammatory and infectious diseases. Although roots are the only used parts in China, other countries use the whole plant. The yield and quality of Bupleurum depend mainly on fertilizers, especially nitrogen. The current study aimed to assess the relationship between the nitrogen fertilization level and the quality and metabolomic response of different parts (flowers, main shoots, lateral shoots and roots) of Bupleurum to three nitrogen fertilization levels (control group: 0 kg·ha−1; low-nitrogen group: 55 kg·ha−1; high-nitrogen group: 110 kg·ha−1). The results showed that a high nitrogen level increases Bupleurum yield and quality parameters only in aerial parts, especially flowers, but has no significant effect on roots. The HPLC method was exploited for simultaneous quantification of three saikosaponins (A, C and D), which are the main bioactive components in the plant. It was found that the total content of saikosaponins decreased with high nitrogen fertilization in roots but significantly increased in flowers. Moreover, nitrogen fertilizer promoted the content of saikosaponin A but inhibited saikosaponins C and saikosaponins D in most parts of the plant. To study the response of primary metabolites, we adopted gas chromatography–mass spectrometry (GC−MS) analysis; 84 metabolites were identified that were mostly up-regulated with a high nitrogen level in flowers but down-regulated in roots. Four differential metabolites—D-fructose, lactose, ether and glycerol—were recognized as key metabolites in Bupleurum under nitrogen fertilization. Meanwhile, The Kyoto Encyclopedia of Genes and Genomes (KEGG) enrichment results explained that the impact of nitrogen fertilization on Bupleurum was attributed to the C-metabolism, N-metabolism, and lipids metabolism. This research put forward new insights into potential mechanisms and the relationship between the quality and yield of Bupleurum and nitrogen fertilization.

1. Introduction

Among the essential plant nutrients, nitrogen (N), phosphorus (P) and potassium (K) are considered indispensable macronutrients for plant growth, development, and yield; thus, they play vital roles in many aspects of plant metabolism [1]. Nitrogen is the most important nutrient element for plant growth, physiology and the regulation of carbohydrates. It is a constituent of proteins, chlorophyll, alkaloids and amino acids [2]. In modern agriculture, nitrogen fertilizer is largely used to improve quality, increase yield and nourish plants. With the help of cell division, nitrogen fertilizer facilitates plant growth, protein percent, sucrose content and growth rate in sweet sorghum [3]. So far, lots of research has been done on the absorption, assimilation and uptake of nitrogen fertilizer and its influence on plant development [4,5]. Therefore, proper nitrogen supplies are imperative to enhance yield and quality, as well as to promote plant viability under biotic [6] and abiotic stresses [7]. However, excessive application of fertilizer may disturb the nutrient balance, reduce the efficiency of fertilizer utilization and result in environmental pollution [8,9]. The quality and development of Bupleurum are restricted by nutritional requirements—too little or too many nutrients may restrain the growth and development. Furthermore, it is imperative to investigate the effect of nitrogen application on the metabolism of Bupleurum to guarantee the quality and yield.
Bupleurum L. is one of the largest genera in the Apiaceae family, with about 200 species all over the world. Forty-two species, including 20 endemics [10], are recorded in the flora of China. The dried roots of Bupleurum scorzonerifolium Wild. and Bupleurum chinense DC. are known as Radix Bupleuri (Chaihu), which is formally included in the Chinese Pharmacopoeia [11]. As traditional Chinese medicine, roots have great therapeutic effects on the treatment of common coughs, fevers and influenza hepatitis, malaria, menoxenia and so on [12,13,14]. Bupleurum L. are annual or perennial herbs, but excessive growth of Bupleurum extremely reduces the root biomass accumulation and secondary metabolite biosynthesis [15]. The biomasses of the aboveground part of Bupleurum account for about 38.1% of the whole plant, while the roots could not account for 20% [16]. Therefore, the aboveground parts of Bupleurum are used as anti-inflammatory drugs or topical antiseptics [17]; however, in the southeast area of China, all plant parts are used as medicines. To determine whether the aerial parts of Bupleurum could be used instead of roots or not, it is necessary to reveal the discrepancy in the types of metabolites among the different organs of Bupleurum.
Saikosaponins are the main active components of Bupleurum belonging to the pentacyclic triterpenoid oleanane-type compound. The biosynthesis of saikosaponins is mainly through the mevalonic acid (MVA) pathway in the cytoplasm and methylerythritol phosphate (MEP) pathway in the plastid [18]. The MVA pathway uses acetyl-CoA as the starting substrate and undergoes a six-step condensation reaction to generate IPP, and the MEP pathway uses pyruvate and glyceraldehyde 3-phosphate as the starting substrate to synthesize IPP through a seven-step reaction [19]. Among them, the MVA pathway plays a leading role in the biosynthesis of triterpene saponins [20,21,22]. These pathways in the early stages of biosynthesis provide a variety of precursors for secondary metabolites, for example, the aromatic amino acids tyrosine, tryptophan and phenylalanine. The exact link between primary metabolites and saikosaponins accumulation remains largely unknown, but it is closely related to pyruvate, acetyl-CoA and glyceraldehyde 3-phosphate. Due to the important role of Bupleurum as a medicinal compound, it is necessary to solve this problem. The regulation of saikosaponins and main compounds significantly affects the metabolic composition of the whole plant of Bupleurum.
Metabolomics have been proverbially used as a formidable method to analyze a lot of compounds from plant species, supplying a wide vision for the shoots to adjust metabolic processes [23,24]. Metabolomics include the quantitative, qualitative and dynamic research of the whole endogenous small molecules within organisms, organs, tissues and even cells under specific environmental conditions and at a specific time. Actually, many metabolomics studies have been conducted to comprehend the mechanism of a plant’s response to abiotic stress, for example, drought [25,26], salinity [27,28], heat [29], flooding [30], radiation [31,32,33], chilling [34], heavy metal toxicity [35,36] and combined multiple stresses [37,38,39]. Plant metabolomics have unique advantages in the identification and quality evaluation of Chinese medicinal materials. It can distinguish between different genes, different origins and even different growth cycles of medicinal plants [40,41]. Meanwhile, metabolomics research was conducted on biosynthetic pathways [42], signal transduction [43,44] and the ecological environment [45] of secondary metabolites of medicinal plants. This technique is gaining interest as a diagnosis tool for crop improvement and breeding [46]. Moreover, plant metabolomics integrate with genomes [47,48], transcriptomes, proteomes and other omics in order to carry out quality control and germplasm improvement of medicinal plants effectively.
In order to analyze and compare the metabolite profiles of Bupleurum dependent on nitrogen fertilizer, we performed the technique of gas chromatography–mass spectrometry (GC–MS) to compare four different organs (roots, main shoots, lateral shoots and flowers) of Bupleurum. We aimed to: (1) evaluate the effect of different levels of nitrogen fertilization on yield and quality trait parameters of above and underground parts of Bupleurum; (2) reveal the effect of low and high nitrogen treatment on the total sakosaponins content and on the percentage of three saikosaponins in the different tissues of Bupleurum; (3) elicit changes in the metabolite profiles of Bupleurum’s different tissues caused by nitrogen fertilization; (4) compare metabolic changes to explain key metabolites involved in biosynthesis regulation.

2. Results

2.1. Comparative Analysis of Quality Traits Parameters among Different Nitrogen Fertilization Groups

In this experiment, the whole Bupleurum plants, growing under three levels of nitrogen fertilization (control nitrogen group (CN), low-nitrogen group (LN) and high-nitrogen group (HN)), were divided into four parts, including flower (F), main shoot (MS), lateral shoot(LS) and root (R) (Figure 1A). Bupleurum showed different biomass accumulation under nitrogen fertilization. At the LN level, shoots were thicker, the flowers were more flourishing and roots became slightly thicker. However, at the HN level, the increase in stem thickness and flowers flourishing was more significant than that at LN. Meanwhile, no significant increase in root thickness was observed at HN (Figure 1B). Figure 1C showed that the fresh weight of aboveground (flowers, main shoots and lateral shoots) and underground (roots) tissues in Bupleurum increased with application of the LN level. However, at HN levels, no significant increase in root fresh weight was observed, while the fresh weight of aerial parts, especially flowers, was extremely increased. Although there was no obvious discrepancy between HN and LN observed in root length, the total length was significantly higher at HN supply (Figure 1D), indicating that a high level of nitrogen fertilizer plays a greater role in promoting the growth of the aerial parts than roots in Bupleurum.

2.2. Total Saikosaponins Content Accumulated in Bupleurum Different Tissues under Three Levels of Nitrogen Fertilization

Initially, this study exploited an HPLC method for the simultaneous quantification of three saikosaponins: saikosaponin A, saikosaponin C and saikosaponin D. Simultaneously, we also measured the total content of saikosaponins in different Bupleurum tissues under the three levels of nitrogen fertilization. For the different nitrogen fertilization levels, the total saikosaponins display an analogous tendency and mostly accumulated in the flowers and the roots. In addition, the LN level decreased the total saikosaponins content in flowers and roots; however, at the HN level, flowers showed a significant increase in the total saikosaponins content, while the total content in roots remained stable (Figure 2A). When the total saikosaponins content was fixed, we compared saikosaponin A, saikosaponins C and saikosaponins D. We found that the percentage of saikosaponins A was lower than that of saikosaponins C and saikosaponins D without nitrogen. Nitrogen fertilizer promoted the content of saikosaponin A, and its increment was accompanied by a decrease in saikosaponins C in aerial parts (flowers, main shoots and lateral shoots); however, it was accompanied by a decrease in saikosaponins D in roots (Figure 2B).

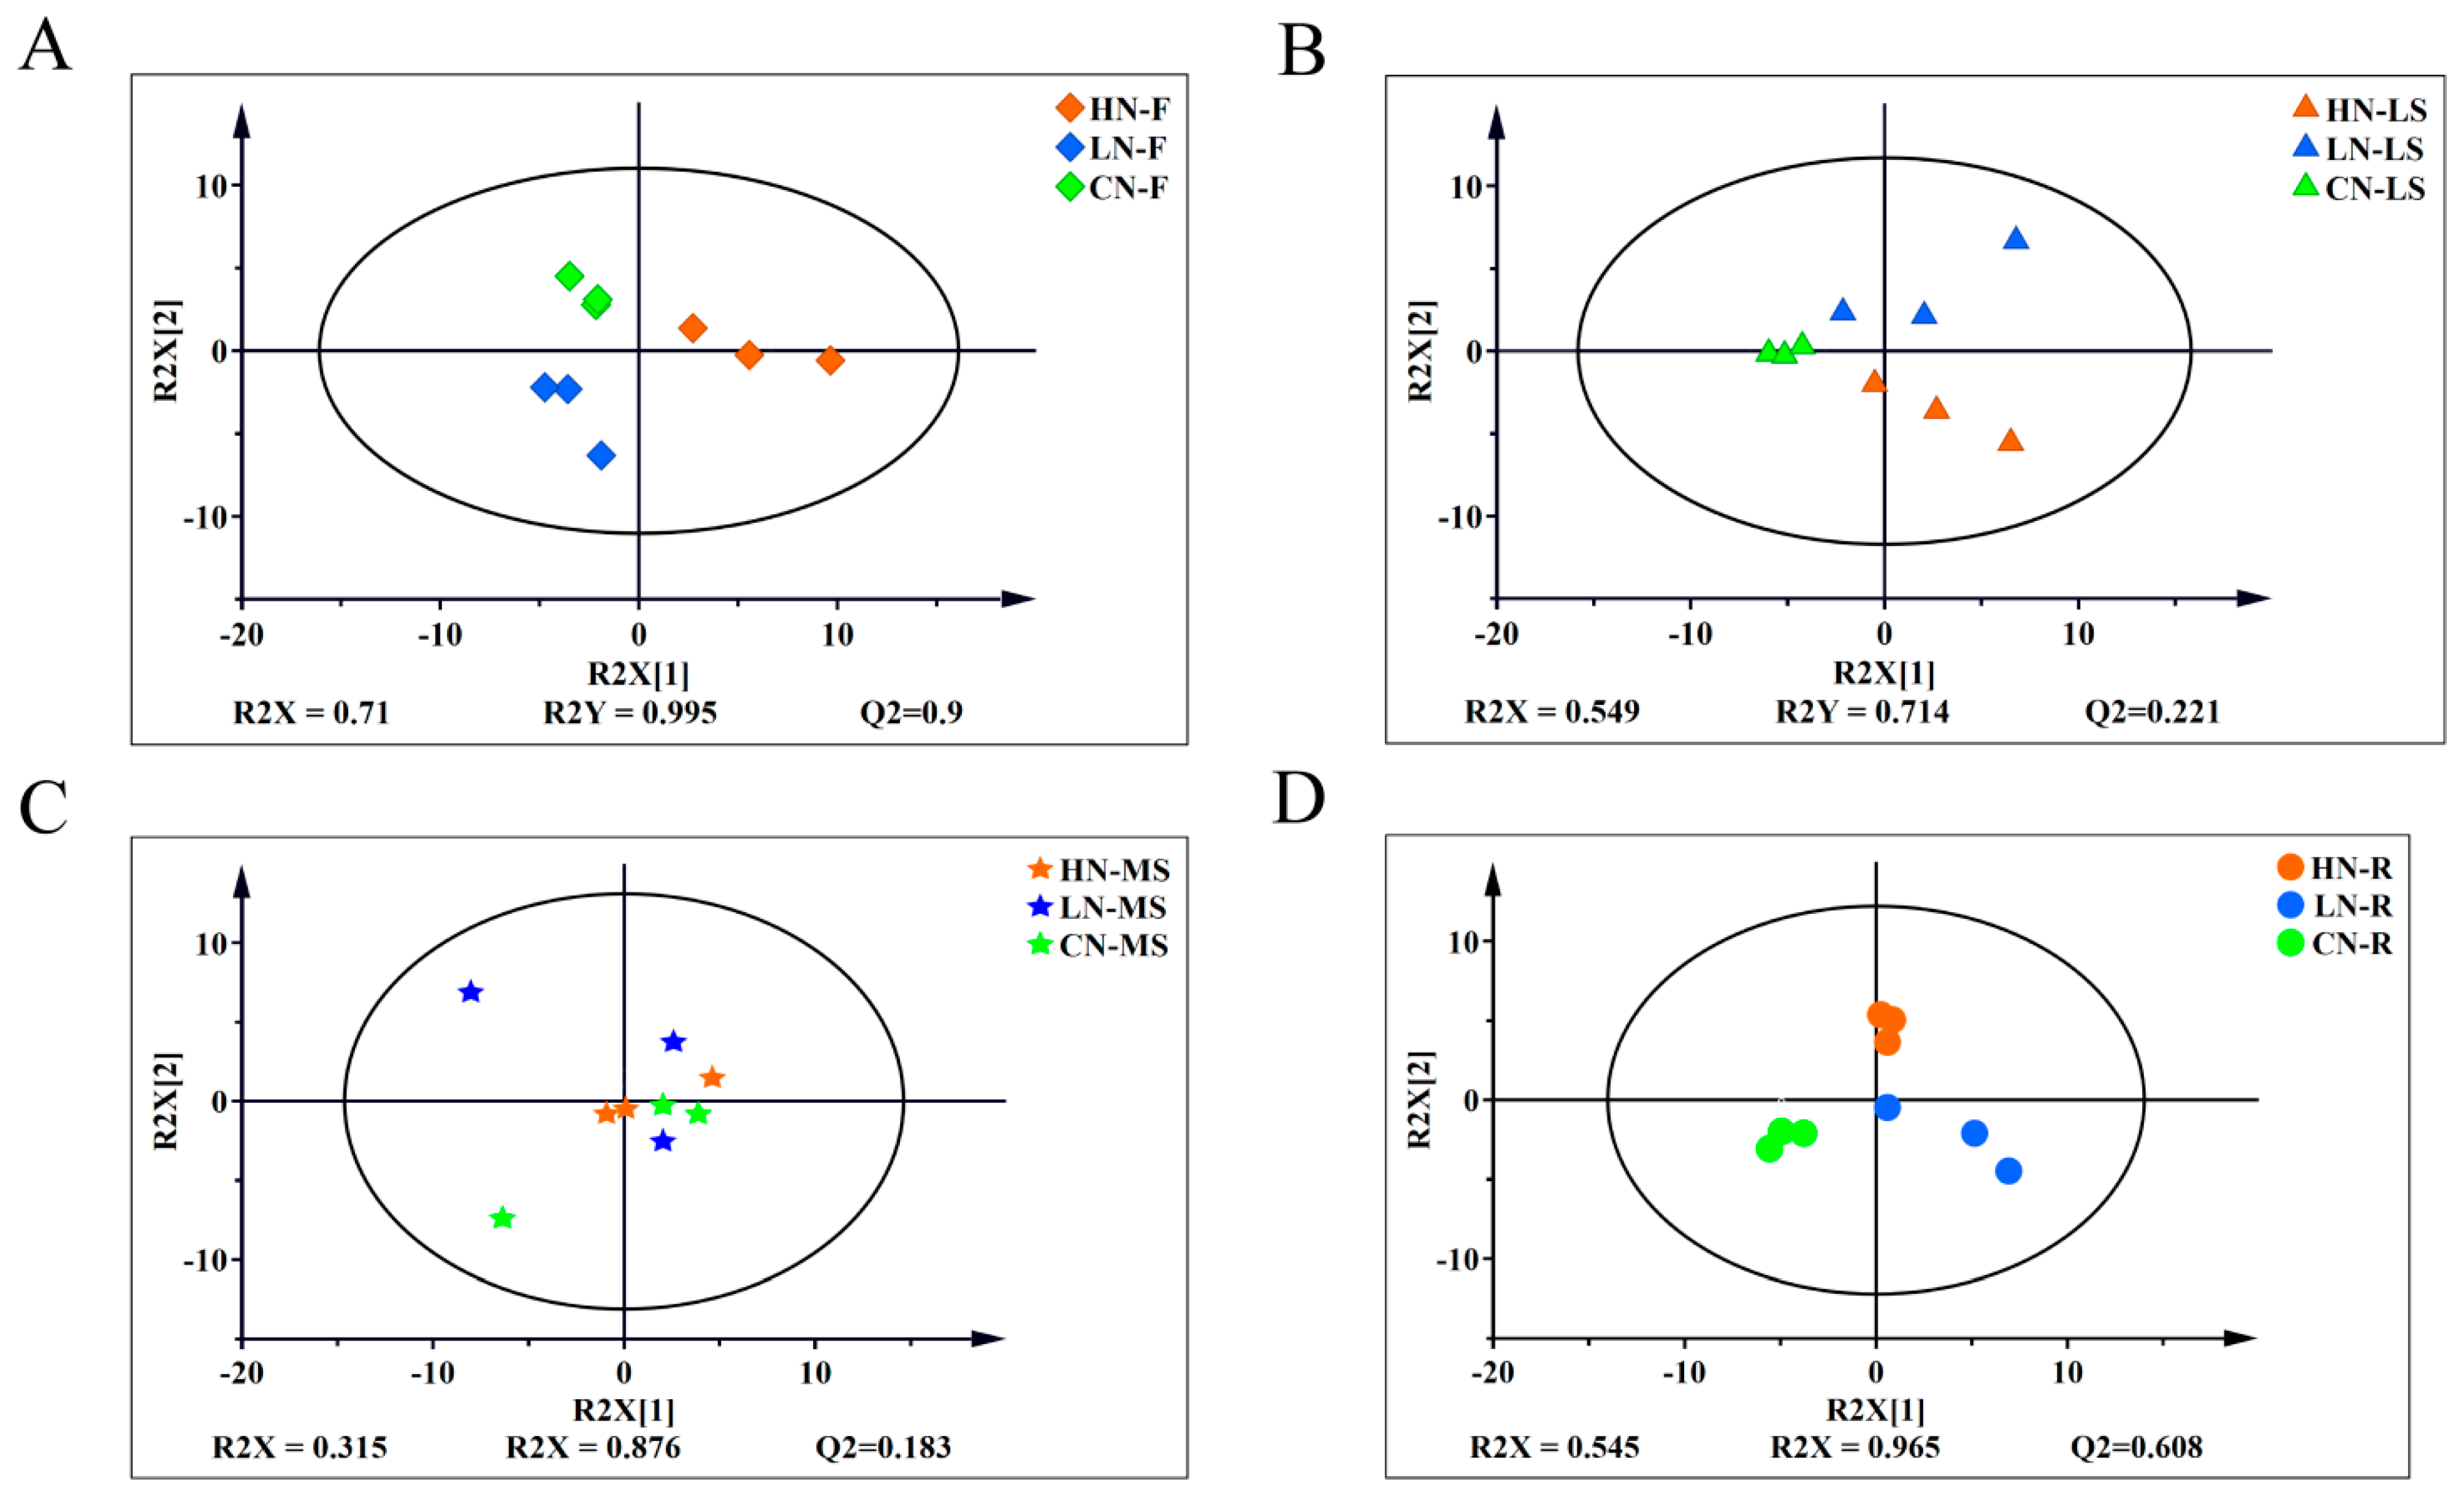
2.3. Overview of the Metabolites Profiles in Response to Three Levels of Nitrogen Fertilization

Under nitrogen fertilization, the metabolomic analysis of Bupleurum based on GC-MS resulted in the identification of 84 metabolites, which were divided into 9 classes, including 28 organic acids and derivatives, 16 sugars, 6 polyols, 8 amino acid and derivatives, 3 glycosides, 6 alkaloids, 7 lipids and derivatives, 9 alkyl and 1phenylpropanoid (Figure 3A, Table 1). To further clarify the difference between metabolites and accumulation patterns among the different plant organs under nitrogen fertilization levels, we adopt normalized numerical methods to accomplish cluster analysis and a heat map (Figure 3B). The heat map indicated that metabolites within some organs under the low-nitrogen fertilization level were up-regulated but down-regulated under the high-nitrogen fertilization level, suggesting that Bupleurum growing under the low-nitrogen fertilization level undergo significantly different metabolic processes compared with Bupleurum under the high-nitrogen fertilization level. Notably, the low-nitrogen fertilization level mostly caused an increased abundance of metabolites in flowers and roots. However, high nitrogen mostly increased the abundance of metabolites in flowers and reduced it in roots.

2.4. Identification of Differential Metabolites Relationships under Nitrogen Fertilization

In order to reveal the differential metabolites relationships under nitrogen fertilization, PLS-DA analysis was conducted on 84 metabolites. Our results revealed that the differences in the metabolomic profiles among the three levels of nitrogen fertilization groups were greater within roots and flowers of Bupleurum than that within the main shoots and lateral shoots. For flowers of Bupleurum, the samples of CN, LN as well as HN basically accomplished a better classification. The model prediction illustrating the gap between R2X and R2Y were not large, showing an excellent model (Figure 4A). According to the characteristic variables, differential metabolites in flowers were D-gluconic, lactose, glycerol, silane, l-rhamnose, phenyllactic acid, gallic acid, 5-o-feruloylquinic acid, phosphonic acid and isophthalic acid. PLS-DA of lateral shoots samples were distinctly segregated, and the model prediction results demonstrated a high-quality model (Figure 4B). The loading plot of lateral shoots demonstrated that lactose, 5-o-feruloylquinic acid, succinic acid, d-fructose, isoquinolinium, pipecolic acid, glycerol, phthalic acid, trisiloxane and D-xylose were differential metabolites. PLS-DA of the main shoots completely displays no separation, which indicted a bad model quality (Figure 4C). Propenoic acid, pipecolic acid, benzoic acid, isophthalic acid, caffeic acid, chlorogenic acid, copper phthalocyanine, urea, sucrose, and citric acid were the principal metabolites that contribute to dispersion for the main shoots. The score plots of roots metabolites displayed clear cluster trends (Figure 4D), with the red (HN) located between the green (CN) and blue (LN). Furthermore, the predictability of pattern goodness was noticed, demonstrating this model was evidently predictable and categorizable. D-xylose, α-mannobiose, lactose, silane, phthalic acid, ether, propanedioic acid, aminobutanoic acid, citric acid and D-fructose contribute to different metabolites. Hence, we can say that various metabolites were potential biomarkers for different organs of Bupleurum growing under nitrogen fertilization. However, we need to further find out the key metabolites that affect the metabolism of Bupleurum under nitrogen fertilization.

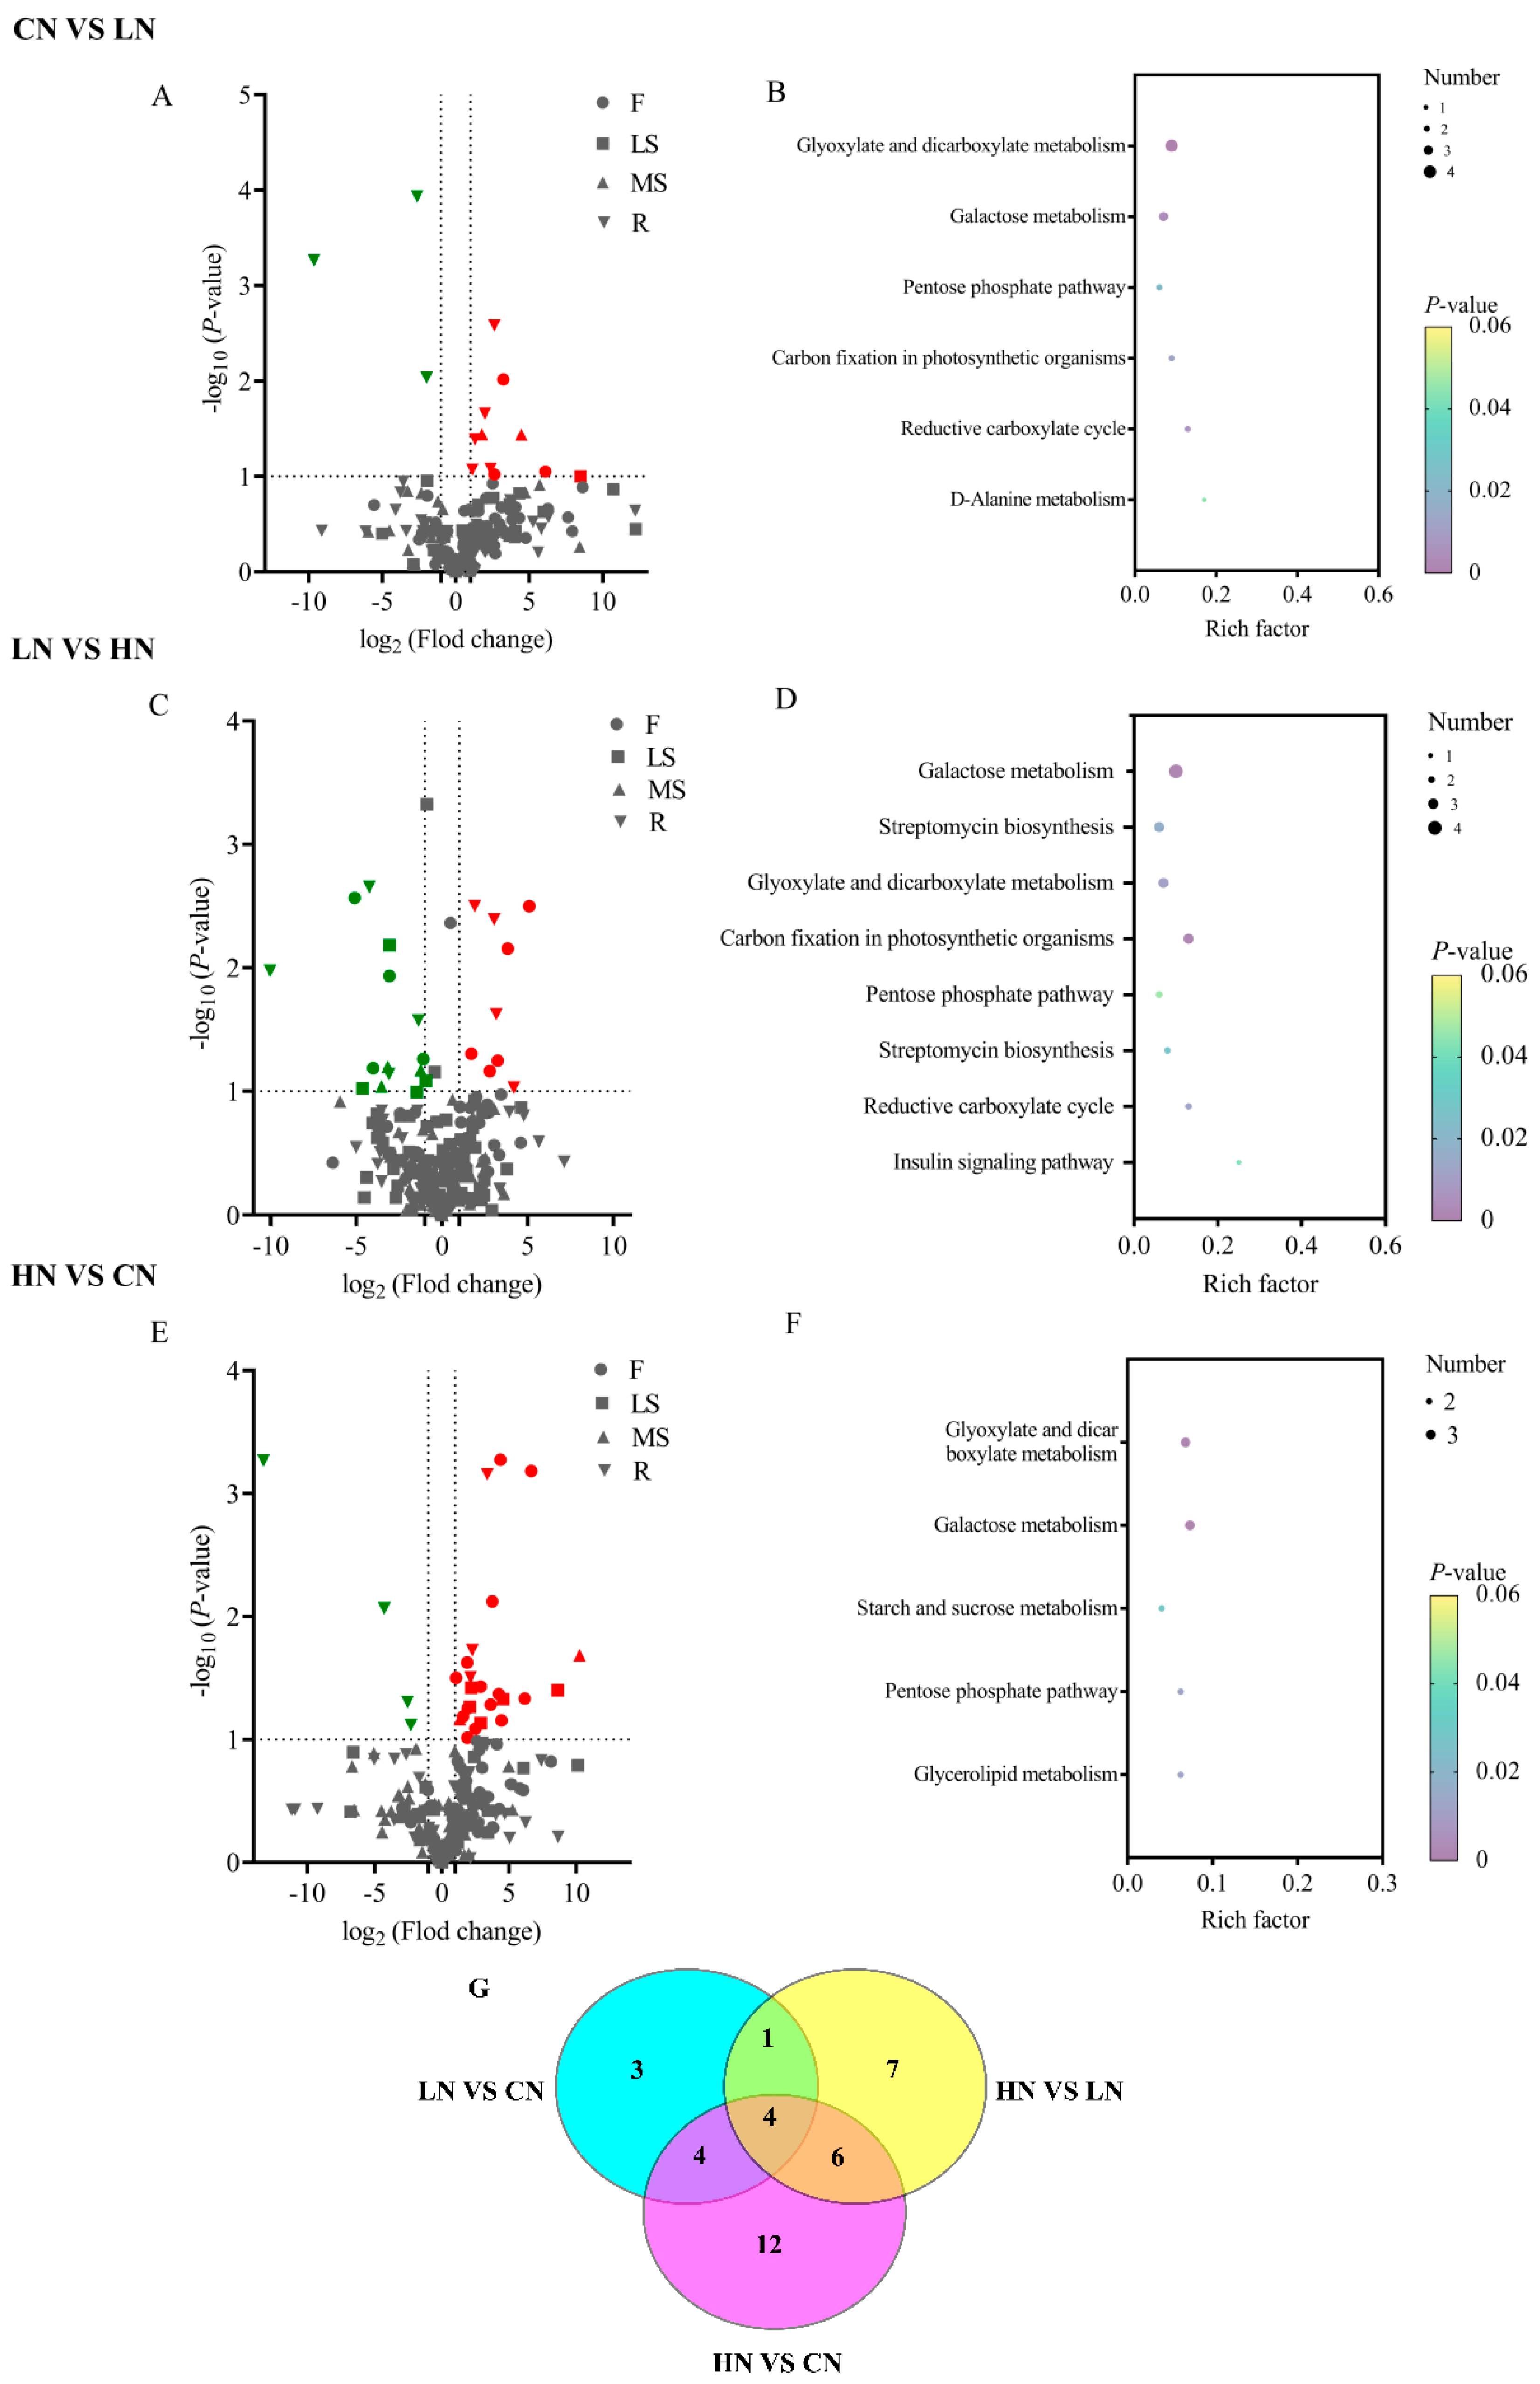
2.5. Metabolite Profiling of Bupleurum under Nitrogen Fertilization in KEGG Enrichment Analysis and Volcanic Map

In order to seek out the key metabolites under different levels of nitrogen fertilization, metabolites with a fold change ≤ 0.5 and a p-value ≥ 1 were selected for further screening. The discrepancy in metabolite expression could be found clearly by volcano plots. Comparing CN with LN, there were 14 metabolites with an obvious change, including 11 up-regulated (3 F, 1 LS, 5 MS, 2 R) and 3 down-regulated metabolites in the roots (Figure 5A). Twenty-four metabolites had been changed when comparing HN to LN (Figure 5C), with 9 up-regulated (5 F, 4 R) and 15 down-regulated metabolites (4 F, 4 LS, 4 MS, 3 R). Compared with CN, 27 metabolites were significantly changed in HN group, including 24 up-regulated (14 F, 5 LS, 2 MS, 3 R) and 3 down-regulated metabolites in the root (Figure 5E).
According to the KEGG annotation and enrichment results, the impact of different nitrogen fertilization levels (LN vs. CN, LN vs. HN, and HN vs. CN) on metabolites was mainly associated with the C-metabolism, N-metabolism and lipids metabolism. For LN vs. CN, metabolic pathways of differential metabolites were involved with the reductive carboxylate cycle (CO2 fixation), glyoxylate and dicarboxylate metabolism, carbon fixation in photosynthetic organisms, pentose phosphate pathway, D-alanine metabolism and galactose metabolism (Figure 5B). For HN vs. LN, the difference of KEGG enrichment classification was also related on six metabolic pathways: insulin signaling pathway, reductive carboxylate cycle (CO2 fixation), streptomycin biosynthesis, carbon fixation in photosynthetic organisms, glyoxylate and dicarboxylate metabolism, galactose metabolism and so on (Figure 5D). In HN vs. CN, various metabolites were mostly enriched in the glycerolipid metabolism, pentose phosphate pathway, starch and sucrose metabolism, galactose metabolism and the glyoxylate and dicarboxylate metabolism (Figure 5F).

2.6. Metabolic Network Diagram and Potential Metabolites in Bupleurm under Three Levels of Nitrogen Fertilization

The appraisal of potential metabolites involved into nitrogen stress might contribute to the growth and development of Bupleurum. We performed a Venn diagram (Figure 5G) to depict shared metabolites of different expressions among HN vs. CN, CN vs. LN and HN vs. CN. We found that the abundances of D-fructose, lactose, ether and glycerol had an obvious change in the response to nitrogen fertilization; therefore, these four overlapping metabolites could be regarded as key metabolites. Moreover, 1, 4 and 6 differential metabolites existed solely in (LN vs. CN) vs. (HN vs. LN), (LN vs. CN) vs. (HN vs. CN) and (HN vs. LN) vs. (HN vs. CN), respectively. Furthermore, on the basis of the KEGG annotation and enrichment data, significant metabolites were mapped to C-metabolism, N-metabolism, lipids metabolism pathways to guarantee clear changes in the metabolic regulation of nitrogen (Figure 6). The overlap of differentially expressed metabolites was observed, suggesting the partial similarity of mechanisms of Bupleurum in response to nitrogen fertilization. The metabolic network diagram went on to verify the above hypothesis. Responses to nitrogen fertilization of Bupleurum were dynamic and included intricate pathways. Therefore, nitrogen fertilization may activate some key physiological and metabolic activities that lead to the growth and development of Bupleurum.

3. Discussion

Bupleurum is an outstanding traditional medicinal plant in China and broadly used for treatment of inflammatory diseases. The yield and quality of Bupleurum mainly depend on the availability of fertilizers, such as nitrogen, phosphorus and potassium, especially on the availability of nitrogen. Thus, it is indispensable to probe the effect of different levels of nitrogen fertilization on Bupleurum to improve its cultivation level.

3.1. Influences of Nitrogen Fertilizer on Bupleurum Quality and Yield

For the common nutrient elements—nitrogen, phosphorus and potassium—nitrogen has the greatest effect under normal circumstances, followed by phosphorus and lastly potassium fertilizer [49,50,51]. Nitrogen is a component of proteins, nucleic acids and many cofactors, as well as of primary and secondary metabolites [44]. Nitrogen could also ensure plant growth and development, and therefore, its addition is needed to increase the plant yield.
Our results show that in the CN group, due to the lack of nitrogen, the shoots were weak, the leaves color turned yellow, and they fall off prematurely. The current study confirmed that plants could change the root system and leaf production to minimize adverse effects under low nitrogen stress [52,53]. The HN fertilizer treatment significantly increased the biomass and the quality of Bupleurum; the shoots became thicker; the flowers were more flourish; the fresh weight and total length also increased. However, no significant effect happened to the roots. It is well documented that previous findings that high-nitrogen level treatment significantly increased plant height and ear length [54], as well as protein content and quality [55]. Additionally, Ottaiano [56] designed three nitrogen fertilization levels (N0, N30, N60), and it seemed that plants under the highest N dose showed a higher consumption of nitrogen, which is accumulated in leaves without increasing yield. In other words, high nitrogen stress promoted the accumulation of the aboveground parts, which had little effect on the yield of the underground parts. This was also consistent with our point. Saikosaponins represent the principle secondary metabolites within Bupleurum that have a wide range of pharmacological activities, such as their anti-inflammatory, antioxidant and hepatoprotective activity [12]. In Bupleurum, saikosaponins A and D are the most important bioactive constituents [57]. Our results showed that the total saikosaponins display an analogous tendency and mostly accumulated in the flowers and roots. In addition, the low-nitrogen level decreased the total saikosaponins content in flowers and roots; however, at the high-nitrogen level, flowers showed a significant increase in the total saikosaponins content, while the total content in roots remained stable. Moreover, high nitrogen fertilizer increased the content of saikosaponin A, and its increment was accompanied by a decrease in saikosaponins C in aerial parts (flowers, main shoots and lateral shoots); however, it was accompanied by a decrease in saikosaponins D in roots, indicating that high nitrogen promotes the quality of aboveground parts, especially flowers, but reduces the quality of roots. Our results were consistent with previous research that nitrogen fertilizer significantly increased the biomass and the content of saikosaponins A in B. chinense roots but had no significant effect on root saikosaponin D content [58]. In addition, we found saikosaponin D content decreased in roots, which suggests that saikosaponin D is less responsive to high nitrogen fertilization than saikosaponin A. In addition, increased root yield and total saikosaponin content in B. falcatum in response to nitrogen fertilizer was reported [59]. However, the application of moderate amounts of nitrogen fertilizer is best, as over fertilization resulted in decreased concentrations of medicinal compounds [60]. Either too little or too much nitrogen could be harmful to the growth and development. The fruit commodity rate of three nitrogen levels was highest in 5A and lowest in 3A [51].Hence, appropriate nitrogen fertilizer rate can promote plant growth and maintain the content of active ingredients in specific parts.

3.2. Metabolic Profiling of Bupleurum Organs under Nitrogen Stress

PLS-DA is a multivariate statistical analysis method with supervised pattern recognition, which can distinguish groups and identify different metabolites to the greatest extent. Four groups were included in the PLS-DA: root, main shoots, lateral shoots and flower. The flowers and roots separated clearly between the N-treatments and control groups, suggesting that nitrogen fertilizer play a key role during Bupleurum growth and fruit maturation [61,62]. Previous studies have supported the above result that N greatly influences photosynthetic processes and grain growth during the maturation of wheat [63]. In addition, the differences in metabonomic characteristics between LN groups were greater than those in HN groups. Compared with the LN group, more negative correlations of metabolites were found in the HN group in roots, suggesting that the HN group caused metabolic changes that were not conducive to the development of Bupleurum. Qu [64] also came up with this conclusion; at higher nitrogen levels, the direct effects of stem–leaf ratio and leaf area index on dry matter yield are both negative. In these models, R2X and R2Y represented the interpretation rate to the X and Y matrices, respectively, and Q2 represented the prediction ability. According to PLS-DA analysis, Q2 > 0.2 and 0 < R2X-Q2Y < 0.2, suggesting there was an obvious difference between the N treatment group and the control group, and all results confirmed the model was meaningful. The clustering analysis findings were also consistent with PLS-DA. From this, we can guess that nitrogen is an essential element for plant growth and development, and nitrogen deficiency can easily lead to metabolic disorders and environmental pollution [51,65,66,67].

3.3. KEGG Enrichment Analysis and Comprehensive Metabolic Pathways

The basis of the biological phenotype are metabolites, which facilitate a more intuitive and efficient understanding of biological processes and mechanisms [68]. This research was based on a non-targeted metabolic technique that detected 84 metabolites under nitrogen stress (CN, LN and HN). A common feature of nitrogen metabolism is that abundant nitrogen can significantly facilitate the biosynthesis and photosynthesis of proteins, amino acids and organic acids in plants [69]. The primary metabolism is widespread in plants, and the TCA cycle is most significant. Data analysis showed that the TCA cycle was extremely restrained under nitrogen stress. Compared with the CN group, the contents of citric acid, succinic acid and malic acid under nitrogen stress were lower (Figure 6). Moreover, the contents of citric acid and succinic acid in HN were much lower than CN and LN. Simultaneously, the reduced accumulation of malic acid was recorded under LN stress. Indeed, the HN group led to major changes in the content of carbohydrates in Bupleurum, which were mostly related to the glyoxylate and dicarboxylate metabolism and galactose metabolism. Furthermore, in the HN group, the increase in available carbon resources (for instance, glucose and sucrose) also clearly indicates a decrease in the metabolism of the TCA cycle (Figure 6). The research suggested HN prevented the utilization of the carbon skeleton by restraining the TCA cycle pathway [70]. In addition, high nitrogen might lead to an increase in nitrogenous compounds, organic acids and lipids [71], while limited nitrogen could promote the synthesis and accumulation of metabolites: flavones [72], phenolic [73] and total alkaloids [74].
Several metabolites were significantly up-regulated under high nitrogen stress for Bupleurum, which were mostly related to the C-metabolism and N-metabolism. In this research, some important sugars related to the C-metabolism were found, such as sucrose, mannose-6-P, fructose, glucose, ribose, galactose and sedoheptulose. The above-mentioned metabolites contributed to the metabolism and biosynthesis of Bupleurum, which further affect the yield of Bupleurum. The biosynthesis of saikosaponins [18,75] is mainly based on the mevalonic acid (MVA) pathway and methylerythritol phosphate pathway (MEP). Furthermore, the starting points of the above metabolic pathway are pyruvate, acetyl-CoA and glyceraldehyde 3-phosphate [18,19], which are also related to fructose, fructose 6-phosphate and so on. Furthermore, it is noticeable that sucrose accumulated more in flowers than in other organs. These similar results support the validity. Sucrose is the main end-product of photosynthesis and the main form of carbohydrate transported over long distances in the phloem from photosynthetic source organs (leaves) to fruits, roots and shoot tips, which is extremely critical to the allocation of resources [76,77]. We predicted that sucrose was transported from the flower to the root as a signal molecule, and the essence may be due to the lack of nutrient nitrogen for root growth. In other words, more sucrose accumulation allowed better root growth. For most plants, carbohydrates mean the key energy storage [78,79,80]. Thus, high nitrogen stress can increase the utilization rate of sugar, and sugar is one of the most significant determining factors of yield and quality [54,81].
The TCA cycle could increase energy of amino acid synthesis [82] and thereby enhance the contents of protein and amino acid. Most amino acids are primarily related to nitrogen storage and utilization [83,84]. Amino acids are downstream products of nitrogen metabolism, and their abundance increases with elevated nitrogen levels [85,86]. Our results are consistent with previous studies; the levels of serine, glycine, alanine and valine shows a consistent pattern of change under high nitrogen. It is striking that proline and leucine had an extremely high content in LN instead of HN, which were inconsistent with other amino acids. In addition, in the N-metabolism, nitrogen usually accumulates larger in the main shoots and lateral shoots, and with the increase in N stress, it accumulates more. It is an active process of their absorption by the roots based on membrane transport proteins [87]. We speculated that higher or lower nitrogen stress may lead to changes in amino acid biosynthesis flux to some extent [88]. There is a significant impact on amino acid metabolism for abiotic stress, particularly in some amino acid biosynthesis or degradation [71].

4. Conclusions

The findings of the current research highlighted the effect of nitrogen fertilizer on the traditional Chinese medicine Bupleurum. The LN level seems to be an ideal dose for the yield and quality of Bupleurum. The LN level significantly increased biomass accumulation and made Bupleurum more fruitful. However, the total saikosaponins decreased in the roots but increased significantly in the flowers under the HN level. Moreover, the non-targeted metabolomics analysis identified 84 kinds of metabolites of Bupleurum under nitrogen stress (CN, LN and HN). Under the HN level, most of the metabolites in flowers were up-regulated but down-regulated in roots. Therefore, the HN level promotes the quality and metabolites of flowers, while reducing those of roots. Because the root of Bupleurum (Apiaceae) is a Chinese herbal medicine and widely used to treat inflammatory and infectious diseases, we hope to accumulate more saikosaponins and metabolites in the root. In addition, four differentially accumulated metabolites—D-fructose, lactose, ether and glycerol—were identified as key metabolites under nitrogen stress of Bupleurum. The identified metabolites were mostly organic acids, amino acids, carbohydrates and lipids involved in carbon and nitrogen metabolisms, which set up a primary metabolic network diagram associated with Bupleurum. Nevertheless, it is necessary to further explore the relationship between saikosaponins and secondary metabolites in order to guide reasonable fertilization (nitrogen, phosphorus and potassium).

5. Materials and Methods

5.1. Plant Source and Experimental Design

The medicinal plant used in our study was cultivar Bupleurum scorzonerifolium Willd., which was widely cultivated in the northeast of China. The dried roots of Bupleurum chinense DC. And Bupleurum scorzonerifolium Willd. were the only two authentic sources of Chaihu [11]. Two-year-old Bupleurum seedlings were cultivated in natural environmental conditions at the research site of Lin Dian, Da Qing, Heilongjiang province, China (47°18′ N, 124°87′ E). The chemical prosperities of the soil [89] were pH 7.78; electrical conductivity, 134 us·cm−1; organic matter, 4.86 g·kg−1; total N 16.4 mg·kg−1; available N 2.1 mg·kg−1, respectively. In the 2018~2019 growing season, the annual average sunshine hours at the test site was 2807 h, the average annual temperature was 4 °C and the average annual precipitation was 417.2 mm [90].
The three nitrogen levels (N) were distributed in a randomized block design. Each treatment was replicated three times, and each plot measured 3 m × 1.2 m. Based on previous experience, urea (NH2)2CO was used as the nitrogen fertilizer. Bupleurum were processed for CN, LN and HN treatments by adjusting the nitrogen concentration in the current study [91,92,93]. The three nitrogen fertilization levels were: CN (0 kg·ha−1), LN (55 kg·ha−1) and HN (110 kg·ha−1).
On the 30th day (August 2018) after the second application of the nitrogen fertilizer, Bupleurum plants were harvested and divided into flowers, main shoots, lateral shoots and roots. Then, they were transferred quickly within three hours to the laboratory. Each group obtained three technical replicates, then the fresh weight and length were measured. Simultaneously, each sample is divided into two batches: one batch was dried in a forced air oven at 42 °C until constant weight and used for saikosaponins extraction (Section 5.2), and the other batch was stored at −80 °C for samples processing of GC–MS (Section 5.3).

5.2. Determination of the Saikosaponins Content

In total, 500 mg of the sample was dissolved in 25.0 mL of 8% NH3 methanol. The sample was sonicated at 30 °C for 30 min, filtered and evaporated, then diluted to a 10 mL volumetric flask. The solution was passed through 0.45 μm filter membrane for HPLC analysis. The content of saikosaponins A, saikosaponins C and saikosaponins D were measured separately. A Hitachi HPLC system was equipped with an L-2000 high-performance liquid chromatograph and L-2200 autosampler, and a reversed phase column (Diamonsil C 18, 250 mm × 4.6 mm, 5 μm) was applied. Acetonitrile and methanol were used as solvents A and B, respectively, which was applied to the gradient elution as follows: 0~50 min, A: 25~90% and B: 75~10%; 50~55 min, A: 90% and B: 10%. The flow rate was maintained at 0.8 mL·min−1, and the detection wavelength was set at 210 nm.

5.3. Sample Preparation and Extraction

In total, 60 mg of different organs of Bupleurum (roots, main shoots, lateral shoots and flowers) were moved to tubes. Each sample was extracted by the addition of 540 μL of methanol and 60 μL of the internal standard, followed by vortexing for 2 min and sonicating for 30 min. Then, 300 μL of chloroform and 600 μL of water were added, and the continued vortexing and sonicating continued. Subsequently, it was centrifuged at 14,000 rpm for 10 min. The supernatant was evaporated to dryness with a fast centrifugal concentrator. The dried residue was dissolved in 400 μL of methoxyamine pyridine solution and incubated at 37 °C for 90 min. Subsequently, 400 μL N,O−Bis (trimethylsilyl) trifluoroacetamide (BSTFA) and 60 μL Hexane were added, vortexed for 2 min and derivatized for 60 min at 70 °C. The solution was centrifuged at 12,000 rpm for 5 min to obtain the supernatant for GC–MS analysis.

5.4. GC−MS Analysis

In total, 1 μL of the derivatization solution was injected into the 7890A-5975C GC-MS of Agilent. The sample was separated using a non-polar DB-5 capillary column (length = 30 m, df = 0.25 μm, ID = 250 μm, I and W Scientific Folsom, CA, USA), and 1.0 mL·min−1 high-purity helium gas was used as carrier gas. The temperature program started from 60 and then raised to 125 °C at 8 °C min−1 temperature ramps, 210 °C at 4 °C·min−1 temperature ramps, 270 °C at 5 °C·min−1 temperature ramps, 305 °C at 10 °C·min−1 temperature ramps and a final maintenance at 305 °C. The electron impact ion source was maintained at 260 °C with a filament bias of −70 V. Full scan mode (m/z 50–600) was applied, with an acquisition rate of 20 spectrum·second−1.

5.5. Statistical Analysis

GC–MS data were converted into Computable Document Format (CDF) and peak areas normalized to the internal stand. The metabolites were exhaustively contrasted by adopting a heat map and partial least squares discriminant analysis (PLS-DA) methods. In the Student’s t-test analysis, p-values of more than 1 and fold changes of less than 0.05 were statistically significant, and the volcano map was used to select the differentially expressed metabolites. The Kyoto Encyclopedia of Genome and Genome (KEGG) (http://www.genome.jp/kegg/) was used to analyze the metabolic pathways that had the greatest impact. The difference in the biomass and metabolites among CN, LN and HN were tested using a one-way analysis of variance (ANOVA). The graphs involved were drawn by GraphPad Prism 9.0.

Author Contributions

Data curation, J.S.; Formal analysis, J.S. and W.L.; Funding acquisition, Z.T.; Investigation, Y.G. and Z.D.; Methodology, J.S. and A.A.; Project administration, Z.T.; Resources, Y.Z.; Supervision, A.A. and Z.T.; Writing—original draft, J.S. and A.A.; Writing—review and editing, J.S., W.L., Y.Z., Y.G., Z.D., Z.T. and A.A. All authors have read and agreed to the published version of the manuscript.

Funding

This work was supported by the Fundamental Research Funds for the Central Universities (2572020DY04) and the Forestry Science and Technology Promotion Project ([2019]12, 2020133122).

Institutional Review Board Statement

Not applicable.

Informed Consent Statement

Not applicable.

Acknowledgments

The authors greatly appreciate “Dashan Chinese Herbal Medicine Cooperative, Daqing, Heilongijang” for providing test fields of Bupleurum. The authors would like to thank the laboratory of Northeast Forestry University for offering GC–MS instrument.

Conflicts of Interest

The authors declare no conflict of interest.

References

  1. Bernstein, N.; Gorelick, J.; Zerahia, R.; Koch, S. Impact of N, P, K, and Humic Acid Supplementation on the Chemical Profile of Medical Cannabis (Cannabis sativa L.). Front. Plant Sci. 2019, 10, 736. [Google Scholar] [CrossRef] [Green Version]
  2. Mohidin, H.; Hanafi, M.M.; Rafii, Y.M.; Abdullah, S.N.A.; Idris, A.S.; Man, S.; Idris, J.; Sahebi, M. Determination of optimum levels of nitrogen, phosphorus and potassium of oil palm seedlings in solution culture. Bragantia 2015, 74, 247–254. [Google Scholar] [CrossRef] [Green Version]
  3. Almodares, A.; Taheri, R.; Chung, I.M.; Fathi, M. The effect of nitrogen and potassium fertilizers on growth parameters and carbohydrate contents of sweet sorghum cultivars. J. Environ. Biol. 2008, 29, 849–852. [Google Scholar] [CrossRef]
  4. Arsova, B.; Kierszniowska, S.; Schulze, W.X. The use of heavy nitrogen in quantitative proteomics experiments in plants. Trends Plant Sci. 2012, 17, 102–112. [Google Scholar] [CrossRef] [PubMed]
  5. Thomsen, H.C.; Eriksson, D.; Møller, I.S.; Schjoerring, J.K. Cytosolic glutamine synthetase: A target for improvement of crop nitrogen use efficiency? Trends Plant Sci. 2014, 19, 656–663. [Google Scholar] [CrossRef]
  6. Sarwar, M. Effects of potassium fertilization on population build up of rice shoots borers (lepidopteron pests) and rice (Oryza sativa L.) yield. J. Cereals Oilseeds 2012, 3, 6–9. [Google Scholar] [CrossRef]
  7. Du, X.-Q.; Wang, F.-L.; Li, H.; Jing, S.; Yu, M.; Li, J.; Wu, W.-H.; Kudla, J.; Wang, Y. The Transcription Factor MYB59 Regulates K+/NO3− Translocation in the Arabidopsis Response to Low K+ Stress. Plant Cell 2019, 31, 699–714. [Google Scholar] [CrossRef] [Green Version]
  8. Guo, J.H.; Liu, X.J.; Zhang, Y.; Shen, J.L.; Han, W.X.; Zhang, W.F.; Christie, P.; Goulding, K.W.T.; Vitousek, P.M.; Zhang, F.S. Significant Acidification in Major Chinese Croplands. Science 2010, 327, 1008–1010. [Google Scholar] [CrossRef] [PubMed] [Green Version]
  9. Zhang, X. Biogeochemistry: A plan for efficient use of nitrogen fertilizers. Nature 2017, 543, 322–323. [Google Scholar] [CrossRef] [PubMed]
  10. Sheh, M.; Watson, M.F.L. Bupleurum L. In Flora of China; Wu, Z.Y., Raven, P.H., Eds.; Science Press: Beijing, China; Missouri Botanical Garden Press: St. Louis, MO, USA, 2005; pp. 60–74. [Google Scholar]
  11. Chinese Pharmacopoeia Commission. Pharmacopoeia of People’s Republic of China; China Medical Sciences and Technology Press: Beijing, China, 2020; p. 293. (In Chinese) [Google Scholar]
  12. Ashour, M.L.; Wink, M. Genus Bupleurum: A review of its phytochemistry, pharmacology and modes of action. J. Pharm. Pharmacol. 2011, 63, 305–321. [Google Scholar] [CrossRef]
  13. Ashour, M.L.; El-Readi, M.; Youns, M.; Mulyaningsih, S.; Sporer, F.; Efferth, T.; Wink, M. Chemical composition and biological activity of the essential oil obtained from Bupleurum marginatum (Apiaceae). J. Pharm. Pharmacol. 2009, 61, 1079–1087. [Google Scholar] [CrossRef]
  14. Law, B.Y.-K.; Mo, J.-F.; Wong, V.K.-W. Autophagic effects of Chaihu (dried roots of Bupleurum Chinense DC or Bupleurum scorzoneraefolium WILD). Chin. Med. 2014, 9, 21. [Google Scholar] [CrossRef] [Green Version]
  15. Wang, H.; Zhang, G.; Gao, Z.; Sui, C.; Ji, H.; Jiang, J.; Xinwei, G.; Wei, J. Transcriptome profiling of Bupleurum chinense DC. root provides new insights into the continuous inflorescence removal induced improvements to root growth and saikosaponin biosynthesis. Ind. Crop. Prod. 2021, 160, 113085. [Google Scholar] [CrossRef]
  16. Wei, J.H.; Cheng, H.Z.; Li, K.T.; Ding, W.L.; Xu, Z.X.; Chu, Q.L. Plant growth analysis of Bupleurum chinese. Zhong Yao Cai 2003, 26, 617–619. (In Chinese) [Google Scholar]
  17. Prieto, J.M.; Ogunsina, M.O.; Novak, A.; Joshi, A.; Kokai, J.; Rocha, I.D.C.; Pardo-De-Santayana, M. Comparative Study of the in vitro Bioactivities of Bupleurum rigidum and B. fruticescens. Nat. Prod. Commun. 2012, 7, 757–760. [Google Scholar] [CrossRef] [PubMed]
  18. Xu, Y.; Chen, Z.; Jia, L.; Weng, X. Advances in understanding of the biosynthetic pathway and regulatory mechanism of triterpenoid saponins in plants. Sci. Sin. Vitae 2021, 51, 525–555. [Google Scholar] [CrossRef]
  19. Zhao, Y.-J.; Li, C. Biosynthesis of Plant Triterpenoid Saponins in Microbial Cell Factories. J. Agric. Food Chem. 2018, 66, 12155–12165. [Google Scholar] [CrossRef]
  20. Thimmappa, R.; Geisler, K.; Louveau, T.; O’Maille, P.; Osbourn, A. Triterpene Biosynthesis in Plants. Annu. Rev. Plant Biol. 2014, 65, 225–257. [Google Scholar] [CrossRef] [PubMed]
  21. Augustin, J.M.; Kuzina, V.; Andersen, S.B.; Bak, S. Molecular activities, biosynthesis and evolution of triterpenoid saponins. Phytochemistry 2011, 72, 435–457. [Google Scholar] [CrossRef] [PubMed]
  22. Miettinen, K.; Iñigo, S.; Kreft, Ł.; Pollier, J.; De Bo, C.; Botzki, A.; Coppens, F.; Bak, S.; Goossens, A. The TriForC database: A comprehensive up-to-date resource of plant triterpene biosynthesis. Nucleic Acids Res. 2018, 46, D586–D594. [Google Scholar] [CrossRef] [PubMed] [Green Version]
  23. Sumner, L.W.; Lei, Z.; Nikolau, B.J.; Saito, K. Modern plant metabolomics: Advanced natural product gene discoveries, improved technologies, and future prospects. Nat. Prod. Rep. 2015, 32, 212–229. [Google Scholar] [CrossRef] [PubMed]
  24. Jorge, T.; Rodrigues, J.; Caldana, C.; Schmidt, R.; van Dongen, J.; Thomas-Oates, J.; António, C. Mass spectrometry-based plant metabolomics: Metabolite responses to abiotic stress. Mass Spectrom. Rev. 2016, 35, 620–649. [Google Scholar] [CrossRef] [PubMed]
  25. Omena-Garcia, R.P.; Martins, A.O.; Medeiros, D.B.; Vallarino, J.G.; Ribeiro, D.M.; Fernie, A.R.; Araújo, W.L.; Nunes-Nesi, A. Growth and metabolic adjustments in response to gibberellin deficiency in drought stressed tomato plants. Environ. Exp. Bot. 2019, 159, 95–107. [Google Scholar] [CrossRef]
  26. Alvarez, S.; Marsh, E.L.; Schroeder, S.G.; Schachtman, D.P. Metabolomic and proteomic changes in the xylem sap of maize under drought. Plant Cell Environ. 2008, 31, 325–340. [Google Scholar] [CrossRef] [PubMed]
  27. Richter, J.A.; Behr, J.H.; Erban, A.; Kopka, J.; Zörb, C. Ion-dependent metabolic responses of Vicia faba L. to salt stress. Plant Cell Environ. 2019, 42, 295–309. [Google Scholar] [CrossRef] [Green Version]
  28. Ruiz, M.R.; Aparicio-Chacón, M.V.; Palma, J.M.; Corpas, F.J. Arsenate disrupts ion balance, sulfur and nitric oxide metabolisms in roots and leaves of pea (Pisum sativum L.) plants. Environ. Exp. Bot. 2019, 161, 143–156. [Google Scholar] [CrossRef]
  29. Chebrolu, K.K.; Fritschi, F.B.; Ye, S.; Krishnan, H.B.; Smith, J.R.; Gillman, J.D. Impact of heat stress during seed development on soybean seed metabolome. Metabolomics 2016, 12, 28. [Google Scholar] [CrossRef]
  30. Wang, X.; Zhu, W.; Hashiguchi, A.; Nishimura, M.; Tian, J.; Komatsu, S. Metabolic profiles of flooding-tolerant mechanism in early-stage soybean responding to initial stress. Plant Mol. Biol. 2017, 94, 669–685. [Google Scholar] [CrossRef]
  31. Machado, F.; Dias, M.C.; de Pinho, P.G.; Araújo, A.M.; Pinto, D.; Silva, A.; Correia, C.; Moutinho-Pereira, J.; Santos, C. Photosynthetic performance and volatile organic compounds profile in Eucalyptus globulus after UVB radiation. Environ. Exp. Bot. 2017, 140, 141–149. [Google Scholar] [CrossRef]
  32. Takshak, S.; Agrawal, S. Defence strategies adopted by the medicinal plant Coleus forskohlii against supplemental ultraviolet-B radiation: Augmentation of secondary metabolites and antioxidants. Plant Physiol. Biochem. 2015, 97, 124–138. [Google Scholar] [CrossRef]
  33. Contreras, R.A.; Pizarro, M.; Köhler, H.; Zamora, P.; Zúñiga, G.E. UV-B shock induces photoprotective flavonoids but not antioxidant activity in Antarctic Colobanthus quitensis (Kunth) Bartl. Environ. Exp. Bot. 2019, 159, 179–190. [Google Scholar] [CrossRef]
  34. Van Heerden, P.D.; Viljoen, M.M.; De Villiers, M.F.; Krüger, G.H. Limitation of photosynthetic carbon metabolism by dark chilling in temperate and tropical soybean genotypes. Plant Physiol. Biochem. 2004, 42, 117–124. [Google Scholar] [CrossRef] [PubMed]
  35. Rasheed, R.; Ashraf, M.A.; Kamran, S.; Iqbal, M.; Hussain, I. Menadione sodium bisulphite mediated growth, secondary metabolism, nutrient uptake and oxidative defense in okra (Abelmoschus esculentus Moench) under cadmium stress. J. Hazard. Mater. 2018, 360, 604–614. [Google Scholar] [CrossRef]
  36. Abozeid, A.; Ying, Z.; Lin, Y.; Liu, J.; Zhang, Z.; Tang, Z. Ethylene Improves Root Syshoots Development under Cadmium Stress by Modulating Superoxide Anion Concentration in Arabidopsis thaliana. Front. Plant Sci. 2017, 8, 253. [Google Scholar] [CrossRef] [PubMed] [Green Version]
  37. Das, A.; Rushton, P.J.; Rohila, J.S. Metabolomic Profiling of Soybeans (Glycine max L.) Reveals the Importance of Sugar and Nitrogen Metabolism under Drought and Heat Stress. Plants 2017, 6, 21. [Google Scholar] [CrossRef] [Green Version]
  38. Xu, G.; Singh, S.; Barnaby, J.; Buyer, J.; Reddy, V.; Sicher, R. Effects of growth temperature and carbon dioxide enrichment on soybean seed components at different stages of development. Plant Physiol. Biochem. 2016, 108, 313–322. [Google Scholar] [CrossRef] [PubMed]
  39. Ueno, V.A.; Sawaya, A.C.H.F. Influence of environmental factors on the volatile composition of two Brazilian medicinal plants: Mikania laevigata and Mikania glomerata. Metabolomics 2019, 15, 91. [Google Scholar] [CrossRef]
  40. Lee, D.-Y.; Kim, J.K.; Shrestha, S.; Seo, K.-H.; Lee, Y.-H.; Noh, H.-J.; Kim, G.-S.; Kim, Y.-B.; Kim, S.-Y.; Baek, N.-I. Quality Evaluation of Panax ginseng Roots Using a Rapid Resolution LC-QTOF/MS-Based Metabolomics Approach. Molecules 2013, 18, 14849–14861. [Google Scholar] [CrossRef] [PubMed] [Green Version]
  41. Liu, J.; Liu, Y.; Wang, Y.; Abozeid, A.; Zu, Y.-G.; Tang, Z.-H. The integration of GC–MS and LC–MS to assay the metabolomics profiling in Panax ginseng and Panax quinquefolius reveals a tissue-and species-specific connectivity of primary metabolites and ginsenosides accumulation. J. Pharm. Biomed. Anal. 2017, 135, 176–185. [Google Scholar] [CrossRef] [PubMed]
  42. Liu, J.; Liu, Y.; Wang, Y.; Abozeid, A.; Zu, Y.-G.; Zhang, X.-N.; Tang, Z.-H. GC-MS Metabolomic Analysis to Reveal the Metabolites and Biological Pathways Involved in the Developmental Stages and Tissue Response of Panax ginseng. Molecules 2017, 22, 496. [Google Scholar] [CrossRef] [Green Version]
  43. Nguyen, V.L.; Palmer, L.; Roessner, U.; Stangoulis, J. Genotypic Variation in the Root and Shoot Metabolite Profiles of Wheat (Triticum aestivum L.) Indicate Sustained, Preferential Carbon Allocation as a Potential Mechanism in Phosphorus Efficiency. Front. Plant Sci. 2019, 10, 995. [Google Scholar] [CrossRef] [PubMed] [Green Version]
  44. Hafsi, C.; Falleh, H.; Saada, M.; Ksouri, R.; Abdelly, C. Potassium deficiency alters growth, photosynthetic performance, secondary metabolites content, and related antioxidant capacity in Sulla carnosa grown under moderate salinity. Plant Physiol. Biochem. 2017, 118, 609–617. [Google Scholar] [CrossRef] [PubMed]
  45. Feng, Z.; Ding, C.; Li, W.; Wang, D.; Cui, D. Applications of metabolomics in the research of soybean plant under abiotic stress. Food Chem. 2020, 310, 125914. [Google Scholar] [CrossRef]
  46. Villate, A.; Nicolas, M.S.; Gallastegi, M.; Aulas, P.-A.; Olivares, M.; Usobiaga, A.; Etxebarria, N.; Aizpurua-Olaizola, O. Review: Metabolomics as a prediction tool for plants performance under environmental stress. Plant Sci. 2021, 303, 110789. [Google Scholar] [CrossRef] [PubMed]
  47. Sui, C.; Chen, M.; Xu, J.; Wei, J.; Jin, Y.; Xu, Y.; Sun, J.; Gao, K.; Yang, C.; Zhang, Z.; et al. Comparison of root transcriptomes and expressions of genes involved in main medicinal secondary metabolites from Bupleurum chinense and Bupleurum scorzonerifolium, the two Chinese official Radix bupleuri source species. Physiol. Plant. 2014, 153, 230–242. [Google Scholar] [CrossRef]
  48. Allwood, J.W.; Xu, Y.; Martinez-Martin, P.; Palau, R.; Cowan, A.; Goodacre, R.; Marshall, A.; Stewart, D.; Howarth, C. Rapid UHPLC-MS metabolite profiling and phenotypic assays reveal genotypic impacts of nitrogen supplementation in oats. Metabolomics 2019, 15, 42. [Google Scholar] [CrossRef] [Green Version]
  49. Shi, Z.G.; Wei, F.; Wan, R.; Wang, Y.J.; An, W.; Qin, K. Effect of different fertilizeation levels on N, P, K contents and resistance of “0909” wolfberry leaves. North. Hortic. 2016, 21, 165–170. [Google Scholar] [CrossRef]
  50. Sun, C.-H.; Yu, J.-Q.; Hu, D.-G. Nitrate: A Crucial Signal during Lateral Roots Development. Front. Plant Sci. 2017, 8, 485. [Google Scholar] [CrossRef]
  51. Shi, Z.; Wei, F.; Wan, R.; Li, Y.; Wang, Y.; An, W.; Qin, K.; Dai, G.; Cao, Y.; Feng, J. Impact of Nitrogen Fertilizer Levels on Metabolite Profiling of the Lycium barbarum L. Fruit. Molecules 2019, 24, 3879. [Google Scholar] [CrossRef] [Green Version]
  52. Wang, F.; Wang, X.; Zhao, C.; Wang, J.; Li, P.; Dou, Y.; Bi, Y. Alternative pathway is involved in the tolerance of highland barley to the low-nitrogen stress by maintaining the cellular redox homeostasis. Plant Cell Rep. 2015, 35, 317–328. [Google Scholar] [CrossRef]
  53. Jin, J.; Wang, X.; Wang, J.; Li, K.; Wang, S.; Zhang, W.; Zhang, G.; Bi, Y. Glucose-6-Phosphate Dehydrogenase Is Involved in the Tolerance of Soybean Seedlings to Low Nitrogen Stress. Agronomy 2021, 11, 637. [Google Scholar] [CrossRef]
  54. Zhen, S.; Zhou, J.; Deng, X.; Zhu, G.; Cao, H.; Wang, Z.; Yan, Y. Metabolite profiling of the response to high-nitrogen fertilizer during grain development of bread wheat (Triticum aestivum L.). J. Cereal Sci. 2016, 69, 85–94. [Google Scholar] [CrossRef]
  55. Lerner, S.; Seghezzo, M.; Molfese, E.; Ponzio, N.; Cogliatti, M.; Rogers, W. N- and S-fertiliser effects on grain composition, industrial quality and end-use in durum wheat. J. Cereal Sci. 2006, 44, 2–11. [Google Scholar] [CrossRef]
  56. Ottaiano, L.; Di Mola, I.; Cozzolino, E.; El-Nakhel, C.; Rouphael, Y.; Mori, M. Biostimulant Application under Different Nitrogen Fertilization Levels: Assessment of Yield, Leaf Quality, and Nitrogen Metabolism of Tunnel-Grown Lettuce. Agronomy 2021, 11, 1613. [Google Scholar] [CrossRef]
  57. Liang, Z.; Oh, K.; Wang, Y.; Yi, T.; Chen, H.; Zhao, Z. Cell type-specific qualitative and quantitative analysis of saikosaponins in three Bupleurum species using laser microdissection and liquid chromatography–quadrupole/time of flight-mass spectrometry. J. Pharm. Biomed. Anal. 2014, 97, 157–165. [Google Scholar] [CrossRef] [Green Version]
  58. Zhu, Z.; Liang, Z.; Han, R.; Dong, J. Growth and saikosaponin production of the medicinal herb Bupleurum chinense DC. under different levels of nitrogen and phosphorus. Ind. Crop. Prod. 2009, 29, 96–101. [Google Scholar] [CrossRef]
  59. Kim, M.S.; Park, G.C.; Chung, B.J.; Park, T.D.; Kim, H.K.; Kim, H.W.; Park, I.J.; Kim, C.C.; Sim, J.H. Effect of organic fertilizers application on root yield and total saikosaponin contents in Bupleurum falcatum L. Korean J. Plant. Res. 1997, 10, 175–182. [Google Scholar]
  60. Zhu, Z.B.; Liang, Z.S.; Wei, X.R.; Mao, J.C. Study on nitrogen, phosphorus and organic manure fertilization recommendation of Bupleurum chinense DC. Plant Nutr. Fert. Sci. 2007, 13, 167–170. [Google Scholar] [CrossRef]
  61. Deep, K.; Prasad, V.M. Effect of Nitrogen, Potash and Boron on Plant Growth, Flowering, Fruit Drop and Fruit Setting of Pomegranate (Punica granatum) cv. Bhagwa. Int. J. Curr. Microbiol. Appl. Sci. 2020, 9, 2181–2185. [Google Scholar] [CrossRef]
  62. Cheng, Y.; Min, X.U.; Xiong, R.; Lin, J.; Yun, R.; Ren, T. Effects of different nitrogen treatments on pitaya fruit growth and quality under drip irrigation. J. Trop. Biol. 2020, 11, 25–30. [Google Scholar] [CrossRef]
  63. Gyuga, P.; Demagante, A.L.; Paulsen, G.M. Photosynthesis and grain growth of wheat under extreme nitrogen nutrition regimes during maturation. J. Plant Nutr. 2002, 25, 1281–1290. [Google Scholar] [CrossRef]
  64. Qu, H.; Cheng, L.; Chen, J.F.; Lu, X.Y.; Shen, Y.X. Effects of nitrogen on agronomic traits and dry matter yield and their relationship in sweet sorghum. Acta Prataculturae Sin. 2016, 25, 13–25. [Google Scholar] [CrossRef]
  65. Nagappan, S.; Devendran, S.; Tsai, P.-C.; Jayaraman, H.; Alagarsamy, V.; Pugazhendhi, A.; Ponnusamy, V.K. Metabolomics integrated with transcriptomics and proteomics: Evaluation of systems reaction to nitrogen deficiency stress in microalgae. Process. Biochem. 2019, 91, 1–14. [Google Scholar] [CrossRef]
  66. Vitousek, P.M.; Naylor, R.; Crews, T.; David, M.B.; Drinkwater, L.E.; Holland, E.; Johnes, P.J.; Katzenberger, J.; Martinelli, L.A.; Matson, P.A.; et al. Nutrient Imbalances in Agricultural Development. Science 2009, 324, 1519–1520. [Google Scholar] [CrossRef]
  67. Du, X.; Zhang, X.; Kong, L.; Xi, M. Split Application under Reduced Nitrogen Rate Favors High Yield by Altering Endogenous Hormones and C/N Ratio in Sweet Potato. Agronomy 2020, 10, 1243. [Google Scholar] [CrossRef]
  68. Schlüter, U.; Colmsee, C.; Scholz, U.; Bräutigam, A.; Weber, A.P.; Zellerhoff, N.; Bucher, M.; Fahnenstich, H.; Sonnewald, U. Adaptation of maize source leaf metabolism to stress related disturbances in carbon, nitrogen and phosphorus balance. BMC Genom. 2013, 14, 442. [Google Scholar] [CrossRef] [PubMed] [Green Version]
  69. Carvalhais, L.C.; Dennis, P.G.; Fedoseyenko, D.; Hajirezaei, M.-R.; Borriss, R.; von Wirén, N. Erratum: Root exudation of sugars, amino acids, and organic acids by maize as affected by nitrogen, phosphorus, potassium, and iron deficiency. J. Plant Nutr. Soil Sci. 2013, 176, 641. [Google Scholar] [CrossRef]
  70. Zhou, W.; Liang, X.; Li, K.; Dai, P.; Li, J.; Liang, B.; Sun, C.; Lin, X. Metabolomics analysis reveals potential mechanisms of phenolic accumulation in lettuce (Lactuca sativa L.) induced by low nitrogen supply. Plant Physiol. Biochem. 2021, 158, 446–453. [Google Scholar] [CrossRef]
  71. Yang, L.; Fountain, J.C.; Ji, P.; Ni, X.; Chen, S.; Lee, R.D.; Kemerait, R.C.; Guo, B. Deciphering drought-induced metabolic responses and regulation in developing maize kernels. Plant Biotechnol. J. 2018, 16, 1616–1628. [Google Scholar] [CrossRef] [PubMed] [Green Version]
  72. Stewart, A.J.; Chapman, W.; Jenkins, G.I.; Graham, I.; Martin, T.; Crozier, A. The effect of nitrogen and phosphorus deficiency on flavonol accumulation in plant tissues. Plant Cell Environ. 2002, 24, 1189–1197. [Google Scholar] [CrossRef]
  73. Larbat, R.; Olsen, K.M.; Slimestad, R.; Løvdal, T.; Bénard, C.; Verheul, M.; Bourgaud, F.; Robin, C.; Lillo, C. Influence of repeated short-term nitrogen limitations on leaf phenolics metabolism in tomato. Phytochemistry 2012, 77, 119–128. [Google Scholar] [CrossRef]
  74. Palumbo, M.J.; Putz, F.E.; Talcott, S.T. Nitrogen fertilizer and gender effects on the secondary metabolism of yaupon, a caffeine-containing North American holly. Oecologia 2006, 151, 1–9. [Google Scholar] [CrossRef] [PubMed]
  75. Wang, C.; An, L.W.; Li, J.C.; Qi, W.T.; Liu, C.L.; Li, L. Advances in bioculture technology of Bupleuri Radix and biosynthesis pathways of saikosaponins. Chin. J. Exp. Tradit. Med. Formulae 2019, 25, 228–234. [Google Scholar] [CrossRef]
  76. Eom, J.-S.; Choi, S.-B.; Ward, J.; Jeon, J.-S. The mechanism of phloem loading in rice (Oryza sativa). Mol. Cells 2012, 33, 431–438. [Google Scholar] [CrossRef] [PubMed] [Green Version]
  77. Ruan, Y.-L. Sucrose Metabolism: Gateway to Diverse Carbon Use and Sugar Signaling. Annu. Rev. Plant Biol. 2014, 65, 33–67. [Google Scholar] [CrossRef]
  78. Omondi, J.O.; Lazarovitch, N.; Rachmilevitch, S.; Kukew, T.; Yermiyahu, U.; Yasuor, H.; Naftali, L.; Shimon, R.; Uri, Y. Potassium and storage root development: Focusing on photosynthesis, metabolites and soluble carbohydrates in cassava. Physiol. Plant. 2020, 169, 169–178. [Google Scholar] [CrossRef]
  79. Geiger, D. Plant glucose transporter structure and function. Pflügers Arch. Eur. J. Physiol. 2020, 472, 1111–1128. [Google Scholar] [CrossRef] [PubMed]
  80. Fetike, J.; Fernie, A.R. Intracellular and cell-to-apoplast compartmentation of carbohydrate metabolism. Trends Plant Sci. 2015, 20, 490–497. [Google Scholar] [CrossRef]
  81. Zhang, L.; Sun, S.; Liang, Y.; Li, B.; Ma, S.; Wang, Z.; Ma, B.; Li, M. Nitrogen Levels Regulate Sugar Metabolism and Transport in the Shoot Tips of Crabapple Plants. Front. Plant Sci. 2021, 12, 626149. [Google Scholar] [CrossRef]
  82. Sweetlove, L.J.; Beard, K.F.; Nunes-Nesi, A.; Fernie, A.R.; Ratcliffe, R.G. Not just a circle: Flux modes in the plant TCA cycle. Trends Plant Sci. 2010, 15, 462–470. [Google Scholar] [CrossRef]
  83. Liu, Y.; Liu, J.; Liu, M.; Liu, Y.; Strappe, P.; Sun, H.; Zhou, Z. Comparative non-targeted metabolomic analysis reveals insights into the mechanism of rice yellowing. Food Chem. 2020, 308, 125621. [Google Scholar] [CrossRef]
  84. Xiao, J.; Gu, C.; He, S.; Zhu, D.; Huang, Y.; Zhou, Q. Widely targeted metabolomics analysis reveals new biomarkers and mechanistic insights on chestnut (Castanea mollissima Bl.) calcification process. Food Res. Int. 2021, 141, 110128. [Google Scholar] [CrossRef] [PubMed]
  85. Tilsner, J.; Kassner, N.; Struck, C.; Lohaus, G. Amino acid contents and transport in oilseed rape (Brassica napus L.) under different nitrogen conditions. Planta 2005, 221, 328–338. [Google Scholar] [CrossRef]
  86. Urbanczyk-Wochniak, E.; Fernie, A.R. Metabolic profiling reveals altered nitrogen nutrient regimes have diverse effects on the metabolism of hydroponically-grown tomato (Solanum lycopersicum) plants. J. Exp. Bot. 2005, 56, 309–321. [Google Scholar] [CrossRef] [PubMed] [Green Version]
  87. Goel, P.; Singh, A.K. Abiotic Stresses Downregulate Key Genes Involved in Nitrogen Uptake and Assimilation in Brassica juncea L. PLoS ONE 2015, 10, e0143645. [Google Scholar] [CrossRef]
  88. Cao, Y.-W.; Qu, R.-J.; Tang, X.-Q.; Sun, L.-Q.; Chen, Q.-Q.; Miao, Y.-J. UPLC-Triple TOF-MS/MS based metabolomics approach to reveal the influence of nitrogen levels on Isatis indigotica seedling leaf. Sci. Hortic. 2020, 266, 109280. [Google Scholar] [CrossRef]
  89. Zhang, Y.L. The Characteristics of Soil Granularity and its Environmental Significance in Typical Black Soil Area in Northeast China. Master’s Thesis, Harbin Normal University, Harbin, China, 2017. [Google Scholar]
  90. Guo, J. Study on the Evaluation of Cultivated Land Ecological Security in Lindian Country. Master’s Thesis, Northeast Agricultural University, Harbin, China, 2020. [Google Scholar] [CrossRef]
  91. Azam, M.; Qadri, R.; Aslam, A.; Khan, I.M.; Khan, A.S.; Anwar, R.; Ghani, A.M.; Ejaz, S.; Hussain, Z.; Iqbal, A.M.; et al. Effects of different combinations of N, P and K at different time interval on vegetative, reproductive, yield and quality traits of mango (Mangifera Indica. L) cv. Dusehri. Braz. J. Biol. 2021, 82, e235612. [Google Scholar] [CrossRef]
  92. Agbede, T.M. Effect of tillage, biochar, poultry manure and NPK 15-15-15 fertilizer, and their mixture on soil properties, growth and carrot (Daucus carota L.) yield under tropical conditions. Heliyon 2021, 24, e07391. [Google Scholar] [CrossRef] [PubMed]
  93. Singh, S.; Kumari, R.; Agrawal, M.; Agrawal, S. Modification in growth, biomass and yield of radish under supplemental UV-B at different NPK levels. Ecotoxicol. Environ. Saf. 2011, 74, 897–903. [Google Scholar] [CrossRef]
Figure 1. Growth performances of Bupleurum at three nitrogen fertilization levels within four organs. (A) The whole Bupleurum was divided into four organs, including root, main shoots, lateral shoots and flower; (B) Appearances of Bupleurum growing under CN, LN and HN, respectively; (C) The four organs’ fresh weights (n = 3); (D) The length of the whole plant and the different parts (n = 3). Three nitrogen fertilization levels—CN: control nitrogen group, LN: low-nitrogen group, and HN: high-nitrogen group; four organs—R: root, MS: main shoots, LS: lateral shoots, F: flower, and W: whole plant. * and ** signify significant (p < 0.05) and extremely significant (p < 0.01), respectively.
Agronomy 11 02291 g001
Figure 2. Saikosaponins content at three nitrogen fertilization levels within four organs. (A) Total saikosaponins content, including saikosaponin A, saikosaponin C and saikosaponin D; (B) The percentage of saikosaponin A, saikosaponin C and saikosaponin D content. Three nitrogen fertilization levels: control nitrogen group (CN), low-nitrogen (LN) and high-nitrogen group (HN); four organs: flower (F), main shoots (MS), lateral shoots (LS) and root (R).
Agronomy 11 02291 g002
Figure 3. (A) Classification of 84 metabolites based on Bupleurum. (B) The cluster analysis and heat map for 84 metabolites under different levels of nitrogen fertilization and in different plant parts. CN: control nitrogen; LN: low nitrogen; HN: high nitrogen; R: root; MS: main shoots; LS: lateral shoots; F: flower. The up−regulated and down−regulated metabolites are represented as yellow and blue, respectively. The green color means that abundance is 0, as shown in the upper right-hand bar.
Agronomy 11 02291 g003
Figure 4. PLS−DA score plot classifying the CN, LN and HN groups from metabolites of Bupleurum in flowers, lateral shoots, main shoots and roots (AD), respectively. Different markers and colors represent different meanings: ● represents roots (R), ◆ represents flowers (F), ▲ represents lateral shoots (LS), ★ represents main shoots (MS); red, green and blue represent high nitrogen (HN) groups, low nitrogen (LN) and control nitrogen (CN), respectively.
Agronomy 11 02291 g004
Figure 5. (AF) The volcanic map of differential metabolites and enrichment analysis of the Kyoto Encyclopedia of Genes and Genomes (KEGG). The green and red represent metabolism contents that were down−regulated and up−regulated significantly under nitrogen fertilization, respectively. High nitrogen (HN) groups, low nitrogen (LN) and control nitrogen (CN); ▼ represents roots; ▲ represents main shoots; ■ represents lateral shoots; ● represents flowers. The p−value means degree of enrichment; the smaller the p-value, the more significant enrichment degree. The size of the dot means the number of differential metabolites. (G) The Venn diagram of differential metabolites.
Agronomy 11 02291 g005
Figure 6. Changes of metabolites in Bupleurum under nitrogen stress are mapped to metabolic pathways. The yellow rectangle means that the content of metabolites is significantly up−regulated; the blue rectangle means that the content of metabolites is significantly down−regulated; the green rectangles mean that there is no significant difference in metaboites content. In each box, every row represents nitrogen treatment (upper row: CN; middle row: LN; lower row: HN), and every column means various organs (F: flower; LS: lateral shoots; MS: main shoots; R: roots).
Agronomy 11 02291 g006
Table 1. Classification of 84 metabolites based on Bupleurum.
ClassificationQuantityMetabolites
Organic acids and derivatives281-Aminocyclopentanecarboxylic acid
5-O-Feruloylquinic acid
Benzoic acid
Butanedioic acid
Caffeic acid
Chlorogenic acid
Citric acid
D-Gluconic acid
Galactaric acid
Gallic acid
Glycolic acid
Hydroxybenzoic acid
Isophthalic acid
Lactic Acid
Malic acid
Oxalic acid
Palmitic Acid
Phenyllactic acid
Phosphonic acid
Phthalic acid
Pipecolic acid
Propanedioic acid
Propenoic acid
Protocatechoic acid
Quininic acid
Succinic acid
Sulfurous acid
Trifluorobenzoic acid
Sugars16Sucrose
Arabinofuranose
Arabinose
D-Cellobiose
D-Fructose
D-Glucose
D-Mannose
D-Xylose
Erythritol
Galactoseoxime
Lactose
Levoglucosan
L-Rhamnose
Maltose
Sedoheptulose
α-Mannobiose
Polyols6Benzylaminooctanol
Benzenediol
Cuminyl alcohol
Inositol
Muco-Inositol
Ribitol
Glycosides3α-Lyxofuranoside
α-D-glucopyranoside
L-Galactopyranoside
Alkyl9Cyclohexene
Decane
Disiloxane
Ether
Heptane
Nonane
Silane
Trisiloxane
Undecane
Phenylpropanoid1Dihydroxybenzoate
Alkaloids6Isoquinolinium
Ethanolamine
Copper phthalocyanine
Heptabarbital
Benzopyran-4-one
Carbamate
Amino acid and derivatives8Alanine
Aminobutanoic acid
Glycine
L-5-Oxoproline
L-Proline
Serine
Urea
L-Valine
Lipids and derivatives7Glyceric acid
Glycerol monostearate
Stearic acid
Glycerol
Ribonic acid
Adenosine
1-Monopalmitin
Publisher’s Note: MDPI stays neutral with regard to jurisdictional claims in published maps and institutional affiliations.

