Article

Climate Changes Challenges to the Management of Mediterranean Montado Ecosystem: Perspectives for Use of Precision Agriculture Technologies

1
MED-Mediterranean Institute for Agriculture, Environment and Development, Instituto de Investigação e Formação Avançada, Universidade de Évora, Pólo da Mitra, Ap. 94, 7006-554 Évora, Portugal
2
Agroinsider Lda. (spin-off da Universidade de Évora), PITE, R. Circular Norte, NERE, Sala 18, 7005-841 Évora, Portugal
*
Author to whom correspondence should be addressed.
Agronomy 2020, 10(2), 218; https://doi.org/10.3390/agronomy10020218
Submission received: 21 December 2019 / Revised: 29 January 2020 / Accepted: 31 January 2020 / Published: 3 February 2020
(This article belongs to the Special Issue Selected Papers from 10th Iberian Agroengineering Congress)

Abstract

:
Montado is an agro-silvo-pastoral system characterized by a high complexity as a result of the interactions between climate, soil, pasture, trees, and animals. It is in this context that management decisions must be made, for example with respect to soil fertilization, grazing, or animal supplementation. In this work, the effect of the tree canopy on the spatial and temporal variability of the soil and productivity, quality, and floristic composition of the pasture was evaluated. Precision agriculture (PA) technologies for monitoring soil and pasture were also evaluated. The study was carried out between October 2015 and June 2018 in an experimental field of 2.3 ha. The results showed: (i) The positive impact of trees and animal grazing on soil fertility; (ii) the influence of inter-annual variability of precipitation on the pattern of pasture vegetative cycle; (iii) the positive effect of trees in pasture quality; (iv) the negative effect of trees in pasture productivity; (v) the role of pasture floristic composition as an indicator of soil limitations or climatic changes; (vi) the potential of technologies associated with the concept of PA as express tools to decision making support and for the optimization of the herbaceous stratum and the dynamic management of grazing in this ecosystem in a holistic and sustainable form.

1. Introduction

The most significant agricultural system practiced on shallow and acidic soils of the south of Portugal is the agro-forestry-pastoral Montado system [1]. This system is characterized by a high complexity resulting from the interactions between climate, soil, pasture, trees, and animals [2]. Montado and pasture production are very important farming systems since, in Portugal, this ecosystem represents 33% of total forest area [2] and in Europe, grasslands cover 22% of the land area [3]. Since the turn of the new millennium, greater recognition of the importance of grasslands in conserving soil, promoting biodiversity, stabilizing farming communities, and providing a wealth of natural ecosystem services has led to renewed interest in the dynamics of grasslands function [4].
In the Mediterranean climate, characterized by strong seasonality and inter-annual irregularity, pasture availability and quality vary significantly throughout the year, with a surplus of production during spring and scarcity during summer [5], and also from year to year, depending mainly on the distribution of rainfall in the autumn, winter, and spring [6]. This variability assumes a spatial dimension at soil level [7]. The presence of trees and grazing animals can accentuate this spatial and temporal variability in soil fertility and pasture productivity [7,8]. The studies of Sales-Baptista et al. [5,9] and Serrano et al. [10], with the use of global positioning system (GPS) collars in sheep, have demonstrated the possibility of monitoring grazing preferences of the animals, their choices along the vegetative cycle, and proved the effect of grazing on the nutrient dynamics in the soil.
Several studies have also been published that evaluate the effect of trees or the combined effect of trees and animal grazing on soil fertility and pasture development. It is generally recognized that this has a positive effect on soil fertility [11,12,13]. The effect of trees on pasture is not consensual, depending on tree species and age, hence foliage density, and tree density itself [12]. While higher soil fertility under trees would tend to provide conditions for higher productivity [14], lower incidence of solar radiation under tree canopy (UTC) tends to decrease biomass production [12]. Regarding pasture quality, the immediate effect of lower incidence of sunlight UTC tends to slow the evolution of the vegetative cycle of the plants, showing, compared to plants that develop outside tree canopy (OTC), less maturity (maintaining younger) and higher crude protein (CP) values [15]. However, the botanical composition of pasture UTC generally deteriorates over time because there is a decline in legumes and an increase of grasses, likely related to their shade tolerance and to the increase in the content of litter and organic matter [12]. There is therefore some doubt about how trees affect soil and pasture development and what their true role is as structures that can increase animal resilience to climate change. The frequency and severity of storms and droughts are predicted to increase, constituting a continuing source of disruption to ecosystems, and spaced trees will have an important role in mitigating the effects of such extreme weather events [12,16].
It is in this unpredictable context that management decisions have to be made, for example with respect to soil fertilization, grazing, or animal supplementation [17]. It is therefore very interesting to use express tools that can help monitor the relevant variables in the decision-making process. The success of precision agriculture (PA) technologies in pasture is linked to the information integration provided by multiple sensors for monitoring plant, soil, and cattle grazing dynamics. These measures, along with more traditional measures, provide the farmer with a much better understanding of the livestock system and allow him to formulate the most appropriate management strategy [18].
One of the most common decisions, prompted by the existence of usually poor and acidic soils, is related to fertilization and soil amendment [1,6], which presupposes the identification of variability of soil nutrient content and definition of homogeneous management zones (HMZ) [19]. Several studies have been carried out with this methodology, mostly proposing soil apparent electrical conductivity (ECa) measurement and the use of Normalized Difference Vegetation Index (NDVI), obtained by remote sensing (RS) or proximal sensing (PS) [20], for the variable application approach (with variable rate technology, VRT). Pioneering works of Corwin and Lesch [21] or Sudduth et al. [22] showed significant correlations of the geospatial measurement of ECa with soil clay, CEC, or SMC properties that have a dominant influence on plant growth and yield [23], which justifies the use of ECa in the early phase of the PA cycle to identify soil variability [20].
Another prevailing management decision in this ecosystem relates to grazing (dynamic grazing, under- and over-grazing), which requires knowledge of pasture productivity and quality [5]. Serrano et al. [24] demonstrated the interest in the use of the Grassmaster II probe to expedite pasture yield estimation. Over the past decade, the use of proximal or remote sensing, based on the measurement of various indices, has assumed a strong expression in agriculture [25], with particular interest in the use of indices to monitor relevant variables (NDVI related to vegetative vigor; Normalized Difference Water Index, NDWI related to soil moisture content, SMC, or pasture moisture content, PMC) [17,26]. This type of information, such as NDVI, has revealed the potential for estimating pasture protein content and in supporting decisions on feed supplementation in late spring or early summer [17].
The aim of this paper is to evaluate: (i) The effect of the tree canopy on the spatial and temporal variability of the soil and pasture productivity, quality, and floristic composition; (ii) the potential of PA technologies to monitor the soil and evolution of pasture productivity and quality.

2. Materials and Methods

Figure 1 shows the chronological diagram of the activities carried out in this work of monitoring the Montado ecosystem at the Mitra experimental field between October 2015 and June 2018.

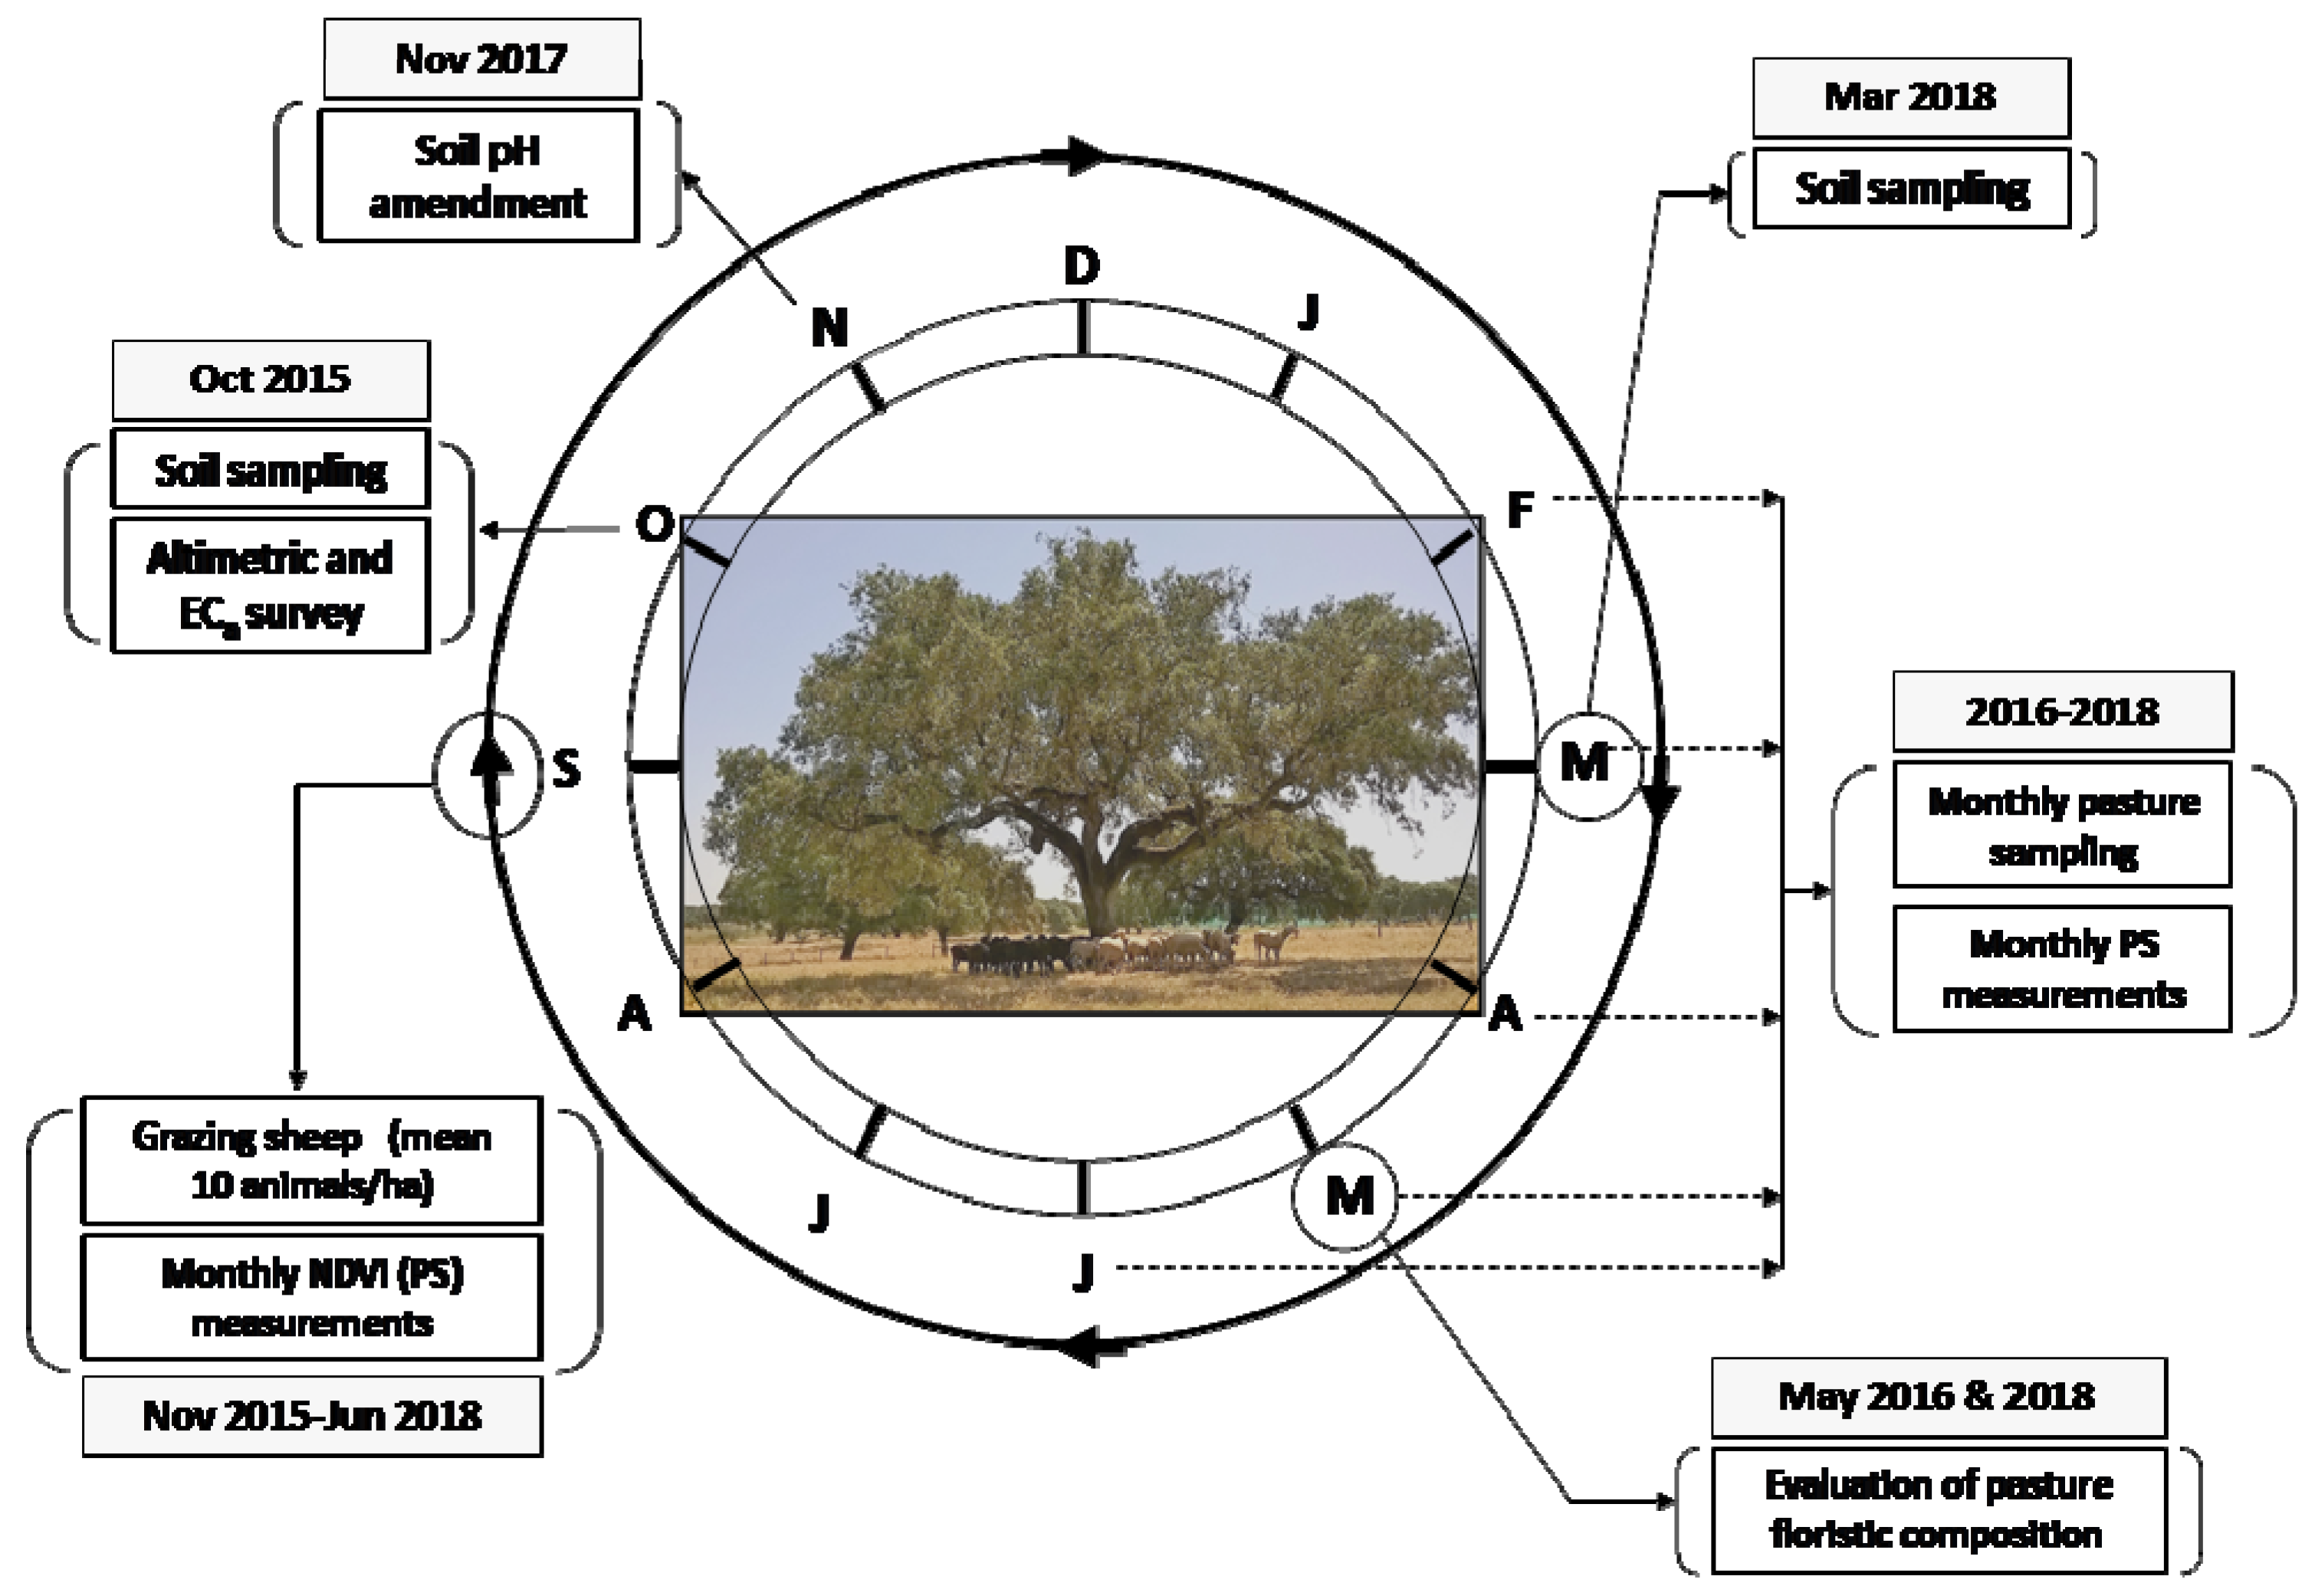
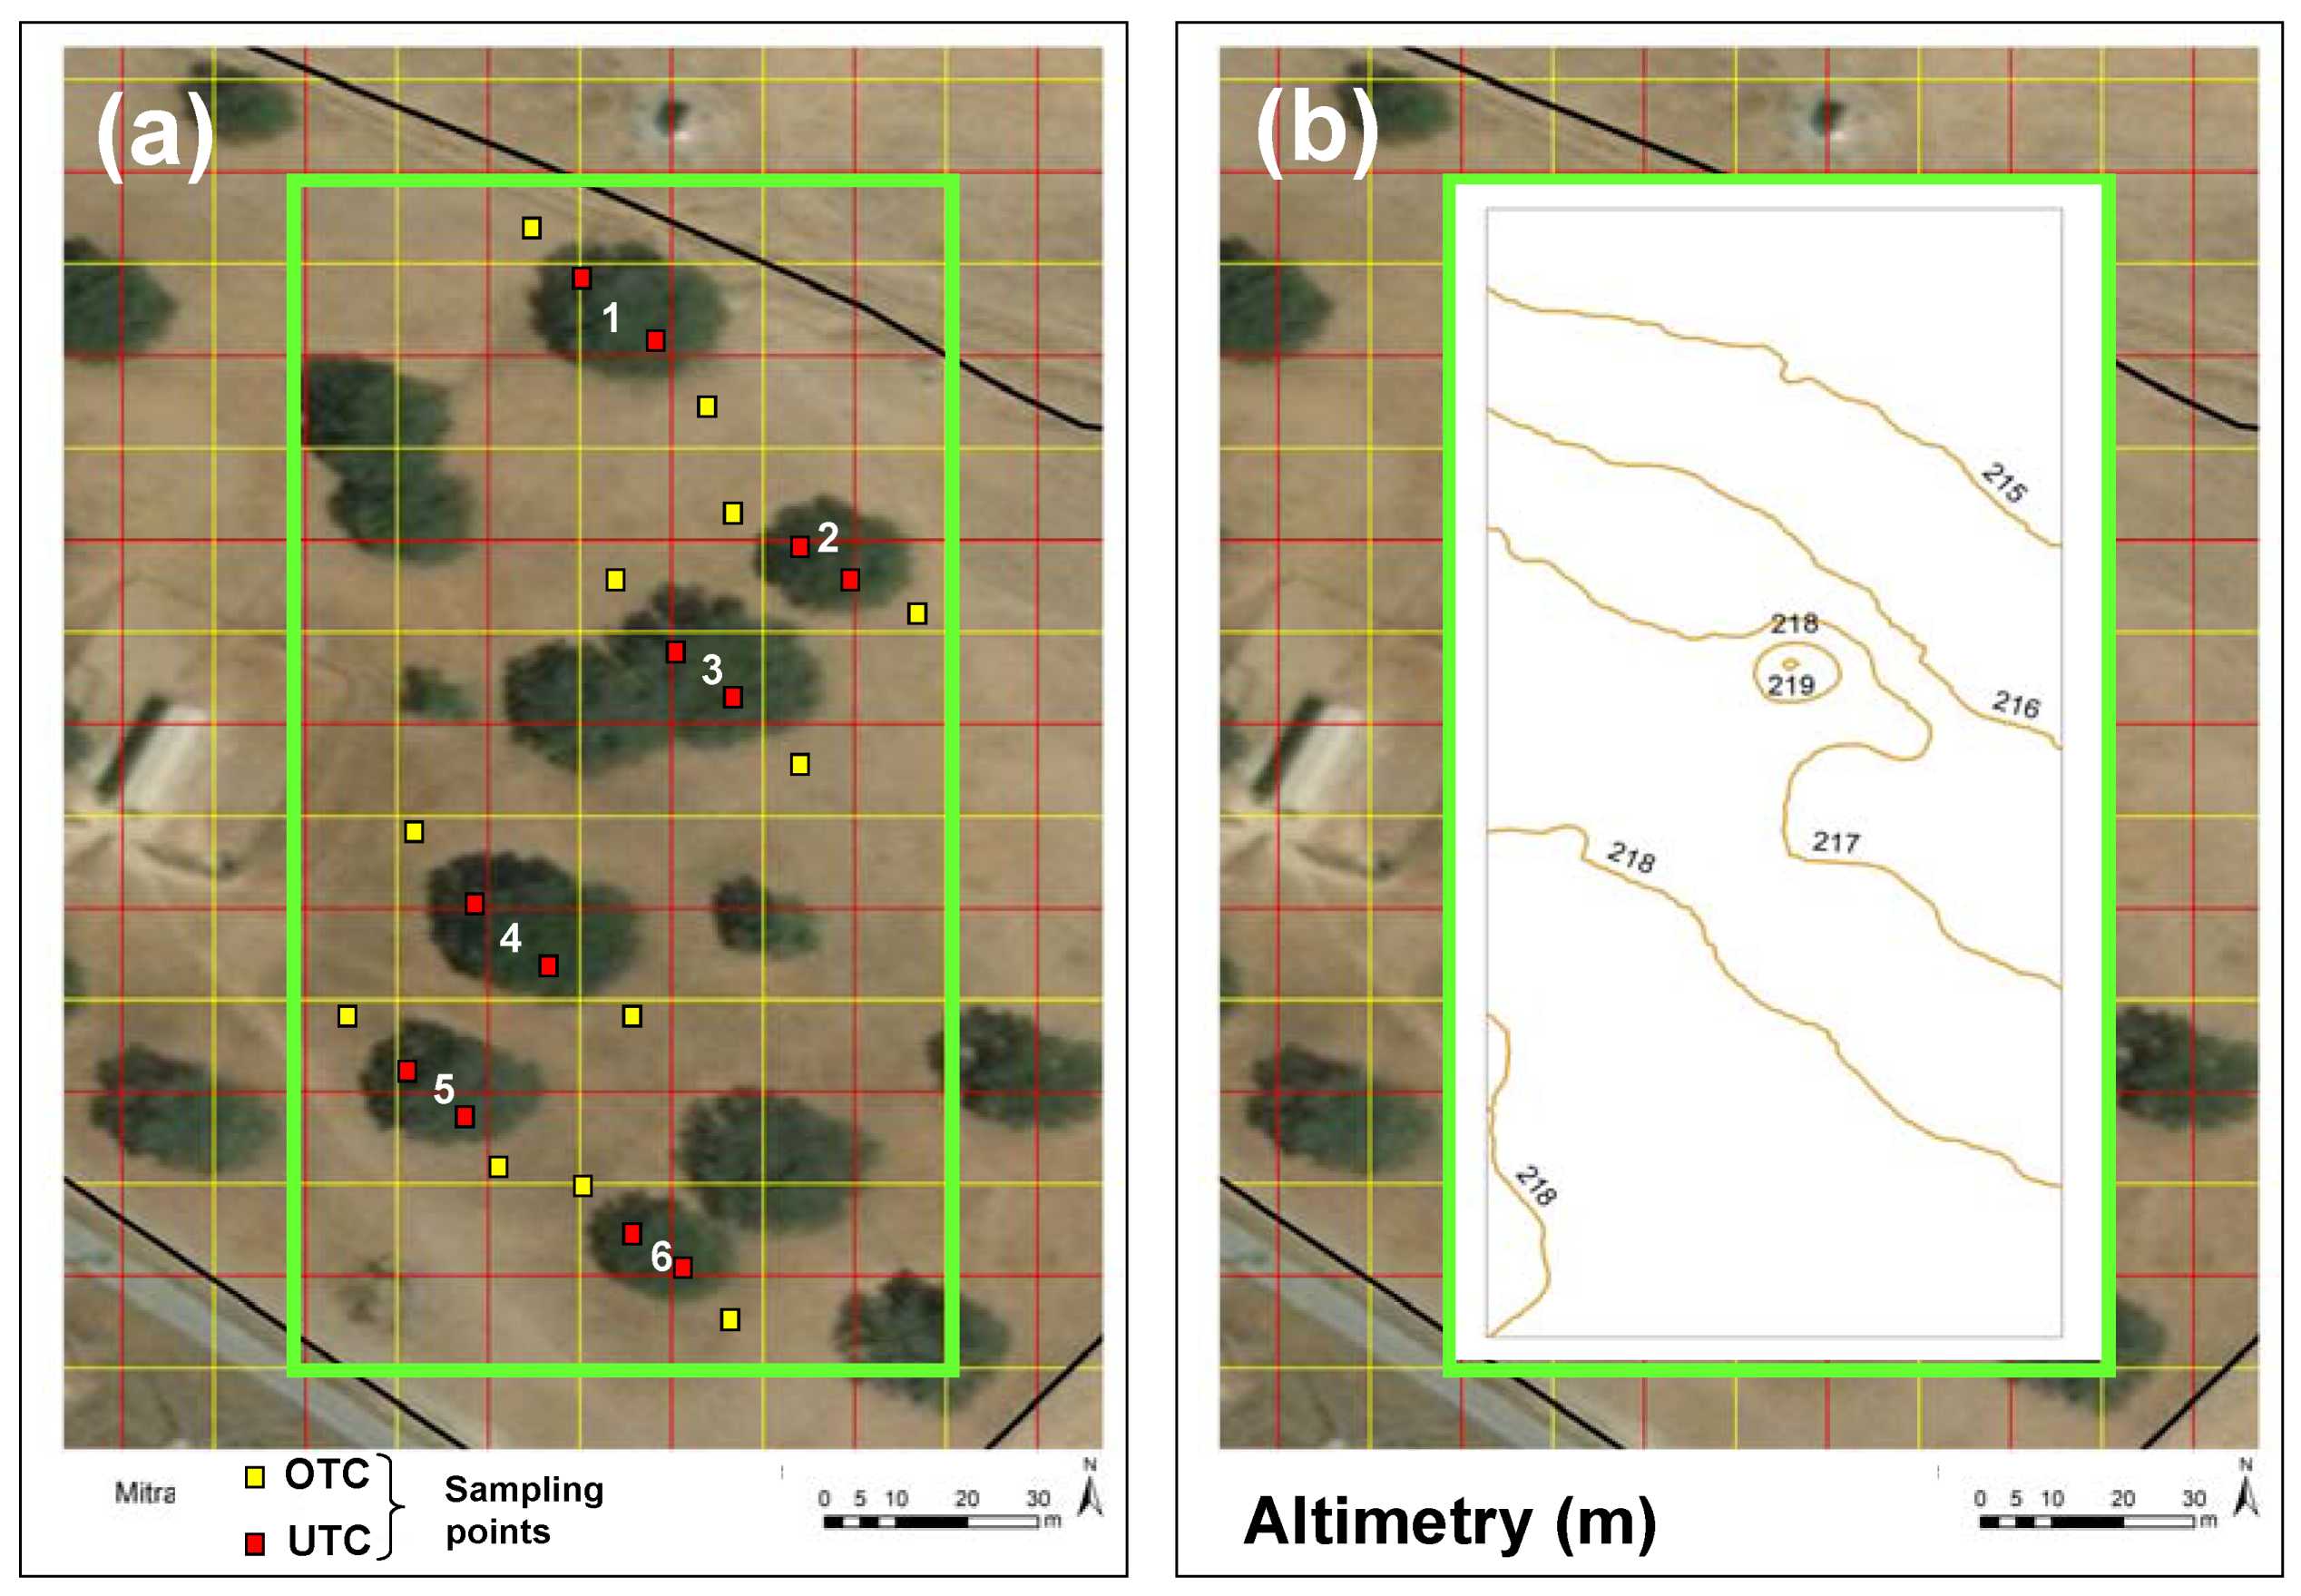
2.1. Experimental Field

In this work a permanent pasture of 70 m × 130 m (Figure 2a), inserted in a 2.3 ha area at Mitra experimental field (38°32.2′ N; 8°01.1′ W), of Quercus ilex ssp. rotundifolia Lam. (approximately 12 trees ha−1), and used for sheep grazing (mean number of 10 animals per hectare) was monitored. In this experimental area six trees were selected and 24 georeferenced sampling points were established, four for each tree, half UTC and half OTC. In each sampling point a grazing exclusion cage (dimensions of 0.50 m × 0.50 m) was installed.
Figure 2b shows the altimetric map, obtained from a topographic survey carried out during October 2015 using a real-time kinematic (RTK) GPS instrument (Trimble RTK/PP-4700 GPS manufactured by TRIMBLE Navigation Limited, USA). The slightly wavy relief of the field, with altimetry between 215 and 219 m, is representative of the dominant pattern in this region [6]. The digital surface elevation model (altimetry, Figure 2b) was created using the linear interpolation TIN tool from ArcGIS 9.3 and converted to a grid surface with a 1 m grid resolution.
This region integrates the “Csa- hot-summer Mediterranean climate” of spatial distribution of Köppen–Geiger climate groups [27], characterized by strong seasonality, with a wide amplitude of temperatures (exceeding 40 °C in summer and falling below 0 °C in winter), and precipitation (on average between 400 and 600 mm), with strong distribution irregularity. Figure 3 shows the monthly mean temperature and the monthly rainfall in Mitra meteorological station (Évora, Portugal), between September 2015 and August 2018.
The soil type is a Cambisol with a granite origin [28], characterized by slight or moderate weathering of parent material and by absence of appreciable quantities of illuviated clay, organic matter, aluminum, and/or iron compounds. These acid Cambisols are mainly used for mixed agro-silvo-pastoral systems.

2.2. Soil Measurements

2.2.1. Laboratory Determination of Soil Characteristics

In October 2015, soil samples were collected at the 24 sampling points at 0–0.30 m depth using a gouge auger and a hammer. These soil samples were inserted in plastic bags, air-dried, and analyzed for particle-size distribution (texture: Sand, silt, and clay content) using a sedimentograph (Sedigraph 5100, manufactured by Micromeritics), after passing the fine components through a 2 mm sieve. The fine soil (fraction with diameter < 2 mm) was characterized in terms of pH, organic matter (OM), cationic exchange capacity (CEC), phosphorus (P2O5), potassium (K2O), magnesium (Mg), and manganese (Mn). These fine components were analyzed using the following methods [29]: (i) For pH in 1:2.5 (soil:water) suspension, using the potentiometric method; (ii) the OM was measured by combustion and CO2 measurement, using an infrared detection cell; (iii) the CEC was measured by the neutral ammonium acetate method; (iv) the P2O5 and K2O were extracted by the Egner–Riehm method, and P2O5 was measured using colorimetric method, while K2O content was measured with a flame photometer; (v) the Mg and Mn were measured using atomic absorption spectrometry. A subsample of each soil sample was weighed, dried at 70 °C for 48 h, and then weighed again to establish the soil moisture content (SMC).
In March 2018 a new soil collection was carried out at the same depth and at the same 24 sampling points, with the main purpose of verifying the pH evolution, after the application, in November 2017, of dolomitic limestone (2000 kg by hectare). These soil samples were subjected to laboratory analysis to determine OM, pH, P2O5, K2O, Mg, and Mn using the above-mentioned analytical methods.

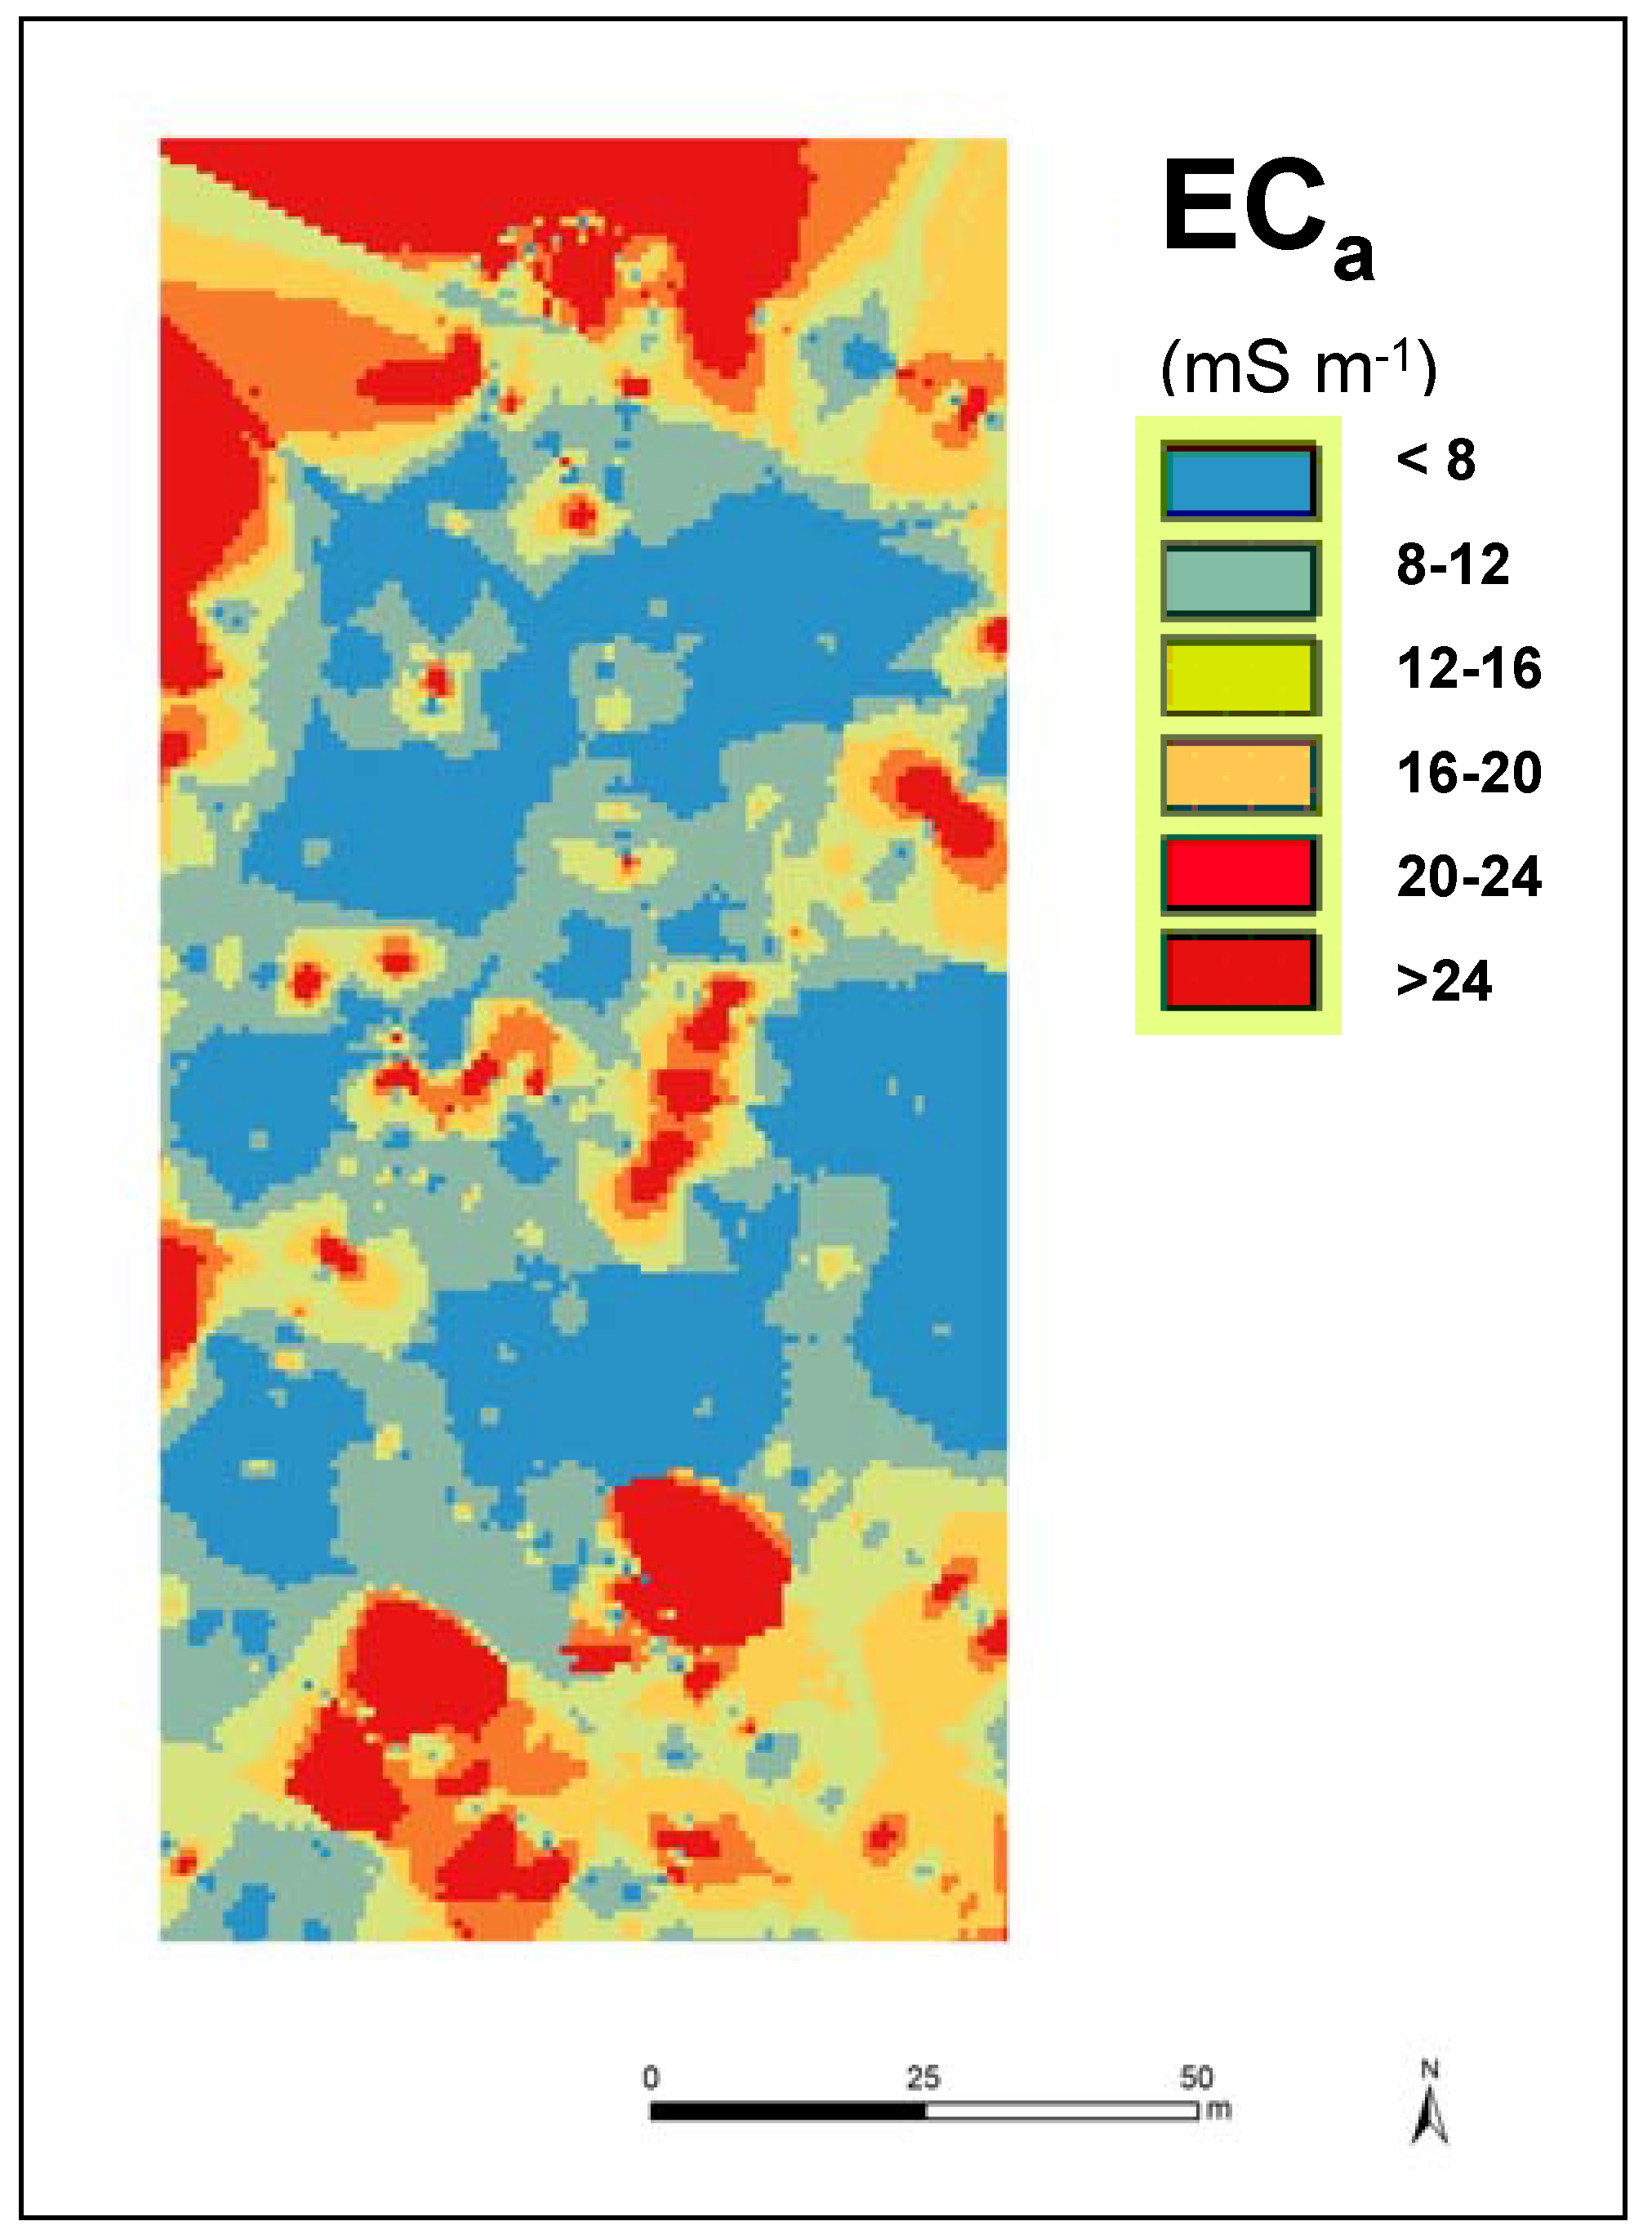
2.2.2. Soil Apparent Electrical Conductivity Survey

In October 2015, a survey of soil ECa was carried out with a Dualem 1S sensor (Dualem Inc., Milton, ON, Canada) in the 0–0.30 m soil layer. The sensor, equipped with a GPS antenna was manually transported by an operator, who made successive passages spaced 5 m apart. The ECa measurements were registered continuously every second. The spatial ECa map was created using the linear interpolation TIN tool from ArcGIS 9.3 and converted to a grid surface with a 1 m grid resolution.

2.2.3. Soil Moisture Content and Cone Index Measurements

Twenty-four plastic tubes were installed in the ground at up to 0.60 m depth, 12 UTC and 12 OTC. These probe access tubes permit rapid, reliable, and non-destructive recording of SMC profiles using portable time domain reflectometry (TDR) probes (TRIME-FM, IMKO—Micromodultechnik, GmbH, Ettlingen, Germany). The measurements were carried out monthly between February and June 2017 and 2018 at the following depths: 0.10, 0.20, 0.30, 0.40, 0.50, and 0.60 m. In this study the average SMC values measured between 0 and 0.30 m depth were used.
Cone penetrometer electronic FieldScout SC 900 (Spectrum Technologies, Aurora, IL, USA) was used to measure the cone index (CI, in kPa) in the 24 sampling points, monthly between February and June 2017 and 2018. In this study the CI values between 0–0.45 m, average of all monthly measurements are used.

2.3. Pasture Measurements

2.3.1. Proximal Sensors Measurements

Pasture photosynthetically active radiation (PAR; spectral range of 400–700 nm) of 24 sampling points was measured by a ceptometer (AccuPAR LP-80, Decagon Devices, Pullman, WA, USA) in mid-February and May 2018, at three different times: 10 a.m., 1 p.m., and 4 p.m.
Infrared thermography images were obtained from each sampling point monthly between February (or March) and June of 2016, 2017, and 2018 using an infrared camera (ThermaCAMTM FLIR Systems, Wilsonville, OR, USA). Measurements were always performed at the same time (9 a.m.). Thermography images were analyzed using a ResearchIR® 3.0 (FLIR Systems, Wilsonville, OR, USA) and data from each infrared image was exported to a spreadsheet where the information was processed in order to calculate the mean, standard deviation, and range of pasture surface temperature.
Pasture vegetation index (Normalized Difference Vegetation Index, NDVI) was measured in all 24 sampling points with an active optical sensor (AOS, OptRxTM, Ag Leader, Ames, IA, USA). Measurements were carried out monthly between November 2015 and June 2018. The sensor, placed 0.5 m above the pasture, measures simultaneously three visible and infrared bands: (i) RED (670 nm); (ii) RED EDGE (728 nm); and (iii) Near InfraRed (NIR, 775 nm). With two of the above-mentioned spectral bands NDVI vegetation index was calculated considering the expression of Equation (1). The operator stood still at the area of each geo-referenced point and performed measurements for a two-minute period. The values of NDVI were organized in a spreadsheet and associated with the coordinates of the respective sampling points to calculate the mean, standard deviation and range.
N D V I =   N I R RED N I R + RED
Pasture biomass estimation was carried out monthly between February (or March) and June of 2016, 2017, and 2018 with an electronic capacitance probe (Grassmaster II, Novel Ways Electronic, Hamilton, New Zealand). The capacitance readings (CMR) were registered after the instrument had been positioned vertically over the vegetation, some 0.2–0.3 m away from the operator’s body. In each of 24 sampling points, ten readings were performed and averaged.

2.3.2. Pasture Samples Collection and Analysis

Pasture samples were collected within each sampling area monthly between February or March and June of each year (2016, 2017, and 2018). At each sampling point, pasture was cut at 1 to 2 cm above ground. It was then (i) weighted immediately to obtain fresh mass (green matter, GM, kg·ha−1); (ii) dehydrated (72 h at 65 °C); and (iii) weighted again, in order to obtain pasture moisture content (PMC, %). The dehydrated samples were analyzed in order to determine the content of CP (%) and neutral detergent fiber (NDF, %) using conventional methods of wet chemistry according to the Association of Official Analytical Chemists [30]. The pasture quality degradation index (“PQDI”, Equation (2)) was then calculated based on the ratio of these two parameters.
P Q D I =   N D F C P
During the pasture flowering period (May 2016 and 2018), a floristic inventory of species and families present in each of the sampling points was carried out by an expert in conservation biology based on the phytosociological method of Braun-Blanquet [31]. In each sampling area (0.025 m2), the percentage of coverage by each species was recorded.

2.4. Statistical Analysis of the Data

Descriptive statistics analysis, including mean, standard deviation (SD), coefficient of variation (CV), and range, were determined for each data set of soil, pasture, and sensor parameters. Statistical procedures were performed using ‘MSTAT-C’ software with a significance level of 95% (p < 0.05). The inferential statistical treatment of the results consisted of analysis of variance. Least-square differences test (Fisher’s least significant difference) was used to determine significant differences among means of parameters in two situations: UTC and OTC. Regression analysis was used to study the relationships between soil, pasture, and sensor parameters.

3. Results

3.1. Seasonality and Interannual Climate Variability

The typical climatic seasonality of this region (Figure 3) is reflected in the vegetative growth of the pasture. Figure 4 shows the evolution of NDVI measured monthly by the OptRx active optical sensor over the period of this study. The standard pattern indicates minimum NDVI values (around 0.2) in the summer months (July–September), when low rainfall is combined with average temperatures around 25 °C (Figure 3), and maximum temperatures may reach at 40 °C. During autumn (October–December) there is a very significant increase in NDVI, depending on the distribution of rainfall over this period. In winter, usually between February and March, NDVI reaches its peak (around 0.8). From this point on, the clear rise in temperatures accelerates the pasture vegetative cycle, with the NDVI decreasing more or less sharply, depending once again on the amount of rainfall that occurs during this period.
In addition to climatic seasonality, during the study period there was an important inter-annual variability. Figure 5a shows the irregular quarterly (seasonal) and annual distribution of accumulated rainfall in the agricultural years 2015–2016, 2016–2017, and 2017–2018.
The accumulated precipitation was 547 mm, 421 mm, and 612 mm, respectively, however, while in 2015–2016 the precipitation occurred evenly in the seasons in which there is vegetative development in this region (autumn, winter and spring), 2016–2017 presented a relatively dry spring (119 mm between March and May), and 2017–2018 presented a dry autumn (52 mm between September and November) and a very rainy spring (361 mm between March and May). The irregularity of rainfall distribution is aggravated by the trend in average temperature. Figure 5b, which compares the evolution of the monthly average temperature of the period of 30 years between 1981 and 2010 with the same average parameter of the last three years (September 2015–August 2018) shows, on the other hand, a tendency for the average temperature to fall by 3–5 °C in the months of September, October, and November (autumn) and a tendency to rise by an average temperature of 2–3 °C in the months of April, May, and June (spring).

3.2. Soil Spatial and Temporal Variability

Table 1 summarizes the results of the descriptive statistical analyses of soil characteristics in October 2015 and March 2018.
Table 1 (October 2015) highlights some of the main limitations of these soils: Acidic pH (5.4 ± 0.3), poor in clay (9.3 ± 1.4%) and CEC (7.3 ± 1.2 cmol kg−1), and low ratio Mg/Mn (close to 1). In March 2018, after the pH amendment (application of 2000 kg ha−1 of dolomitic limestone in November 2017), there was a slight rise in pH (5.6 ± 0.3) and a strong improvement in the Mg / Mn ratio (close to 3) as this dolomitic limestone is rich in Ca and Mg. The OM also had higher average values in March 2018, which is a good indicator of the effect of interactions with trees and grazing animals. The important spatial variability of soil parameters is also evident and reflected in the high CV, especially in OM (30%–40%) and nutrient availability (P2O5, K2O, Mg, Mn; 25%–70%). Parameters such as CEC, clay and silt soil content have CV of approximately 15%, while pH and sand fractions have CV of approximately 5%.
Table 1 also shows the mean comparison of soil parameters UTC and OTC. No significant differences were found in texture and pH but soil UTC had significantly (p < 0.05%) higher levels of OM, CEC, P2O5, K2O, Mg, and Mn.

3.3. Spatial and Temporal Variability of Pasture Productivity and Quality

Table 2, Table 3 and Table 4 summarize the results of the descriptive statistical analyses of monthly pasture biomass (kg ha−1; Table 2), CP (%; Table 3), fiber (NDF, %; Table 3), pasture moisture content (PMC, %; Table 4), and pasture quality degradation index (PQDI; Table 4). Some aspects to highlight regarding spatial variability are: (i) High spatial variability of biomass (CV between 30%–65%); (ii) moderate variability of CP and NDF (overall CV < 30%); (iii) relatively low variability of PMC (overall CV < 10% except in June 2017, when PMC levels reached very low values). The pattern of evolution of these parameters in the growing season between February and June showed: (i) A peak of biomass production between April and May; (ii) decreasing trend of pasture quality indicators PMC and CP; (iii) trend towards worsening of indicators of pasture quality degradation NDF and PQDI. Any of these trends was more or less clear each year, depending on the distribution of precipitation. Table 2, Table 3 and Table 4 also demonstrate the different evolution of pasture productivity and quality parameters UTC and OTC. Tree canopy proved to be unfavorable to productivity (biomass), however, it had a significant advantage regarding pasture quality (higher CP values and lower NDF values). This positive effect of tree canopy, leading to the prolongation of the period of higher vegetative vigor, was clearly evident in the PQDI pattern.

3.4. Spatial and Temporal Variability of Pasture Floristic Composition

Table 5 shows the floristic composition of pasture (mean cover) in terms of botanical species in spring 2016 and spring 2018, UTC and OTC. The results show temporal but also spatial differences. The number of botanical species was always higher OTC (30 in 2016 and 15 in 2018) than UTC (26 in 2016 and 10 in 2018). From spring 2016 to spring 2018, the total number of species decreased from 33 to 20, with alteration of the predominant species, as well as a different floristic composition UTC and OTC. Shaded values in Table 5 indicate the predominant species in each year, UTC and OTC. In 2016, the clearly predominant species UTC was Erodium moschatum (40.2% mean cover), while OTC was not a predominant species, the species more representative were Chamaemelum mixtum (17.0%) and Erodium moschatum (15.6%). In 2018, there was a clear predominance of two species in UTC, which occupied about 80% of the area (Bromus diandrus—42.8%; and Erodium moschatum—36.2%), while OTC the predominance was now of the Erodium moschatum (37.9%) species, with a cover area equivalent to almost double the cover area of the second most representative species (Bromus diandrus—19.4%).

3.5. Spatial Variability of Apparent Soil Electrical Conductivity

Figure 6 shows the map of ECa of the study area measured in October 2015. This parameter had a mean value of 11.6 ± 3.3 mS m−1, which, considering the dimensions of the study area, reflects a strong spatial variability (CV = 28.7%), with preponderance of values below 8 mS m−1, particularly in the central area of the field. These relatively low ECa values are related to coarse soil texture (average clay of 9.3 ± 1.4%), poor CEC (average 7.3 ± 1.2 cmol kg−1), and reduced SMC (average value of 9.5 ± 1.4%).

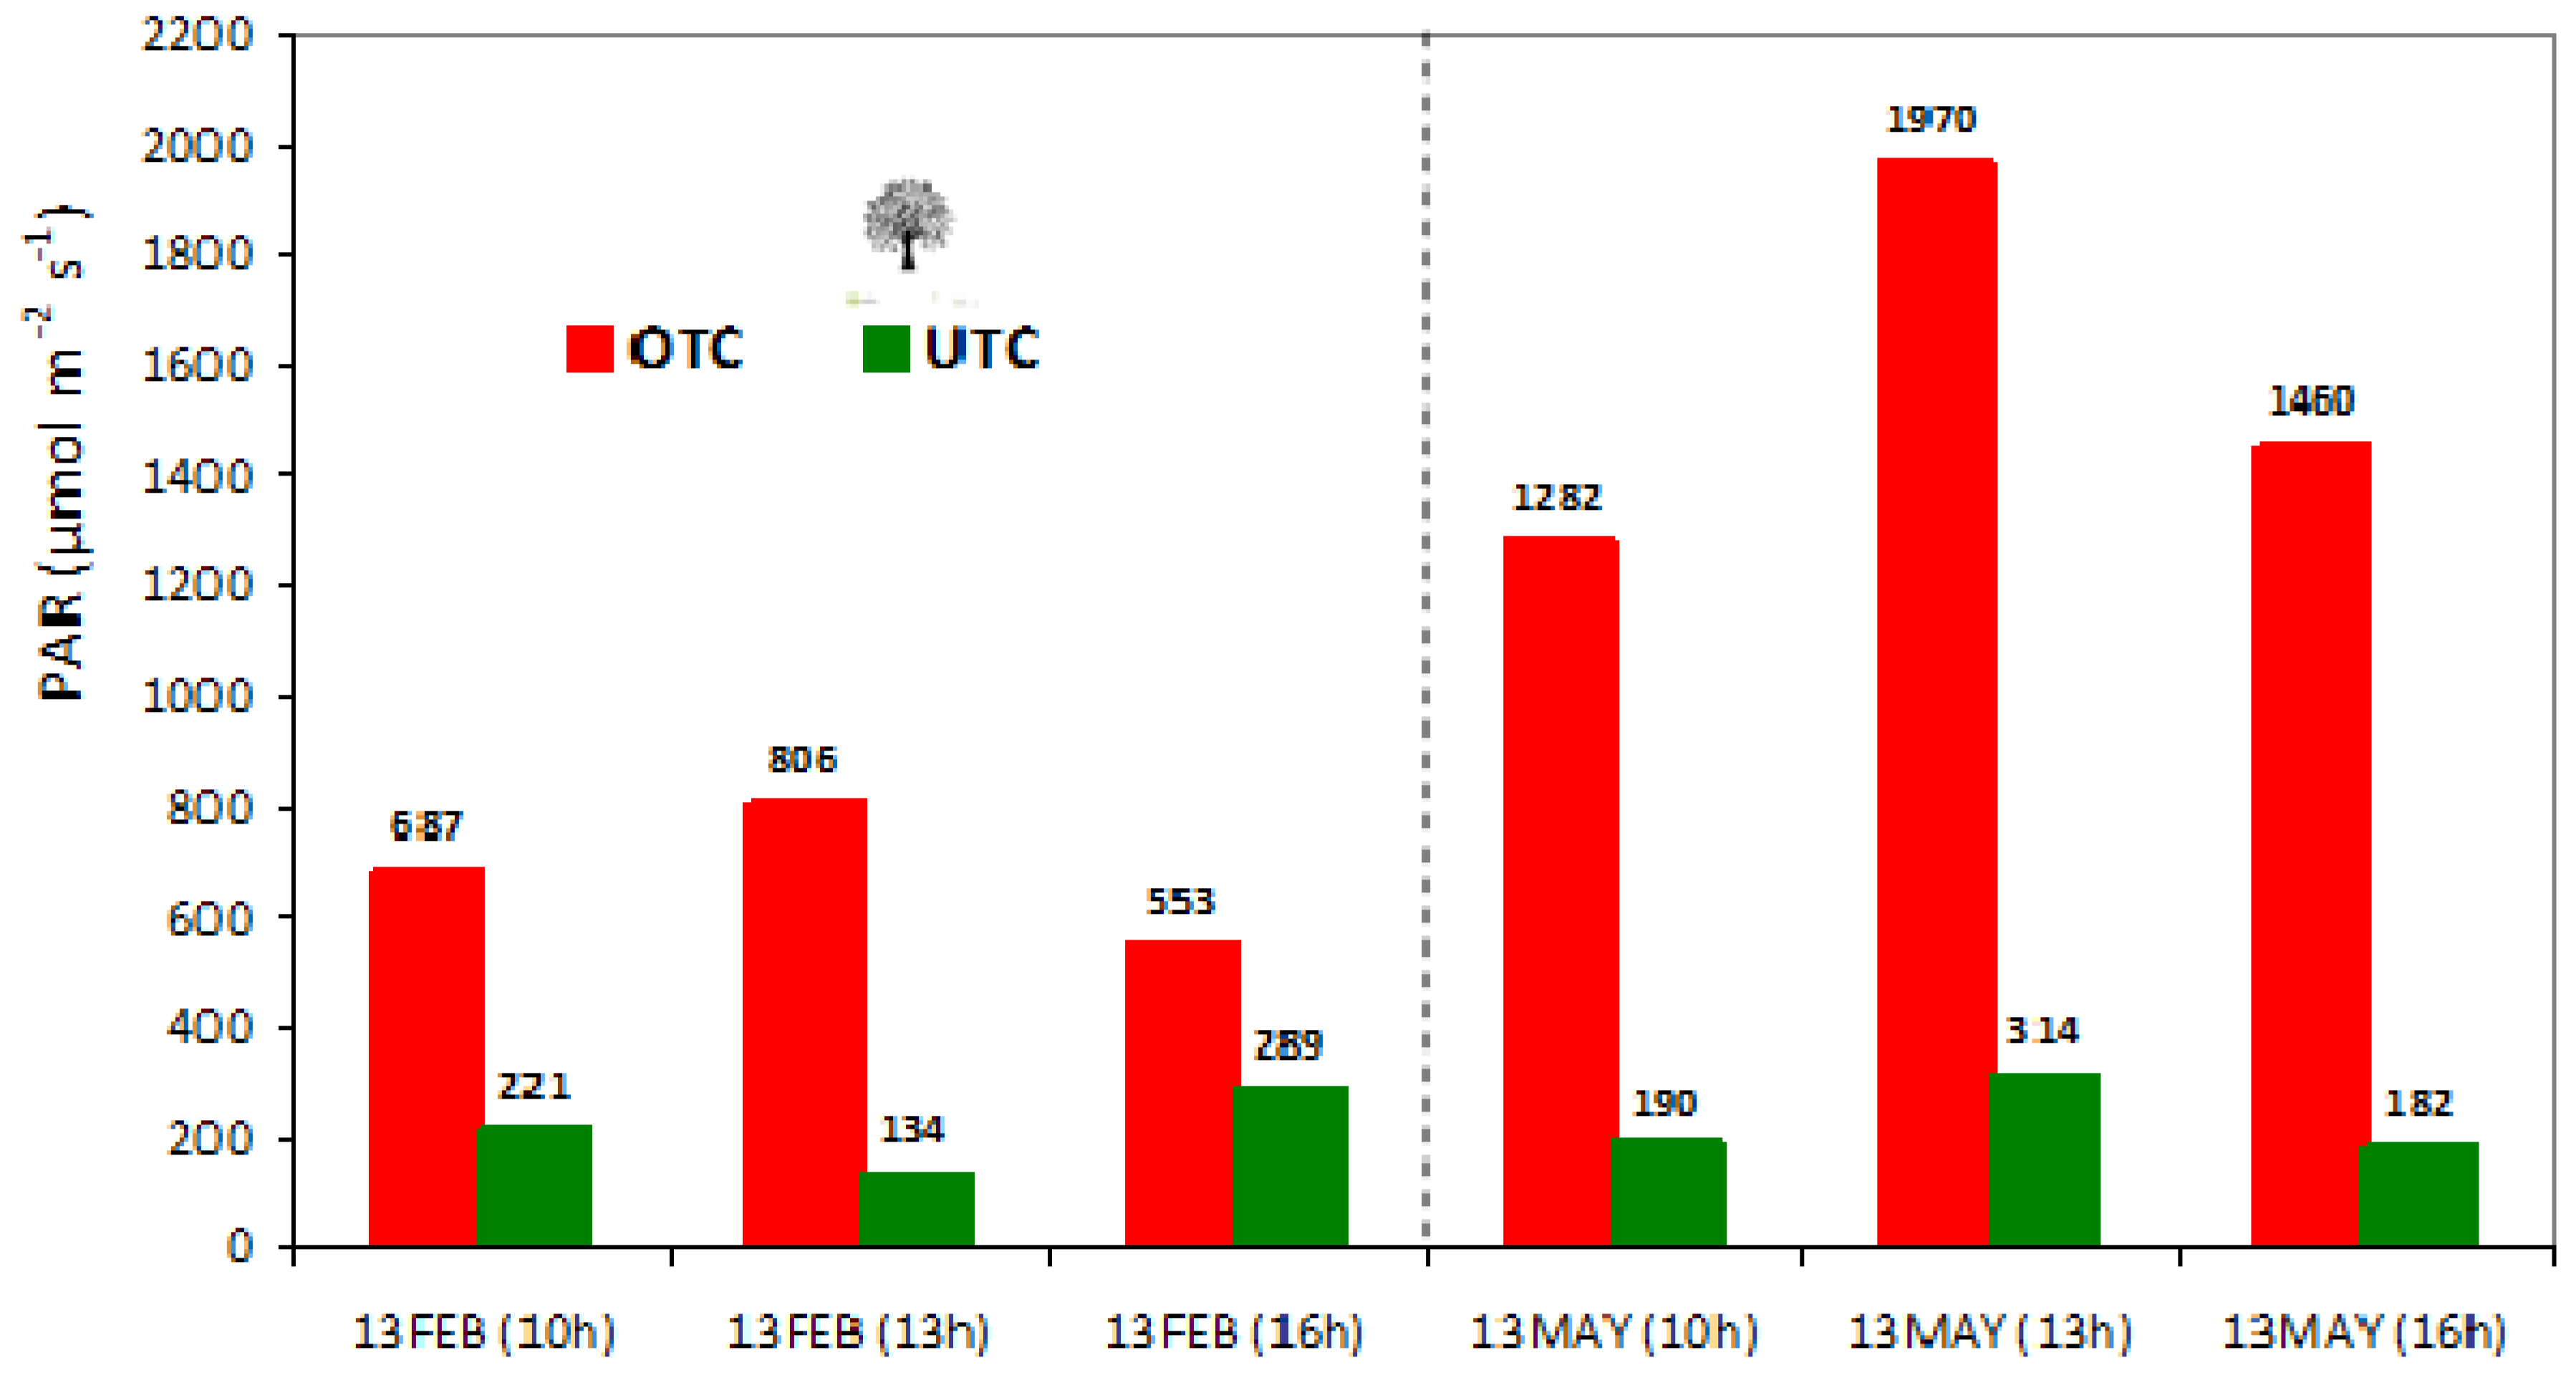
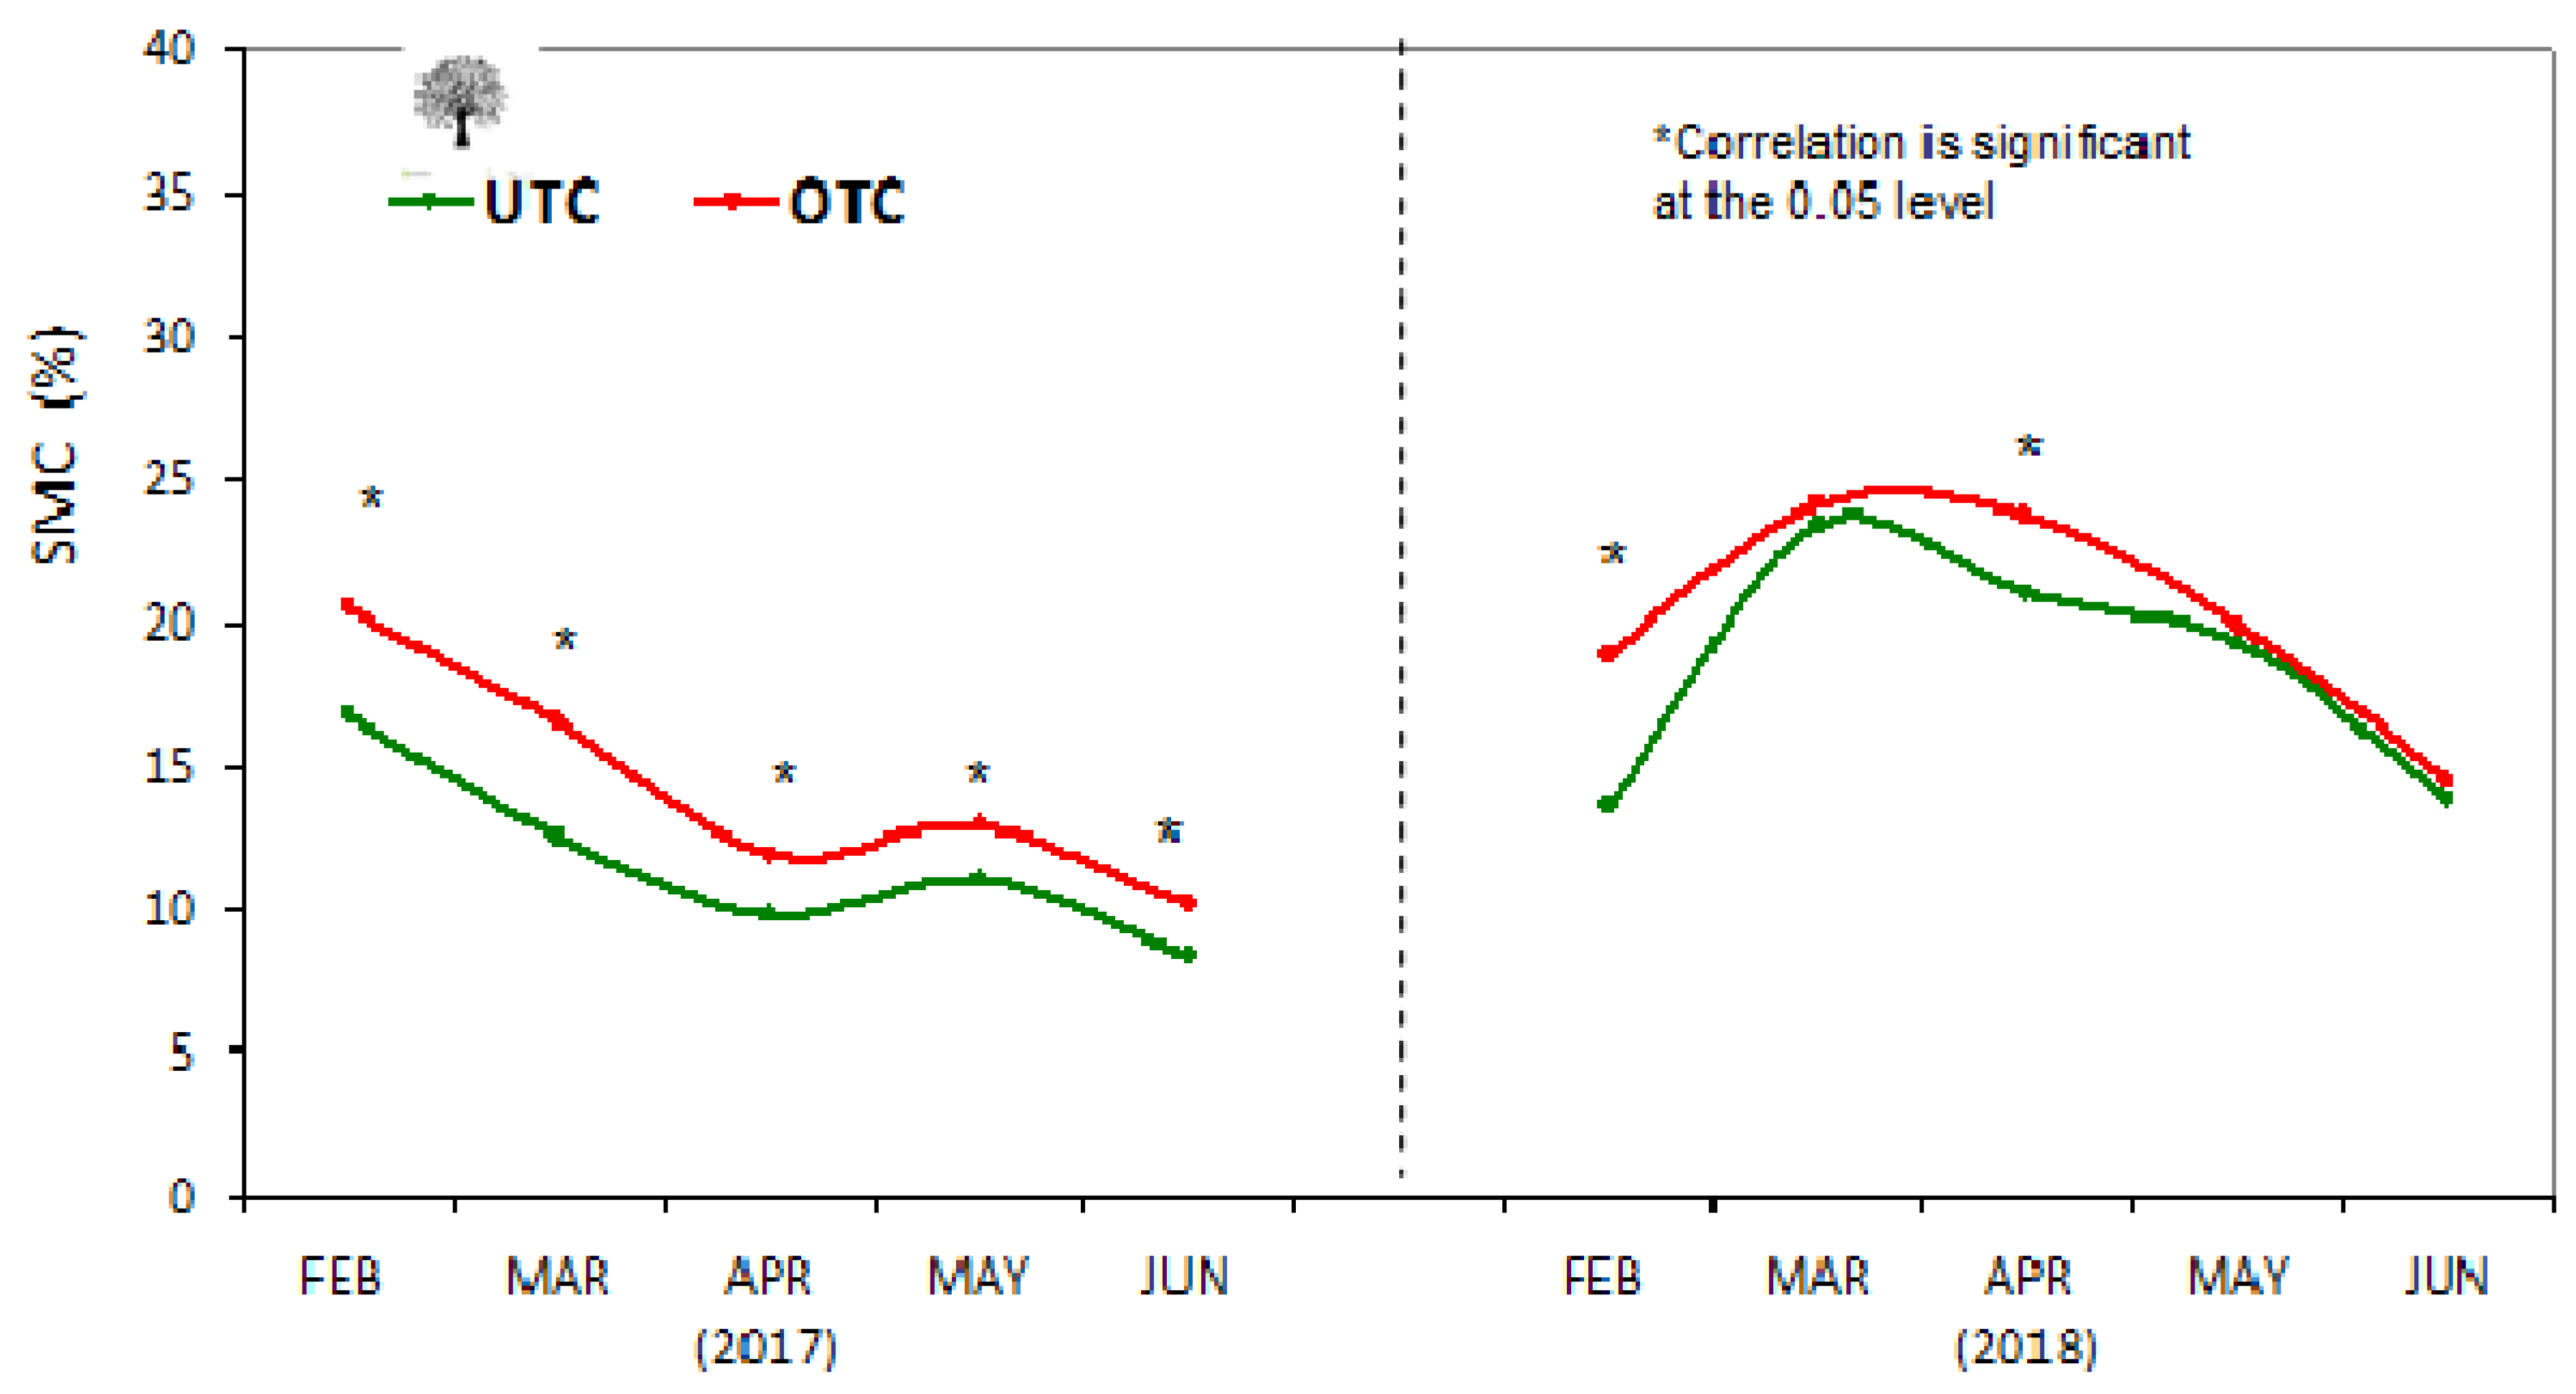
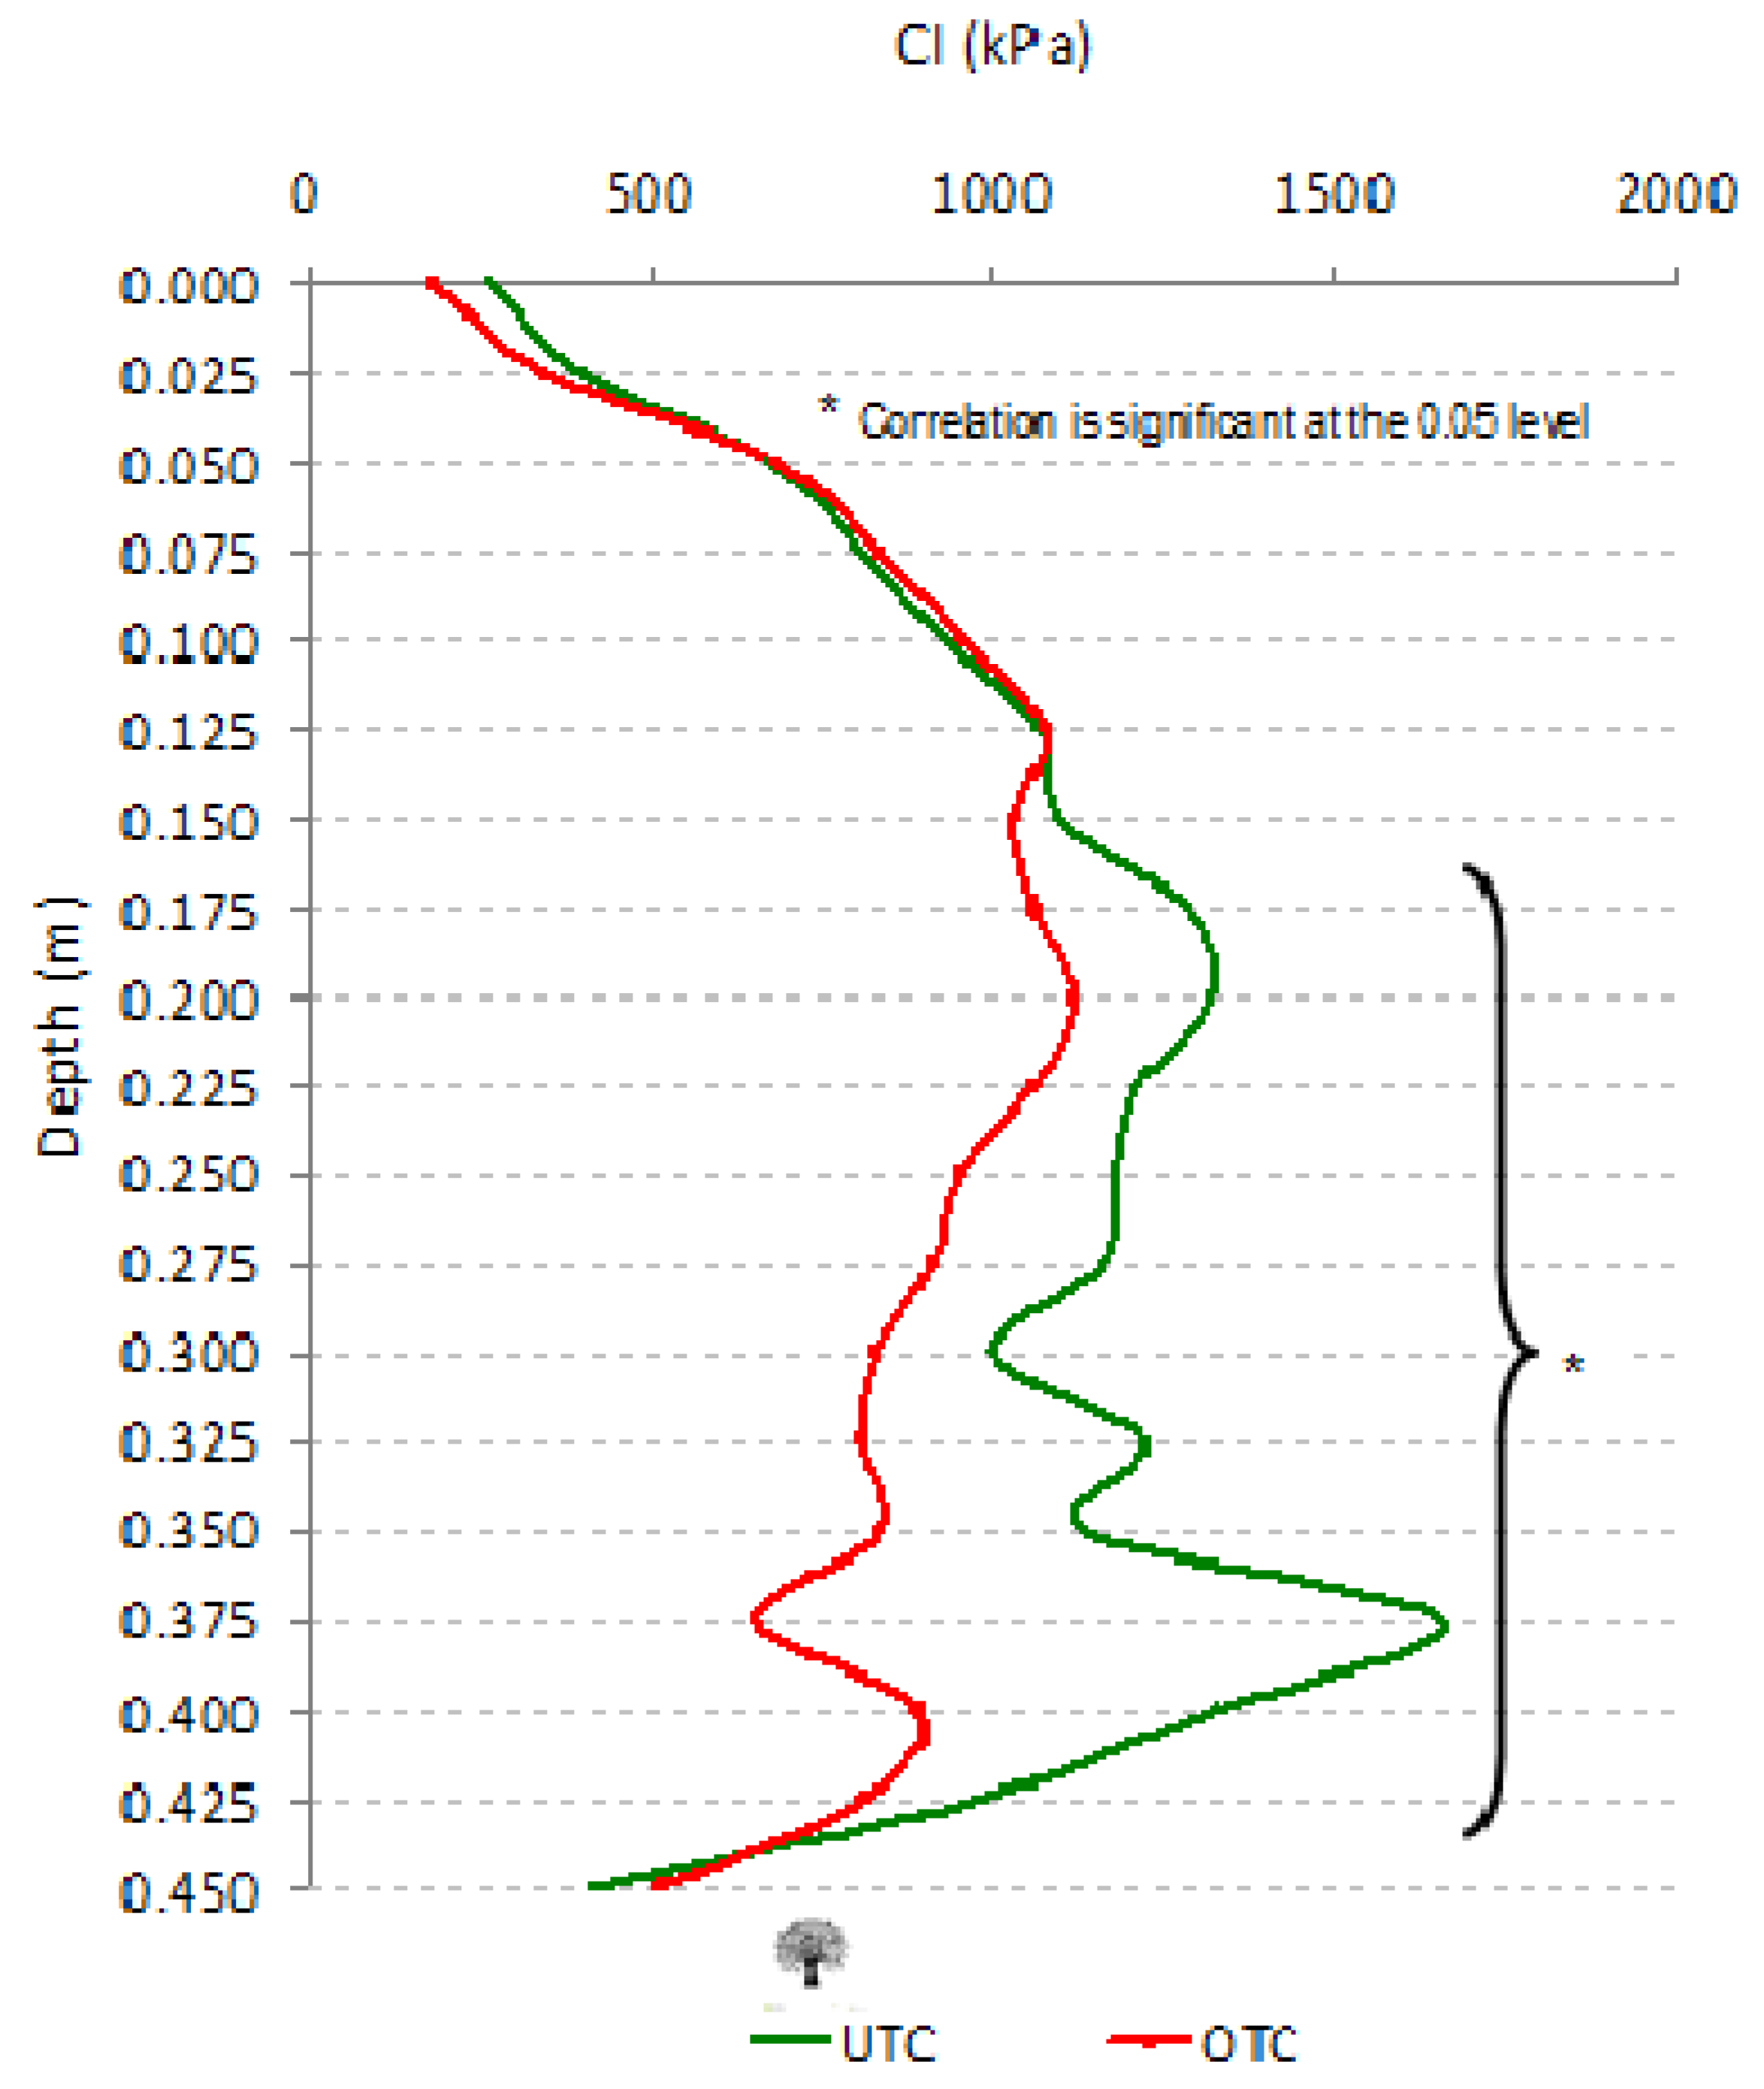
3.6. Effect of Tree Canopy in Photosynthetically Active Radiation (PAR), Surface Temperature (Tir), Soil Moisture Content (SMC), and Cone Index (CI)

Figure 7 shows photosynthetically active radiation (PAR) UTC and OTC, for each measurement date–time. The lower sun exposure of UTC pasture has implications for pasture surface temperature (Tir), as shown in Figure 8. The average Tir of the 12 sampling points in each situation (UTC and OTC) was significantly higher OTC between March and May 2016, between May and June 2017, and between March and June 2018. Figure 9 shows the evolution of SMC in both situations (UTC and OTC), between March and June 2017 and 2018. There is a tendency for SMC in the 0–0.30 m soil layer to show higher OTC values, with significant differences between February and June 2017 and in February and April 2018.
Another aspect that was evaluated in this study was the cone index (CI, in kPa), i.e., the soil resistance to penetration by the electronic cone. Figure 10 shows the average CI values obtained UTC and OTC in the set of measurements (monthly between February and June 2017 and 2018), in the 0–0.45 m soil layer. Significant differences were found in the depth range between 0.175 m and 0.425 m, with higher CI under tree canopy.

3.7. Relationship between Soil and Pasture Characteristics and Parameters Measured by Proximal Sensors

Table 6 summarizes the results of the descriptive statistical analyses of monthly NDVI and CMR. In June 2017, it was not possible to perform measurements with the Grassmaster II probe as the pasture was already very low moisture (PMC = 14.5 ± 4.7%).
The information obtained by the proximal sensors was correlated with soil and pasture characteristics. Table 7 shows the best significant relationships between (i) ECa measured by Dualem sensor and soil parameters (Clay R2 = 0.55; CEC, R2 = 0.39; and SMC, R2 = 0.48); (ii) CMR measured by Grassmaster II probe and pasture parameters (biomass, R2 = 0.75; and PMC, R2 = 0.60); (iii) NDVI measured by OptRx sensor and pasture biomass (R2 = 0.47), PMC (R2 = 0.91), CP (R2 = 0.82), NDF (R2 = 0.84) and PQDI (R2 = 0.93).

4. Discussion

4.1. Soil Spatial and Temporal Variability

Montado ecosystems are particularly complex and difficult to study because of the wide range of management and environmental conditions that they are exposed to [3]. The results of this study demonstrated the effect of trees and their importance in the dynamics of soil nutrients in agro-silvo-pastoral systems and highlighted the importance of optimizing the management of pasture and animal grazing as a potential measure for mitigating climate change in Mediterranean regions. Land cover management has been an effective strategy for managing land degradation through the reduction of water, soil and nutrient losses and improving soil structure, fertility, and quality [32,33,34]. The potential for carbon (C) sequestration in systems which combined pastures with trees increases because of the secondary roots of the trees, which slowly accumulate great amounts of C in the soil [32]. The C stock of soil under pasture represents the dynamic balance between the addition of dead plant material and the loss by decomposition or mineralization [35].
The important spatial variability of soil parameters verified in this work, namely in OM, P2O5, K2O, Mg, and Mn (with CV greater than 25%), was also identified in other studies about this ecosystem [11,36]. McCormick et al. [8] and Somarriba [37] concluded that heterogeneous waste disposal by grazing animals is the main cause of soil nutrient variability in extensive livestock systems. For Sales-Baptista et al. [9], in addition to the impact on the physical soil properties caused by treading, grazing animals, the deposition of dung and urine also affect chemical properties of soils and nutrient cycling and availability. Seddaiu et al. [13] and Gómez-Rey et al. [38] studied the effect of trees on soil properties. Benavides et al. [12] and Gómez-Rey et al. [38] justified the higher concentration of nutrients UTC as a result of the absorption by the roots in deep soil layers and their incorporation into the surface layers by leaf fall.
One of the characteristics of soils in the region is their low pH [6]. Pastoral soils tend to acidify as a result of nitrate leaching and OM accumulation [15,38]. Associated with soil acidity, the problem of Mn toxicity is frequently found, which has long been recognized as the major limitation for the pasture and forage production in the Montado ecosystem on acid Cambisols of the south of Portugal [1]. These authors suggest that pH correction should be done, therefore, with the application of dolomitic limestone, which provides CaCO3 but also Mg, to improve the Mg/Mn ratio (in this study, the ratio evolved from about 1 in 2016 to about 3 in 2018, after applying dolomitic limestone). The combination of these two factors (rising pH and Mg/Mn ratio) should provide greater nutrient availability for the plants, resulting in an effective improvement in soil fertility [6].

4.2. Spatial and Temporal Variability of Pasture Productivity and Quality

In Montado, high inter-annual variability in pasture biomass production can occur. During drier years, it follows a pattern that is typical of semi-desertic biomes, but in more favorable rainfall years the pattern is well within the range of herb biomass production of the subhumid woodland–grassland biome [39]. The plant food resources available to grazing animals in Montado ecosystem are highly diverse and variable, both spatially and seasonally, in quantity and quality. Plant biomass increases from winter to late spring, and restarts growing again after first autumn rains which may occur as early as September or as late as November. Usually the crude protein content of pasture decreases from winter to summer, while its fiber content increases [6,12,39].
The results of this work show the typical evolution of productivity and quality parameters of dryland Mediterranean pastures throughout their vegetative cycle: biomass productivity increases from winter to late spring, with a peak in late spring and an inverse pattern of pasture quality with the approach of summer [6,39]. In this study the inter-annual variability was evident: the peak of biomass production in drier year 2016/2017 (with a total rainfall of 421 mm; Figure 5a) was 12 771 ± 7106 kg ha−1 (in April 2017), while in 2016/2017 (a year with a more favorable rainfall of 547 mm, regularly distributed in autumn, winter and spring) the peak of biomass production was almost the double (24 148 ± 13 584 kg ha−1). spring 2018, however, shows a different pattern: (i) productivity increased from May to June, reflecting the high amount of precipitation that occurred between March and June, associated with the rising air temperature characteristic of this season; (ii) with regard to pasture quality, where the CP arises as one of the most important attributes because it limits animal production [9], the reversal of the normal trend took place between April and May, with CP levels rising and falling again in June. This behaviour of productivity and quality parameters due to the higher concentration of precipitation in the spring, prolonging the vegetative cycle, is a good indicator of the potential response of these pastures to intensification through the incorporation of irrigation systems.
In this study, in addition to seasonality and inter-annual variability, the effect of tree canopy on pasture productivity and quality was evaluated. The effect of trees on the pasture understory are a direct consequence of the extent to which they modify the microclimate and soil properties [12,15]. This effect of trees on soil and pasture cannot be dissociated from the effect of animal grazing. For Hussain et al. [40] livestock grazing can have an important influence on soil and sward composition, sward quality and pasture production. In terms of soil, the highest fertility is observed UTC (higher levels of OM, CEC, P2O5, K2O or Mg), but at the same time, these areas have higher CI in the 0.150–0.425 m soil layer (Figure 10), which may be related to the presence of tree roots and the permanence of animals UTC where they find shelter on days of heavy precipitation in the autumn-winter period, as well as on days of high temperatures in the spring-summer period. Since the roots of the botanical species present in the pastures develop generally in the topsoil (0-0.20m; [6]), they are not subject to the effect of this greater compaction UTC.
As far as the microclimate is concerned, Figure 7, Figure 8 and Figure 9 show, respectively, the evolution of PAR, Tir and SMC in sampling dates, UTC and OTC. For Marcos et al. [11] the balance of interaction between trees and pasture is positive in terms of soil fertility but negative in terms of light, temperature and water, which was confirmed in our work. Tree canopy effect on PAR intercepted by pasture is evident: in March pasture UTC received on average 33.7% of OTC photosynthetically active radiation and in May this value went down to 14.4%. Consequently, Tir shows a tendency to present higher values OTC (Figure 8). On the other hand, SMC behaviour reflects the complex relationship between rainfall, SMC, water uptake by plants and evapotranspiration, which varies seasonally (Benavides et al. 2009). In the period considered (between March and June 2017 and 2018), SMC was higher OTC, with the canopy serving as an obstacle to the arrival of rainwater on the pasture [12]. The combination of higher PAR, higher Tir and higher SMC explain the higher productivity that has been verified OTC. According to Benavides et al. [12] these are important factors affecting pasture production because they affect the physiological processes of plants such as photosynthesis, respiration and germination, decreasing pasture carbohydrate manufacture and net dry matter production [15,41]. However, and according to the same authors, a reduction in light does not lead to a proportional decrease in vegetative growth because compensatory responses occur in plant morphology and biochemistry. The production of more chlorophyll per leaf, the development of fewer but thinner and larger leaves (increasing leaf area), and longer stems, petioles and internodes, are some of the changes found in shaded plants. It is not surprising, therefore, to have observed in this study the positive effect of tree canopy on the prolongation of the period of higher vegetative vigor and higher values of pasture quality UTC (more CP, more PMC and less fibre), clearly evident in the PQDI pattern. To the variability of nutritional value of pasture can also contribute the changes in sward botanical composition and species phenology [40], which will be covered in the next point of this discussion. Herbage quality is mainly determined by plant species (and functional groups; e.g., legumes have more protein than grasses), but also influenced by plant parts (leaves/stems) and plant maturity, with young plants having higher protein and mature plants a higher fibre [9].

4.3. Spatial and Temporal Variability of Pasture Floristic Composition

As in other Mediterranean systems, the Montado is characterized by large spatial and temporal variation in the availability and quality of plant forage [39]. Besides herbage mass availability, the plant diversity and nutritive quality also vary seasonally, annually and with spatial location [5]. High seasonal fluctuations of light, temperature and soil moisture drive plant quality and availability. Plant food resource quality is strongly related to species composition, namely abundance of legumes or grasses and overall plant diversity [42].
Figure 11 shows the four predominant botanical species of the studied field in each year (2016, (a) and 2018, (b)), UTC and OTC. This spatial variability (UTC vs OTC) cannot be dissociated from aspects related to soil fertility (see Table 1) and the microclimate provided by the tree canopy (see Figure 7, Figure 8 and Figure 9). Modifications of the botanical composition are caused by changes in the microclimate and soil properties. Livestock grazing, including grazing behaviour in the presence of trees may also modify pasture composition [12]. Because legumes tend to be more sensitive to treading damage than grasses, a shift on pasture composition toward grasses may occur under heavy hoof action with consequent reduction in plant diversity [5]. The temporal variability (2016 → 2018) of the floristic composition may reflect the effect of soil correction (carried out in November 2017), but also the adaptability, with the predominance of species that are more resilient to thermal amplitudes, to the characteristics of the agricultural year (in terms of precipitation distribution), more tolerant to acid pH and excessive Mn concentrations. Most of these species are annuals, with pronounced patchiness of vegetation communities and marked seasonality of plant cycles, which germinate according to yearly environmental conditions (e.g., temperature, rainfall) and, consequently, the species composition of grassland in Montado can have a high inter-annual variability [9].
In 2016 (before dolomitic limestone application), there was an excessive level of Mn in the soil (see Table 1), leading to a Mg/Mn ratio close to 1, which constitutes a risk of Mn toxicity [1]. Floristic composition results not only from the depressive effect that Mn has on the growth of different species, but also from the competition dynamics between species, thus resulting in an additive effect. There are species that have developed adaptation to excessive levels of Mn, such as Chamaemelium mixtum and Chamaemelium fuscatum, and species that have susceptibility to Mn, which are grasses in general. For example, in spring 2016, the presence of Chamaemelium mixtum is lower UTC (6.9%) than OTC (17.0%), while Gramínea sp. is only present UTC (12.9%). This means that Mn toxicity has been reduced by UTC, but has not been eliminated by the canopy effect as this species is still able to compete. In 2018 (after soil correction) Chamaemelium mixtum disappears completely and Chamaemelium fuscatum also disappears UTC as toxicity has decreased and these species lose their competitive ability. In 2018 Diplotaxis catholica also appears OTC, a competing species of Chamaemelium, but more demanding, indicating, therefore, that soil conditions improved after the application of dolomitic limestone. These species rely on vigorous growth in autumn, which culminates in early winter flowering compared to the vast majority of other species, which bloom during spring [6]. Another sign of improvement in 2018 is provided by the appearance of grasses OTC (Poaceae; in this case Bromus diandrus with 19.4% of mean cover), albeit still with lower expression than UTC (mean cover of 42.8%), reflecting the difference in fertility in both situations and, simultaneously, the greater shade tolerance of these species [12].
In summary, after application of dolomitic limestone, the most indicative species of excess Mn (Chamaemelium) disappears from UTC and substantially reduces its presence OTC. In this OTC reduction, this species is replaced by more interesting species (Diplotaxis catholica and grasses in general) but more sensitive to Mn. The data from this study seem to indicate that the toxicity problem is solved UTC (where there is higher soil fertility), but not OTC, although the situation has improved. These results prove that soil correction is a slow and gradual process [6], which requires periodic monitoring of both soil and plants that are bio-indicators. In this specific case, therefore, a new application of dolomitic limestone is justified, which can and should be spatially differentiated (favoring the OTC areas) through variable rate technology (VRT). It is hoped that at a later stage of the process, legumes (Fabaceae), of great importance for atmospheric nitrogen fixation [6] but also for improving the nutritional value of pasture [39], can enter the floristic composition either through the soil seed bank or through the reseeding of these species [6].

4.4. Technologies for Monitoring Soil and Pasture Variability

The core of PA is effectively managing spatial and temporal variability related to all aspects of agricultural production for the purpose of improving crop performance and environmental quality. Therefore, assessing soil and crop variability is the first critical step and a necessary condition in PA [43]. Quantifying spatial variation of forage biomass yield, vegetation quality, and soil properties can help improve pasture management practices such as grazing rotations, nutrient management, and yield prediction [18]. The results obtained in this study show the potential of three different tools for monitoring soil variability (Dualem 1S—electromagnetic induction sensor), pasture yield variability (Grassmaster II capacitance probe), and pasture quality variability (OptRx—optical active sensor).
Concerning the soil, ECa can be intensively recorded in an easy and inexpensive way and provides an indirect measure of soil properties that can have a dominant influence on plant growth and yield [23]. The significant correlations between ECa and clay, CEC and SMC are in line with the pioneering work of Corwin and Lesch [21] or Sudduth et al. [22]. However, the value of the resulting coefficient of determination is not very high (0.55 to clay; 0.39 to CEC, and 0.48 to SMC). According to Moral et al. [44] modelling the relationships between primary soil variables and ECa is not an easy task due to the dependency of ECa on various soil properties, over different spatial scales. Castrignanò et al. [43] reinforces that such ECa measurements are generally affected by more than one agronomic soil characteristic, consequently, obtaining accurate information about one property by using only one sensing technique is extremely difficult. Also, Corwin and Lesch [21] and Sudduth et al. [22] alert to some inconsistency in the relationship between ECa and soil characteristics. These inconsistent relationships may be generated by the potentially complex interrelationships between ECa and soil properties and nutrient levels [23]. After all, these results show that geospatial measurement of ECa is an efficient ground-based sensing technology that is helping to take management zones (MZ) from concept to reality [23]. The definition of homogeneous management zones (HMZ) forms the basis for the differential application of fertilizers and soil amendment. Over the next years, variable-rate application of inputs will be carried out, decreasing fertilization in the less productive areas (low ECa) and minimizing the application of chemical substances as a strategy to develop a more cost-effective field management, including less use of agricultural machinery [44]. A recent example of these applications was presented by Serrano et al. [20], with an integrated approach using spatial variability and temporal stability of ECa and indices obtained by remote sensing to delineate management zones with differential fertilizer prescription.
In regard to pasture biomass estimation, this is the basis for pasture and grazing management in rotational systems, in terms of grazing place, grazing time, or grazing frequency [9] and in terms of calculation of number of animals per unit area [24]. As a result of the multiple grazing choices and the large number of factors that influence grazing, management is always a challenging task [9]. The results of this study, indicating a significant relationship between CMR and biomass (R2 = 0.75) and between CMR and PMC (R2 = 0.60), demonstrate that the Grassmaster II probe could play a crucial role in assessing pasture mass in order to improve feed planning under Mediterranean conditions and confirm other works of Serrano et al. [24,45].
Finally, the use of the AOS OptRx has shown great potential for pasture monitoring. According to Padilla et al. [46], proximal optical sensors are a promising approach for rapid and periodic assessment of crop status during the growth cycle or at certain phenological stages. They are sensitive to chlorophyll content per unit of leaf area. The vegetation index (NDVI) obtained from measurements of this sensor showed strong correlations with parameters related to pasture quality (PMC, with R2 of 0.91; CP, with R2 of 0.82) or to pasture quality degradation (PQDI, with R2 of 0.93; NDF with R2 of 0.84). These results are justified by the principle of NDVI, based on reflectance at the near infrared and red regions, which is strongly related to the vegetation density [47] or to the chlorophyll content, and thus, with the plant growth [48]. Serrano et al. [17], Albayrak [49], and Pullanagari et al. [50] also found significant relationships between spectral measurements and pasture quality parameters, which can be attributed to the absorbance of visible radiance by the existing chlorophyll in green vegetation. The interest of the significant correlations between NDVI and pasture quality or pasture quality degradation parameters presented in this paper is particularly emphasized by the possibility of obtaining this and other indices (e.g., the Normalized Difference Water Index, NDWI) from satellite images [26]. The correlation of NDVI with crop vegetative vigor [17] or NDWI with soil or plant moisture [26] is a stimulus and a challenge for small technology-based enterprises serving the agriculture sector. This is the case of the enterprise AgroInsider (spin-off from the University of Évora) which provides agricultural consultancy services in southern Portugal (Figure 12) through an electronic platform http://agromap.agroinsider360.com.
Figure 13 summary of the proposed approach to monitoring soil and pasture of the Montado ecosystem based on proximal and remote sensing in order to promote its sustainable management.

5. Conclusions

The Mediterranean Montado ecosystem has been the object of study by several research teams in the last decades. The positive impact of trees and animal grazing on soil fertility is a very relevant indicator of the potential of this ecosystem to improve the characteristic poor soils of this region and the natural regeneration of Cork oaks and Holm oaks, which are fundamental elements for animal welfare in the face of climate change challenges. International decision-making structures, notably linked to the Common Agricultural Policy (CAP), should look upon this ecosystem as a long-term opportunity with impacts on the sustainability of agro-silvo-pastoral activity.
High seasonal fluctuations of light, temperature, and soil moisture drive plant quality and productivity in dryland pastures. Pasture nutritional value varies seasonally, annually, and with spatial location and is strongly related to species composition, namely abundance of legumes or grasses and overall plant diversity. Certain botanical species may even be biological indicators of ecosystem degradation situations, such as acid soils or manganese toxicity.
The incorporation of PA technologies in the Montado ecosystem represents an important advancement in pasture management. The results obtained in this study show the potential of three different tools for monitoring soil variability (Dualem 1S—electromagnetic induction sensor), pasture yield variability (Grassmaster II capacitance probe), and pasture quality variability (OptRx—optical active sensor). A better understanding of the Montado ecosystem and of the soil–pasture–tree–animals interactions can help decision making regarding soil amendment or fertilization, dynamic grazing (livestock numbers and time of grazing in each plot), or calculation of feed supplementation needs.

Author Contributions

Conceptualization, J.S., J.M.d.S., A.P. and M.C.; formal analysis, J.S., S.S., J.M.d.S., L.P., E.C. and M.C.; funding acquisition, J.S., J.M.d.S. and M.C.; investigation, J.S., E.C. and L.P.; methodology, J.S., S.S., J.M.d.S., L.P., E.C., A.P. and M.C.; project administration, J.S. and A.P.; supervision, J.S., A.P. and M.C.; validation, J.S., S.S., E.C. and M.C.; visualization, J.S. and S.S.; writing—original draft preparation, J.S. and J.M.d.S.; writing—review and editing, S.S. All authors have read and agreed to the published version of the manuscript.

Funding

This work was funded by National Funds through FCT (Foundation for Science and Technology) under the Project UIDB/05183/2020, by the project INNOACE—Innovación abierta e inteligente en la EUROACE (Tarea 2.1.3) and by the projects PDR2020−101-030693 and PDR2020−101-031244 (“Programa 1.0.1-Grupos Operacionais”).

Acknowledgments

The authors would like to express their sincere appreciation to Manuela Correia of the Rural Engineering Department of the University of Évora and Maria da Graça Machado of the Animal Production Department of the University of Évora for their technical support in, respectively, collection and analysis of data of pasture.

Conflicts of Interest

The authors declare no conflict of interest.

References

  1. Carvalho, M.; Goss, M.J.; Teixeira, D. Manganese toxicity in Portuguese Cambisols derived from granitic rocks: Causes, limitations of soil analyses and possible solutions. Revista de Ciências Agrárias 2015, 38, 518–527. [Google Scholar] [CrossRef]
  2. David, T.S.; Pinto, C.A.; Nadezhdina, N.; Kurz-Besson, C.; Henriques, M.O.; Quilhó, T.; Cermak, J.; Chaves, M.M.; Pereira, J.S.; David, J.S. Root functioning, tree water use and hydraulic redistribution in Quercus suber trees: A modeling approach based on root sap flow. Forest. Ecol. Manag. 2013, 307, 136–146. [Google Scholar] [CrossRef] [Green Version]
  3. Puche, N.; Senapati, N.; Flechard, C.R.; Klumpp, K.; Kirschbaum, M.U.F.; Chabbi, A. Modeling carbon and water fluxes of managed grasslands: Comparing flux variability and net carbon budgets between grazed and mowed systems. Agronomy 2019, 9, 183. [Google Scholar] [CrossRef] [Green Version]
  4. Franzluebbers, A.J.; Starks, P.J.; Steiner, J.L. Conservation of soil organic carbon and nitrogen fractions in a Tallgrass prairie in Oklahoma. Agronomy 2019, 9, 204. [Google Scholar] [CrossRef] [Green Version]
  5. Sales-Baptista, E.; d’Abreu, M.C.; Oliveira, M.I. Overgrazing in the Montado? The need for monitoring grazing pressure at paddock scale. Agrofor. Syst. 2016, 90, 57–68. [Google Scholar] [CrossRef] [Green Version]
  6. Efe Serrano, J. Pastures in Alentejo: Technical Basis for Characterization, Grazing and Improvement; Universidade de Évora—ICAM, Ed.; Gráfica Eborense: Évora, Portugal, 2006; pp. 165–178. [Google Scholar]
  7. Schellberg, J.; Hill, M.J.; Gerhards, R.; Rothmund, M.; Braun, M. Precision agriculture on grassland: Applications, perspectives and constraints. Eur. J. Agron. 2008, 29, 59–71. [Google Scholar] [CrossRef]
  8. McCormick, S.; Jordan, C.; Bailey, J. Within and between-field spatial variation in soil phosphorus in permanent grassland. Precis. Agric. 2009, 10, 262–276. [Google Scholar] [CrossRef]
  9. Sales-Baptista, E.; Oliveira, I.F.; Santos, M.B.; Castro, J.A.; Pereira, A.; Rafael, J.; Serrano, J. Tecnologia GNSS de baixo custo na monitorizacão de ovinos em pastoreio. Revista de Ciências Agrárias 2016, 39, 251–260. (In Portuguese) [Google Scholar] [CrossRef]
  10. Serrano, J.; Sales-Baptista, E.; Shahidian, S.; Marques da Silva, J.; Ferraz de Oliveira, I.; Lopes de Castro, J.; Pereira, A.; Cancela d’Abreu, M.; Carvalho, M. Proximal sensors for monitoring seasonal changes of feeding sites selected by grazing ewes. Agroforest. Syst. 2018. [Google Scholar] [CrossRef]
  11. Marcos, G.M.; Obrador, J.J.; Garcia, E.; Cubera, E.; Montero, M.J.; Pulido, F.; Dupraz, C. Driving competitive and facilitative interactions in oak dehesas through management practices. Agrofor. Syst. 2007, 70, 25–40. [Google Scholar] [CrossRef]
  12. Benavides, R.; Douglas, G.B.; Osoro, K. Silvopastoralism in New Zealand: Review of effects of evergreen and deciduous trees on pasture dynamics. Agrofor. Syst. 2009, 76, 327–350. [Google Scholar] [CrossRef]
  13. Seddaiu, G.; Porcua, G.; Luigi, L.; Roggero, P.P.; Agnelli, A.; Cortic, G. Soil organic matter content and composition as influenced by soil management in a semi-arid Mediterranean agro-silvo-pastoral system. Agric. Ecosys. Environ. 2013, 167, 1–11. [Google Scholar] [CrossRef]
  14. Jackson, T.J.; Chen, D.; Cosh, M.; Li, F.; Anderson, M.; Walthall, C.; Doriaswamy, P.; Hunt, E.R. Vegetation water content mapping using Landsat data derived normalized difference water index for corn and soybeans. Remote Sens. Environ. 2004, 92, 475–482. [Google Scholar] [CrossRef]
  15. Guevara-Escobar, A.; Kemp, P.D.; Mackay, A.D.; Hodgson, J. Pasture production and composition under poplar in a hill environment in New Zealand. Agrofor. Syst. 2007, 3, 199–213. [Google Scholar] [CrossRef]
  16. Diacono, M.; Persiani, A.; Fiore, A.; Montemurro, F.; Canali, S. Agro-ecology for potential adaptation of horticultural systems to climate change: Agronomic and energetic performance evaluation. Agronomy 2017, 7, 35. [Google Scholar] [CrossRef] [Green Version]
  17. Serrano, J.; Shahidian, S.; Marques da Silva, J. Monitoring seasonal pasture quality degradation in the Mediterranean montado ecosystem: Proximal versus remote sensing. Water 2018, 10, 1422. [Google Scholar] [CrossRef] [Green Version]
  18. Serrano, J.; Shahidian, S.; Marques da Silva, J.; Sales-Baptista, E.; Ferraz de Oliveira, I.; Lopes de Castro, J.; Pereira, A.; Cancela d’Abreu, M.; Machado, E.; Carvalho, M. Tree influence on soil and pasture: Contribution of proximal sensing to pasture productivity and quality estimation in montado ecosystems. Int. J. Remote Sens. 2018, 39, 4801–4829. [Google Scholar] [CrossRef]
  19. Nawar, S.; Corstanje, R.; Halcro, G.; Mulla, D.; Mouazen, A.M. Delineation of soil management zones for variable-rate fertilization: A review. Adv. Agron. 2017, 143, 175–245. [Google Scholar]
  20. Serrano, J.; Shahidian, S.; Marques da Silva, J.; Paixão, L.; Calado, J.; Carvalho, M. Integration of soil electrical conductivity and indices obtained through satellite imagery for differential management of pasture fertilization. AgriEngineering 2019, 1, 567–585. [Google Scholar] [CrossRef] [Green Version]
  21. Corwin, D.L.; Lesch, S.M. Application of soil electrical conductivity to precision agriculture: Theory, principles, and guidelines. Agron. J. 2003, 95, 455–471. [Google Scholar] [CrossRef]
  22. Sudduth, K.A.; Kitchen, N.R.; Wiebold, W.J.; Batchelor, W.D.; Bollero, G.A.; Bullock, D.G. Relating apparent electrical conductivity to soil properties across the north-central USA. Comput. Electron. Agric. 2005, 46, 263–283. [Google Scholar] [CrossRef]
  23. Peralta, N.R.; Costa, J.L.; Balzarini, M.; Franco, M.C.; Córdoba, M.; Bullock, D. Delineation of management zones to improve nitrogen management of wheat. Comput. Electron. Agric. 2015, 110, 103–113. [Google Scholar] [CrossRef]
  24. Serrano, J.; Shahidian, S.; Marques da Silva, J. Calibration of GrassMaster II to estimate green and dry matter yield in Mediterranean pastures: Effect of pasture moisture content. Crop. Pasture Sci. 2016, 67, 780–791. [Google Scholar] [CrossRef]
  25. Louhaichi, M.; Hassan, S.; Clifton, K.; Johnson, D.E. A reliable and non-destructive method for estimating forage shrub cover and biomass in arid environments using digital vegetation charting technique. Agrofor. Syst. 2018, 92, 1341–1352. [Google Scholar] [CrossRef] [Green Version]
  26. Serrano, J.; Shahidian, S.; Marques da Silva, J. Evaluation of normalized difference water index as a tool for monitoring pasture seasonal and inter-annual variability in a Mediterranean agro-silvo-pastoral system. Water 2019, 11, 62. [Google Scholar] [CrossRef] [Green Version]
  27. AEMET. Iberian Climate Atlas; Agencia Estatal de Meteorología (España) and Instituto de Meteorología (Portugal): Madrid, Spain, 2011. [Google Scholar]
  28. FAO. World Reference Base for Soil Resources; Food and Agriculture Organization of the United Nations, World Soil Resources Reports N 103; FAO: Rome, Italy, 2006. [Google Scholar]
  29. Egner, H.; Riehm, H.; Domingo, W.R. Utersuchungeniiber die chemische Bodenanalyse als Grudlagefir die Beurteilung des Nahrstof-zunstandes der Boden. II. K. Lantbrhogsk. Annlr 1960, 20, 199–216. (In German) [Google Scholar]
  30. AOAC. Official Method of Analysis of AOAC International, 18th ed.; AOAC International: Arlington, AT, USA, 2005. [Google Scholar]
  31. Braun-Blanquet, J. Pflanzensoziologie, 3rd ed.; Grundzüge der Vegetationskunde; Springer: Vienna, Austria; New York, NY, USA, 1964. [Google Scholar]
  32. Lozano-García, B.; Parras-Alcántara, L. Land use and management effects on carbon and nitrogen in Mediterranean Cambisols. Agric. Ecosyst. Environ. 2013, 179, 208–214. [Google Scholar] [CrossRef]
  33. Lal, R. Restoring Soil Quality to Mitigate Soil Degradation. Sustainability 2015, 7, 5875–5895. [Google Scholar] [CrossRef] [Green Version]
  34. Yadav, R.P.; Sharma, P.; Arya, S.L.; Panwar, P. Acacia nilotica-based silvipastoral systems for resource conservation and improved productivity from degraded lands of the Lower Himalayas. Agrofor. Syst. 2014, 88, 851–853. [Google Scholar] [CrossRef]
  35. Lorenz, K.; Lal, R. Soil organic carbon sequestration in agroforestry systems. A review. Agron. Sustain. Dev. 2014, 34, 443–454. [Google Scholar] [CrossRef] [Green Version]
  36. Bernardi, A.C.C.; Bettiol, G.M.; Ferreira, R.P.; Santos, K.E.L.; Rabello, L.M.; Inamasu, R.Y. Spatial variability of soil properties and yield of a grazed alfalfa pasture in Brazil. Precis. Agric. 2016, 17, 737–752. [Google Scholar] [CrossRef] [Green Version]
  37. Somarriba, E. Pasture growth and floristic composition under the shade of Guava (Psidium guajava L.) trees in Costa Rica. Agrofor. Syst. 1988, 6, 153–162. [Google Scholar] [CrossRef]
  38. Gómez-Rey, M.X.; Garcês, A.; Madeira, M. Soil organic-C accumulation and N availability under improved pastures established in Mediterranean Oak Woodlands. Soil Use Manag. 2012, 28, 497–507. [Google Scholar] [CrossRef]
  39. Ferraz de Oliveira, M.I.; Lamy, E.; Bugalho, M.N.; Vaz, M.; Pinheiro, C.; Cancela d’Abreu, M.; Capela e Silva, F.; Sales-Baptista, E. Assessing foraging strategies of herbivores in Mediterranean oak woodlands: A review of key issues and selected methodologies. Agrofor. Syst. 2013, 87, 1421–1437. [Google Scholar] [CrossRef]
  40. Hussain, Z.; Kemp, P.D.; Horne, D.J. Pasture production under densely planted young willow and poplar in a silvopastoral system. Agrofor. Syst. 2009, 76, 351–362. [Google Scholar] [CrossRef]
  41. Devkota, N.R.; Kemp, P.D.; Hodgson, J.; Valentine, I. Relationship between tree canopy height and the production of pasture species in a silvopastoral system based on alder trees. Agrofor. Syst. 2009, 76, 363–374. [Google Scholar] [CrossRef]
  42. Pérez-Ramos, I.M.; Zavala, M.A.; Maranon, T.; Díaz-Villa, M.D.; Valladares, F. Dynamics of understory herbaceous plant diversity following shrub clearing of cork oak forests: A five-year study. For. Ecol. Manag. 2008, 255, 3242–3253. [Google Scholar] [CrossRef]
  43. Castrignanò, A.; Buttafuoco, G.; Quarto, R.; Vitti, C.; Langella, G.; Terribile, F.; Venezia, A. A combined approach of sensor data fusion and multivariate geostatistics for delineation of homogeneous zones in an agricultural field. Sensors 2017, 17, 2794. [Google Scholar] [CrossRef]
  44. Moral, F.; Terrón, J.; Da Silva, J.M. Delineation of management zones using mobile measurements of soil apparent electrical conductivity and multivariate geostatistical techniques. Soil Tillage Res. 2010, 106, 335–343. [Google Scholar] [CrossRef]
  45. Serrano, J.; Shahidian, S.; Marques da Silva, J. Monitoring pasture variability: Optical OptRx® crop sensor versus Grassmaster II capacitance probe. Environ. Monit. Assess. 2016, 188, 1–17. [Google Scholar] [CrossRef]
  46. Padilla, F.M.; Souza, R.; Peña-Fleitas, M.T.; Grasso, R.; Gallardo, M.; Thompson, R.B. Infuence of time of day on measurement with chlorophyll meters and canopy refectance sensors of diferent crop N status. Precis. Agric. 2019, 20, 1087–1106. [Google Scholar] [CrossRef] [Green Version]
  47. Gebremedhin, A.; Badenhorst, P.E.; Wang, J.; Spangenberg, G.C.; Smith, K.F. Prospects for measurement of dry matter yield in forage breeding programs using sensor technologies. Agronomy 2019, 9, 65. [Google Scholar] [CrossRef] [Green Version]
  48. Chai, X.; Zhang, T.; Shao, Y.; Gong, H.; Liu, L.; Xie, K. Modeling and mapping soil moisture of plateau pasture using RADARSAT-2 imagery. Remote Sens. 2015, 7, 1279–1299. [Google Scholar] [CrossRef] [Green Version]
  49. Albayrak, S. Use of reflectance measurements for the detection of N, P, K, ADF and NDF contents in Sainfoin pasture. Sensors 2008, 8, 7275–7286. [Google Scholar] [CrossRef] [PubMed] [Green Version]
  50. Pullanagari, R.; Yule, I.; Tuohy, M.; Hedley, M.; Dynes, R.; King, W. Proximal sensing of the seasonal variability of pasture nutritive value using multispectral radiometry. Grass Forage Sci. 2013, 68, 110–119. [Google Scholar] [CrossRef]
Figure 1. Schedule of activities carried out at the Mitra experimental field to monitor the Montado ecosystem between October 2015 and June 2018 (PS—proximal sensing; ECa—soil apparent electrical conductivity).
Agronomy 10 00218 g001
Figure 2. (a) Location of trees (six) and sampling points (12 under tree canopy—UTC; 12 outside tree canopy—OTC) and (b) altimetric map of experimental field.
Agronomy 10 00218 g002
Figure 3. Monthly mean temperature and monthly rainfall in the meteorological station of Mitra (Évora, Portugal), between September 2015 and August 2018.
Agronomy 10 00218 g003
Figure 4. Evolution of mean normalized difference vegetation index (NDVI) at experimental field between November 2015 and June 2018.
Agronomy 10 00218 g004
Figure 5. Accumulated rainfall (by trimester and total) in the agricultural years of 2015–2016, 2016–2017, and 2017–2018 (a) and monthly mean temperature (average of 30 years, 1981–2010, and average of three years, September 2015–August 2018) (b) of Mitra meteorological station.
Agronomy 10 00218 g005
Figure 6. Spatial patterns of soil apparent electrical conductivity (ECa) of the study area in October 2015.
Agronomy 10 00218 g006
Figure 7. Photosynthetically active radiation (PAR), average of 12 sampling points in each situation (under tree canopy, UTC, and outside tree canopy, OTC), for each date–hour measurement in 2018.
Agronomy 10 00218 g007
Figure 8. Monthly pasture surface temperature (Tir) under tree canopy (UTC) and outside tree canopy (OTC) between February or March and June of 2016, 2017, and 2018. *—Correlation is significant at the 0.05 level.
Agronomy 10 00218 g008
Figure 9. Monthly soil moisture content (SMC) under tree canopy (UTC) and outside tree canopy (OTC) between March and June of 2017 and 2018. *—Correlation is significant at the 0.05 level.
Agronomy 10 00218 g009
Figure 10. Average cone index (CI) under tree canopy (UTC) and outside tree canopy (OTC), in the 0-0.45m soil layer. *—Correlation is significant at the 0.05 level.
Agronomy 10 00218 g010
Figure 11. Four predominant botanical species (mean cover, %) of pasture of the studied field in spring 2016 (a) and spring 2018 (b), under tree canopy (UTC) and outside tree canopy (OTC).
Agronomy 10 00218 g011
Figure 12. Interface of AgroInsider electronic platform which provides agricultural consultancy services in southern Portugal.
Agronomy 10 00218 g012
Figure 13. Proposed approach to monitoring soil and pasture of the Montado ecosystem based on proximal and remote sensing.
Agronomy 10 00218 g013
Table 1. Soil parameters in experimental field at 0–0.30 m depth in October 2015 and March 2018: Global (all sampling points), UTC (12 sampling points under tree canopy), and OTC (12 sampling points outside tree canopy).
Date andGlobalUTCOTCSignificance
Soil ParametersMean ± SDCV (%)RangeMean ± SDMean ± SD(Probability)
October 2015
Coarse sand (%)48.4 ± 2.65.344.0–54.849.0 ± 2.447.8 ± 2.6ns
Fine sand (%)32.2 ± 2.06.329.4–36.731.8 ± 1.532.6 ± 2.4ns
Silt (%)10.1 ± 1.716.46.7–13.09.8 ± 1.510.3 ± 1.8ns
Clay (%)9.3 ± 1.414.96.7–11.99.4 ± 1.09.3 ± 1.7ns
OM (%)2.0 ± 0.840.21.0–3.52.7 ± 0.51.3 ± 0.20.0000
pH5.4 ± 0.36.04.9–6.25.4 ± 0.45.3 ± 0.2ns
P2O5 (mg kg−1)92.9 ± 62.467.126.0–343.0117.7 ± 77.068.2 ± 29.50.0571
K2O (mg kg−1)269.9 ± 135.950.394.0–540.0359.3 ± 112.8180.5 ± 91.90.0012
Mg (mg kg−1)95.6 ± 43.745.720.0–180.0115.0 ± 38.876.3 ± 40.90.0503
Mn (mg kg−1)76.4 ± 44.958.714.0–175.0100.0 ± 45.752.8 ± 30.10.0131
CEC (cmol kg−1)7.3 ± 1.216.34.9–9.48.0 ± 0.86.6 ± 1.10.0058
March 2018
OM (%)2.4 ± 0.833.31.1–4.03.1 ± 0.51.7 ± 0.40.0000
pH5.6 ± 0.34.55.2–6.15.6 ± 0.35.6 ± 0.2ns
P2O5 (mg kg−1)70.3 ± 27.238.817.0–132.088.6 ± 20.751.9 ± 19.70.0002
K2O (mg kg−1)165.8 ± 66.039.878.0–304.0210.3 ± 63.1121.3 ± 28.50.0002
Mg (mg kg−1)92.5 ± 24.326.255.0–150.099.6 ± 27.085.4 ± 19.80.0441
Mn (mg kg−1)32.9 ± 14.243.211.6–64.839.3 ± 15.926.5 ± 8.90.0380
SD—Standard deviation; CV—Coefficient of variation; UTC—Under tree canopy; OTC—Outside tree canopy; OM—Organic matter; CEC—Cationic exchange capacity.
Table 2. Pasture productivity (biomass, kg ha−1) of the studied field for each sampling date: Global (all sampling points), UTC (12 sampling points under tree canopy), and OTC (12 sampling points outside tree canopy).
Pasture ParameterGlobalUTCOTCSignificance
Biomass (kg ha−1)Mean ± SDCV (%)RangeMean ± SDMean ± SD(Probability)
March 201611426 ± 632855.41920–297008747 ± 421014106 ± 70950.0307
April 201616903 ± 826448.96170–3753012403 ± 391021403 ± 91280.0002
May 201624148 ± 1358456.37010–5229015148 ± 585633149 ± 132210.0000
June 201611003 ± 648358.91440–259206017 ± 312215990 ± 48880.0000
February 20176588 ± 316148.0800–119006875 ± 25006300 ± 3802ns
March 201711050 ± 537548.63200–2500010808 ± 487611292 ± 6041ns
April 201712771 ± 710655.65100–3670010975 ± 522714567 ± 8440ns
May 20175242 ± 215141.01600–98004717 ± 20805767 ± 21780.0765
June 20171604 ± 74446.4400–39001483 ± 7371725 ± 763ns
February 20184487 ± 295365.80–116805000 ± 27333973 ± 3193ns
March 20187427 ± 451960.81440–184007267 ± 36017587 ± 5448ns
April 201817520 ± 921552.65760–4608018160 ± 706716880 ± 11256ns
May 201811996 ± 398333.24500–2100012158 ± 350411833 ± 4566ns
March 201613763 ± 577942.06800–262009875 ± 179417650 ± 58000.0011
SD—Standard deviation; CV—Coefficient of variation; UTC—Under tree canopy; OTC–Outside tree canopy.
Table 3. Pasture quality (CP, crude protein, %; and NDF, neutral detergent fiber, %) of the studied field for each sampling date: Global (all sampling points), UTC (12 sampling points under tree canopy) and OTC (12 sampling points outside tree canopy).
Pasture ParameterGlobalUTCOTCSignificance
CP (%)Mean ± SDCV (%)RangeMean ± SDMean ± SD(Probability)
March 201613.8 ± 2.820.68.7–19.814.8 ± 3.512.8 ± 1.60.0300
April 201611.9 ± 3.529.26.5–22.213.4 ± 4.210.5 ± 1.80.0375
May 201610.3 ± 3.029.55.1–17.512.0 ± 2.98.6 ± 2.20.0009
June 20167.6 ± 2.532.64.1–14.58.5 ± 3.16.7 ± 1.3ns
February 201716.9 ± 4.928.78.6–28.119.7 ± 4.514.2 ± 3.50.0083
March 201715.4 ± 3.321.710.2–21.316.0 ± 3.514.8 ± 3.2ns
April 20179.2 ± 2.628.25.6–16.111.0 ± 2.27.4 ± 1.30.0005
May 20179.1 ± 2.022.35.5–13.210.6 ± 1.67.7 ± 1.20.0006
June 20176.7 ± 1.724.94.4–9.18.0 ± 1.15.4 ± 0.80.0000
February 201818.7 ± 4.926.18.7–25.321.3 ± 3.815.9 ± 4.50.0025
March 201818.3 ± 4.625.28.3–27.021.7 ± 3.415.0 ± 3.00.0001
April 201813.2 ± 3.728.38.3–25.515.5 ± 3.610.8 ± 2.00.0008
May 201815.2 ± 3.221.010.2–24.116.4 ± 2.814.0 ± 3.20.0621
June 201813.8 ± 2.820.68.7–19.814.8 ± 3.512.8 ± 1.60.0300
NDF (%)
March 201638.1 ± 5.313.829.5–50.240.0 ± 5.836.2 ± 4.10.0987
April 201652.9 ± 5.911.143.1–64.355.4 ± 5.350.5 ± 5.50.0084
May 201664.0 ± 4.46.853.8–74.163.6 ± 5.664.5 ± 2.9ns
June 201666.8 ± 6.19.155.3–78.368.5 ± 6.865.1 ± 5.0ns
February 201749.9 ± 10.821.735.0–77.548.5 ± 8.651.2 ± 12.9ns
March 201750.5 ± 6.412.636.9–64.651.5 ± 4.749.6 ± 7.8ns
April 201760.6 ± 4.27.053.1–70.260.8 ± 3.460.4 ± 5.10.0729
May 201770.7 ± 3.55.065.6–79.668.8 ± 1.972.7 ± 3.70.0007
June 201776.0 ± 3.74.868.4–83.974.0 ± 3.578.1 ± 2.60.0057
February 201834.3 ± 11.934.618.6–58.935.0 ± 8.333.5 ± 15.3ns
March 201836.0 ± 10.428.717.4–52.638.3 ± 9.833.8 ± 10.8ns
April 201840.3 ± 7.117.731.3–52.642.9 ± 7.137.7 ± 6.50.0227
May 201846.8 ± 7.115.233.0–60.349.0 ± 6.944.7 ± 7.00.0325
June 201860.2 ± 3.45.751.7–66.461.1 ± 2.059.2 ± 4.3ns
SD—Standard deviation; CV—Coefficient of variation; UTC—Under tree canopy; OTC—Outside tree canopy; CP—Crude protein; NDF—Neutral detergent fiber.
Table 4. Pasture quality (PMC, pasture moisture content, %; and PQDI, pasture quality degradation index, %) of the studied field for each sampling date: Global (all sampling points), UTC (12 sampling points under tree canopy) and OTC (12 sampling points outside tree canopy).
Pasture ParameterGlobalUTCOTCSignificance
PMC (%)Mean ± SDCV (%)RangeMean ± SDMean ± SD(Probability)
March 201685.2 ± 4.24.974.6–91.384.7 ± 5.485.8 ± 2.6ns
April 201685.5 ± 2.42.878.8–89.785.0 ± 3.185.9 ± 1.3ns
May 201684.6 ± 5.26.176.1–93.281.1 ± 3.888.0 ± 4.00.0003
June 201659.8 ± 6.410.745.5–72.459.1 ± 6.160.5 ± 6.9ns
February 201774.8 ± 11.014.742.1–88.178.7 ± 6.171.0 ± 13.6ns
March 201779.4 ± 5.97.562.5–86.979.0 ± 7.079.7 ± 5.0ns
April 201764.3 ± 6.29.754.5–77.962.5 ± 6.366.2 ± 5.8ns
May 201745.8 ± 9.520.822.5–60.243.8 ± 10.547.9 ± 8.4ns
June 201714.5 ± 4.732.26.3–26.314.3 ± 4.714.7 ± 4.8ns
February 201877.5 ± 7.810.155.6–86.178.6 ± 6.976.2 ± 8.9ns
March 201882.4 ± 5.26.366.7–88.983.9 ± 3.180.9 ± 6.5ns
April 201884.6 ± 2.42.979.6–88.685.6 ± 2.283.6 ± 2.30.0234
May 201882.7 ± 2.83.373.3–87.183.6 ± 2.081.7 ± 3.10.0583
June 201868.5 ± 5.78.354.2–77.866.5 ± 6.970.6 ± 3.10.0996
PQDI
March 20162.9 ± 0.621.41.5–4.62.9 ± 0.82.8 ± 0.4ns
April 20164.8 ± 1.531.72.3–8.84.5 ± 1.55.1 ± 1.5ns
May 20166.9 ± 2.536.83.1–12.65.6 ± 1.68.1 ± 2.70.0071
June 20169.6 ± 3.031.04.2–16.89.0 ± 3.310.1 ± 2.6ns
February 20173.3 ± 1.752.21.4–9.02.6 ± 0.94.0 ± 2.10.0355
March 20173.5 ± 1.029.12.3–6.43.4 ± 0.83.5 ± 1.2ns
April 20177.1 ± 2.129.43.9–12.55.7 ± 1.18.5 ± 1.90.0050
May 20178.2 ± 2.227.25.2–14.46.7 ± 1.29.7 ± 2.00.0002
June 201712.2 ± 3.629.27.5–18.89.5 ± 2.014.9 ± 2.50.0001
February 20182.1 ± 1.466.40.9–6.31.7 ± 0.62.5 ± 1.90.0109
March 20182.1 ± 1.151.81.0–6.11.8 ± 0.42.5 ± 1.40.0518
April 20183.2 ± 0.825.91.9–5.52.8 ± 0.63.6 ± 0.90.0137
May 20183.2 ± 0.927.71.5–5.93.0 ± 0.53.4 ± 1.1ns
June 20186.0 ± 1.422.93.8–8.25.4 ± 1.26.7 ± 1.30.082
SD—Standard deviation; CV—Coefficient of variation; UTC—Under tree canopy; OTC—Outside tree canopy; PMC—Pasture moisture content; PQDI—Pasture quality degradation index.
Table 5. Floristic composition (botanical species mean cover, %) of pasture of the studied field in spring 2016 and spring 2018, under tree canopy (UTC) and outside tree canopy (OTC).
Botanical SpeciesSpring 2016Spring 2018
(Mean Cover, %)UTCOTCUTCOTC
Anagalis arvensis1.00.60.00.0
Arum italicum0.00.01.10.0
Astragalus pelecinus0.00.30.00.0
Bromus diandrus1.70.442.819.4
Calendula arvensis0.10.10.00.0
Cerastium glomeratum0.11.84.60.0
Chamaemelum fuscatum0.00.00.48.1
Chamaemelum mixtum6.917.00.00.0
Crepis capillaris0.00.00.02.4
Diplotaxis catholica0.66.30.515.5
Echium sp.0.00.10.00.0
Erodium malacoides0.00.05.40.0
Erodium moschatum40.215.636.237.9
Geranium molle1.01.40.00.0
Gramínea sp.12.91.60.00.0
Gynandriris sisyrinchium1.40.00.00.2
Hordeum murinum0.00.05.10.0
Leontodon taraxacoides6.212.20.02.4
Ornithopus sp.0.00.30.00.0
Plantago coronopus1.88.40.00.0
Plantago lagopus0.00.00.01.4
Plantago lanceolata0.41.70.00.0
Poa annua1.21.10.00.0
Raphanus raphanistrum0.01.00.00.6
Rumex bucephalophorus0.25.90.02.5
Rumex conglomeratus0.60.00.00.0
Senecio vulgaris0.00.41.74.5
Sherardia arvensis0.10.10.00.5
Silene sp.0.10.00.00.0
Sonchus oleraceus2.72.10.00.0
Spergula arvensis0.51.70.02.7
Stachys arvensis0.00.30.00.0
Stellaria media3.51.00.00.8
Trifolium glomeratum2.00.10.00.0
Trifolium incarnatum0.01.00.00.0
Trifolium repens1.44.20.00.0
Trifolium resupinatum0.59.60.00.0
Tripholium subterraneum0.00.00.01.1
Urtica sp.1.90.10.00.0
Urtica urens0.00.02.20.0
Vulpia sp.11.13.30.00.0
Total100.0100.0100.0100.0
UTC—Under tree canopy; OTC—Outside tree canopy. Shaded values indicate the predominant species.
Table 6. Normalized difference vegetation index (NDVI), measured by OptRx sensor, and corrected meter readings (CMR), measured by Grassmaster II probe, of the studied field for each sampling date: Global (all sampling points), UTC (12 sampling points under tree canopy), and OTC (12 sampling points outside tree canopy).
Pasture ParameterGlobalUTCOTCSignificance
NDVIMean ± SDCV (%)RangeMean ± SDMean ± SD(Probability)
March 20160.780 ± 0.0638.10.625–0.8490.764 ± 0.0790.796 ± 0.0390.0790
April 20160.732 ± 0.0658.90.621–0.8430.741 ± 0.0780.723 ± 0.050ns
May 20160.644 ± 0.0639.80.524–0.7570.667 ± 0.0510.622 ± 0.069ns
June 20160.345 ± 0.07321.10.204–0.5060.361 ± 0.0700.329 ± 0.075ns
February 20170.779 ± 0.09211.80.558–0.8850.825 ± 0.0460.733 ± 0.1040.0090
March 20170.807 ± 0.0617.60.642–0.8800.803 ± 0.0770.811 ± 0.043ns
April 20170.583 ± 0.10017.10.397–0.8440.609 ± 0.1260.556 ± 0.0570.0433
May 20170.342 ± 0.07822.80.248–0.5050.369 ± 0.0780.315 ± 0.0710.0181
June 20170.197 ± 0.02512.50.160–0.2420.216 ± 0.0180.177 ± 0.0100.0000
February 20180.802 ± 0.08410.50.493–0.8980.829 ± 0.0410.774 ± 0.1070.0464
March 20180.804 ± 0.08710.80.474–0.8770.835 ± 0.0290.773 ± 0.1130.0719
April 20180.796 ± 0.0567.00.605–0.8640.822 ± 0.0320.771 ± 0.0640.0297
May 20180.781 ± 0.0445.70.678–0.8240.805 ± 0.0200.757 ± 0.0490.0152
June 20180.548 ± 0.10018.30.422–0.7720.579 ± 0.1210.517 ± 0.065ns
CMR
March 20166992 ± 187926.93453–107315944 ± 13678039 ± 17650.0026
April 20168564 ± 210124.54760–121536994 ± 119910134 ± 15530.0000
May 20169497 ± 216028.83922–129945818 ± 112411176 ± 15290.0000
June 20165735 ± 195334.13400–108614322 ± 5687148 ± 18170.0000
February 20174489 ± 63114.13446–56184605 ± 6334372 ± 634ns
March 20177082 ± 176124.93850–98886782 ± 18637381 ± 1679ns
April 20174941 ± 90518.33829–75834919 ± 8214965 ± 1035ns
May 20173804 ± 54514.33125–53893528 ± 2394056 ± 630ns
June 2017------
February 20184688 ± 92919.83435–65645035 ± 9704311 ± 7500.0320
March 20185535 ± 107719.53535–70935977 ± 8025093 ± 11660.0162
April 20186295 ± 104916.74604–82536605 ± 7645985 ± 1227ns
May 20187356 ± 108514.75883–93217087 ± 10087626 ± 1134ns
June 20186498 ± 124919.24024–85315731 ± 10887266 ± 8900.0015
SD—Standard deviation; CV—Coefficient of variation; UTC—Under tree canopy; OTC—Outside tree canopy; NDVI—Normalized difference vegetation index; CMR—Corrected meter readings.
Table 7. Best significant relationships between soil, pasture, and sensors parameters: (i) Relationships between soil apparent electrical conductivity (ECa) measured by Dualem sensor and soil parameters; (ii) relationships between corrected meter readings (CMR) measured by Grassmaster II probe and pasture parameters; (iii) relationships between normalized difference vegetation index (NDVI) measured by OptRx sensor and pasture parameters.
Soil and Pasture Characteristics (as Dependent Variables)Equation Parameters Measured by Proximal Sensors (as Independent Variables, x)R2
Clay (%)Clay = 0.309x + 5.7418 0.5487 *
CEC (cmol kg−1)CEC = 0.2237x + 4.6912(i) ECa (mS m−1)0.3908 *
SMC (%)SMC = 0.3018x + 6.0362 0.4802 *
Biomass (kg ha−1)Biomass = 5 × 10−5x2 + 2.3518x − 5205.7(ii) CMR0.7505 **
PMC (%)PMC = −3 × 10−6x2 + 0.0411x − 76.598 0.6049 *
Biomass (kg ha−1)Biomass = −114008x2 + 131904x − 22068 0.4703 *
PMC (%)PMC = −198.04x2 + 300.23x − 32.397 0.9134 **
CP (%)CP = 34.748x2 − 21.137x + 10.586(iii) NDVI0.8186 **
NDF (%)NDF = −90.48x2 + 39.537x + 68.62 0.8421 **
PQDIPQDI = −14.296x + 14.49 0.9282 **
ECa—Soil apparent electrical conductivity; CMR—Corrected meter readings; NDVI—Normalized difference vegetation index; CEC—Cationic exchange capacity; SMC—Soil moisture content; PMC—Pasture moisture content; CP—Crude protein; NDF—Neutral detergent fibre; PQDI—Pasture quality degradation index; * and **—Significant correlations (p < 0.05% and p < 0.01%, respectively).

