Water Balance and Nitrate and Salt Exports from a Saline–Sodic Irrigation District in Castelflorite (Huesca, NE Spain)


1
Departamento de Ciencias Agrarias y del Medio Natural, Escuela Politécnica Superior, Universidad de Zaragoza, Carretera de Cuarte s/n, 22071 Huesca, Spain
2
Instituto Universitario de Investigación en Ciencias Ambientales de Aragón (IUCA), Universidad de Zaragoza, 50009 Zaragoza, Spain
*
Author to whom correspondence should be addressed.
Agronomy 2020, 10(2), 165; https://doi.org/10.3390/agronomy10020165
Submission received: 9 January 2020
/
Accepted: 21 January 2020
/
Published: 23 January 2020
(This article belongs to the Special Issue Selected Papers from 10th Iberian Agroengineering Congress)
Abstract
:In the current context of climate change, there is growing interest in the optimization of water management in irrigated areas, in semi-arid environments. The design of adequate adaptation and mitigation measures requires specific data at different scales of the water management hierarchy, up to basin level. In this work, the irrigation and drainage system of San Pedro de Castelflorite Irrigation Community (Huesca province, NE Spain), first set up as a flood irrigation system around 1970 and then modernized to sprinkler irrigation around 2008, was studied over two irrigation seasons. The land in this basin, with a surface of 11,450 ha, is affected by severe sodicity problems, which impedes cultivation in large areas. Most of the drainage water discharges into Clamor Vieja ravine, in which the quantity and quality of drainage, using water, salt, and nitrogen balances, were monitored. The water regime was found to be essentially regulated by irrigation. From the water balance, the consumed and the recoverable fractions were estimated at 76% and 23%, respectively, and the depleted beneficial fraction for the irrigated area at 73%. A predominance of salt dissolution processes over precipitation processes was found, with salt exports of approximately 2000 kg ha−1·year−1. The nitrogen exported by the drainage water was 7 kg N·ha−1·year−1. This value, remarkably lower than those reported for nearby basins in the central Ebro valley, can be attributed to the flooding of rice fields and to the low permeability of the soils present in this basin, which would hamper nitrate washing through the soil profile.
1. Introduction
In arid and semi-arid areas, irrigation is essential to profitable agriculture, in such a way that irrigated agriculture is generally the main user of fresh water. Spain currently has ca. 3.5 million hectares of irrigated land, which account for approximately 20% of the cultivated territory. 22% of that irrigated surface is in the Ebro basin (NE Spain), where irrigation uses 80% of the water collected in a semi-arid environment. In the future, an increase in the irrigated acreage is expected, together with an increase in the demand for quality water for non-agricultural uses. In this context, the optimization of the use of irrigation water is a priority objective, as well as making irrigated agriculture more sustainable from an environmental perspective [1].
In semi-arid environments, irrigation represents an important modification of the hydrological cycle [2]. One of the problems that derive from such modification refers to drainage waters, through which various natural salts, fertilizers, and other phytochemicals are exported. In this context, the management of the irrigated agricultural areas can be assessed through basin-wide studies on water use efficiency and on the release of aforementioned salts and nutrients from the irrigated area.
In the central Ebro valley, several of those basin-wide studies have been conducted for Bárdenas irrigation district (including, for instance, the Lerma and Arba basins [3,4,5,6,7,8,9,10]) and for Riegos del Alto Aragón irrigation district, RAAID (which includes the Irrigation Community of LASESA—an acronym formed by the addition of the first two letters of the three villages LAstanosa, SEna and SAriñena where the irrigated district is located [11,12,13], Del Reguero basin [14], Flumen basin [15], Valcuerna gully [16,17] and La Violada, discussed below). In these studies, different values of irrigation efficiency and water drainage chemistry have been reported under diverse irrigation systems.
It is worth noting that the amounts of exported salts and nitrogen depend on the volume of percolation and on the amount of salts and nitrogen available for washing. To reduce this export, an increase in irrigation efficiency program has been put forward. The recent modernization of irrigation in Spain has generally consisted of a transformation of the water distribution system from surface irrigation to sprinkler irrigation. Based on the higher efficiency of sprinkler irrigation, one would expect an improvement in the quantity and quality of water in the rivers [18,19].
Newly modernized irrigation communities offer a suitable scenario to evaluate the impact of aforementioned transformation on the use of water and to assess its effects on the quantity and quality of water. An example of a long-term monitoring of one of those irrigation communities, that of La Violada, has been reported in [20,21,22,23,24,25,26,27].
However, there are cases of failure in the sustainability of irrigation in some cultivated areas, and a common reason for such failures is soil salinity or/and sodicity, either natural or induced by irrigation transformation [27]. Although salinity problems have been reported in the case of La Violada and other areas of RAAID, a very serious case of saline–sodic soils occurs in the San Pedro de Castelflorite Irrigation Community, chosen for the study presented herein. This area, in the Clamor Vieja (CV) basin (a small tributary of Cinca River), covers an extension of 11,450 ha, out of which 46% is non-irrigated land. This basin was initially set up as a flood irrigation system between 1972 and 1976. The levelling of plots, and the argillaceous geology, led to major problems of hydraulic conductivity and sodicity [28]. To face them, a complex and gradual process of transformation to sprinkler irrigation was initiated in 2008. The aim of this article was to analyze the use of water and to determine the quantity and quality of drainage after the transformation. A balance of water and a study of the salts and nitrogen exported in drainage water was carried out during two irrigation seasons, between April 2009 and September 2010.
2. Materials and Methods
2.1. Location
San Pedro de Castelflorite Irrigation Community (CRSPC) comprises part of the municipalities of Alcolea de Cinca, Castelflorite, Peralta de Alcolea, San Miguel de Cinca, and Sariñena (Huesca, NE Spain). It is located on the right bank of the middle section of Cinca River and manages an area of almost 5000 ha, corresponding to hydraulic sectors XVII, XVIII, XIX, XX, and XXI of the Cinca irrigation canal, in RAAID (Figure 1).
The CV ravine drains a basin of 11,450 ha, out of which approximately 54% of the surface is irrigated. Of that irrigated area, 92% belongs to CRSPC and the rest to Santa Cruz Irrigation Community. The return flow of irrigation essentially comes from CRSPC. In the 70s, flood irrigation was set up in this area and, 40 years later, the distribution network was changed, replacing the irrigation ditches with pressure pipes. Farmers have mostly switched to sprinkler irrigation, except for the lower section of sectors XVII, XVIII and XIX, in which flood irrigation for rice was still predominant at the time of the present study.
The climate in this area is characterized by a cold period of five months and a warm period of three months. The average temperature and annual rainfall are 14 °C and 370 mm, respectively. Rainfall concentrates in spring and autumn, with a dry period of 9 months, from February to mid-October (excluding storms). The annual baseline evapotranspiration (ET0) is estimated at 1132 mm. The average relative humidity varies from 54% (July) to 78% (December), and wind speed ranges from 1.2 to 2 m·s−1.
The geological context (Figure 2) consists of horizontal clay-loam strata interspersed with continental Miocene sandstone from the Ebro valley. The high areas are covered by Plio–Quaternary gravel, and the rest is a flat-bottomed valley that flows into the alluvial terraces of the Cinca. Three soil types, according to United States Department of Agriculture (USDA) Soil Taxonomy [29], have been described: Typic Xerorthent, Typic Xerofluvent, and Typic Calcixerept. The granulometry is heterogeneous, with representation of almost all textural classes including silty and argillaceous. The silt is predominantly fine, especially in the loam and clay-loam textures, in which the fine silt constitutes about 50% of the total granulometry [30,31]. A significant part of the soil in this basin is affected by salinity and sodicity problems, and therefore it is either barren land or it is used to grow rice. Its hydraulic conductivity is generally low (0.05 to 0.3 m·day−1) or very low (less than 0.05 m·day−1) except for soils with coarse textures, in which it is medium (0.3 to 1 m·day−1) [28].
2.2. Land, Water, and Nitrogen Use
SIGPAC (Spanish geographic information system of agricultural plots) was chosen as the cartographic base. The data of crops grown on each plot was obtained from farmers’ EU Common Agricultural Policy (CAP) reports, and crop maps were generated by aggregation. Potential evapotranspiration (ETP) was calculated using Penman-Monteith equation [32]. Total water volume usage data were obtained from the records of the Irrigation Community. Irrigation data per crop were estimated from surveys to local farmers, as in Jiménez-Aguirre et al. [26]. These surveys (n = 36) also helped to determine agronomic practices, fertilization, type of fertilizers and dates of application, and to estimate crop yields. Nitrogen extraction by crops (NU) was obtained as the product of yield by the N content in the crop. The N content in each 1000 kg of harvested dry matter was estimated at 22 kg for rice, 24 kg for barley, 17.3 kg for maize grain (14% moisture), 29 kg for alfalfa, 22 kg for other fodder and 12.5 kg for peas [33,34]. Extractions of N contained in maize crop residues were not considered because incorporating crop residues into the soil it is common practice in the area of study. Irrigation management was analyzed using the annual relative irrigation supply index (ARIS), i.e., the amount of irrigation water applied (IWA) divided by the seasonal net irrigation requirements (IRn) [35]. Nitrogen fertilizer management was assessed as the ratio between mineral nitrogen fertilization and crop nitrogen extraction (NMF/NU).
2.3. Drainage Volume and Composition
The drainage was gauged using an OTT-C2 mini current meter (OTT Hydromet GmbH, Kempten, Germany), using the sections method [36]. It was sampled on a weekly basis during the irrigation seasons and every two weeks during the rest of the year. Temperature and electrical conductivity (EC) were measured in situ with a WTW 315i handheld meter (Xylem Analytics-WTW, Weilheim, Germany). The nitrate concentration was spectrophotometrically determined at 220 and 275 nm with an ATI Unicam 5625 UV/Vis spectrometer (Thermo Scientific, Cambridge, MA, USA) in a quartz cell with a 1 cm light path, by acidification with HCl 1N.
2.4. Water Balance
Water balance calculations were carried out at two different scales and using different methodologies. The basic level, commonly used in agriculture, uses the crop as the only management unit; the second level, widely used in hydrology, is the basin. The water balance per crop allows estimation of the volume of water used by all crops through evapotranspiration (ET) and the volume of water drained by the soil (DS). Using irrigation data, a monthly soil water balance was calculated for each of the crops cultivated in the basin between April 2009 and September 2010. The balance followed the methodology explained in [37], considering rainfall (R) and irrigation (I) inputs and evapotranspiration (ET), wind drift and evaporation losses in the sprinkler irrigation system (WDEL) and DS outputs. WDEL were estimated according to Playán et al. [38]. As the water stored in the soil was unknown at the beginning of the period of study (1 April 2009), it was assumed that the water content on this date was half of the available water holding capacity (AWHC), as in other studies conducted in irrigated areas of the Ebro valley [39].
In a second stage, the hydrological balance of the whole basin was calculated, which required adding the data of the plots included in the basin to those of the unirrigated area in order to know the total values of R, I, ET, and WDEL. To do this, two more parameters had to be determined: the excess water discharged into the ravine by Terreu irrigation canal (C), supplied by the Ebro Basin Water Authority, and the actual drainage to CV ravine (D). Hence, the water balance was determined as the difference between water inputs (R + I + C) and outputs (ET + D + WDEL) in the basin system. These volumes were grouped into six-month periods with irrigation (April to September) and six-month periods without irrigation (October to March). The error balance (%) was calculated as 200 × [(inputs − outputs)/(inputs + outputs)], not admitting errors higher than 10% for the hydrological balance.
To evaluate water use according to a water accounting model, it is necessary to determine the different uses of the system’s outputs [40]. Therefore, each of the outputs was assigned to its corresponding use: crops’ ET was considered beneficial evapotranspiration (ETB); ET in uncultivated areas and in the cultivated areas during those months in which there was no crop (or in which the crop was dry), and WDEL were considered non-beneficial evapotranspiration (ETNB); and runoff/percolation would correspond to drainage. It can be recoverable (RPR) or non-recoverable (RPNR), depending on the scale and quality of the drainage water. If the scale of the Ebro basin is considered, the drainage water from CV returns to Cinca River and can be reused. Therefore, it was considered to be reusable.
The hydrological indicators relate the volumes of water used to each other by means of the following equations proposed by Willardson et al. [41], Molden et al. [42] and Perry et al. [43]:
CF = (ETB + ETNB)/WU,
NCF = RPR/WU,
DBF = ETB/(ETB + ETNB + RPNR),
In these equations, CF is the consumed fraction (%), NCF is the non-consumed fraction (%) and DBF is the depleted beneficial fraction (%). ETB is the volume of beneficial evapotranspiration, ETNB is the volume of non-beneficial evapotranspiration, RPR is the volume of recoverable runoff/percolation, RPNR is the volume of non-recoverable runoff/percolation and total water use (WU = R + I + C) is the total available water volume.
2.5. Salt Balance
The salt balance provides the salt mass in each component of the water balance. This corresponds to the product of the volume of water and its salinity (product of the EC of the water in dS·m−1 by a conversion factor of 640 mg·L−1) [44]. Evapotranspiration and losses due to evaporation and wind drift in sprinkler irrigation were the two components of the water balance that were not taken into account as they are considered free of ions. It was also assumed that the export of salts by crops was negligible, according to [45]. Thus, the salt balance had the following components: salt input by irrigation (SI) and rainfall (SR) and salt output by drainage (SD). The increase in salts in the system due to irrigation (ΔS) would be the difference between the inputs (SI and SR) and the output (SD). If this ΔS is positive, it is interpreted as a salt accumulation process and, if it is negative, as a reduction in the amount of salt.
SR was calculated from the EC of 22 rainwater samples from the rain gauge of the University of Zaragoza at Huesca, 40 km from the area of study, multiplied by the annual rainfall. SI was estimated from EC data from station #441 of the CEMAS (Control del Estado de las Masas de Agua, tr. Water Status Control) network, supplied by the Ebro Basin Water Authority.
2.6. Nitrogen Loads
The nitrogen loads were calculated between November 2008 and October 2010, taking into consideration the most important inputs and outputs of N into/from the system. The losses to the atmosphere due to volatilization and denitrification were not taken into account, due to the lack of data. The inputs considered were the nitrogen in irrigation water (NI), in rainfall (NR) and in the discharge of excess water from the Terreu canal to the ravine (NC). In addition, nitrogen applied as mineral fertilizer (NMF), nitrogen applied as organic fertilizer (NOF), and symbiotic fixation by legumes (SFN) were considered. The outputs considered were the mass of nitrogen in the drainage water (ND) and nitrogen extraction by crops (NU). The difference between inputs and outputs was the nitrogen variation in the system (∆N).
NMF was obtained by multiplying the fertilizer doses by the richness in N of the fertilizers used. In the irrigated area, fertilizer doses were estimated from the surveys conducted among the local farmers. For non-surveyed crops, such as rainfed barley, fodder, olive grove, sunflower, and other minority crops, fertilization data for the Alcanadre basin, presented in San Román [46], were used. However, given that the water balance in the soil showed that no drainage was generated in the rainfed area, nitrogen fertilization in the rainfed area could be safely excluded from the basin-level balance, since leaching would not occur and it would not affect the water quality of the CV ravine. It is also worth noting that alfalfa can cover its N needs thanks to symbiotic fixation, but if nitrogen fertilizer is added, the plant prefers the fertilizer, stops producing nodules and fixing atmospheric nitrogen through bacteria. Farmers usually supply N in mineral form, although not covering all the needs (about 400 kg N·ha−1), in such a way that symbiotic fixation covers the rest of alfalfa’s N requirements. In addition, when an alfalfa field is harvested, the amount of N remaining in the soil, in the crowns and roots left in the field, accounts for at least 150 kg N·ha−1. The release of nitrogen from crowns, roots and crop residues is slow and occurs within three to four years after it has been buried [47]. To quantify this contribution of N associated with mineralization, a value of 37.5 kg N·ha−1 was chosen and multiplied by the area in which alfalfa had been harvested.
The nitrogen provided by organic fertilization (NOF) was calculated from the livestock census in the area: 26,270 pigs, 5701 sheep, and 570 calves. The net value of N reaching the ground by type of animal and year was estimated at 8.7 kg/pig; 18.9 kg/sheep and 77 kg/calf [48]. It was assumed that manure was applied homogeneously over the entire cultivated area of the basin with an average annual value of 41 kg N·ha−1. The nitrogen input of rainwater (NR) was established as the product of the rainfall volume by the nitrate concentration, determined by sample analysis in the laboratories of the Escuela Politécnica Superior using the equipment described in Section 2.3. The nitrogen input of irrigation water (NI) was obtained from nitrogen concentration data, supplied by the Ebro Basin Water Authority, multiplied by the total water irrigation volume. The mass of nitrogen discharged through the ravine (ND) was calculated as the product of the volume of gauged water by its concentration of nitric nitrogen, assuming that most of the N present in water was in the form of nitrate. Finally, the increase in N in the basin (∆N) was calculated as the inputs (NMF + NOF + SFN + NI + NR + NC) minus the outputs (NU + ND).
3. Results and Discussion
3.1. Crops
The maps in Figure 3 show the different crops grown in the 2009 and 2010 seasons. Unirrigated crops, mainly barley (2086 ha in 2009 and 2273 ha in 2010), took up 46% of the basin.
The main crops grown in the irrigated plots were rice, maize, barley, and alfalfa. The distribution was similar in 2009 and 2010, although there was a slight decrease in rice and maize (by 13% and 9%, respectively) and an increase in barley and alfalfa (by 25% and 31%, respectively).
Rice was the main crop, accounting for 22% of the irrigated area. It is cultivated in saline-sodium soils of low permeability, given that it is the only crop that can withstand flooding, which allows a temporary displacement of salts from the root zone. In the cultivation of rice, the practice of “fangueo” is carried out in this region, which consists of the tilling of the flooded land with an iron wheeled tractor, so that the straw and the remains of the previous crop are incorporated into the soil in anaerobic conditions. Through this technique, a soil that already had a very low conductivity is compacted, obtaining a practically impermeable layer that reduces losses by deep percolation [49]. In November, the remains of the previous year’s crop were rotavated into the soil, which was then chisel-ploughed and fertilized in March and then rotavated again. In May, it was flooded and sown (200 kg seed·ha−1). Those farmers who chose not to rotavate the remains back into the earth only rotavated in February. In June, herbicide was applied, and the crops were top-dressed. Crops were harvested in October, with a return of about 6000 kg·ha−1. It is worth noting that during part of the crop cycle, rice paddies were subject to continuous overflow. The irrigation in this area varied between 900 and 1400 mm·year−1. Rice was the most irrigated crop in both seasons, with an average of 1080 mm·year−1.
Maize was grown on 17% of the irrigated land. It was sown at the beginning of May, after the stover had been broken down, the fields had been chisel-ploughed and rotavated, and basal dressing had been applied. On average, 85,000 plants were sown per hectare. Then, a pre-emergence herbicide was applied. The crops were irrigated from July to September, with an average annual irrigation of 735 mm. Crops were fertilized twice through the irrigation water and received a post-emergence herbicide treatment. In November, around 14,000 kg·ha−1 were harvested. Second harvests, after peas and barley, had slightly different tasks and dates, and were sown later in the year. After peas, 13,000 kg·ha−1 were obtained, while after barley the yield was 11,000 kg·ha−1.
Barley took up 16% of the irrigated surface. When it was planted after maize, the maize stover was broken down, the field was chisel-ploughed, and then subsoiled, and basal dressing was applied. In November, 200 kg·ha−1 were sown. In March, herbicide, fungicide and top dressing were applied. Barley received around 165 mm of irrigation water·year−1, making it the least irrigated crop. In June, around 5000 to 7000 kg·ha−1 were harvested, in contrast with the 2500 kg·ha−1 of non-irrigated fields.
Alfalfa accounted for 13% of the irrigated land. It was most commonly sown in autumn, but also in spring. Before sowing, the field was subsoiled, cultivated, rolled, and basal dressing was applied and rotavated. After the harvest, the field was rolled again. Once the alfalfa was set, from the second year onwards, it received two to three top dressings in April, June, and August, with low nitrogen doses. In this area, alfalfa is usually kept in fields for five years and is cut five or six times a year, from April to October, with 35 days between cuttings. The average irrigation was 680 mm·ha−1. The annual alfalfa returns were about 15,000 kg·ha−1.
3.2. Water and Nitrogen Use
Table 1 summarizes values for the surface, IWA, seasonal net irrigation requirements (IRn), ARIS index, mineral nitrogen fertilizer (NMF), nitrogen theoretically taken up by crops (NU) and their ratio (NMF/NU) for the most important crops in the basin under study.
According to the ARIS index, the excess irrigation for rice, maize and barley was 50%, and 20% for alfalfa. The results presented in this study showed a higher ARIS index for rice, maize and barley—and a similar value in the case of alfalfa—than those reported in previous works in the Ebro basin [12,17,50,51,52,53]. Average ARIS index values of 0.87, 1.2, 1.21 and 1.25 for barley, maize, rice, and alfalfa, respectively, were reported by Salvador et al. [53] for the entire Ebro basin (compared to 1.5, 1.55, 1.5 and 1.25 in the CV basin, respectively). However, if one takes into account the standard deviations reported by [53], the results for CV basin would only be significantly higher in the case of maize.
The highest NMF figure corresponded to maize (263 kg·ha−1), and was similar to those reported in other sprinkler irrigation areas [54]. NMF values for rice (165 kg·ha−1) and irrigated barley (163 kg·ha−1) were very similar to each other, and the later was similar to those reported for other flood [55] and sprinkler [17] irrigated areas in the Ebro valley.
The relationship between applied mineral nitrogen and that used by the crops (NMF/NU) varied from 0.3 for alfalfa to 1.2 for rice. Alfalfa’s value would be explained by the fact that it received 30% of its needs through fertilizers, while the rest was symbiotically fixed. In contrast, rice crops received 20% more NMF than they needed. Flooding of the soil in the rice fields favors denitrification [56], so the proportions of the different forms of nitrogen are modified, making NH4+ the dominant and most stable form of nitrogen. Unlike NO3−, NH4+ is not leached, so while the soil is flooded, excess fertilizer that is in the form of NH4+ will not be washed. In the dry season of rice fields, nitrification will make NO3− the dominant form, but its leaching will be limited by the low hydraulic conductivity soil layer. The ca. 20% fertilizer excess that rice does not extract stays in the soil for the next season [57]. In contrast, in the cases of maize and barley, excessive irrigation would wash away nitrogen, which then enters the water cycle, polluting underground water and superficial drainage collectors. Thus, maize and barley fields were identified as the main source of nitrogen pollution caused by excessive fertilization and irrigation [13,17].
3.3. Quantity and Quality of Drained Water
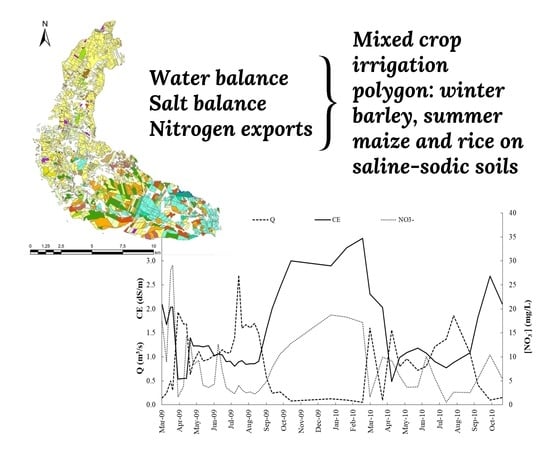
Figure 4 shows the evolution of discharge (Q), EC and nitrate concentration [NO3−] in the CV ravine between April 2009 and November 2010. During the two irrigation seasons, the drainage discharge increased, in such a way that the volume of water drained was six times higher than that outside the irrigation season. Hence, the water regime of the basin would essentially be regulated by irrigation, as it occurs in many other semi-arid areas [58,59]. The highest drainage peak was registered in August 2009, when high rainfall was also recorded, and the EC of the drainage water ranged from 0.48 to 3.47 dS·m−1. In general, the highest nitrate concentration values were observed during the winter months of lower discharge, remaining below 30 mg·L−1. During the irrigation season, these values were reduced by half in the case of [NO3−] and by 60% in the case of the EC due to the dilution effect produced by the irrigation returns.
3.4. Water Balance
The monthly evolution of the water balance in the basin showed that during the irrigation seasons the values of inputs and outputs doubled, considering the whole basin. If only irrigation is factored in, they tripled (Figure 5). Irrigation (I) was the main water input to the basin during the irrigation season, from April to October. Logically, irrigation varied throughout the irrigation season, reaching its highest monthly values in July and August (around 150 mm). In terms of outputs, the most important contribution was evapotranspiration (ET), with an average value of 650 mm for the irrigated sectors during the irrigation seasons.
The water drained from the basin during the irrigation seasons was on average 157 mm, which accounted for 30% of the outputs. The evolution of drainage was the same during the two irrigation campaigns, with peaks in May and August. If one considers that the drainage water would come only from the irrigated area, the volume drained during the irrigation season would exceed 400 mm. Such high value is typical of surface-irrigated areas [3,60].
The water balance of the basin is presented in Table 2. The bottom line of the water balance during the two irrigation campaigns had errors slightly above 10%, but the accumulated error over the 18 months was only 1.1% (in favor of the inputs), so the water balance estimation could be considered to be adequate. Rainfall (R) was the main water input to the basin during all periods except in the 2010 irrigation campaign, in which irrigation (I) was the main contribution, followed by the discharge of water from the Terreu irrigation canal (C). Evapotranspiration (ET) constituted 72% of the water output, followed by drainage (D) with 26% and the WDEL with 2%. Drainage was six times higher during the irrigation season than at other times of the year.
The average annual water input to the basin was 790 mm, out of which 415 was associated with rainfall, 237 mm with irrigation, and 138 mm with Terreu irrigation canal discharge. Figure 6 shows the distribution of the available water by the Irrigation Community members among the possible uses, following an accounting model. In the basin under study, an average of 597 mm of water would be consumed per year, out of which 371 mm would correspond to crop evapotranspiration. The CV ravine would discharge 184 mm of water to the Cinca River. In other words, the CF would be 76% and the NCF would be 23% of the total water input. Due to the balance error, the calculated fractions would add up to 99% instead of 100%. The DBF would be 62% and the non-beneficial depleted fraction would be 38%.
In the irrigation area, I and R added up to 1033 mm, out of which 925 mm would be consumed by ET, although only 671 mm would correspond to direct crop evapotranspiration. According to the water balance in the soil, 10% of the inputs would leave the root zone and become drainage (DS), with values of 20% for rice, 2% for barley, 12% for maize and 0% for alfalfa. The whole basin’s DS may be estimated at 41 mm. This value is close to 47 mm, i.e., the difference between the direct contribution of the Terreu irrigation canal (C, 138 mm) and the actual drainage (D, 184 mm). In other words, the CF in the irrigated area was 90% of the total water use. This CF was higher than that of surface-irrigated areas (0.66) and lower than that of sprinkler-irrigated areas in RAAID (0.94) [19]. The beneficial or crop evapotranspiration represented 65% of total water use (59% in the surface-irrigated plots with rice, and 60, 73 and 70% in the sprinkler-irrigated plots with maize, alfalfa and barley), and the DBF for CRSPC reached 0.73, lower than those of other sprinkler- (0.83) and surface-irrigated (0.95) districts of RAAID.
3.5. Salt Balance
According to the water balance, there would be no drainage in the non-irrigated land. Thus, for the salt balance, all the drained water would be assigned to the irrigation system. The mass of salt was calculated using the EC of some of the elements of the water balance. Table 3 summarizes the salt balance and the values of salt inputs and outputs into/from the basin. For each hectare of irrigation, an annual average of 1187 kg of salt would enter through the irrigation water. This would represent 62% of the inputs, even though the irrigation water has a low concentration of salts. The water discharged directly from the irrigation canal into the ravine was also considered. As evaporation and evapotranspiration do not export salts, the only output would be drainage, with an average annual value estimated at 3878 kg·ha−1. This value of exported salts would be similar to that recorded in the irrigated lands of Bárdenas [3,61,62], and would be between two and six times lower than those recorded in the irrigated lands of Violada [20,24,55] and Valcuerna [16] basins. This difference may be ascribed to the absence of gypsum in the subsoil and to the low hydraulic conductivity of the soils in the CV basin.
Of the salts exported by drainage, 51% came from the washing of soil salts and dissolution of geological materials; another 31% originated from salts introduced with irrigation water; and only 2% corresponded to salts contained in rainwater. The remaining 17% of the salts present in the drainage water would originate from the discharge of excess water from the Terreu irrigation canal into the CV ravine. The difference between salt inputs and outputs in the irrigated area of the CV was negative. This means that the salts would be washed away at around 2000 kg·ha−1, which would imply a predominance of salt dissolution processes over precipitation processes.
3.6. Nitrogen Loads
The nitrogen loads were also based on the water balance between April 2009 and September 2010. Its calculation is more complex than that of the salt balance because the main inputs and outputs, such as fertilization and harvest, depend on each individual farmer’s actions. Table 4 shows the main components of the nitrogen loads. Rainfall and irrigation contributed an annual average of 5 and 2 kg N·ha−1, respectively. The average mineral and organic fertilization doses were 191 and 41 kg N·ha−1. Mineralization of the roots and crowns of previous alfalfa crops were estimated to produce a symbiotic N fixation value of 1 kg N·ha−1. Mineral fertilization represented the main N input into the irrigation system (80%). The next most important input would be organic fertilization, which represented 17% of the inputs.
Nitrogen extracted by irrigated crops (NU) accounted for 97% of the outputs, with an average value of 199 kg N·ha−1. The nitrogen exported by the drainage water would be the other output, with an annual average value of 7 kg N·ha−1. This value would be much lower than that recorded in other basins with sprinkler irrigation in the Ebro valley [17]. According to the proposed water balance, over-fertilized and over-irrigated crops, mainly maize, would be responsible for most nitrogen exports. However, the N exported by drainage would only represent 2.4% of the organic and mineral fertilization. This percentage would be very low in comparison with other studies, which may be ascribed to the flooding of the rice fields, which makes NH4+ the predominant N form [57,63], and to the low permeability of the soils present in this basin, which would hamper nitrate washing through the soil profile and aquifers. In addition, part of the N would be captured by algae growth in ponded water. An alternative explanation that should also be considered is that part of the N may be lost as NH4+, in particular since—as noted above—the rice paddies in the area were subject to continuous overflow during part of the crop cycle. In addition, N-NH4+ cannot be easily measured in the drainage water by chemical procedures. This could be an interesting issue to ascertain in future studies, in line with Moreno-García et al. [64].
The total amount of nitrogen exported by the crops was estimated at about 199 kg N·ha−1. Since the mineral fertilizer dose was 191 kg N·ha−1, a figure that would match the extractions, it appears that nitrogen from organic fertilization (41 kg N·ha−1) would not be taken into account by farmers as an effective nitrogen input.
4. Conclusions
The Clamor Vieja basin hydrological unit, basically clayey, was chosen to study the effects of the transformation from flood irrigation to sprinkler irrigation in soils with sodicity problems. The main crops grown in the irrigated plots during the period of study were rice (22%), maize (17%), barley (16%) and alfalfa (13%). The drainage of the basin was found to be directly related to irrigation, without the presence of buffer aquifers, in such a way that during the irrigation seasons the drainage flow considerably increased, with volumes of drained water six times higher than those at other times of the year.
From the basin water balance, the CF and the recoverable fraction were estimated at 76 and 23% with respect to the total input water, respectively. If only the irrigated area was considered, the CF represented 90% of total water use. The beneficial or crop evapotranspiration represented 65% of total water use, while the DBF reached 0.73.
The dilution effect produced by the irrigation returns resulted in remarkable decreases in the EC (by 60%) and in nitrates (by 50%) during the irrigation seasons. The highest nitrate concentrations, registered in winter months, remained below 30 mg·L−1. The drainage water exported 3878 kg salts·ha−1·year−1. The difference between salt inputs and outputs in the irrigated area was negative (i.e., salts would be washed away at around 2000 kg·ha−1·year−1), indicating a predominance of salt dissolution processes over precipitation processes.
The N-NO3− exported by the drainage water value was very low (7 kg N·ha−1·year−1) in comparison with other studies. This may be due to the flooding of the rice fields, which makes NH4+ the predominant N form, and to the low permeability of the soils present in this basin, which would hamper nitrates washing. Further research is needed to ascertain this issue.
Author Contributions
Conceptualization, R.A. and J.A.C.; formal analysis, R.A., P.M.-R. and J.A.C.; funding acquisition, J.A.C.; investigation, R.A.; methodology, J.A.C.; project administration, J.A.C.; resources, J.A.C.; supervision, J.A.C.; validation, R.A., P.M.-R. and J.A.C.; visualization, R.A. and P.M.-R.; writing—original draft preparation, R.A., P.M.-R. and J.A.C.; writing—review and editing, R.A., P.M.-R. and J.A.C. All authors have read and agreed to the published version of the manuscript.
Funding
This research received no external funding.
Acknowledgments
San Pedro de Castelflorite Irrigation Community members, and especially its President (Alberto Loscertales), are gratefully acknowledged for the information provided. We thank the two anonymous reviewers whose comments/suggestions have helped to improve and clarify this manuscript.
Conflicts of Interest
The authors declare no conflict of interest.
References
- Bruinsma, J. European and Central Asian Agriculture Towards 2030 and 2050; FAO Regional Office for Europe and Central Asia Budapest: Budapest, Hungary, 2012; p. 57. [Google Scholar]
- Schoups, G.; Hopmans, J.W.; Young, C.A.; Vrugt, J.A.; Wallender, W.W.; Tanji, K.K.; Panday, S. Sustainability of irrigated agriculture in the San Joaquin Valley, California. Proc. Natl. Acad. Sci. USA 2005, 102, 15352–15356. [Google Scholar] [CrossRef] [Green Version]
- Causapé, J.; Quílez, D.; Aragüés, R. Assessment of irrigation and environmental quality at the hydrological basin level: I. Irrigation quality. Agric. Water Manag. 2004, 70, 195–209. [Google Scholar]
- Causapé, J.; Quílez, D.; Aragüés, R. Assessment of irrigation and environmental quality at the hydrological basin level: II. Salt and nitrate loads in irrigation return flows. Agric. Water Manag. 2004, 70, 211–228. [Google Scholar]
- Causapé Valenzuela, J. Agro-environmental evaluation of irrigation land: II. Pollution induced by Bardenas Irrigation District (Spain). Agric. Water Manag. 2009, 96, 188–194. [Google Scholar]
- Abrahao, R.; Causapé, J.; García-Garizábal, I.; Merchán, D. Implementing irrigation: Water balances and irrigation quality in the Lerma basin (Spain). Agric. Water Manag. 2011, 102, 97–104. [Google Scholar] [CrossRef]
- Garcia-Garizabal, I.; Abrahao, R.; Causape, J. Irrigation management and pollution by salts and nitrate: Flood vs. pressurized system. Itea-Inf. Tec. Econ. Agrar. 2012, 108, 482–500. [Google Scholar]
- Merchán, D.; Causapé, J.; Abrahão, R.; García-Garizábal, I. Assessment of a newly implemented irrigated area (Lerma Basin, Spain) over a 10-year period. I: Water balances and irrigation performance. Agric. Water Manag. 2015, 158, 277–287. [Google Scholar]
- Merchán, D.; Causapé, J.; Abrahão, R.; García-Garizábal, I. Assessment of a newly implemented irrigated area (Lerma Basin, Spain) over a 10-year period. II: Salts and nitrate exported. Agric. Water Manag. 2015, 158, 288–296. [Google Scholar]
- Abrahão, R.; García-Garizábal, I.; Merchán, D.; Causapé, J. Climate change and the water cycle in newly irrigated areas. Environ. Monit. Assess. 2015, 187, 22. [Google Scholar] [CrossRef]
- Andrés, R.; Cuchí, J.A. Salt and nitrate exports from the sprinkler-irrigated Malfarás creek watershed (Ebro river valley, Spain) during 2010. Environ. Earth Sci. 2014, 72, 2667–2682. [Google Scholar] [CrossRef]
- Andrés, R.; Cuchí, J.A. Analysis of sprinkler irrigation management in the LASESA district, Monegros (Spain). Agric. Water Manag. 2014, 131, 95–107. [Google Scholar] [CrossRef]
- Andrés, R.; Cuchí, J.A. The use of nitrogen in a sprinkler-irrigated district in Monegros (Northeast Spain). Agric. Water Manag. 2014, 144, 120–133. [Google Scholar] [CrossRef]
- Skhiri, A.; Dechmi, F. Impact of sprinkler irrigation management on the Del Reguero river (Spain). I: Water balance and irrigation performance. Agric. Water Manag. 2012, 103, 120–129. [Google Scholar] [CrossRef] [Green Version]
- Sorando, R.; Comín, F.A.; Jiménez, J.J.; Sánchez-Pérez, J.M.; Sauvage, S. Water resources and nitrate discharges in relation to agricultural land uses in an intensively irrigated watershed. Sci. Total Environ. 2019, 659, 1293–1306. [Google Scholar] [CrossRef] [PubMed]
- Tedeschi, A.; Beltrán, A.; Aragüés, R. Irrigation management and hydrosalinity balance in a semi-arid area of the middle Ebro river basin (Spain). Agric. Water Manag. 2001, 49, 31–50. [Google Scholar] [CrossRef]
- Cavero, J.; Beltrán, A.; Aragüés, R. Nitrate Exported in Drainage Waters of Two Sprinkler-Irrigated Watersheds. J. Environ. Qual. 2003, 32, 916–926. [Google Scholar] [CrossRef]
- Lecina, S.; Isidoro, D.; Playán, E.; Aragüés, R. Irrigation Modernization in Spain: Effects on Water Quantity and Quality—A Conceptual Approach. Int. J. Water Res. Dev. 2010, 26, 265–282. [Google Scholar] [CrossRef] [Green Version]
- Lecina, S.; Isidoro, D.; Playán, E.; Aragüés, R. Irrigation modernization and water conservation in Spain: The case of Riegos del Alto Aragón. Agric. Water Manag. 2010, 97, 1663–1675. [Google Scholar] [CrossRef] [Green Version]
- Faci, J.; Aragüeś, R.; Alberto, F.; Quílez, D.; Machin, J.; Arrue, J.L. Water and salt balance in an irrigated area of the Ebro River Basin (Spain). Irrig. Sci. 1985, 6, 29–37. [Google Scholar]
- Isidoro, D.; Quilez, D.; Aragues, R. Environmental impact of irrigation in la violada district (Spain): I. Salt export patterns. J. Environ. Qual. 2006, 35, 766–775. [Google Scholar] [CrossRef]
- Isidoro, D.; Quilez, D.; Aragues, R. Environmental impact of irrigation in La Violada District (Spain): II. Nitrogen fertilization and nitrate export patterns in drainage water. J. Environ. Qual. 2006, 35, 776–785. [Google Scholar] [CrossRef] [PubMed]
- Barros, R.; Isidoro, D.; Aragüés, R. Long-term water balances in La Violada irrigation district (Spain): I. Sequential assessment and minimization of closing errors. Agric. Water Manag. 2011, 102, 35–45. [Google Scholar] [CrossRef] [Green Version]
- Barros, R.; Isidoro, D.; Aragüés, R. Three study decades on irrigation performance and salt concentrations and loads in the irrigation return flows of La Violada irrigation district (Spain). Agric., Ecosyst. Environ. 2012, 151, 44–52. [Google Scholar] [CrossRef] [Green Version]
- Barros, R.; Isidoro, D.; Aragüés, R. Irrigation management, nitrogen fertilization and nitrogen losses in the return flows of La Violada irrigation district (Spain). Agric. Ecosyst. Environ. 2012, 155, 161–171. [Google Scholar] [CrossRef] [Green Version]
- Jiménez-Aguirre, M.T.; Isidoro, D. Hydrosaline Balance in and Nitrogen Loads from an irrigation district before and after modernization. Agric. Water Manag. 2018, 208, 163–175. [Google Scholar] [CrossRef] [Green Version]
- Herrero, J.; Castañeda, C. The success story of irrigation against salinity in Violada, NE Spain. Land Degrad. Dev. 2018, 29, 3039–3049. [Google Scholar] [CrossRef]
- Andrés, R. Proyecto de la red de Drenajes para 1200 Hectáreas de Los Sectores XVIII y XIX del Cinca. C.R. San Pedro (Castelflorite, Huesca). Master's Thesis, Universidad de Zaragoza, Zaragoza, Spain, 2005. [Google Scholar]
- Soil Survey Staff. Soil Taxonomy: A Basic System of Soil Classification for Making and Interpreting Soil Surveys, 2nd ed.; US Government Printing Office: Washington, DC, USA, 1999; p. 886. [Google Scholar]
- Cuchí Oterino, J.A. Aportaciones al Conocimiento de los Suelos Salinos de Aragón; Instituto Nacional de Investigaciones Agrarias: Madrid, Spain, 1989; p. 417. [Google Scholar]
- Andrés Mateo, R.; Usón Murillo, A. Diseño del drenaje en zonas salino-sódicas de Monegros. In Tecnología de Suelos: Estudio de Casos; Usón Murillo, A., Boixadera Llobet, J., Bosch Serra, D., Enrique Martín, A., Eds.; Universidad de Zaragoza: Zaragoza, Spain, 2010; pp. 219–235. [Google Scholar]
- Allen, R.G.; Pereira, L.S.; Raes, D.; Smith, M. Crop Evapotranspiration-Guidelines for Computing Crop Water Requirements; FAO—Food and Agriculture Organization of the United Nations: Rome, Italy, 1998; p. 15. [Google Scholar]
- Dominguez Vivancos, A. Tratado de Fertilización; Mundi-Prensa: Madrid, Spain, 1996; p. 613. [Google Scholar]
- Canadian Fertilizer Institute. Nutrient Uptake and Removal by Field Crops-Western Canada; Canadian Fertilizer Institute: Ottawa, ON, Canada, 2001; p. 2. [Google Scholar]
- Malano, H.M.; Burton, M. Guidelines for Benchmarking Performance in the Irrigation and Drainage Sector; IPTRID Secretariat-Food and Agriculture Organization of the United Nations: Rome, Italy, 2001; p. 50. [Google Scholar]
- Turnipseed, D.P.; Sauer, V.B. Discharge Measurements at Gaging Stations; U.S. Geological Survey: Reston, VA, USA, 2010.
- Causapé Valenzuela, J. EMR 1.0: Herramienta al servicio de la vigilancia agroambiental del regadío. ITEA Inf. Téc. Econ. Agrar. 2008, 104, 369–380. [Google Scholar]
- Playán, E.; Salvador, R.; Faci, J.M.; Zapata, N.; Martínez-Cob, A.; Sánchez, I. Day and night wind drift and evaporation losses in sprinkler solid-sets and moving laterals. Agric. Water Manag. 2005, 76, 139–159. [Google Scholar] [CrossRef] [Green Version]
- Causapé Valenzuela, J. Agro-environmental evaluation of irrigation land: I. Water use in Bardenas irrigation district (Spain). Agric. Water Manag. 2009, 96, 179–187. [Google Scholar]
- Molden, D. Accounting for Water Use and Productivity; International Irrigation Management Institute: Colombo, Sri Lanka, 1997; Volume 1, p. 26. [Google Scholar]
- Willardson, L.; Allen, R.; Frederiksen, H. Elimination of irrigation efficiencies. In Proceedings of the Acta 13th Technology Conference USCID, Denver, CO, USA, 13–18 November 1994; pp. 19–22. [Google Scholar]
- Molden, D.J.; Sakthivadivel, R.; Perry, C.J.; de Fraiture, C.; Kloezen, W.H. Indicators for Comparing Performance of Irrigated Agricultural Systems; International Water Management Institute (IWMI): Colombo, Sri Lank, 1998; p. 26. [Google Scholar]
- Perry, C.; Steduto, P.; Allen, R.G.; Burt, C.M. Increasing productivity in irrigated agriculture: Agronomic constraints and hydrological realities. Agric. Water Manag. 2009, 96, 1517–1524. [Google Scholar] [CrossRef] [Green Version]
- Rhoades, J.; Chanduvi, F.; Lesch, S. Soil Salinity Assessment: Methods and Interpretation of Electrical Conductivity Measurements; FAO—Food & Agriculture Organization of the United Nations: Rome, Italy, 1999; p. 165. [Google Scholar]
- Tanji, K.K.; Kielen, N.C. Agricultural Drainage Water Management in Arid and Semi-Arid Areas; FAO—Food and Agriculture Organization of the United Nations: Rome, Italy, 2002; p. 205. [Google Scholar]
- San Román, J. Control. de los Retornos de las Actividades Agrarias de la Cuenca del Ebro: Evaluación de las Tendencias de la Calidad del Agua, Control Experimental de los Retornos y Propuesta de red de Control (tr. Report on Control of Returns of Agricultural Activities in the Ebro Basin: Evaluation of Water Quality Trends, Experimental Return Control and Control netWork Proposal); Centro de Investigación y Tecnología Agroalimentaria de Aragón (CITA-DGA): Zaragoza, Spain, 2007; p. 288. [Google Scholar]
- Delgado Enguita, I.; Muñoz, F.; Andueza, D.; Martínez, N. Acción del abonado nitrogenado sobre el crecimiento y la movilización de reservas nitrogenadas de la alfalfa. In Proceedings of the Producción de Pastos, Forrajes y Céspedes: Actas XLII Reunión Científica de la Sociedad Española para el Estudio de los Pastos, Dicions de la Universitat de Lleida, Lleida, Spain, 6–10 May 2002; pp. 327–332. [Google Scholar]
- Orús Pueyo, F. Estiércoles, nitrógeno y cargas ganaderas. Criterios para la valoración del contenido de nitrógeno de los estiércoles, según la Unión Europea; Diputación General de Aragón, Dirección General de Tecnología Agraria, Servicio de Formación y Extensión Agraria: Zaragoza, Spain, 2003; p. 16. [Google Scholar]
- Moreno García, B. Respuesta del Arroz a la Fertilización con Purín Porcino en Condiciones Mediterráneas. Ph.D. Thesis, Universidad de Zaragoza, Zaragoza, Spain, 2017. [Google Scholar]
- Faci, J.M.; Bensaci, A.; Slatni, A.; Playán, E. A case study for irrigation modernisation. Agric. Water Manag. 2000, 42, 313–334. [Google Scholar] [CrossRef] [Green Version]
- Dechmi, F.; Playán, E.; Faci, J.M.; Tejero, M. Analysis of an irrigation district in northeastern Spain. Agric. Water Manag. 2003, 61, 75–92. [Google Scholar] [CrossRef] [Green Version]
- Zapata, N.; Playán, E.; Skhiri, A.; Burguete, J. Simulation of a Collective Solid-Set Sprinkler Irrigation Controller for Optimum Water Productivity. J. Irrig. Drain. Eng. 2009, 135, 13–24. [Google Scholar] [CrossRef] [Green Version]
- Salvador, R.; Martínez-Cob, A.; Cavero, J.; Playán, E. Seasonal on-farm irrigation performance in the Ebro basin (Spain): Crops and irrigation systems. Agric. Water Manag. 2011, 98, 577–587. [Google Scholar] [CrossRef] [Green Version]
- Sexton, B.T.; Moncrief, J.F.; Rosen, C.J.; Gupta, S.C.; Cheng, H.H. Optimizing Nitrogen and Irrigation Inputs for Corn Based on Nitrate Leaching and Yield on a Coarse-Textured Soil. J. Environ. Qual. 1996, 25, 982–992. [Google Scholar] [CrossRef]
- Isidoro, D.; Quílez, D.; Aragüés, R. Environmental Impact of Irrigation in La Violada District (Spain). J. Environ. Qual. 2006, 35, 776–785. [Google Scholar] [CrossRef]
- Reddy, K.R.; Patrick, W.H. 5. Denitrification losses in flooded rice fields. Fertil. Res. 1986, 9, 99–116. [Google Scholar]
- Belder, P.; Bouman, B.A.M.; Spiertz, J.H.J.; Peng, S.; Castañeda, A.R.; Visperas, R.M. Crop performance, nitrogen and water use in flooded and aerobic rice. Plant Soil 2005, 273, 167–182. [Google Scholar] [CrossRef]
- Cai, X.; McKinney, D.C.; Rosegrant, M.W. Sustainability analysis for irrigation water management in the Aral Sea region. Agric. Syst. 2003, 76, 1043–1066. [Google Scholar] [CrossRef] [Green Version]
- Schoups, G.; Lee Addams, C.; Gorelick, S.M. Multi-objective calibration of a surface water-groundwater flow model in an irrigated agricultural region: Yaqui Valley, Sonora, Mexico. Hydrol. Earth Syst. Sci. 2005, 2, 2061–2109. [Google Scholar] [CrossRef] [Green Version]
- Isidoro, D.; Quílez, D.; Aragüés, R. Water balance and irrigation performance analysis: La Violada irrigation district (Spain) as a case study. Agric. Water Manag. 2004, 64, 123–142. [Google Scholar] [CrossRef]
- Causapé, J. Aprovechamiento del agua en los regadíos de Bardenas. Inf. Téc. Econ. Agrar. 2009, 105, 202–221. [Google Scholar]
- Abrahao, R.; Causapé, J.; García-Garizábal, I.; Merchán, D. Implementing irrigation: Salt and nitrate exported from the Lerma basin (Spain). Agric. Water Manag. 2011, 102, 105–112. [Google Scholar] [CrossRef]
- Antonopoulos, V.Z. Modelling of water and nitrogen balances in the ponded water and soil profile of rice fields in Northern Greece. Agric. Water Manag. 2010, 98, 321–330. [Google Scholar] [CrossRef]
- Moreno-García, B.; Guillén, M.; Quílez, D. Response of paddy rice to fertilisation with pig slurry in northeast Spain: Strategies to optimise nitrogen use efficiency. Field Crops Res. 2017, 208, 44–54. [Google Scholar] [CrossRef]
Figure 1.
(Top left) Ebro River basin location and (top right) Clamor Vieja basin location. RAAID stands for Riegos del Alto Aragón Irrigation District. (Bottom) Hydraulic sectors in the Clamor Vieja irrigation district.
Figure 1.
(Top left) Ebro River basin location and (top right) Clamor Vieja basin location. RAAID stands for Riegos del Alto Aragón Irrigation District. (Bottom) Hydraulic sectors in the Clamor Vieja irrigation district.

Figure 2.
Geomorphology of Clamor Vieja basin.

Figure 3.
Maps of crops grown in (left) 2009 and (right) 2010 in the Clamor Vieja basin.

Figure 4.
Evolution of discharge (Q), electric conductivity (EC) and nitrate concentration [NO3−] in the Clamor Vieja ravine between April 2009 and October 2010.
Figure 4.
Evolution of discharge (Q), electric conductivity (EC) and nitrate concentration [NO3−] in the Clamor Vieja ravine between April 2009 and October 2010.

Figure 5.
Monthly evolution of inputs (rainfall, R; irrigation, I; Terreu irrigation canal discharge, C) and outputs (evapotranspiration, ET; drainage, D; wind drift and evaporation losses in the sprinkler irrigation system, WDEL) of water in the basin (a) and in the irrigated area (b) between April 2009 and October 2010.

Figure 6.
Water use in the Clamor Vieja basin between April 2009 and October 2010.


Table 1.
Surface, irrigation water applied (IWA), seasonal net irrigation requirements (IRn), annual relative irrigation supply index (ARIS), mineral nitrogen fertilizer (NMF), crop nitrogen uptake (NU) and relationship between applied mineral nitrogen and that used by the crops (MNF/NU) for the main irrigated crops in the Clamor Vieja basin in 2009 and 2010.
| Crops | Surface | IWA | IRn | ARIS | NMF | NU | NMF/NU | ||||
|---|---|---|---|---|---|---|---|---|---|---|---|
| (ha) | (mm) | (mm) | (kg ha−1) | ||||||||
| 2009 | 2010 | 2009 | 2010 | 2009 | 2010 | 2009 | 2010 | 2009–2010 | |||
| Rice | 1034 | 896 | 980 | 1180 | 700 | 773 | 1.4 | 1.5 | 165 | 132 | 1.2 |
| Barley | 622 | 777 | 120 | 210 | 79 | 144 | 1.5 | 1.5 | 163 | 144 | 1.1 |
| Maize | 770 | 701 | 670 | 800 | 428 | 533 | 1.6 | 1.5 | 263 | 242 | 1.1 |
| Alfalfa | 485 | 633 | 620 | 740 | 495 | 601 | 1.3 | 1.2 | 142 | 435 | 0.3 |
Table 2.
Inputs (rainfall, R; irrigation, I; and Terreu irrigation canal discharge, C), outputs (evapotranspiration, ET; drainage, D; and wind drift and evaporation losses in the sprinkler irrigation system, WDEL), and estimated errors in the Clamor Vieja basin water balance between April 2009 and September 2010.
| April/September 2009 | October 2009/March 2010 | April/September 2010 | April 2009/September 2010 | ||
|---|---|---|---|---|---|
| hm3 | |||||
| Inputs | R | 33.5 | 22.8 | 15.9 | 72.2 |
| I | 24.4 | 0.9 | 28.1 | 53.5 | |
| C | 0 | 5.3 | 20.8 | 26.2 | |
| 58.0 | 29.0 | 64.8 | 151.8 | ||
| Outputs | ET * | 43.5 | 25.5 | 38.5 | 107.5 |
| WDEL | 1.6 | 0.1 | 2.0 | 3.6 | |
| D | 19.0 | 3.1 | 17.0 | 39.1 | |
| 64.2 | 28.6 | 57.5 | 150.2 | ||
| Balance Error | (%) | −10.2 | 1.5 | 12.1 | 1.1 |
| Accumulated Balance Error | (%) | −10.2 | −6.4 | 1.1 | 1.1 |
* Includes both ETB and ETNB.
Table 3.
Salt balance: salt input [in rainfall (SR), irrigation (SI), and in water from Terreu canal discharge (SC)], salt output [in drainage (SD),] and increase in salt (∆S) in the irrigated lands in Clamor Vieja basin between April 2009 and September 2010.
Table 3.
Salt balance: salt input [in rainfall (SR), irrigation (SI), and in water from Terreu canal discharge (SC)], salt output [in drainage (SD),] and increase in salt (∆S) in the irrigated lands in Clamor Vieja basin between April 2009 and September 2010.
| April/September 2009 | October 2009/March 2010 | April/September 2010 | April 2009/September 2010 | ||
|---|---|---|---|---|---|
| kg·ha−1 | |||||
| Input | SR | 63 | 43 | 30 | 136 |
| SI | 1158 | 37 | 1141 | 2337 | |
| SC | 1 | 220 | 843 | 1065 | |
| Output | SD | 2805 | 1192 | 2566 | 6563 |
| ∆S | −1582 | −892 | −551 | −3026 | |
Table 4.
Nitrogen loads. Total nitrogen input and output (in kg/ha) in the basin.
| April/September 2009 | October 2009/September 2010 | April 2009/September 2010 | April 2009/September 2010 | ||
|---|---|---|---|---|---|
| kg·ha−1 | % | ||||
| Inputs | NR | 3.7 | 4.3 | 8.0 | 1.7 |
| NI | 2.8 | 1.7 | 4.5 | 0.9 | |
| NMF | 193 | 190 | 383 | 80 | |
| NOF | 43 | 39 | 82 | 17 | |
| NFS | 0.9 | 1.1 | 1.9 | 0.4 | |
| NC | 0.0 | 1.6 | 1.6 | 0.3 | |
| Outputs | NU | 197 | 200 | 397 | 97 |
| ND | 6 | 6 | 11 | 3 | |
| ∆N | 40.8 | 31.4 | 72.2 | ||
NR: nitrogen in rainfall; NI: nitrogen in irrigation water; NMF: nitrogen applied as mineral fertilizer; NOF: nitrogen applied as organic fertilizer; NFS: nitrogen symbiotic fixation by legumes; NC: nitrogen in the discharge of excess water from the Terreu canal to the ravine; ND: nitrogen in the drainage water; NU: nitrogen extraction by crops.
© 2020 by the authors. Licensee MDPI, Basel, Switzerland. This article is an open access article distributed under the terms and conditions of the Creative Commons Attribution (CC BY) license (http://creativecommons.org/licenses/by/4.0/).
Share and Cite
MDPI and ACS Style
Andrés, R.; Martín-Ramos, P.; Cuchí, J.A. Water Balance and Nitrate and Salt Exports from a Saline–Sodic Irrigation District in Castelflorite (Huesca, NE Spain). Agronomy 2020, 10, 165. https://doi.org/10.3390/agronomy10020165
AMA Style
Andrés R, Martín-Ramos P, Cuchí JA. Water Balance and Nitrate and Salt Exports from a Saline–Sodic Irrigation District in Castelflorite (Huesca, NE Spain). Agronomy. 2020; 10(2):165. https://doi.org/10.3390/agronomy10020165
Chicago/Turabian StyleAndrés, Raúl, Pablo Martín-Ramos, and José Antonio Cuchí. 2020. "Water Balance and Nitrate and Salt Exports from a Saline–Sodic Irrigation District in Castelflorite (Huesca, NE Spain)" Agronomy 10, no. 2: 165. https://doi.org/10.3390/agronomy10020165
Note that from the first issue of 2016, this journal uses article numbers instead of page numbers. See further details here.