3.2. The Crossover Time
For the single beam collimated case, one may solve Equation (5a) to obtain an analytic formula for the UV light exposure time (
t) as a function of the initiator concentration and light intensity as follows:
Experimental crossover time defines the time required to reach the gel point which is defined by the storage-loss moduli of the polymer [
4,
18,
19,
20]. However, a theoretical crossover time (
T*) has not been defined previously. Because the gelation causes the depletion of the initiator concentration and the photoinitiation rate is proportional to the product of the light intensity and the initiator concentration, we propose the possible definition of the crossover time (
T*) shall include: (1) the time required to reach the gel point of the material which needs the measured data of the dynamic moduli and the gel point; (2) the time required for the photoinitiation rate (at a given medium thickness) reaches certain saturated value; or (3) the time required for the initiator concentration
C(
z,
t =
T*) reduces to certain cut-off level such as 1/
e (0.36) or 1/
e2 (or 0.135) of its initial value
C(
z,0).
As defined by Equation (3), the photoinitiation rate,
R(
z,
t), is proportional to the product of the light intensity and the initiator concentration. Therefore, a theoretical
T* based on the depletion level of
C(
z,
t) is equivalent to that of
R(
z,
t). In this study, without knowing the measured moduli, we propose a theoretical
T* based on the depletion cut-off level of the initiator concentration and choose the 1/
e2 reduction level, or when
C0/
C(
z,
T*) =
e2 = 7.39. Using this definition, an analytical expression for
T* is derived from Equation (7)
where the surface crossover time
T0 =
T*(
z = 0) is given by
T0 = 0.024/(ε
1ϕλ
I0). The above equation shows that the crossover time is a nonlinearly increasing function of
z. For a UV laser at 365 nm and for a quantum yield ϕ = 0.2,
T0 = 3278/(ε
1I0). For example, for ε
1 = 0.5 (mM·cm)
−1,
Ts* = 655 s for a light intensity
I0 = 10 mW/cm
2 and reduces to 218 s for
I0 = 30 mW/cm
2. Inside the medium (
z > 0), the cross over time increases with
z, as shown by the
Q term of Equation (8b). For example, for
C0 = 10 mM (or 0.4% mg/mL) and
I0 = 10 mW/cm
2,
T*(at
z = 500 µm) =825 s, which is 1.26 times of the surface value.
The above described crossover time defined by the depletion cut-off level of the initiator concentration may also be realized as the light exposure time which defines the initiator concentration cut-off level to move from the medium surface (
z = 0) to the medium thickness (
z =
L). Alternatively, we may define the crossover time by the photoinitiation rate. Using the analytic formula of Equation (5) to calculate
R(
z,
t) defined by Equation (4), we obtain:
We should note that the photoinitiation rate
R(
z,
t) is characterized by the competing process between
I(
z,
t) and
C(
z,
t). Therefore, we expect an optimal photoinitiation rate defined by both
z and
t. Taking ∂
R(
z,
t)/∂(ε
1C0) = 0 at
C(
z,
t) =
C0*, we may derive an optimal product (ε
1C0*) which is proportional to
eX/
z. More detail of the optimal photoinitiation rate will be published elsewhere [
17].
Our theoretical
T* may be used to analyze the measured crossover time of reference [
4] which showed that the crossover time is inversely proportional to the UV light intensity. These measured features are consistent with our formula Equation (8a). However, unlike our theoretical
T* (with
z-dependent), their data only showed the crossover time for the completion of gelation for a given thickness (
z) and did not measure the
z-dependence of
T*. Our theory provides useful guidance for future experimental works. The measured crossover time of reference [
4] may be also analyzed by Equation (9) as follows. For a given cut-off level of the photoinitiation rate
R*(
z,
T*), the crossover time is inverse proportional to
R* and is found to be proportional to ε
1C0I0 from Equation (9) [
17]. Furthermore, higher photoinitiation rate provides a shorter crossover time for gelation. This relationship is consistent with the measured data of reference [
4], where the crossover time is a decreasing function of the light intensity and the initiator initial concentration.
3.3. Numerical Results
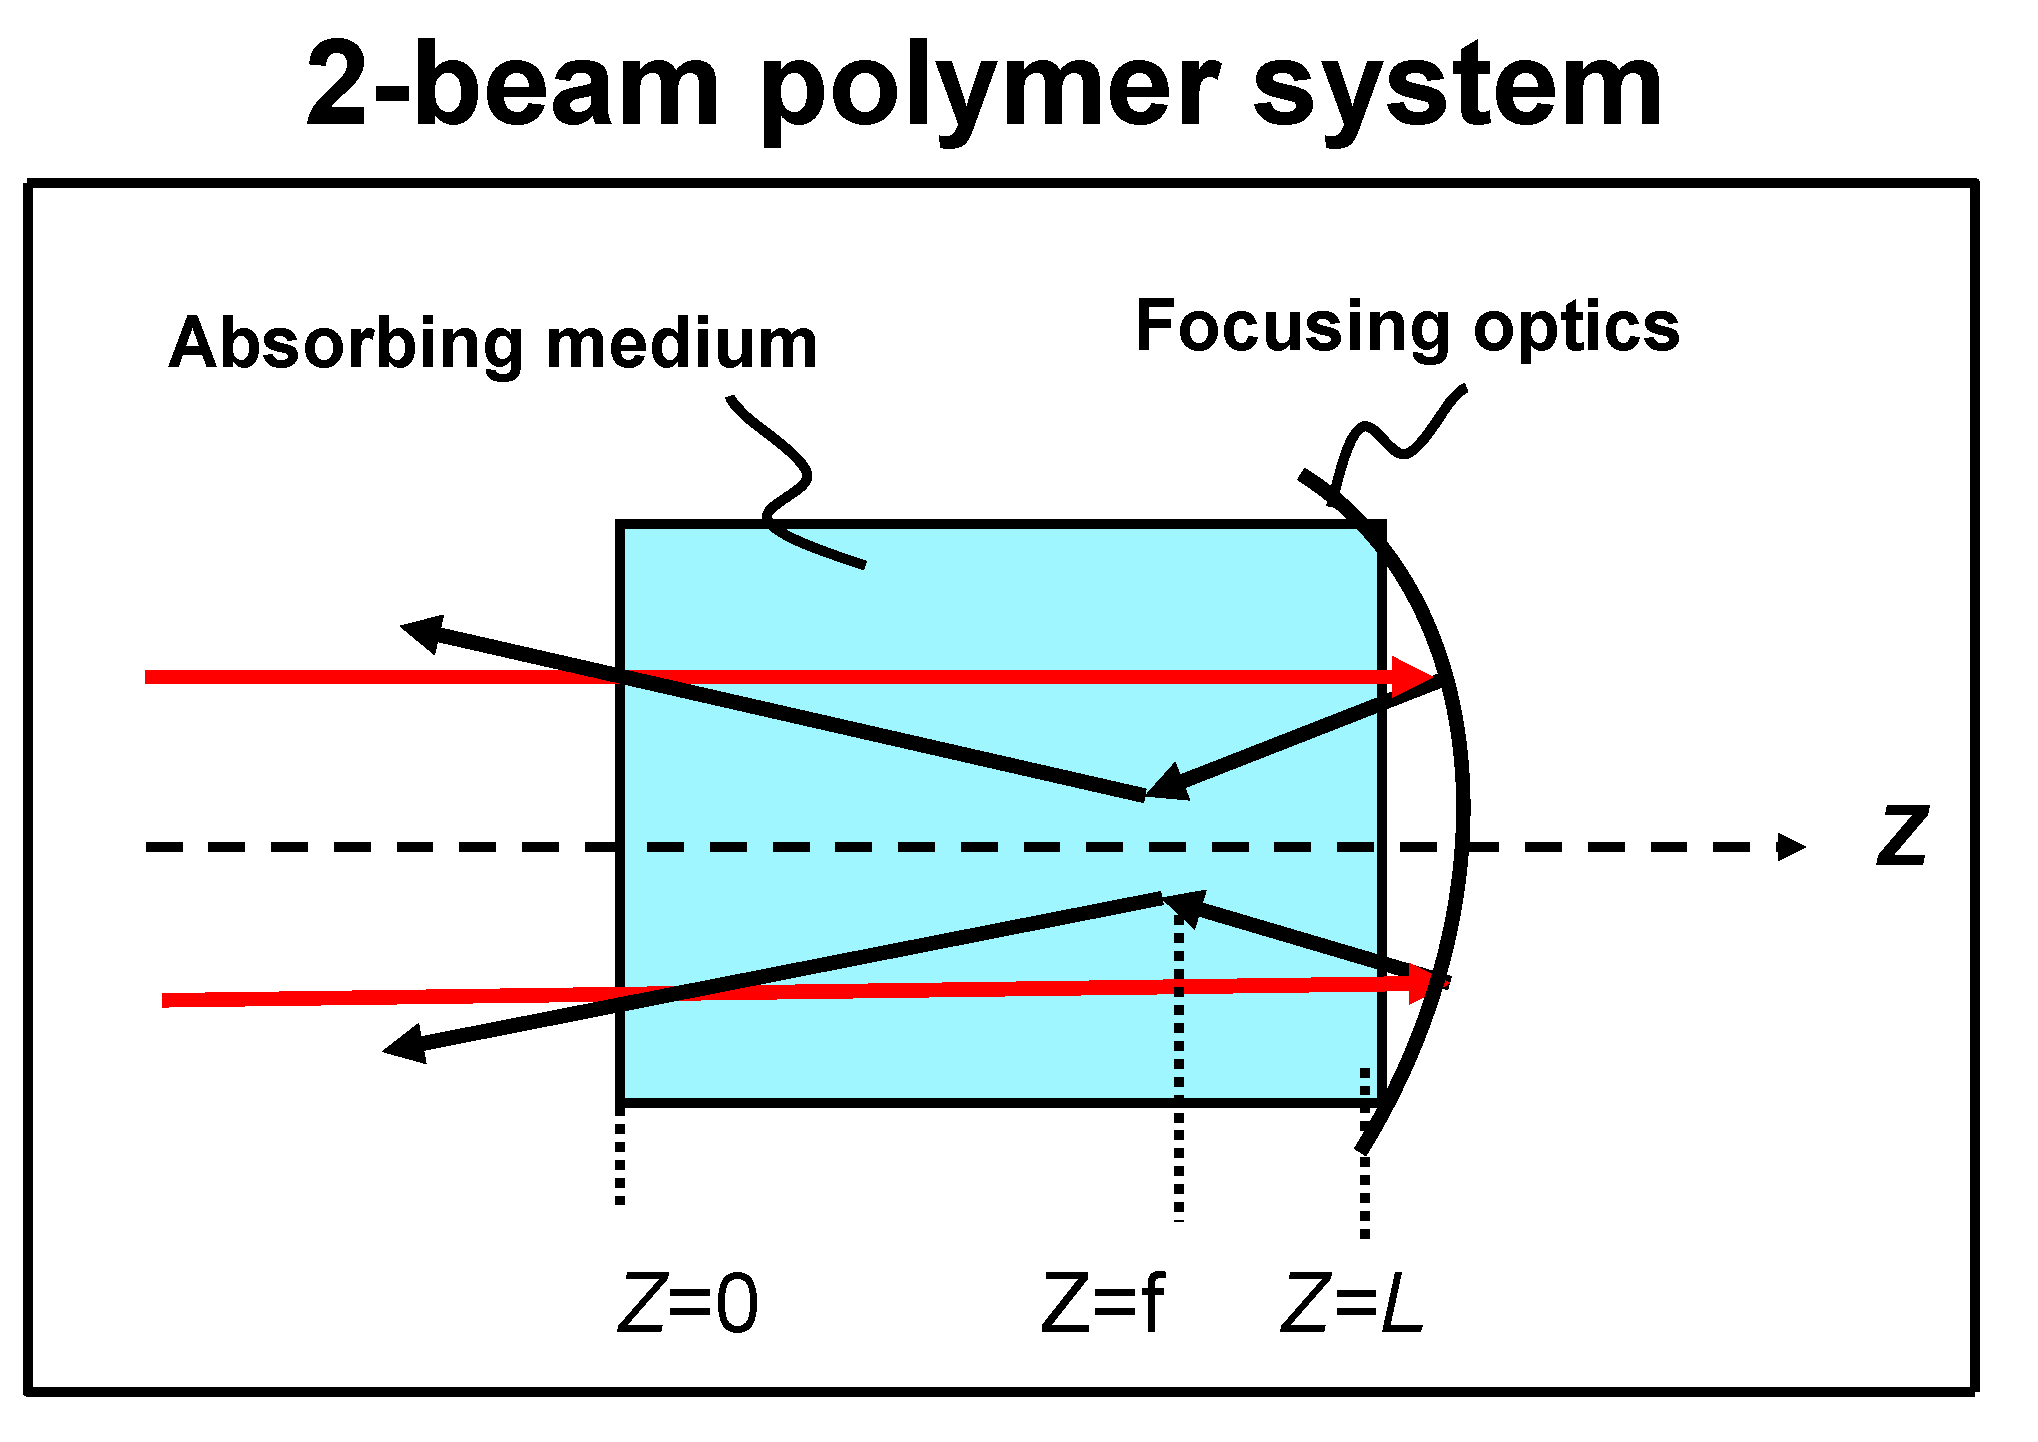
For an incident beam with a reflecting focus beam, Equation (3) requires numerical simulations. Using the finite element method and program for both the forward and backward beams, we solved for various cases: (a) incident collimated beam only; (b) incident beam with reflecting collimated beam; and (c) incident beam with reflecting focused-beam. In our calculations, we used typical values as follows. For UV light at 365 nm, λ = 3.65 × 10⁻⁵, we find 83.6λ = 0.00305 and a = 0.0006ε1 for ϕ = 0.2. Other parameters used are as follows: light intensity I0 = 100 (mW/cm2), C0 = 10 mM, ε1 = 0.25 (mM·cm)−1, ε2 = 0.05 (mM·cm)−1 and Am = 0.
Figure 3 shows profiles of the normalized initiator concentration,
C(
z,
t)/
C0,
versus the polymer thickness (
z) at
t = 17 s (left figure) and 24 s (right figure) for the above 3 cases. As we expect, comparing to the collimated cases, case (c) starts crossover earlier (at
t = 7 s) from
z = 0.5 (at its focusing position,
f = 0.5 cm), whereas cases (a) and (b) start at
t = 24 s (
z = 0). At
t = 24 s, case (c) has completed the crossover central range between
z = 0.42 and
z = 0.58 cm. In addition, all three cases have the same crossover point at
z = 0 which has very weak reflecting beam intensity. The red straight line in
Figure 3 represents 1/
e2 =0.135, which defines the crossover time by its cross points with the profiles of
C(
z,
t).
Figure 3.
Profiles of the normalized initiator concentration versus the polymer thickness (z) at t = 17 and 24 s for various cases: (a) (solid curve) collimated beam without the reflecting beam; (b) (dashed curve) collimated beam with a collimated reflecting beam, and (c) (dotted curve) collimated beam with a focused reflecting beam.
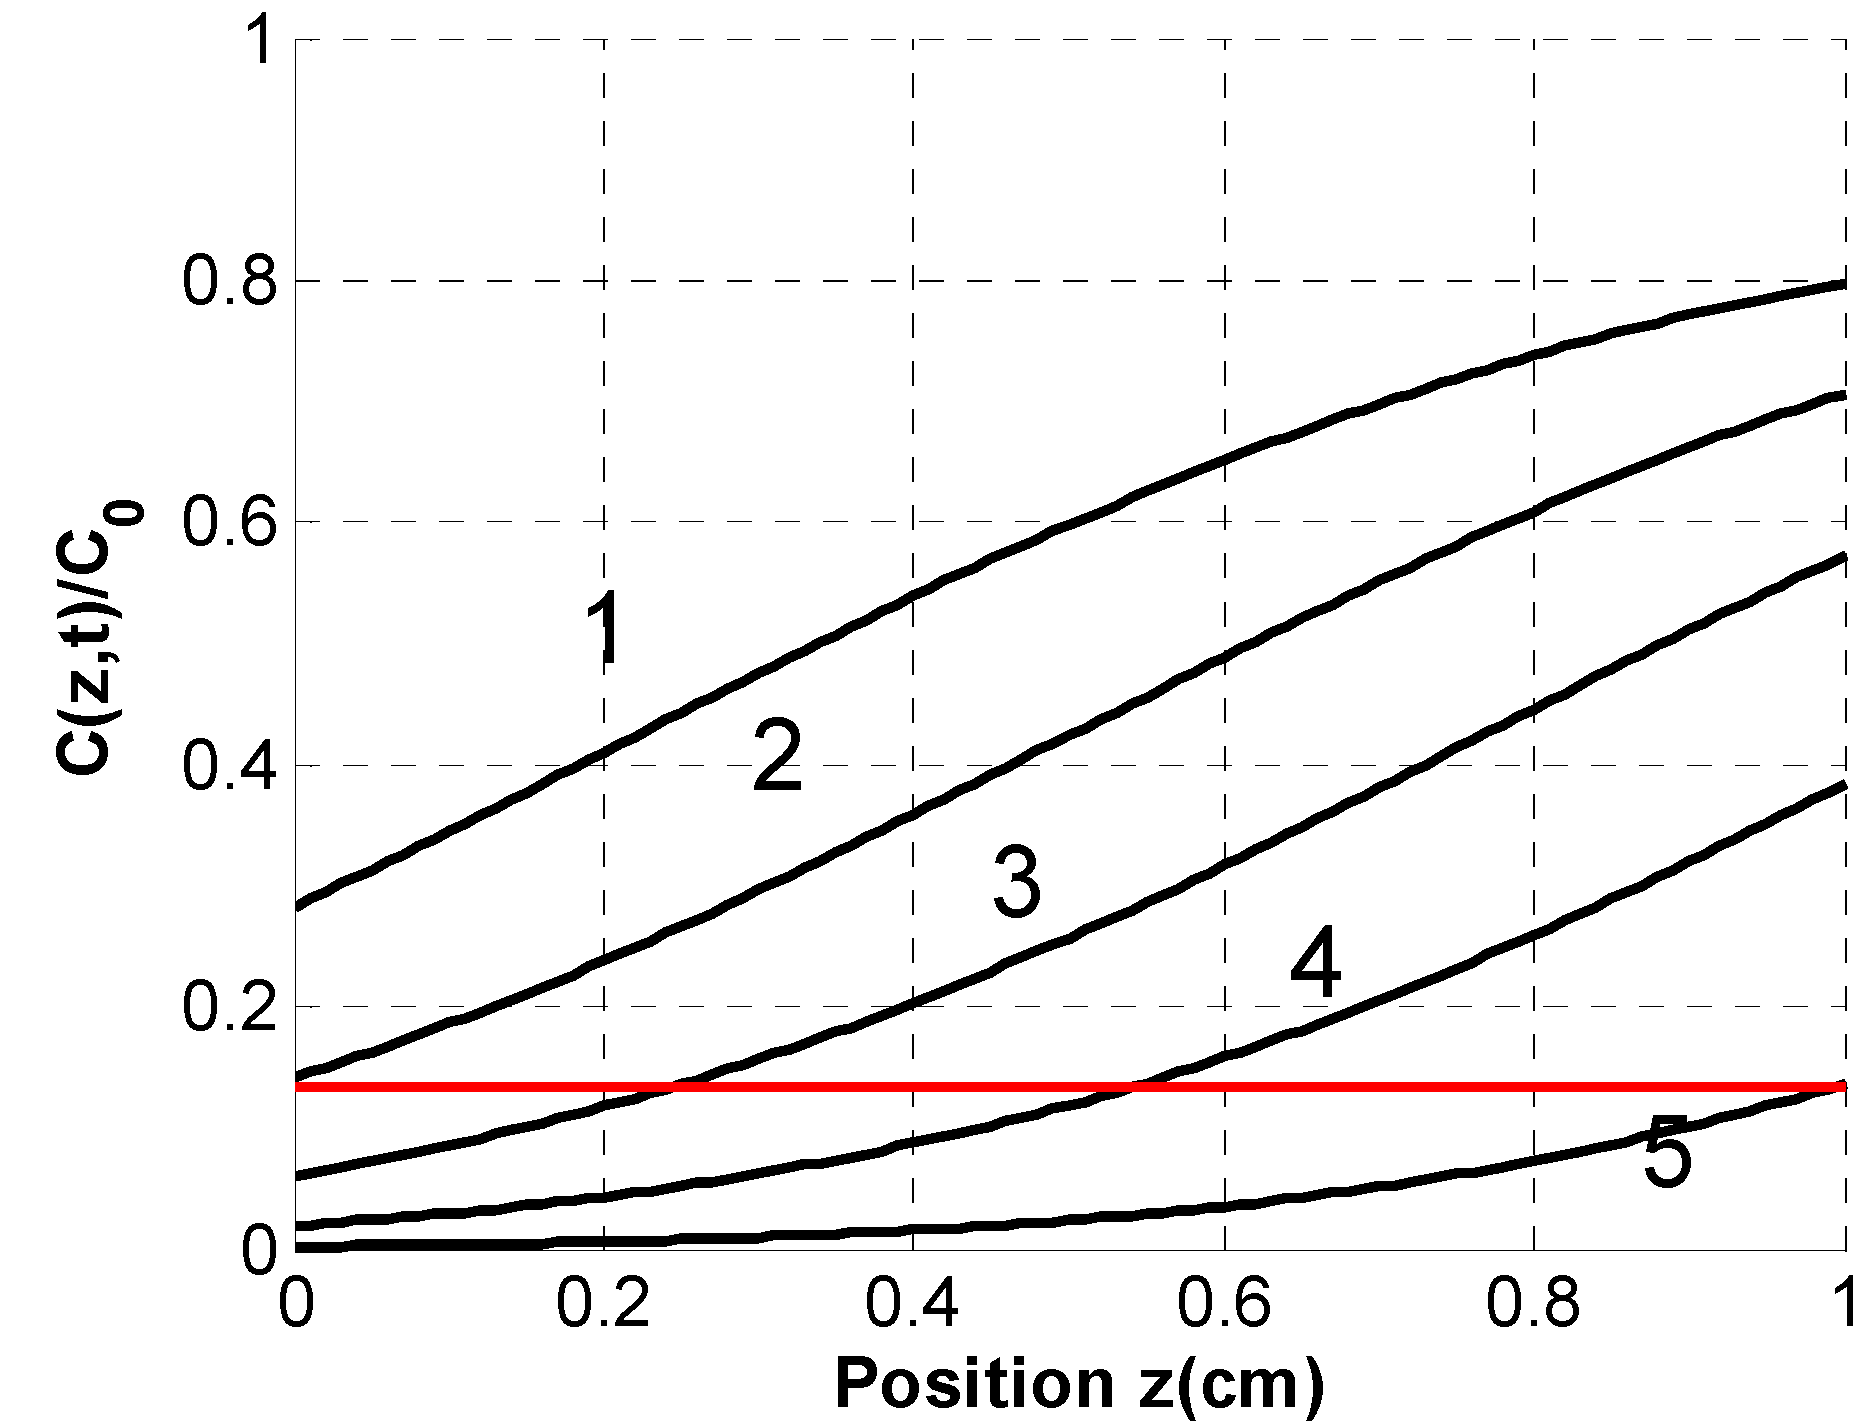
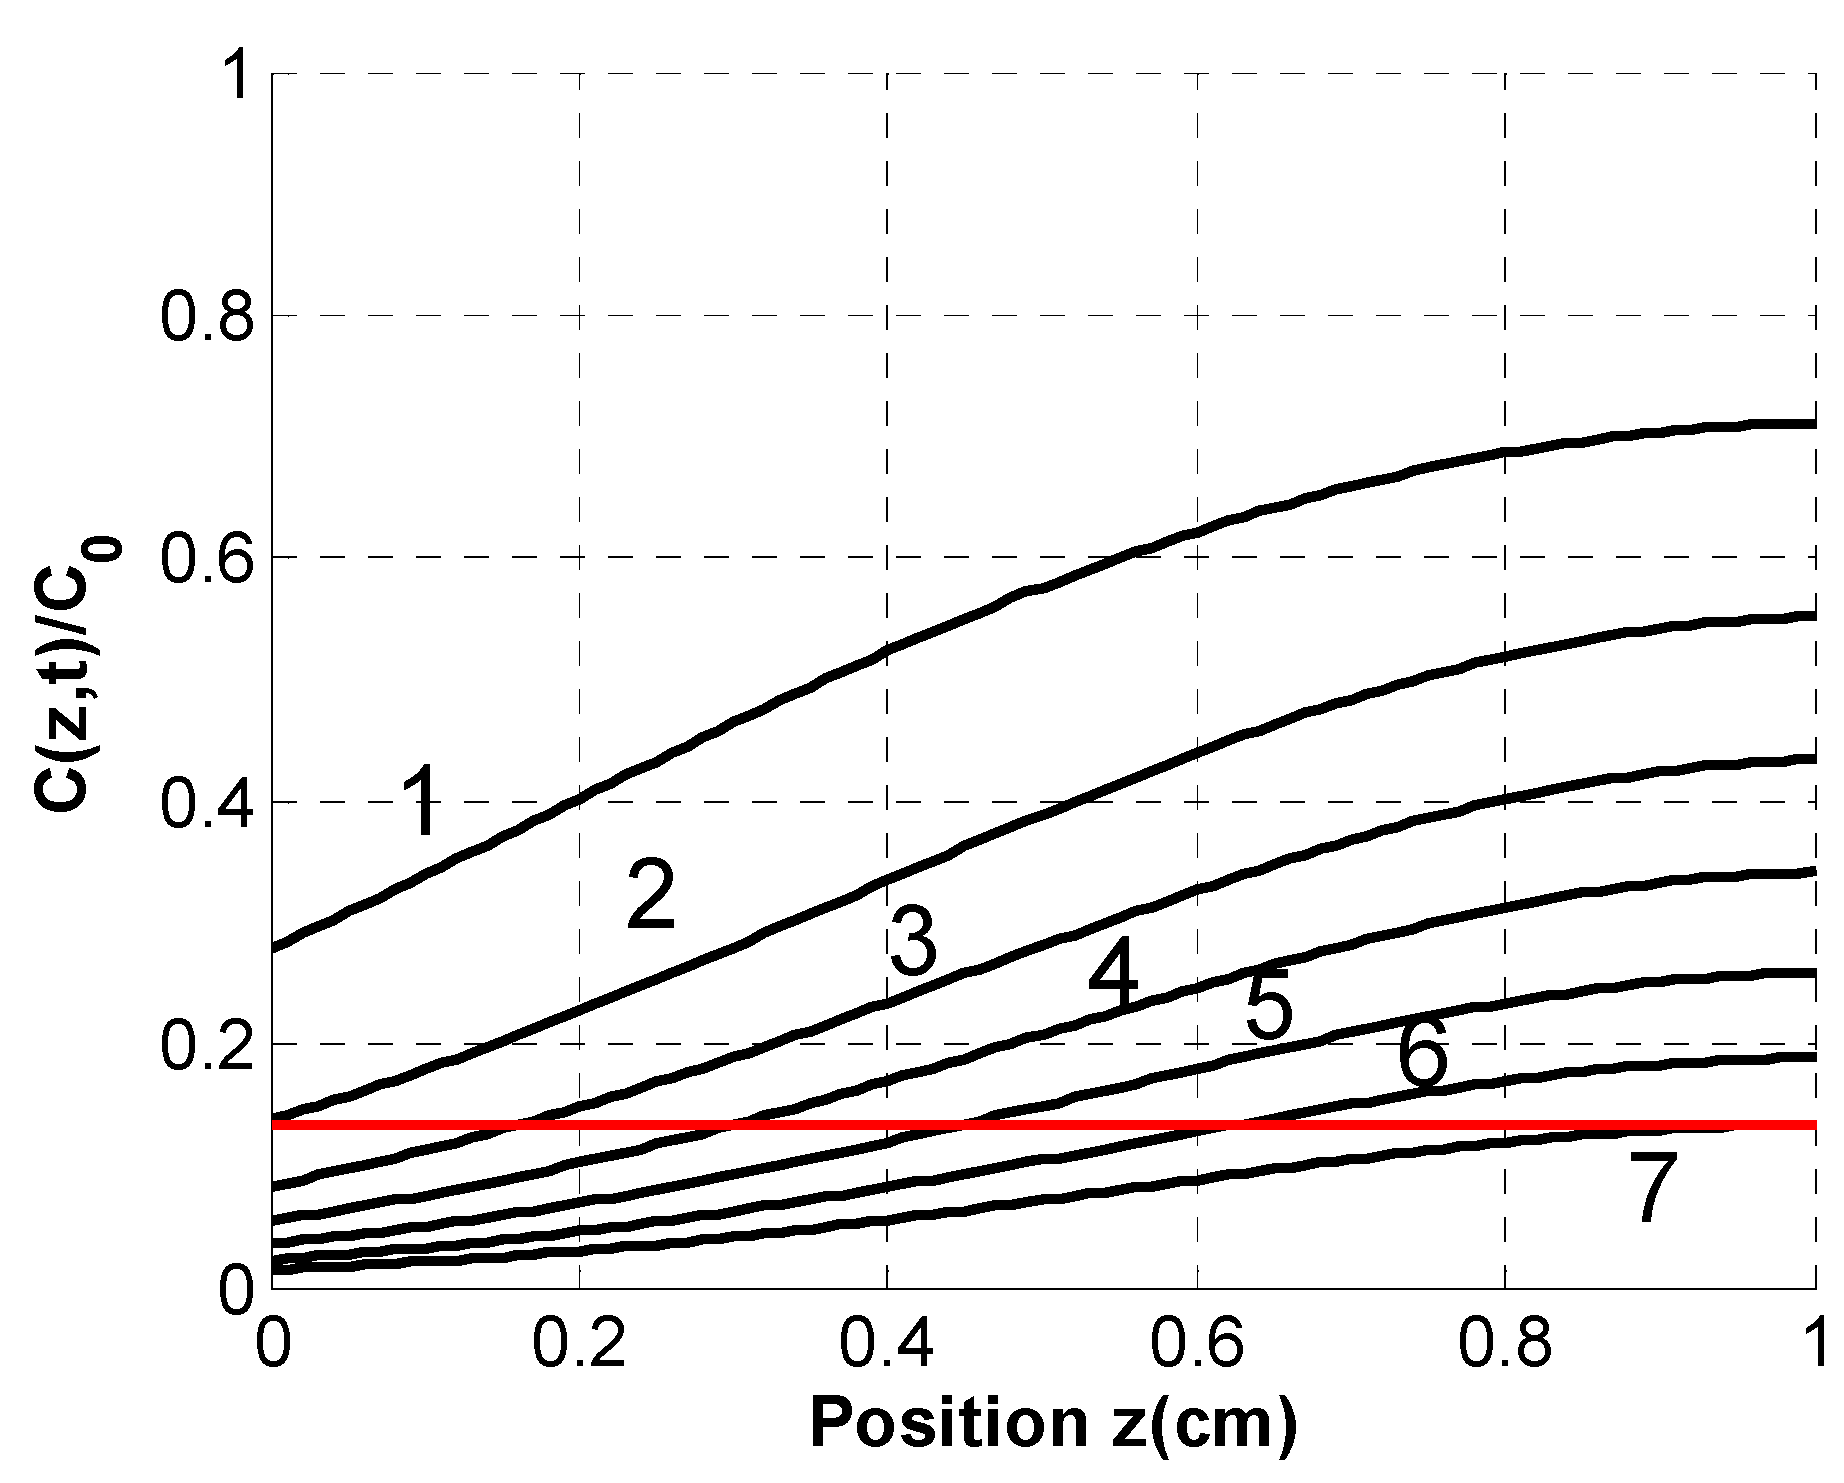
Figure 4 shows the dynamic profiles of
C(
z,
t)/
C0 versus z at various times for case (a), an incident collimated beam without a reflecting beam, in which the cross points between the 0.135 straight-line and the curves define the crossover times (
T*) at various
z. These cross point provide us the information including: (a) location and when the crossover starts and ends; (b) how long the crossover takes; and (c) time required for the crossover to complete the whole thickness (at
z =
L =1.0 cm). All of the
C(
z,
t)/
C0 curves have the lowest values at
z = 0 and highest value at
z = 1.0 cm, indicating that the crossover always starts from the entrance (
z = 0) and ends at the medium thickness (
z =
L).
Figure 4 also shows that the crossover procedure takes 46 s to complete, calculated from the difference between
T* = 70 s (for
z =
L) and
T* = 24 s (for
z = 0). Comparing
Figure 4 and
Figure 5, we find that case (b) with reflecting beam completes the crossover earlier than case (a). For example,
T*(
z = 1.0 cm) = 50 s for case (b) which is abut 30% faster than case (a) with
T*(
z = 1.0 cm) = 70 s. Furthermore, the crossover procedure takes only 50 − 24 = 26 s in the reflecting beam case
versus 46 s in the single beam case. This enhancement may be explained by the fact that with the same incident light intensity, the reflecting beam contributes additional light intensity and accelerates the crossover process.
Figure 4.
Profiles of the normalized initiator concentration versus z at t = 15, 24, 35, 50, and 70 s (curves No. 1 to 5) for case (a), an incident collimated beam without a reflecting beam, in which the cross points define the crossover time at z = 0 to 1.0 cm.
Figure 4.
Profiles of the normalized initiator concentration versus z at t = 15, 24, 35, 50, and 70 s (curves No. 1 to 5) for case (a), an incident collimated beam without a reflecting beam, in which the cross points define the crossover time at z = 0 to 1.0 cm.
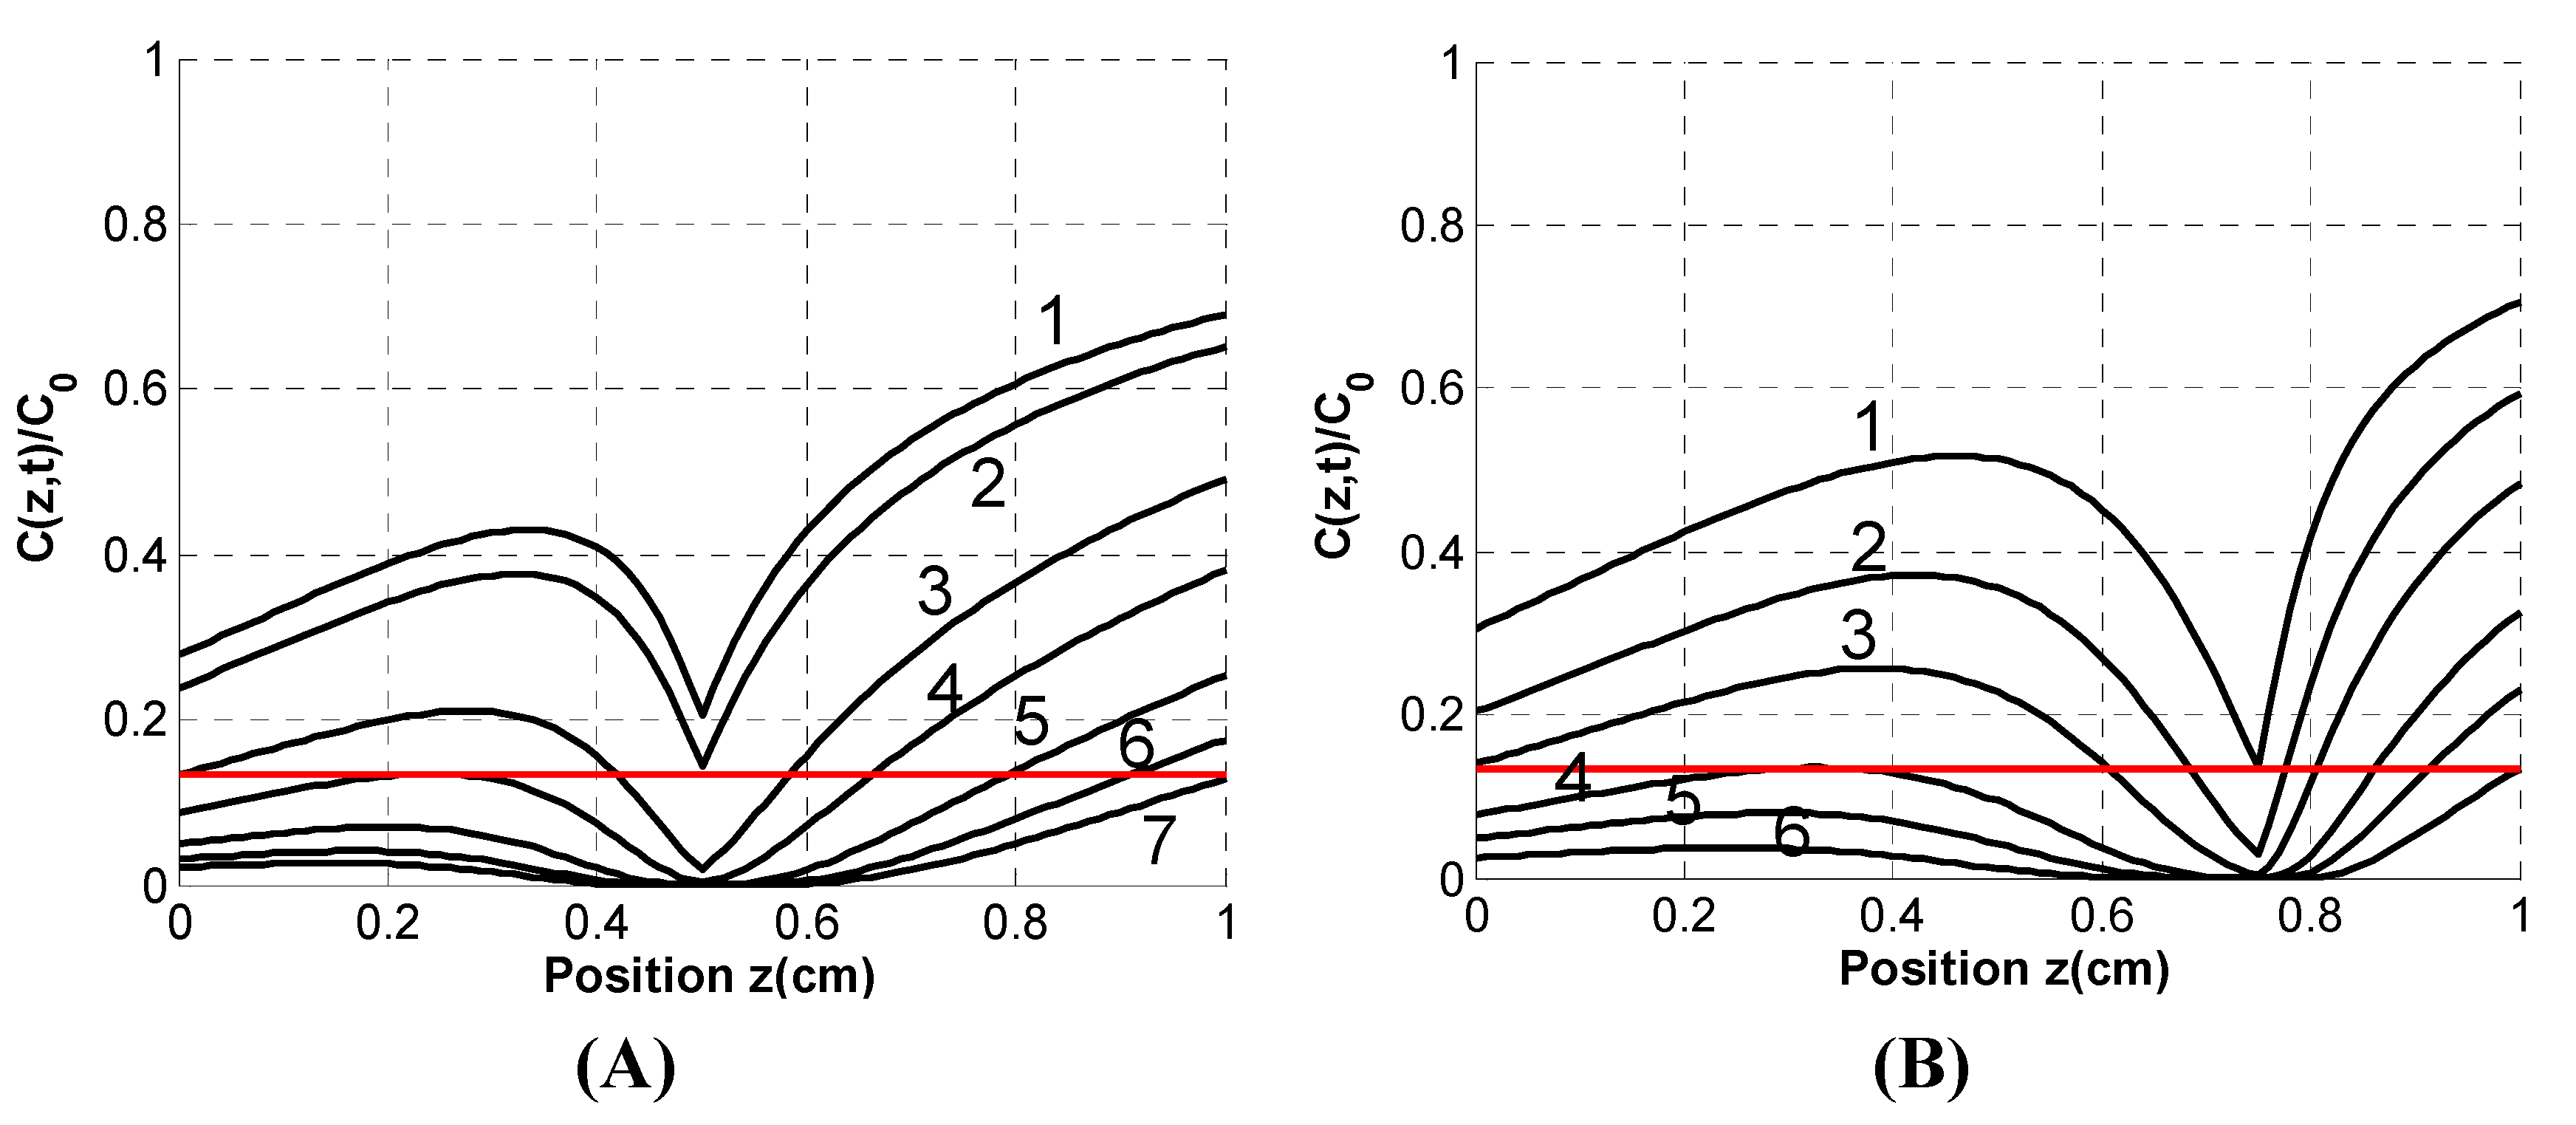
Figure 5.
Same as
Figure 4, but for case (b), an incident collimated beam with a collimated reflecting beam at
t = 15, 24, 30, 35, 40, and 50 s (curves No. 1 to 7).
Figure 5.
Same as
Figure 4, but for case (b), an incident collimated beam with a collimated reflecting beam at
t = 15, 24, 30, 35, 40, and 50 s (curves No. 1 to 7).
Figure 6 shows that the focal length for
f = 0.75 cm has faster crossover at the back portion of the medium (
z > 0.5 cm) than the
f = 0.5 cm case, which has faster crossover at the front portion (
z < 0.5 cm). That is, the crossover always starts from the focal point of the laser inside the medium that has the highest laser intensity (or power density). The case with
f = 0.75 cm is a longer crossover procedure 42 − 13.8 = 28 s than that of
f = 0.5 cm (27 s). However, it is has a shorter crossover time having
T* = 42 s
versus 44 s at
z = 0.0 cm.
Figure 6.
Same as
Figure 4, but for case (c), an incident collimated beam with a focused reflecting beam with a focal length
f = 0.5 cm (
A) at
t =15, 17, 24, 29, 35, and 44 s for curves No. 1 to 7 and
f = 0.75 cm (
B) at
t = 13.8, 18.8, 23.3, 30, 35, and 42 s for curves No. 1 to 6.
Figure 6.
Same as
Figure 4, but for case (c), an incident collimated beam with a focused reflecting beam with a focal length
f = 0.5 cm (
A) at
t =15, 17, 24, 29, 35, and 44 s for curves No. 1 to 7 and
f = 0.75 cm (
B) at
t = 13.8, 18.8, 23.3, 30, 35, and 42 s for curves No. 1 to 6.
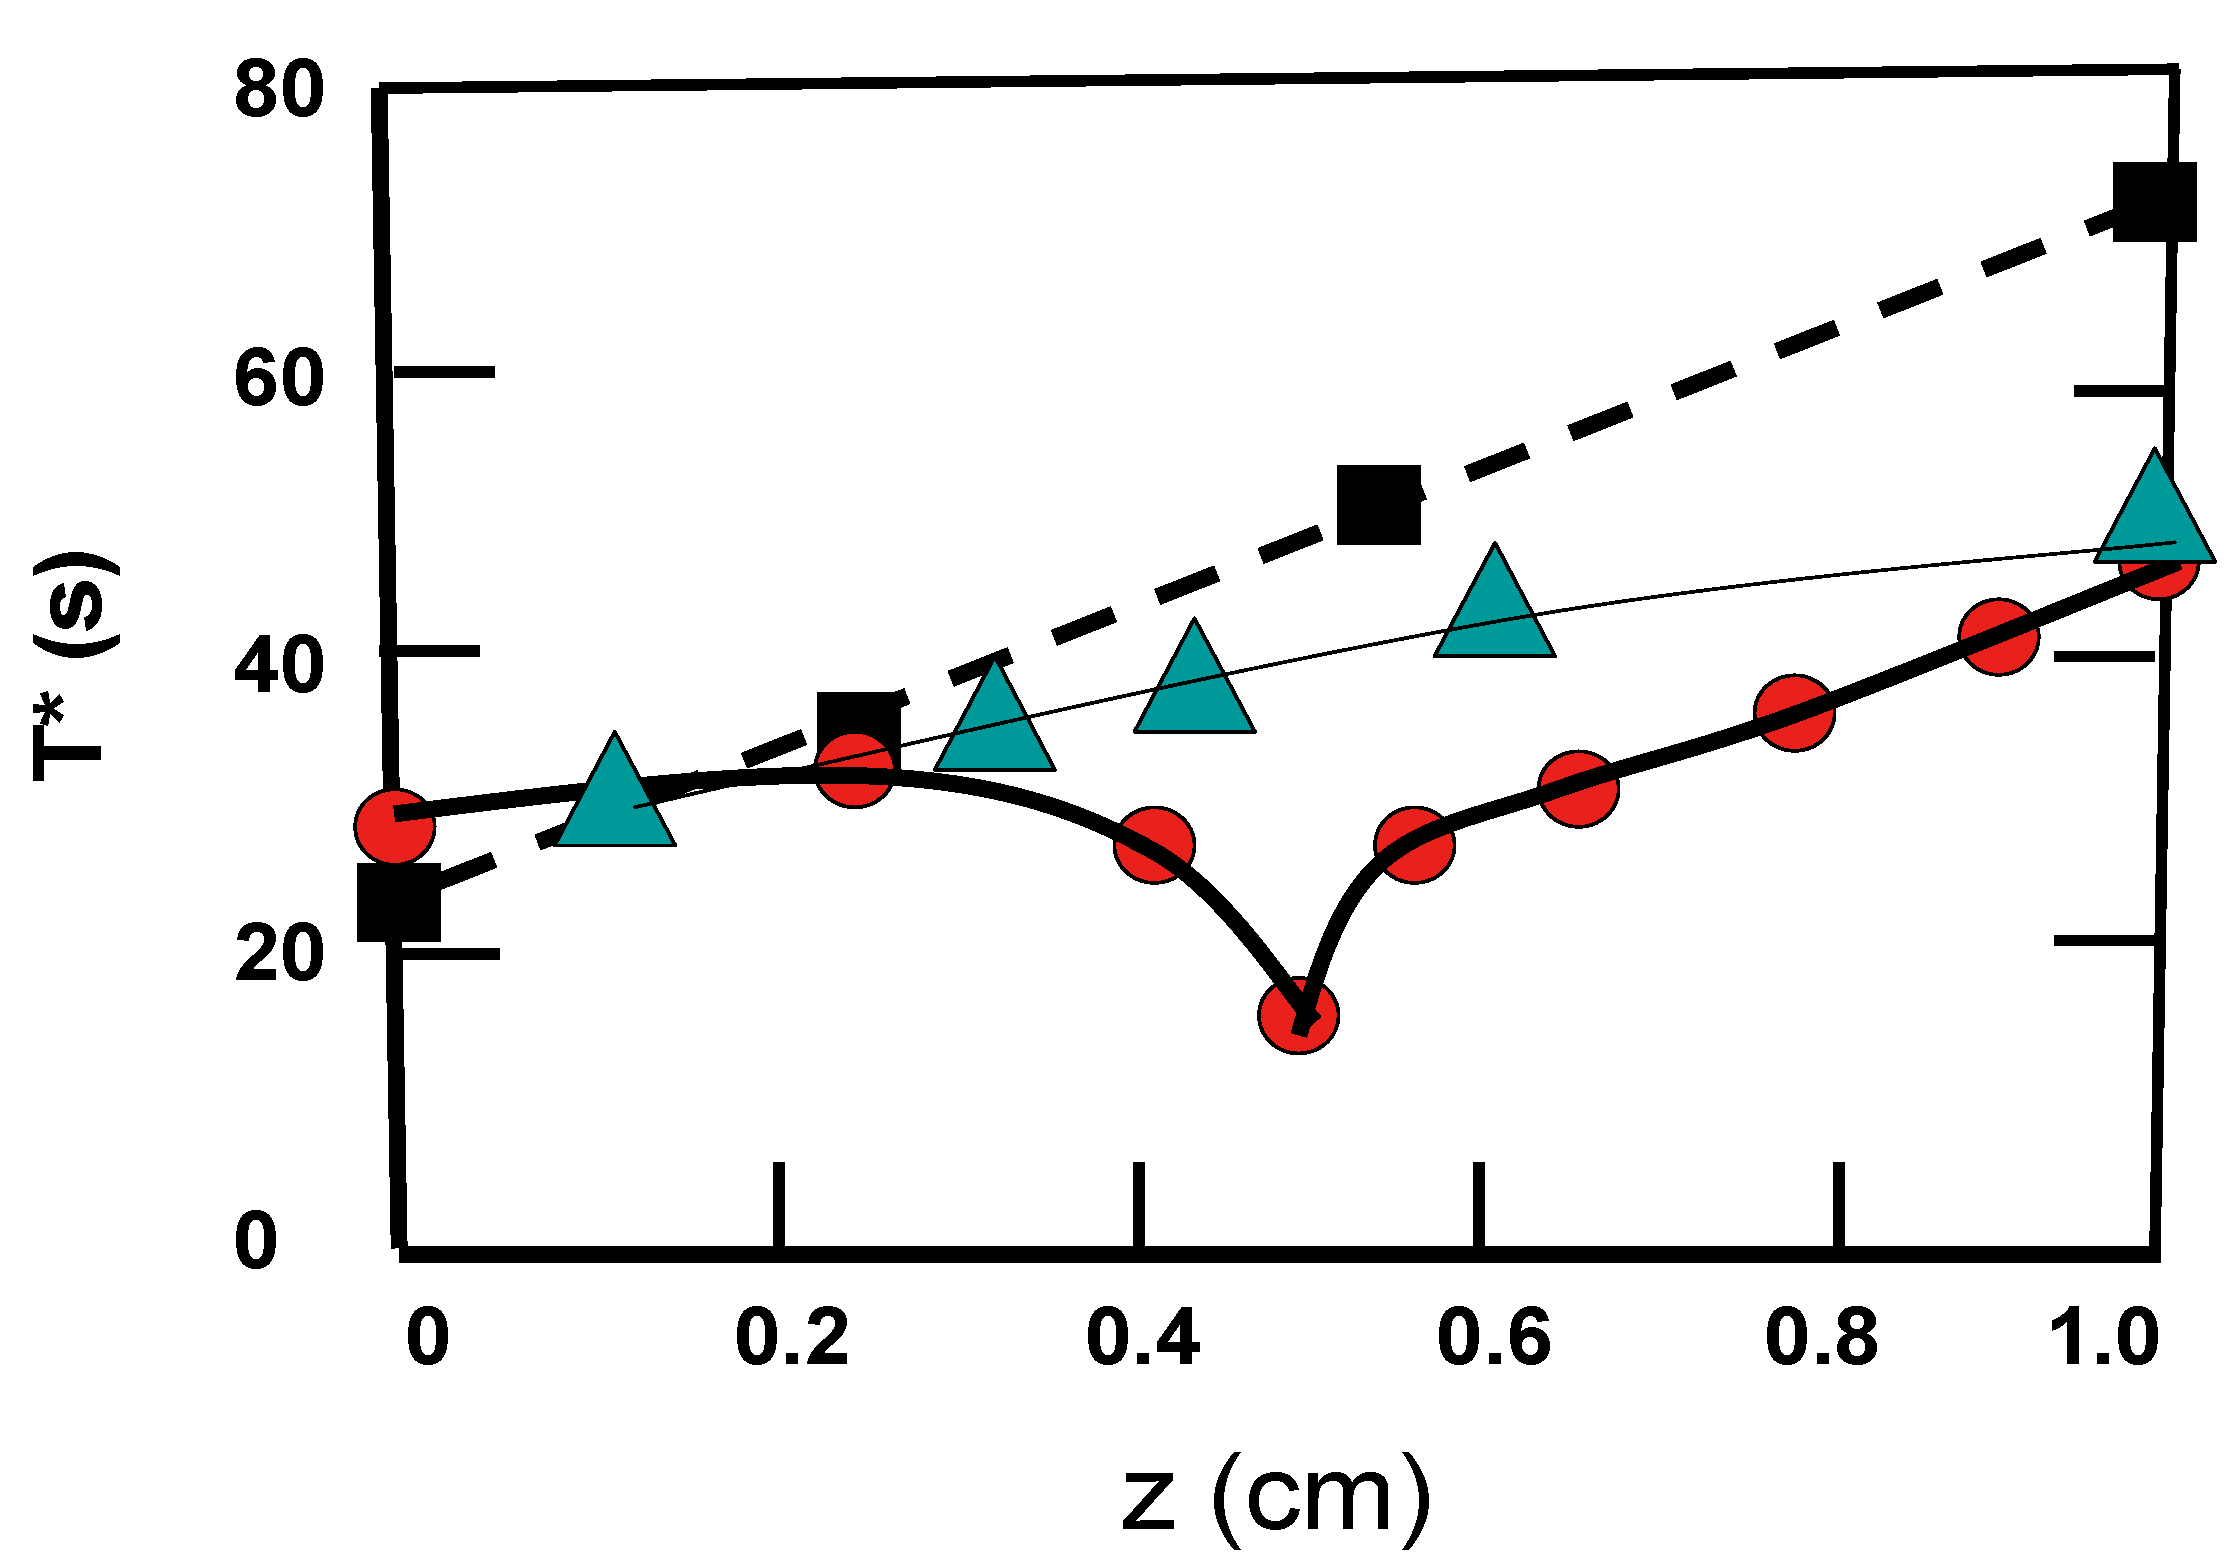
3.5. The Crossover Time
Figure 8 shows the crossover times
T*(
z) calculated by the crossing points of the constant line
z = 0.135 and the profile curves of
C(
z,
t)/
C0 shown in
Figure 4,
Figure 5 and
Figure 6, respectively, for case (a) collimated single beam (cubic); (b) collimated two beam (triangles); and (c) collimated plus focused beam (circles). As we expect that case (a) has the largest
T* (or slowest crossover procedure); case (b) is faster than case (a) due to the extra laser intensity of the reflecting collimated beam. The crossover is further accelerated by the focusing mirror in case (c). The gelation completion time, defined by
T*(
z = 1.0 cm), was found to be 70, 50 and 44 s for case (a), (b) and (c), respectively. These data demonstrate that case (c) is about 60% faster than case (a). As shown by our analytical formulas in Equation (7), the crossover time
T*(
z) for the collimated cases (a) and (b) is an increasing function of
z. The nonlinear curve of case (c) is due to the focusing function shown by Equation (2).
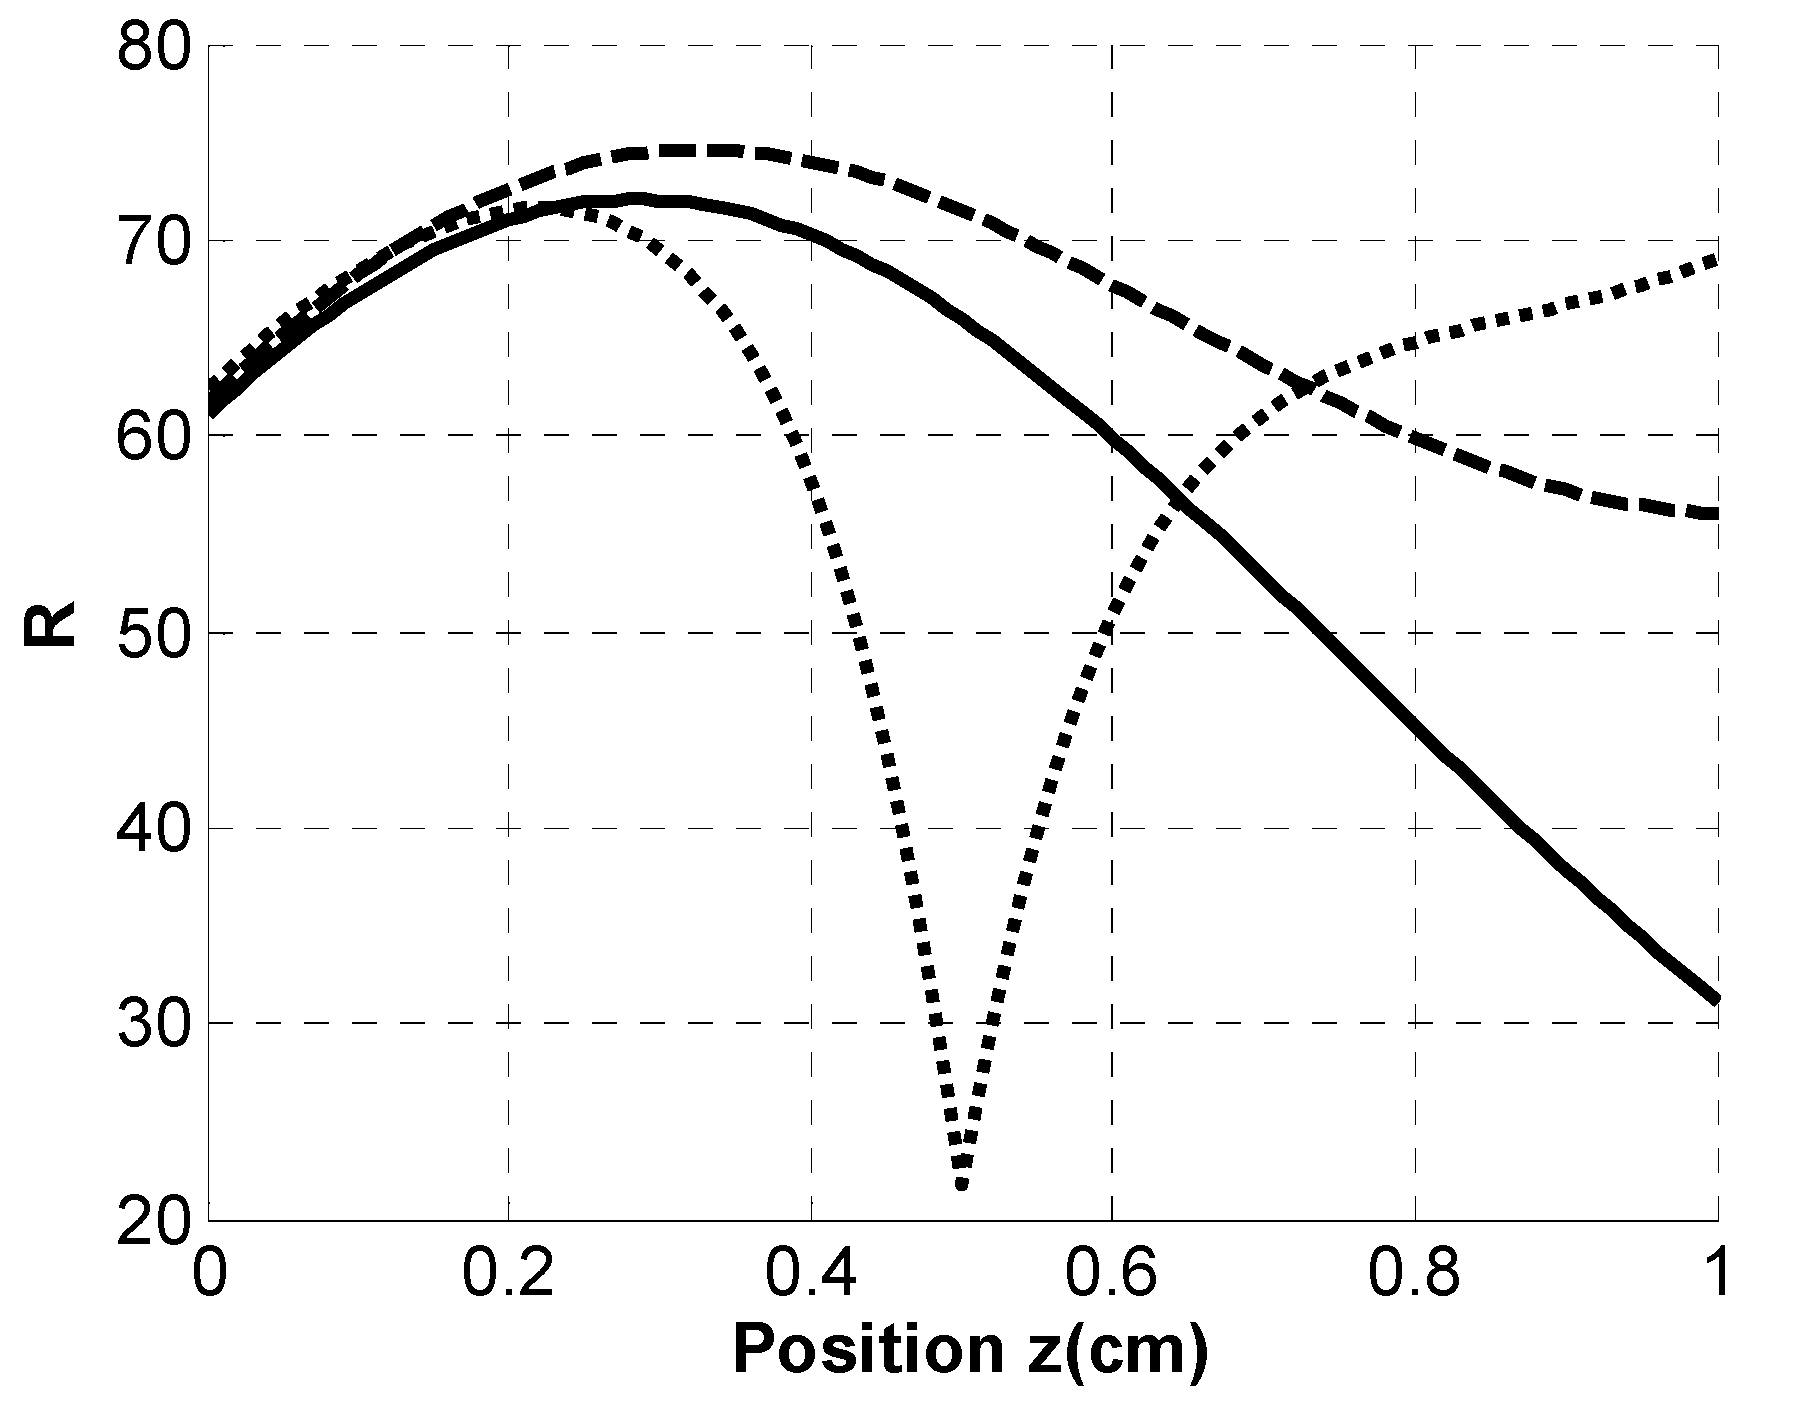
Figure 7.
The reduced rate function R versus z at t = 17 s for case (a) single beam (dashed curve); case (b), two collimated beams (solid curve); and case (c), a collimated and a focused beam (dotted curves).
Figure 7.
The reduced rate function R versus z at t = 17 s for case (a) single beam (dashed curve); case (b), two collimated beams (solid curve); and case (c), a collimated and a focused beam (dotted curves).
Figure 8.
The crossover time associate with
Figure 3,
Figure 4 and
Figure 5 for a collimated single beam (cubic); two collimated beams (triangles); and a collimated plus a focused beam (circles).
Figure 8.
The crossover time associate with
Figure 3,
Figure 4 and
Figure 5 for a collimated single beam (cubic); two collimated beams (triangles); and a collimated plus a focused beam (circles).
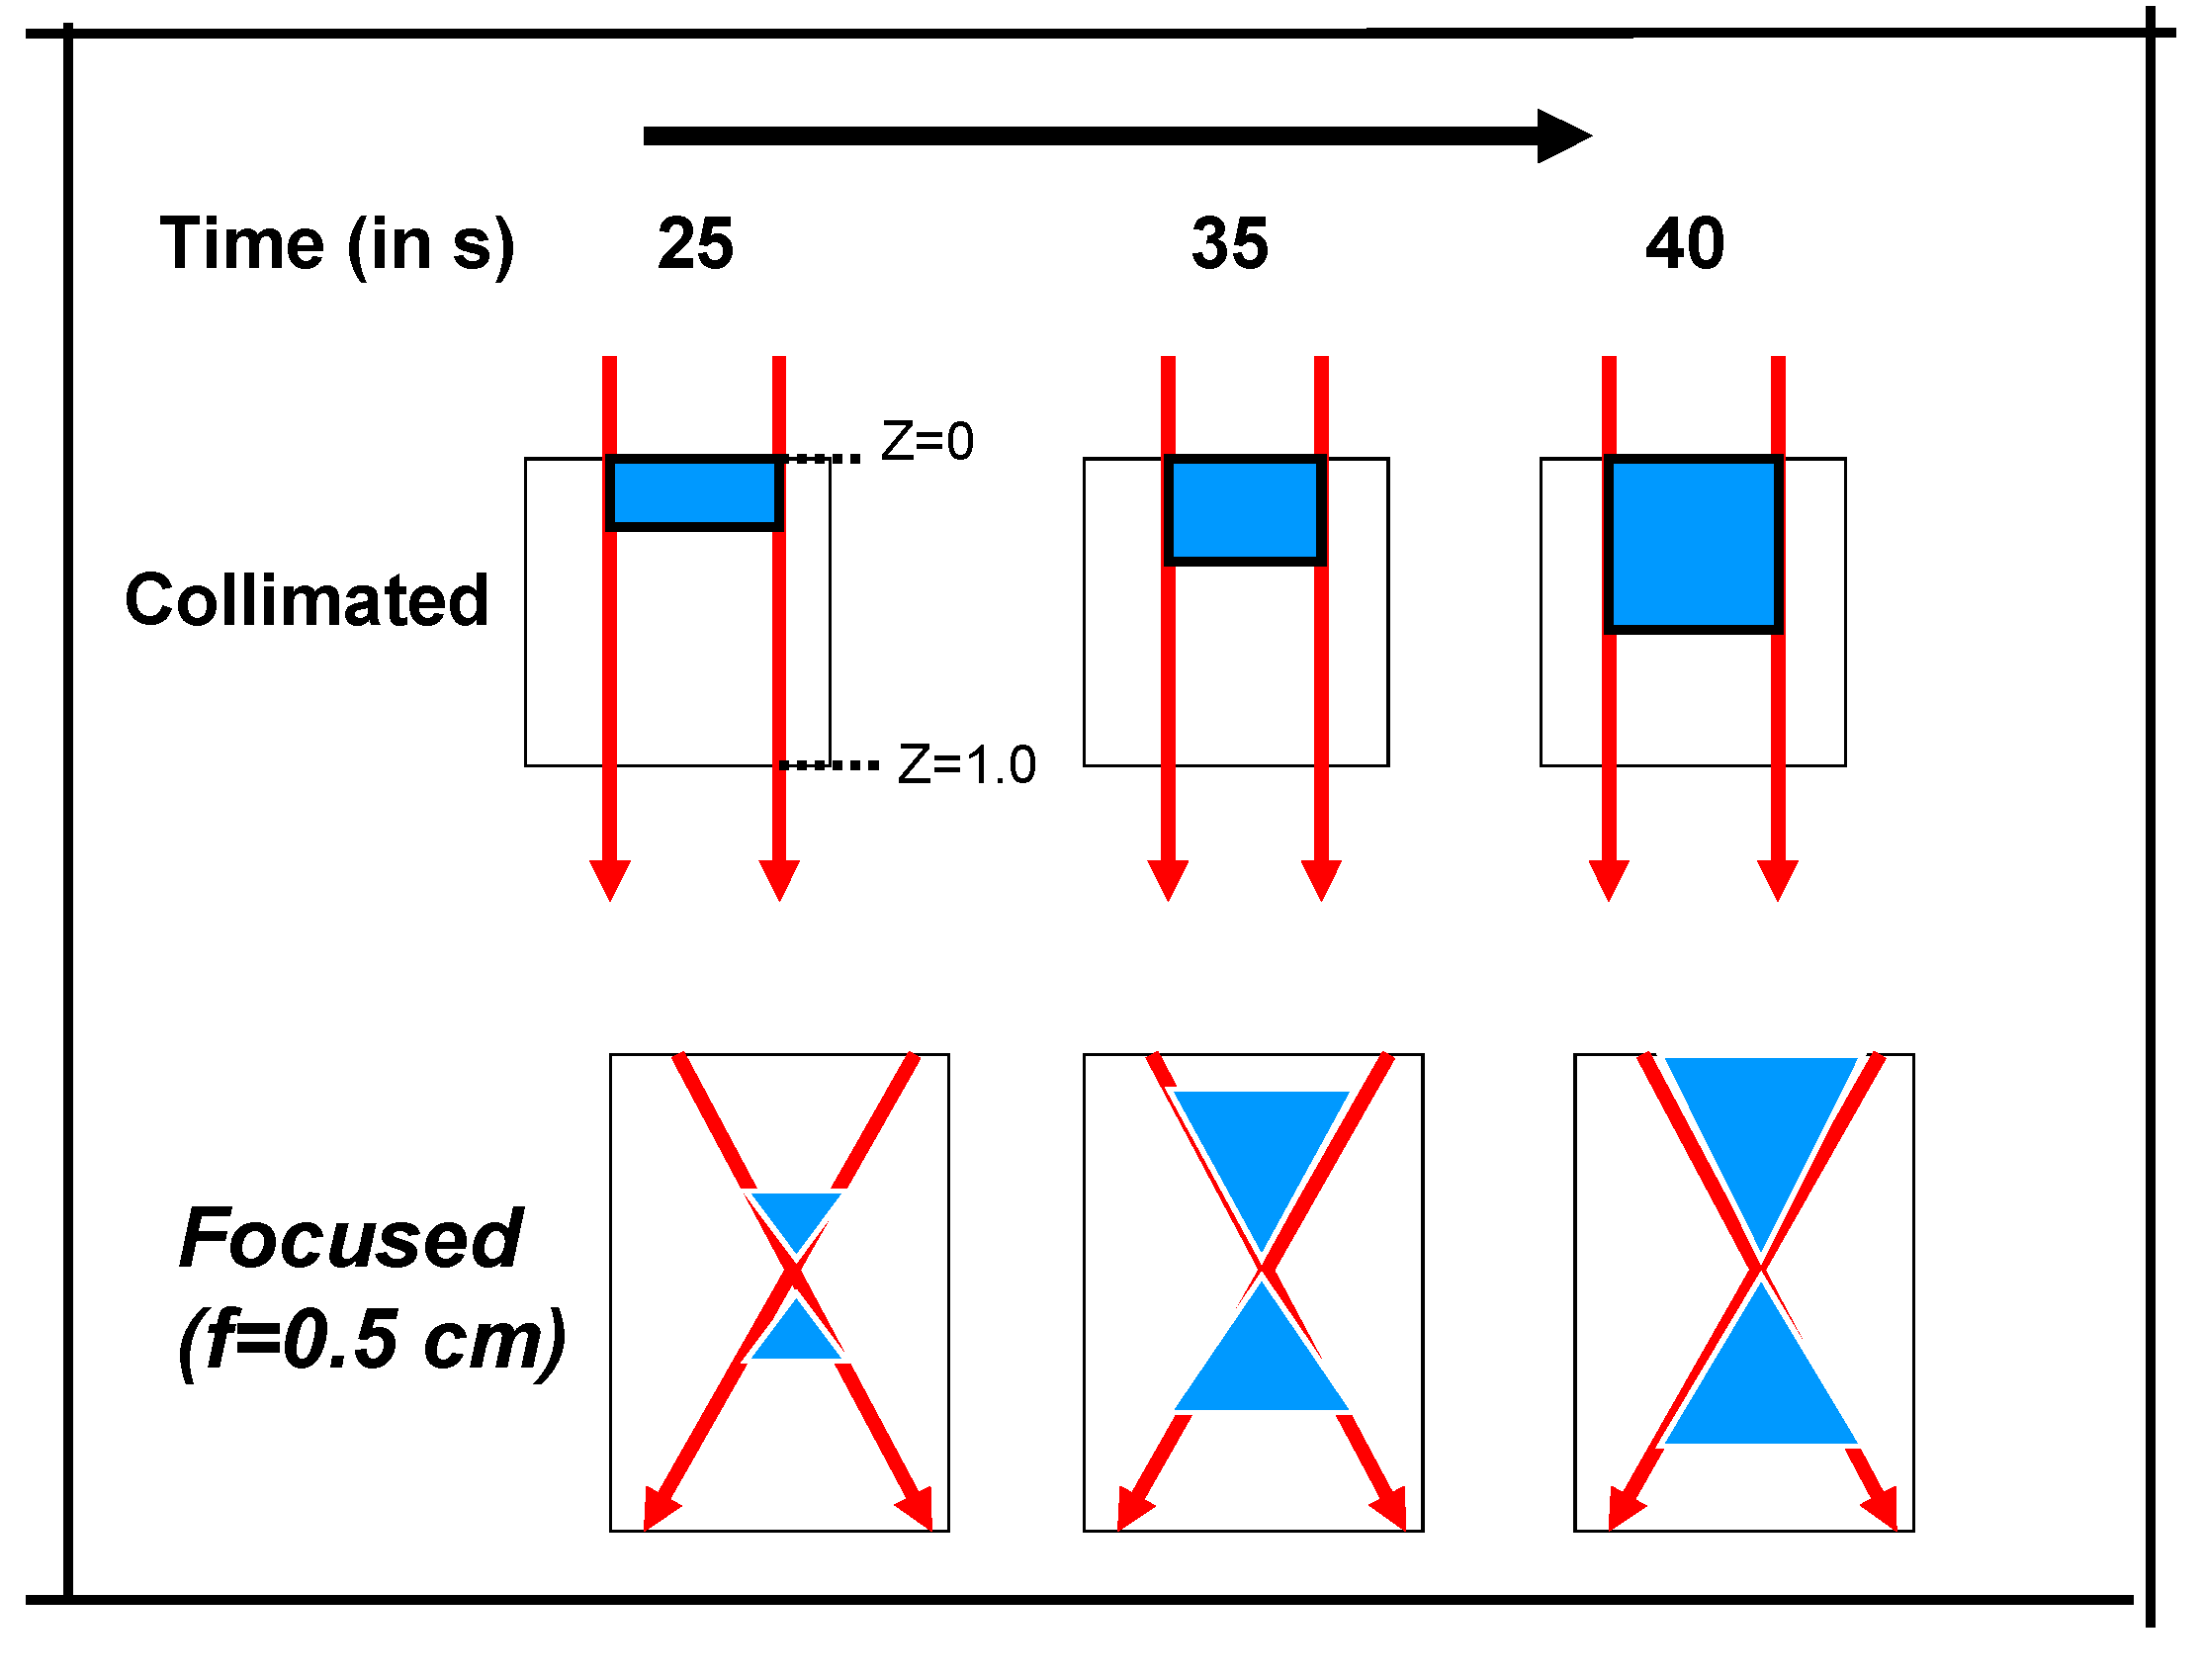
The crossover process is further illustrated by the crossover boundary shown in
Figure 9, which also shows the faster crossover at the back portion of the medium (
z > 0.5 cm) compared with that at the front portion (
z < 0.5 cm) of the medium for the focused case (also shown by
Figure 6.) That is, the crossover always starts from the focal point of the laser inside the medium that has the highest laser intensity (power density). The disadvantage of the focused case is that the crossover area (volume) is reduced to the focusing range. This drawback could be overcome by a scanning technique in which the laser beam is scanned along the direction normal to
z to cover a wider polymerization area (volume) inside the medium. A 3-dimensional simulation (under progress) is needed to show the profiles. In comparison with the two beam focused case shown in
Figure 9, we also show our previously published single beam focused case (without reflecting beam) [
16] in
Figure 10, in which the crossover area is larger than the two-beam case. However, the two-beam cases (b) and (c) show faster polymerization than the single beam case (without the reflecting beam) due to the extra laser power from the reflecting beam.
Figure 9.
Schematics of the time evolution (from 25 to 40 s) of photo-polymerization for: (top) a collimated beam without a reflecting beam; and (bottom) a collimated beam with a reflecting focused beam (with f = 0.5 L), where the polymerized portions are shown by shaded areas.
Figure 9.
Schematics of the time evolution (from 25 to 40 s) of photo-polymerization for: (top) a collimated beam without a reflecting beam; and (bottom) a collimated beam with a reflecting focused beam (with f = 0.5 L), where the polymerized portions are shown by shaded areas.
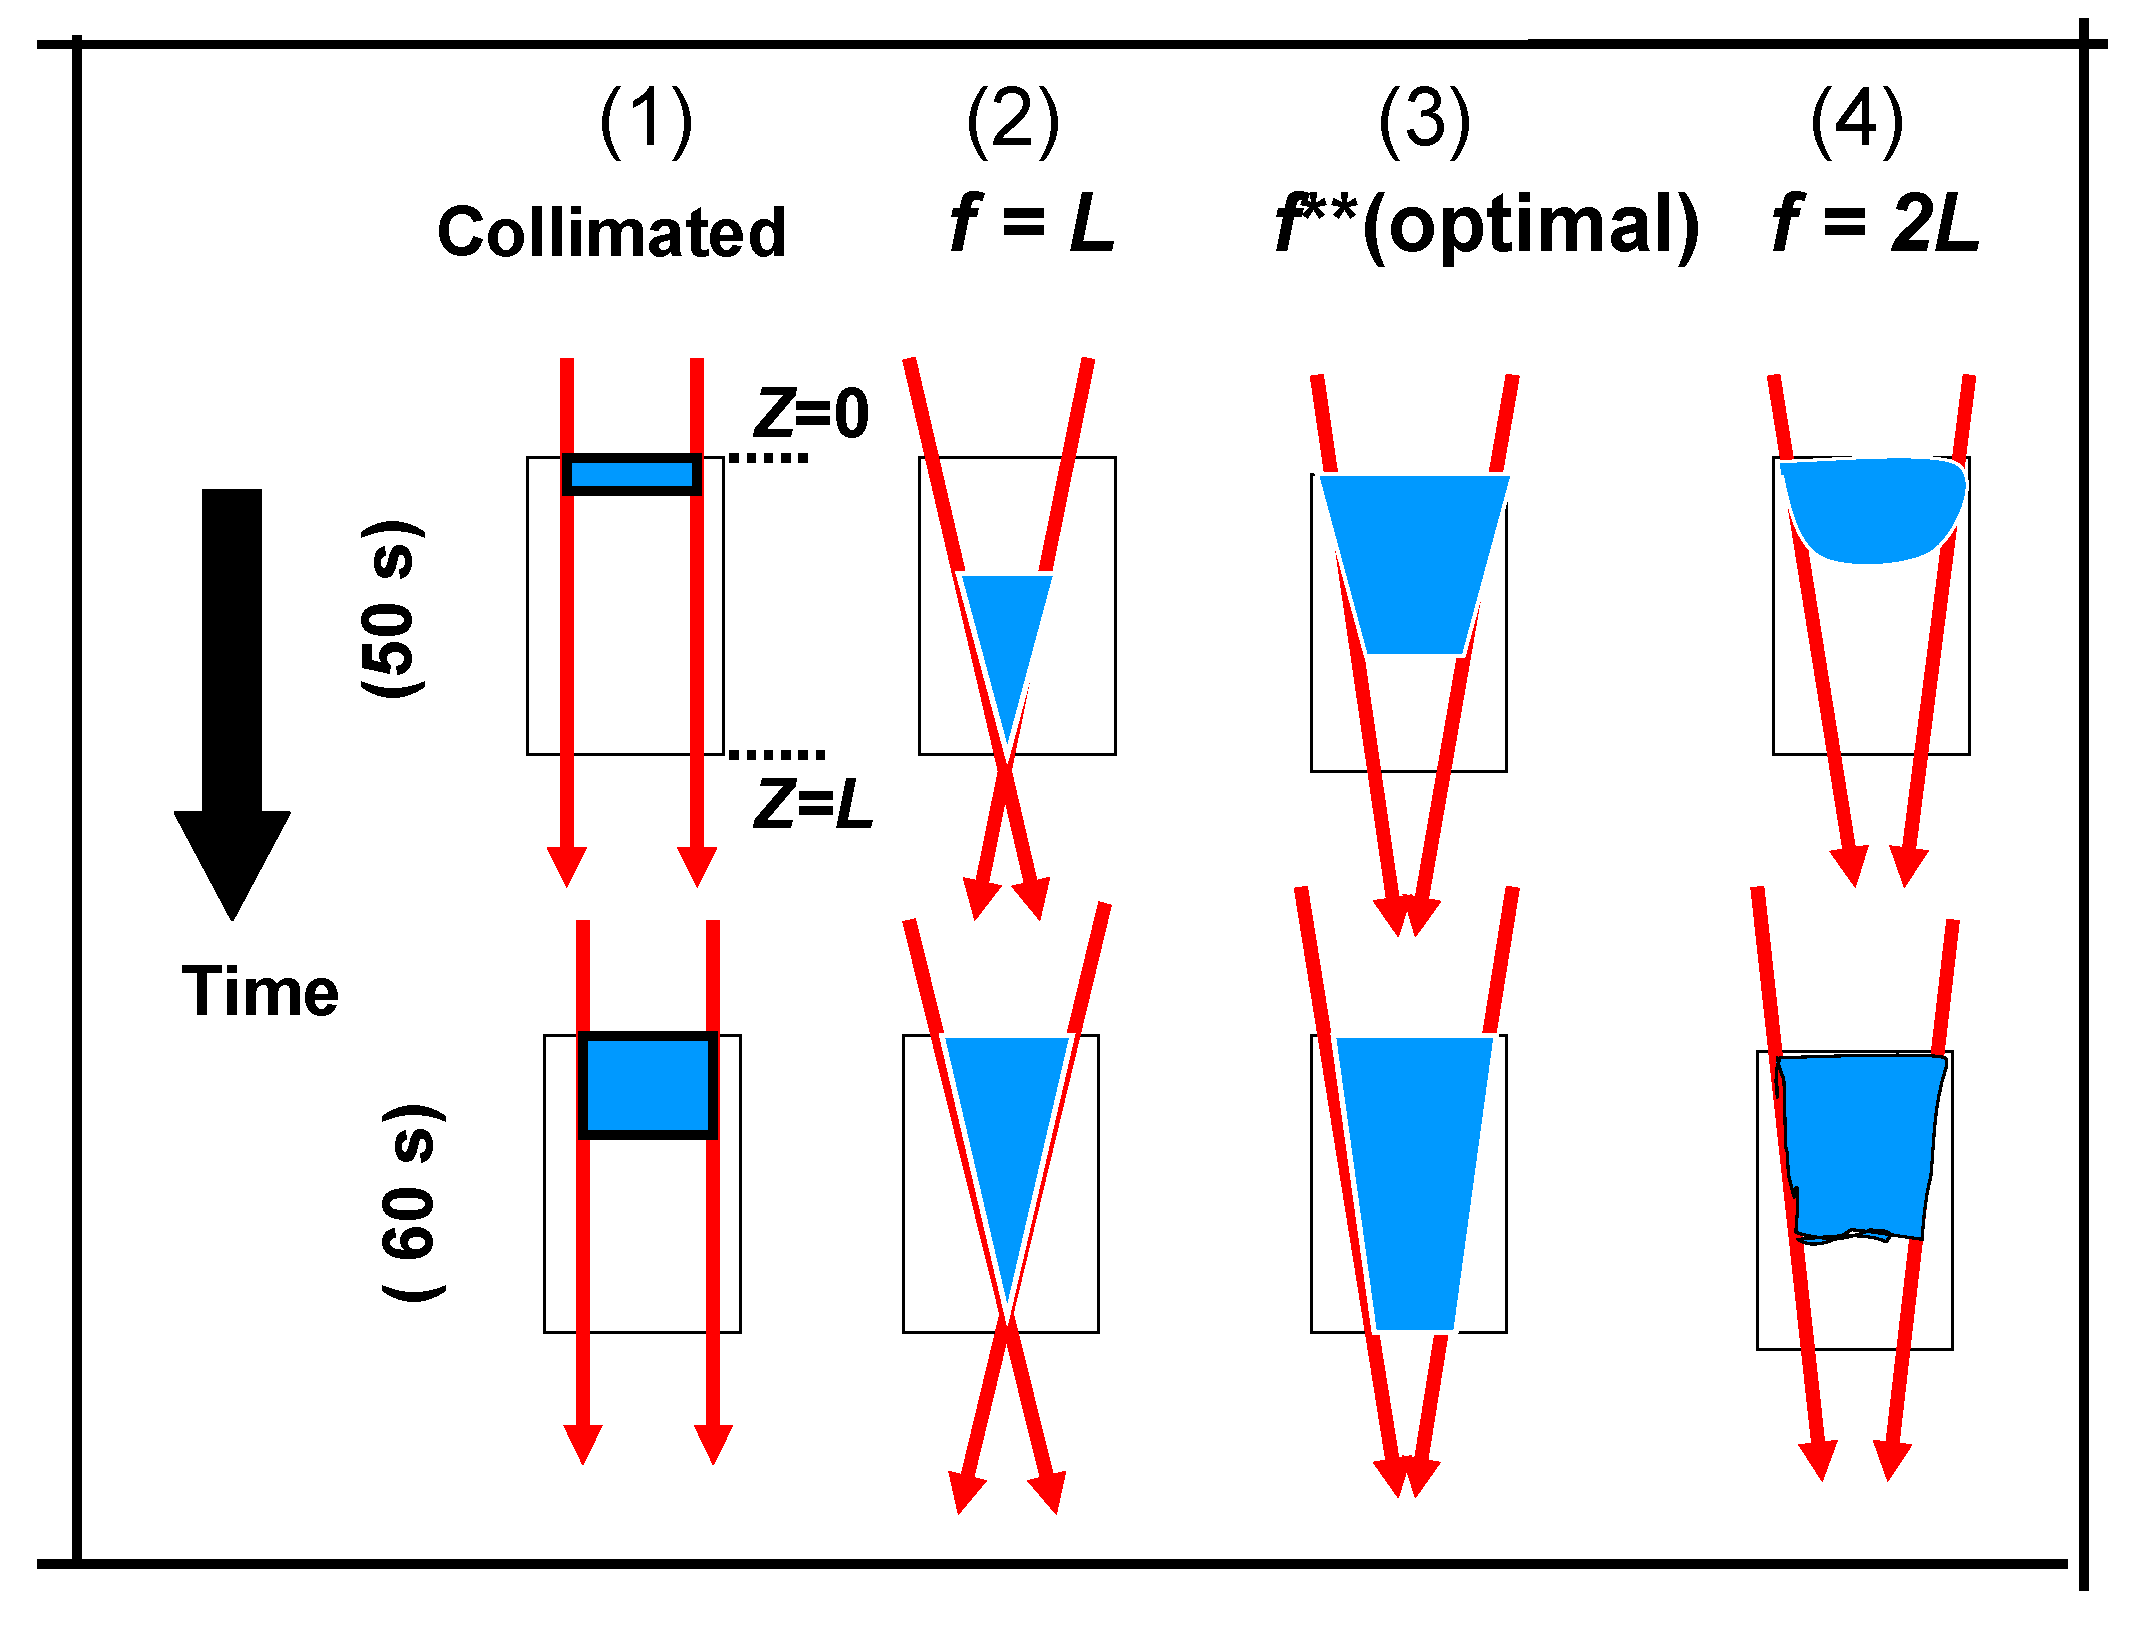
Figure 10.
Schematics of the time evolution (from 25 to 40 s) of photo-polymerization for the single beam system (without reflection) under various focusing conditions: (
1) collimated; (
2) tightly focusing; (
3) optimal focusing; and (
4) slightly focusing [
16].
Figure 10.
Schematics of the time evolution (from 25 to 40 s) of photo-polymerization for the single beam system (without reflection) under various focusing conditions: (
1) collimated; (
2) tightly focusing; (
3) optimal focusing; and (
4) slightly focusing [
16].

