Extensional Flow Properties of Externally Plasticized Cellulose Acetate: Influence of Plasticizer Content


 ,
,
Abstract
:
1. Introduction
2. Experimental Section
2.1. Materials and Compounding


| Mn (g·mol−1) | ρ (g·cm−3) | Vm (cm3·mol−1) | Tbp at 706 mmHg (°C) | Hansen solubility parameter δ [(MPa)0.5] [29] | |||
|---|---|---|---|---|---|---|---|
| δt | δd | δp | δh | ||||
| 276.3 | 1.13 | 244.5 | 294 | 20.98 | 16.5 | 4.9 | 12.0 |
 is the throughput (kg·h−1). Melt strands were extruded through a dual strand die (d0 = 3 mm) into a water bath. The strands were pelletized and dried for 6 h at 70 °C.
2.2. Measurements
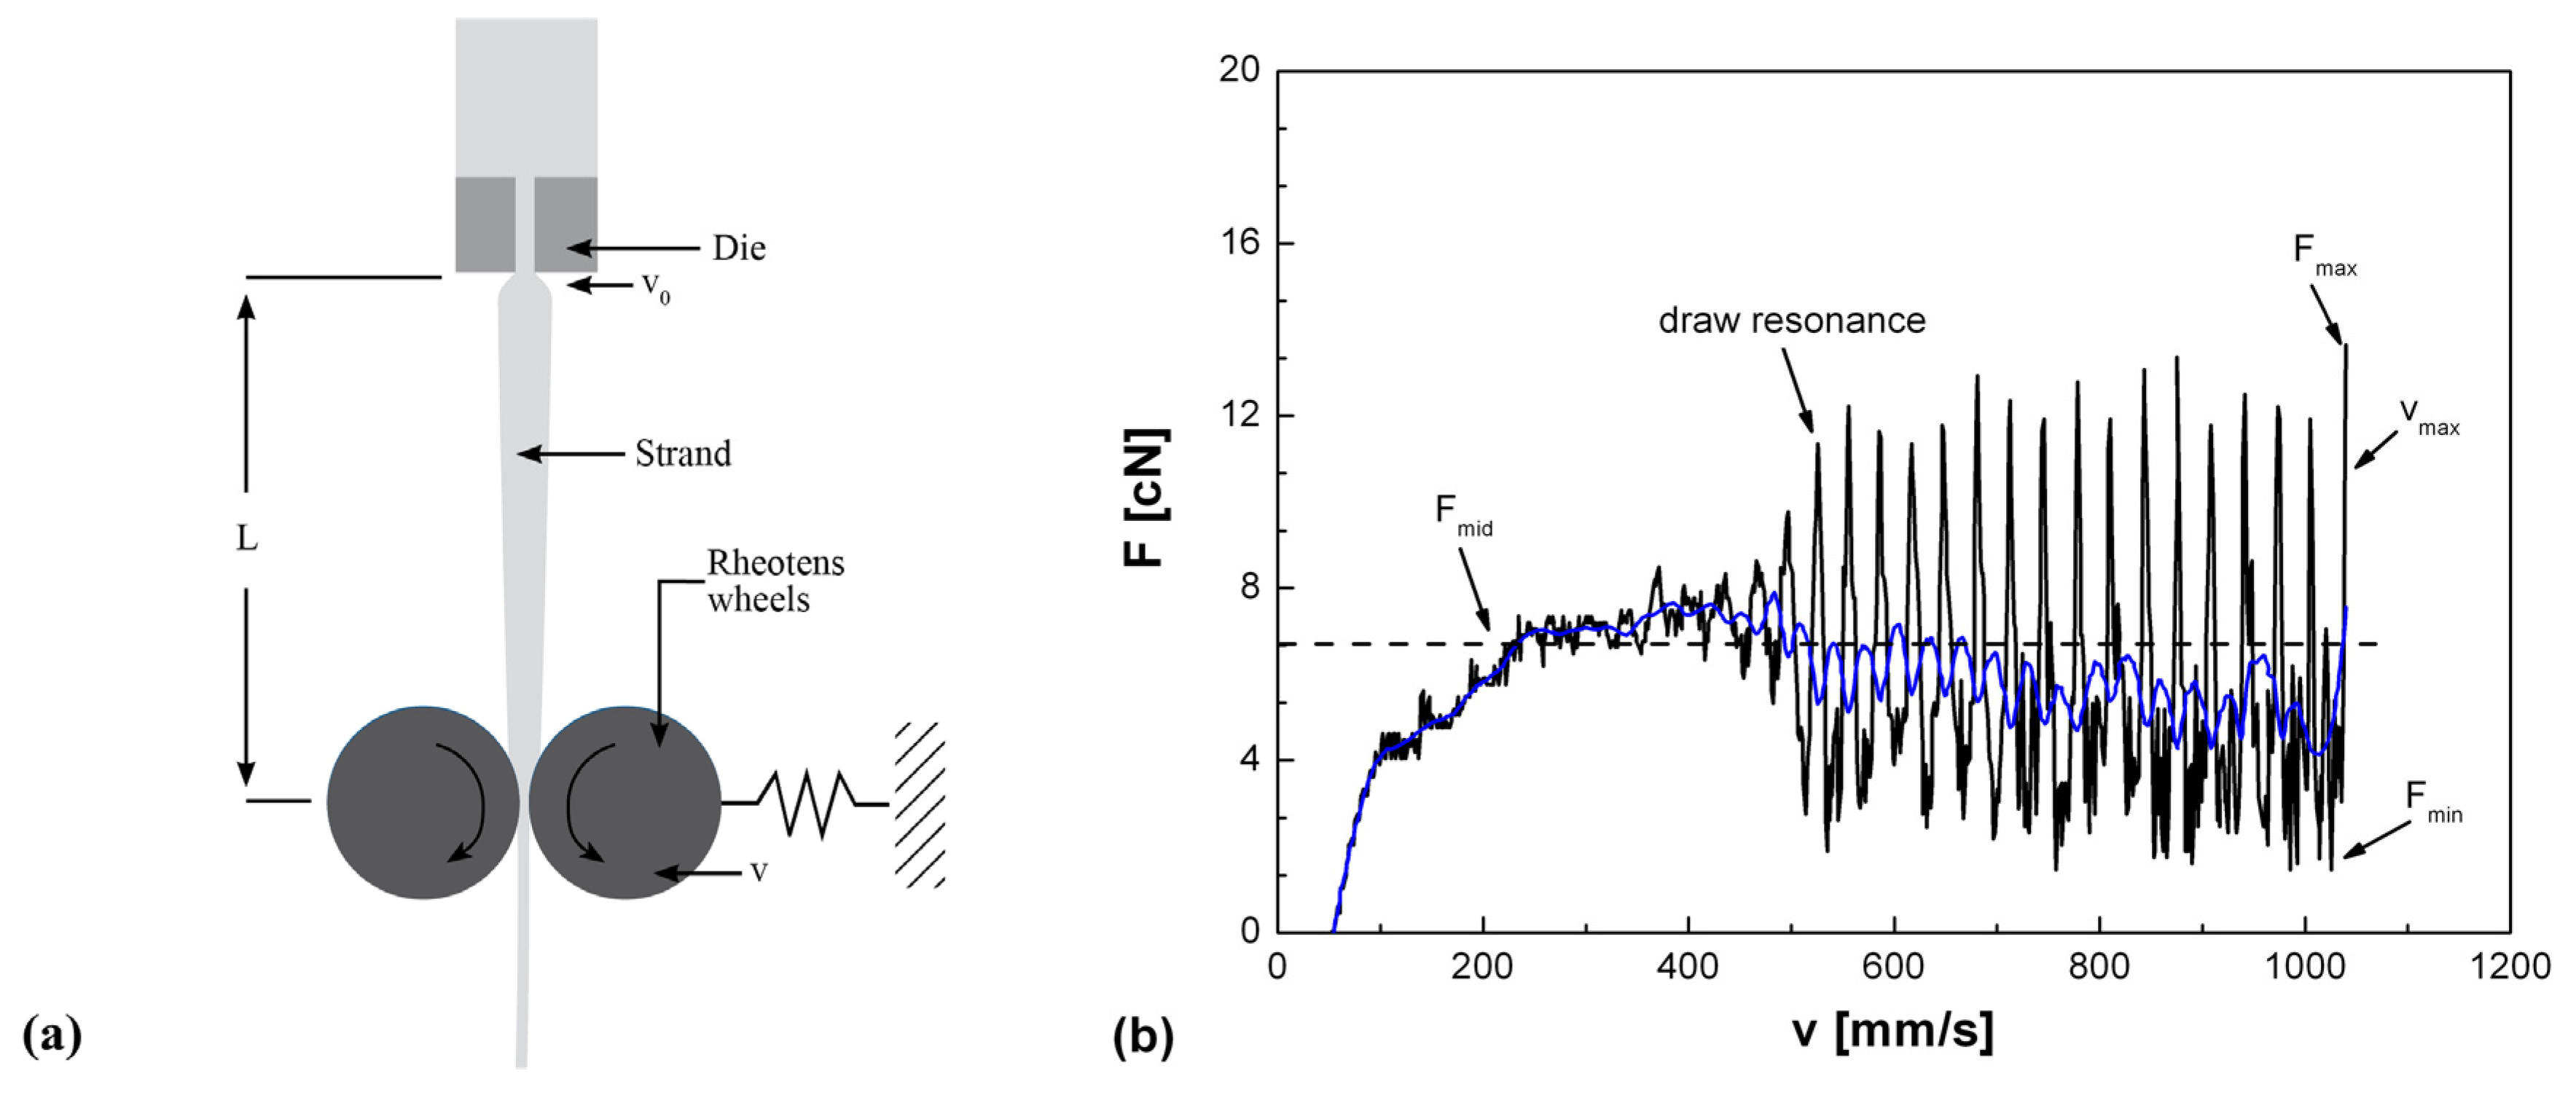
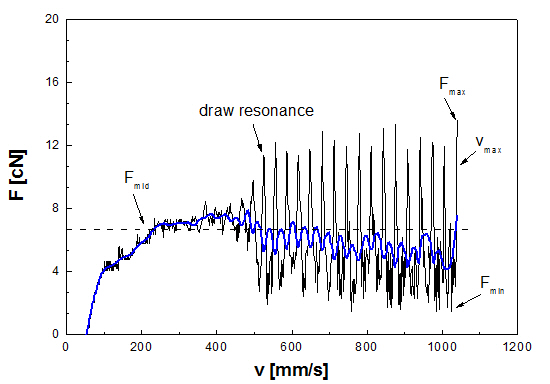
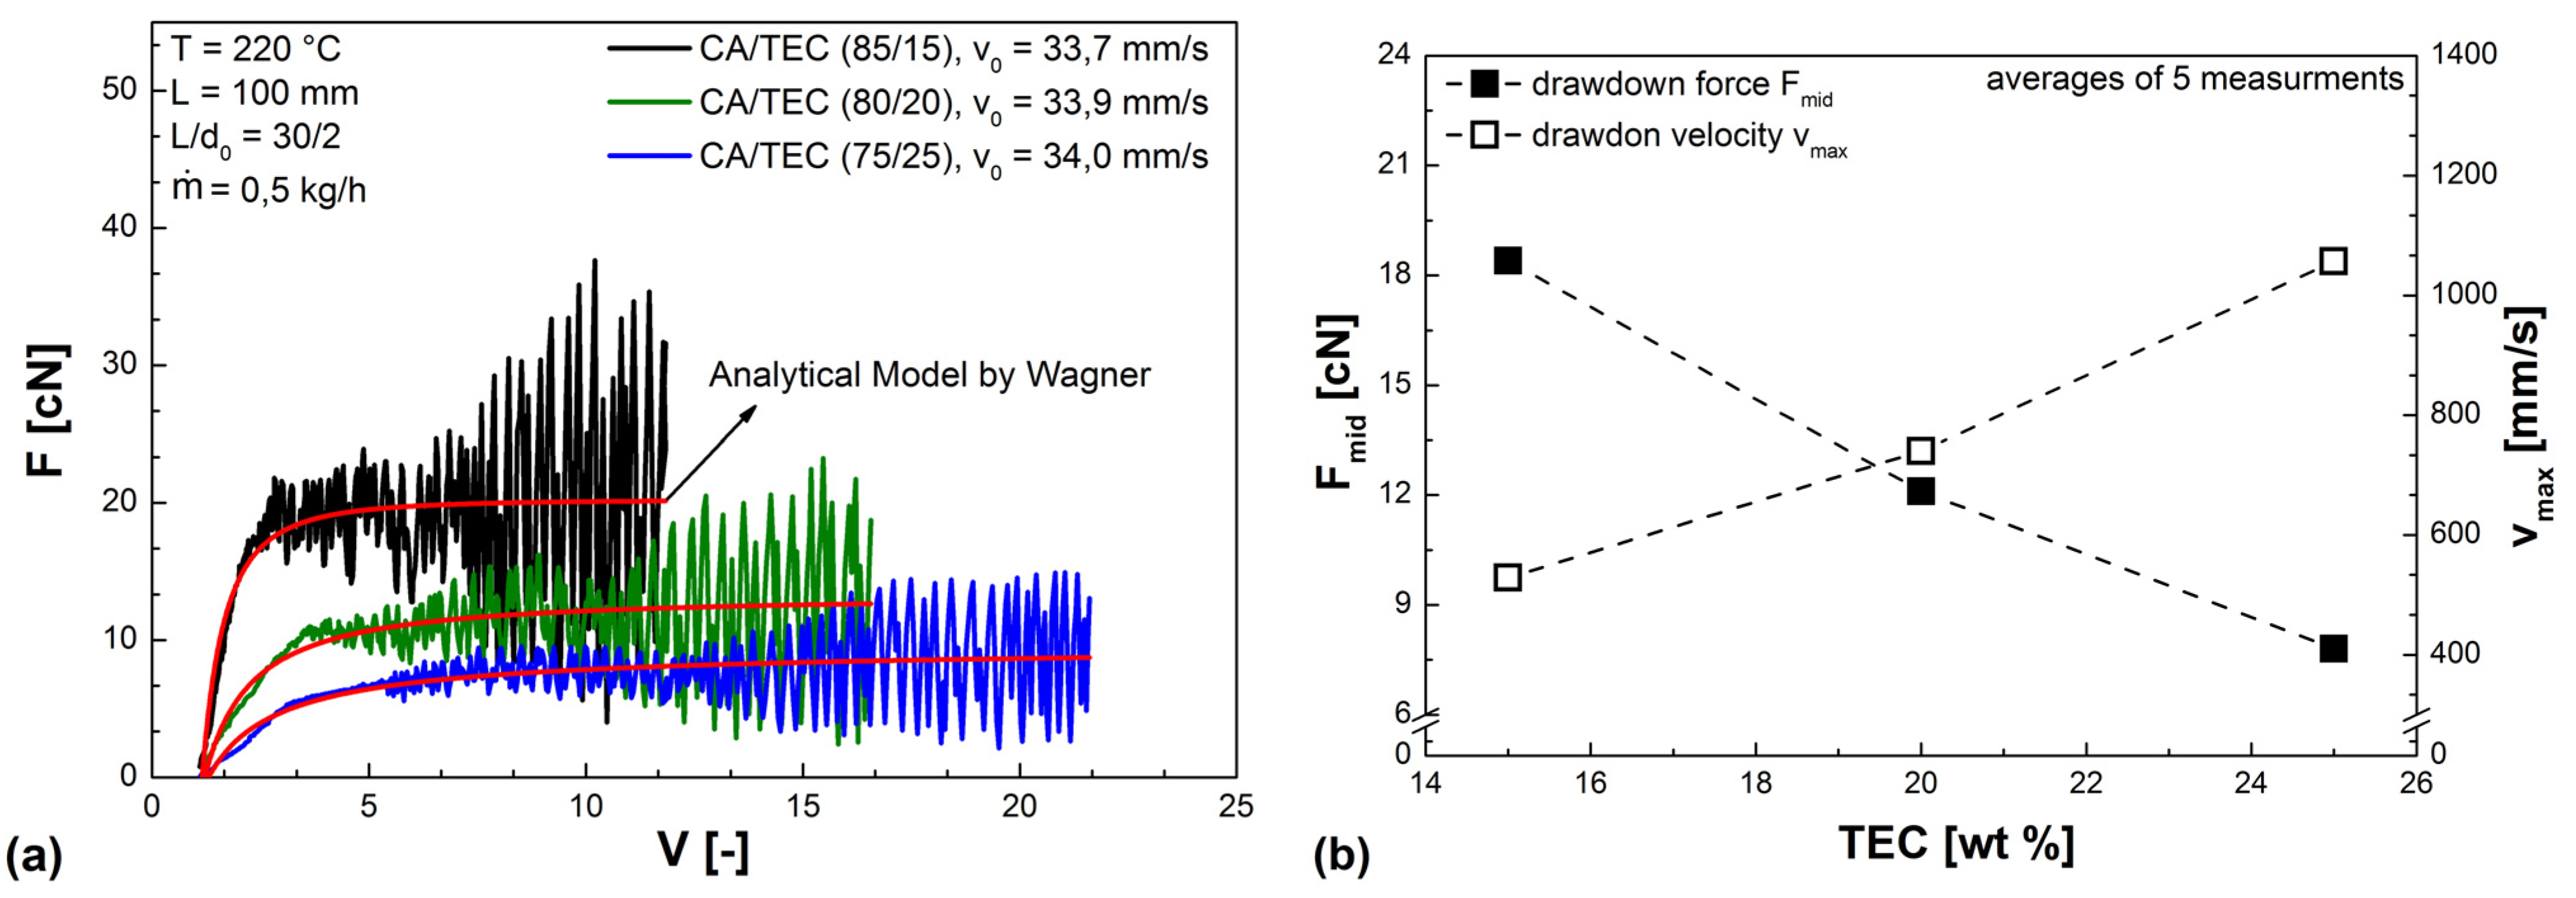
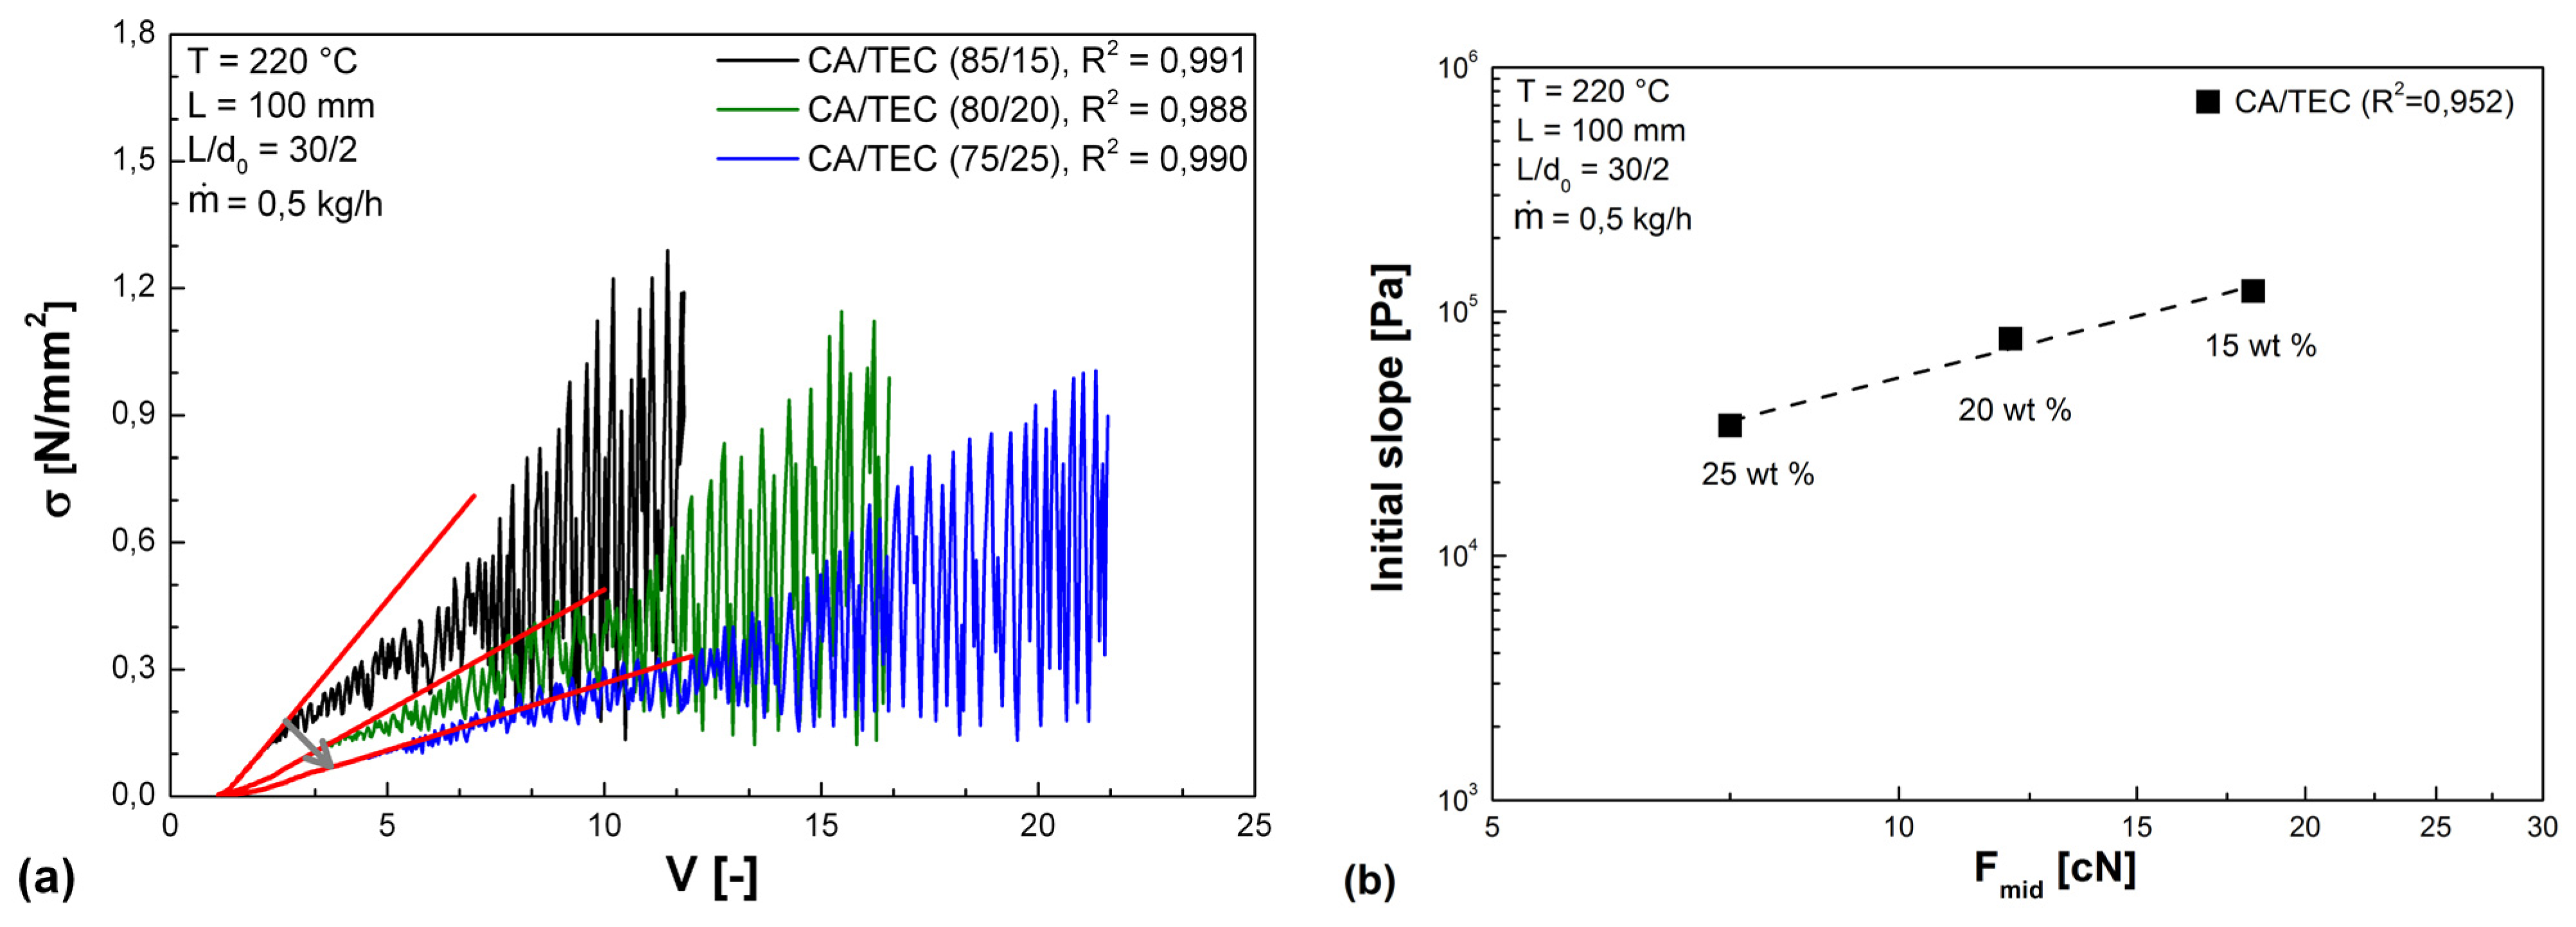
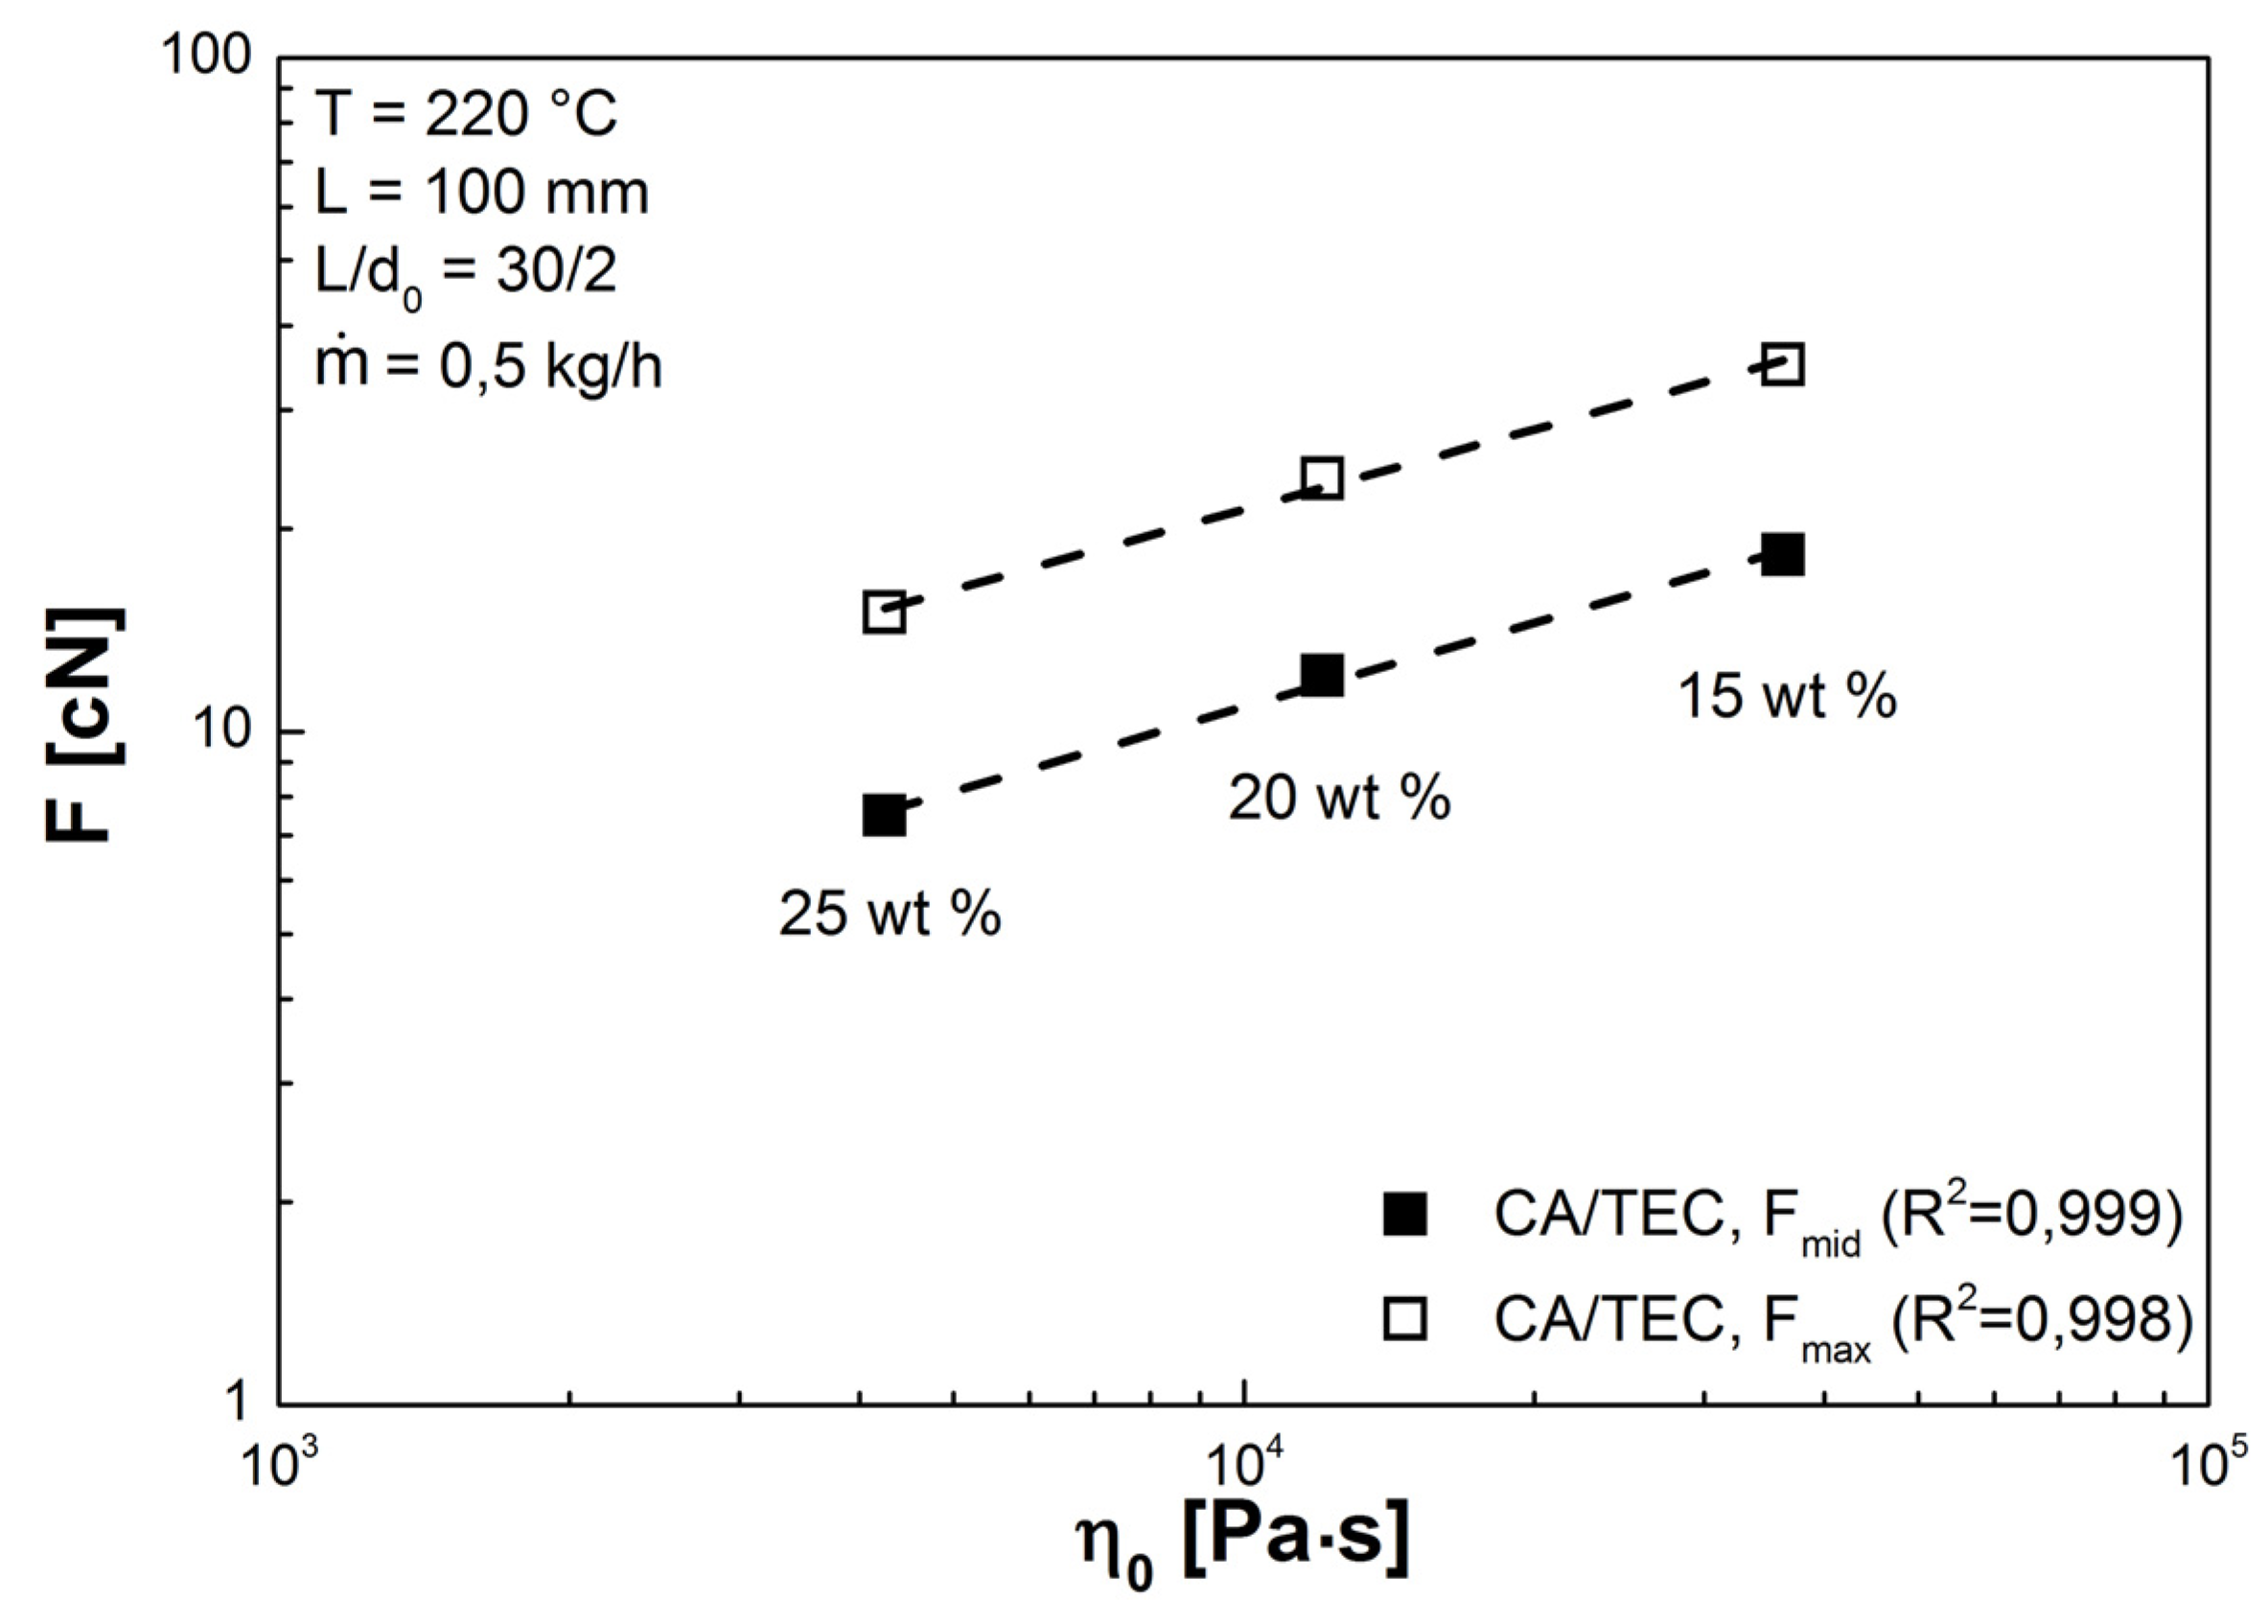
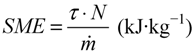
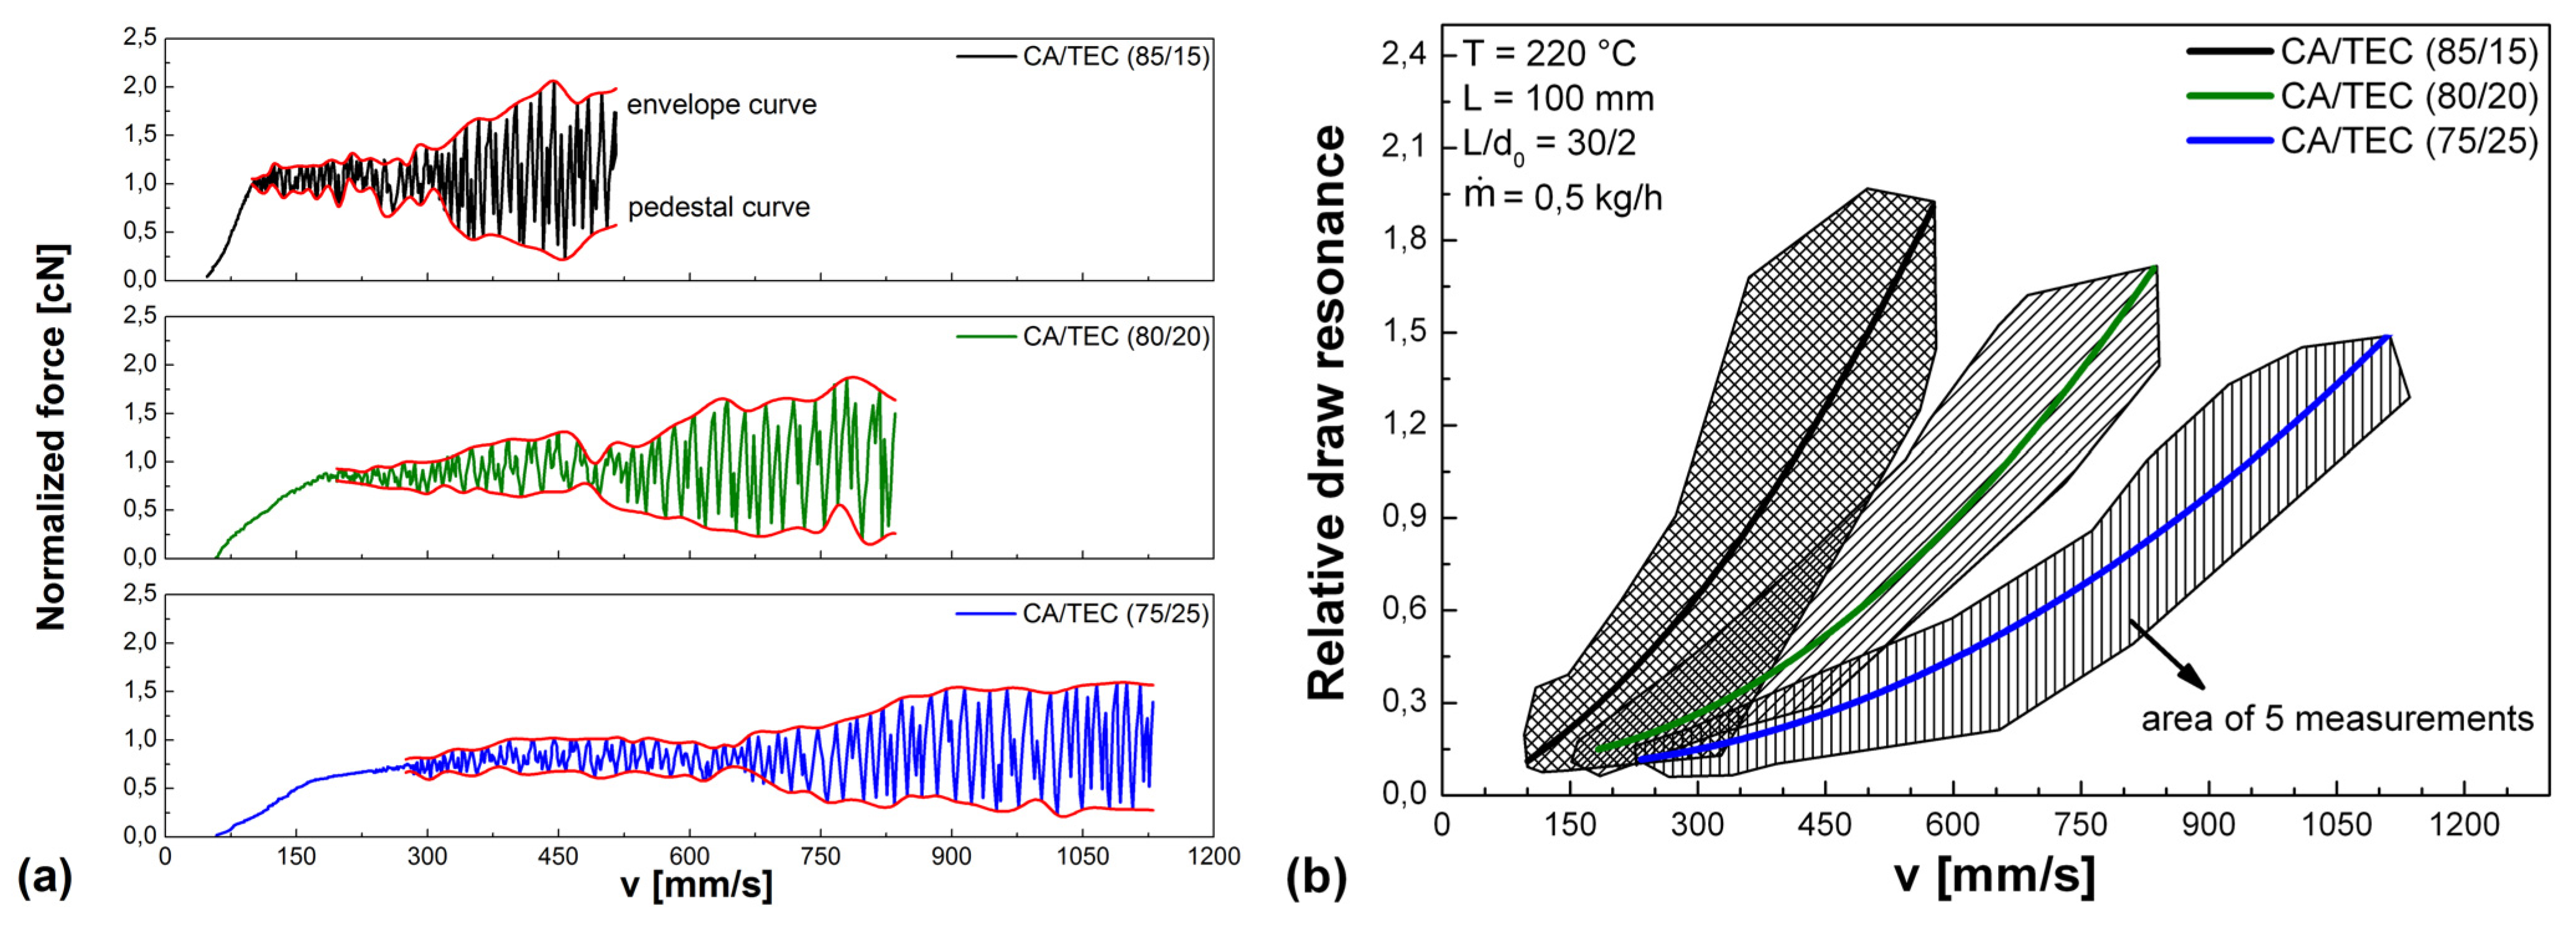
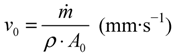 is the mass flow rate (g·s−1), ρ is the melt density (g·mm−3), and A0 is the cross section of the die (mm2). The initial slope of the stress curves was obtained by linear fit of the stress values corresponding to a stepwise increase in draw ratio V until the R2 values became lower than 98%. Additionally, the influence of plasticizer content on typical draw resonance was studied. Extensional flow properties were further correlated to shear viscosity using the zero shear viscosity η0, which was obtained from rotational rheometry. Finally, the area under the Rheotens curve was used to calculate the specific energy input ΔG per unit mass and to define a foamability number FN according to Stadlbauer et al. [36].
2.3. Foam Extrusion Tests
| Property | Unicell TS |
|---|---|
| Name | para-toluene-sulfonyl-semicarbazide |
| Type of decomposition | exothermic |
| Decomposition temperature (°C) | 220 |
| Gas yield at 220 °C (mL·g−1) | 130 |
| Foaming gas components | CO2, N2, NH3 |
| Average particle size (µm) | 10 |
| Unicell TS (wt %) | Screw speed (min−1) | Die pressure (bar) | Extruder barrel temperatures (°C) | ||||
|---|---|---|---|---|---|---|---|
| 1 | 2 | 3 | 4 | Die | |||
| 1 | 12 | 40 | 200 | 220 | 210 | 195 | 185 |

3. Results and Discussion
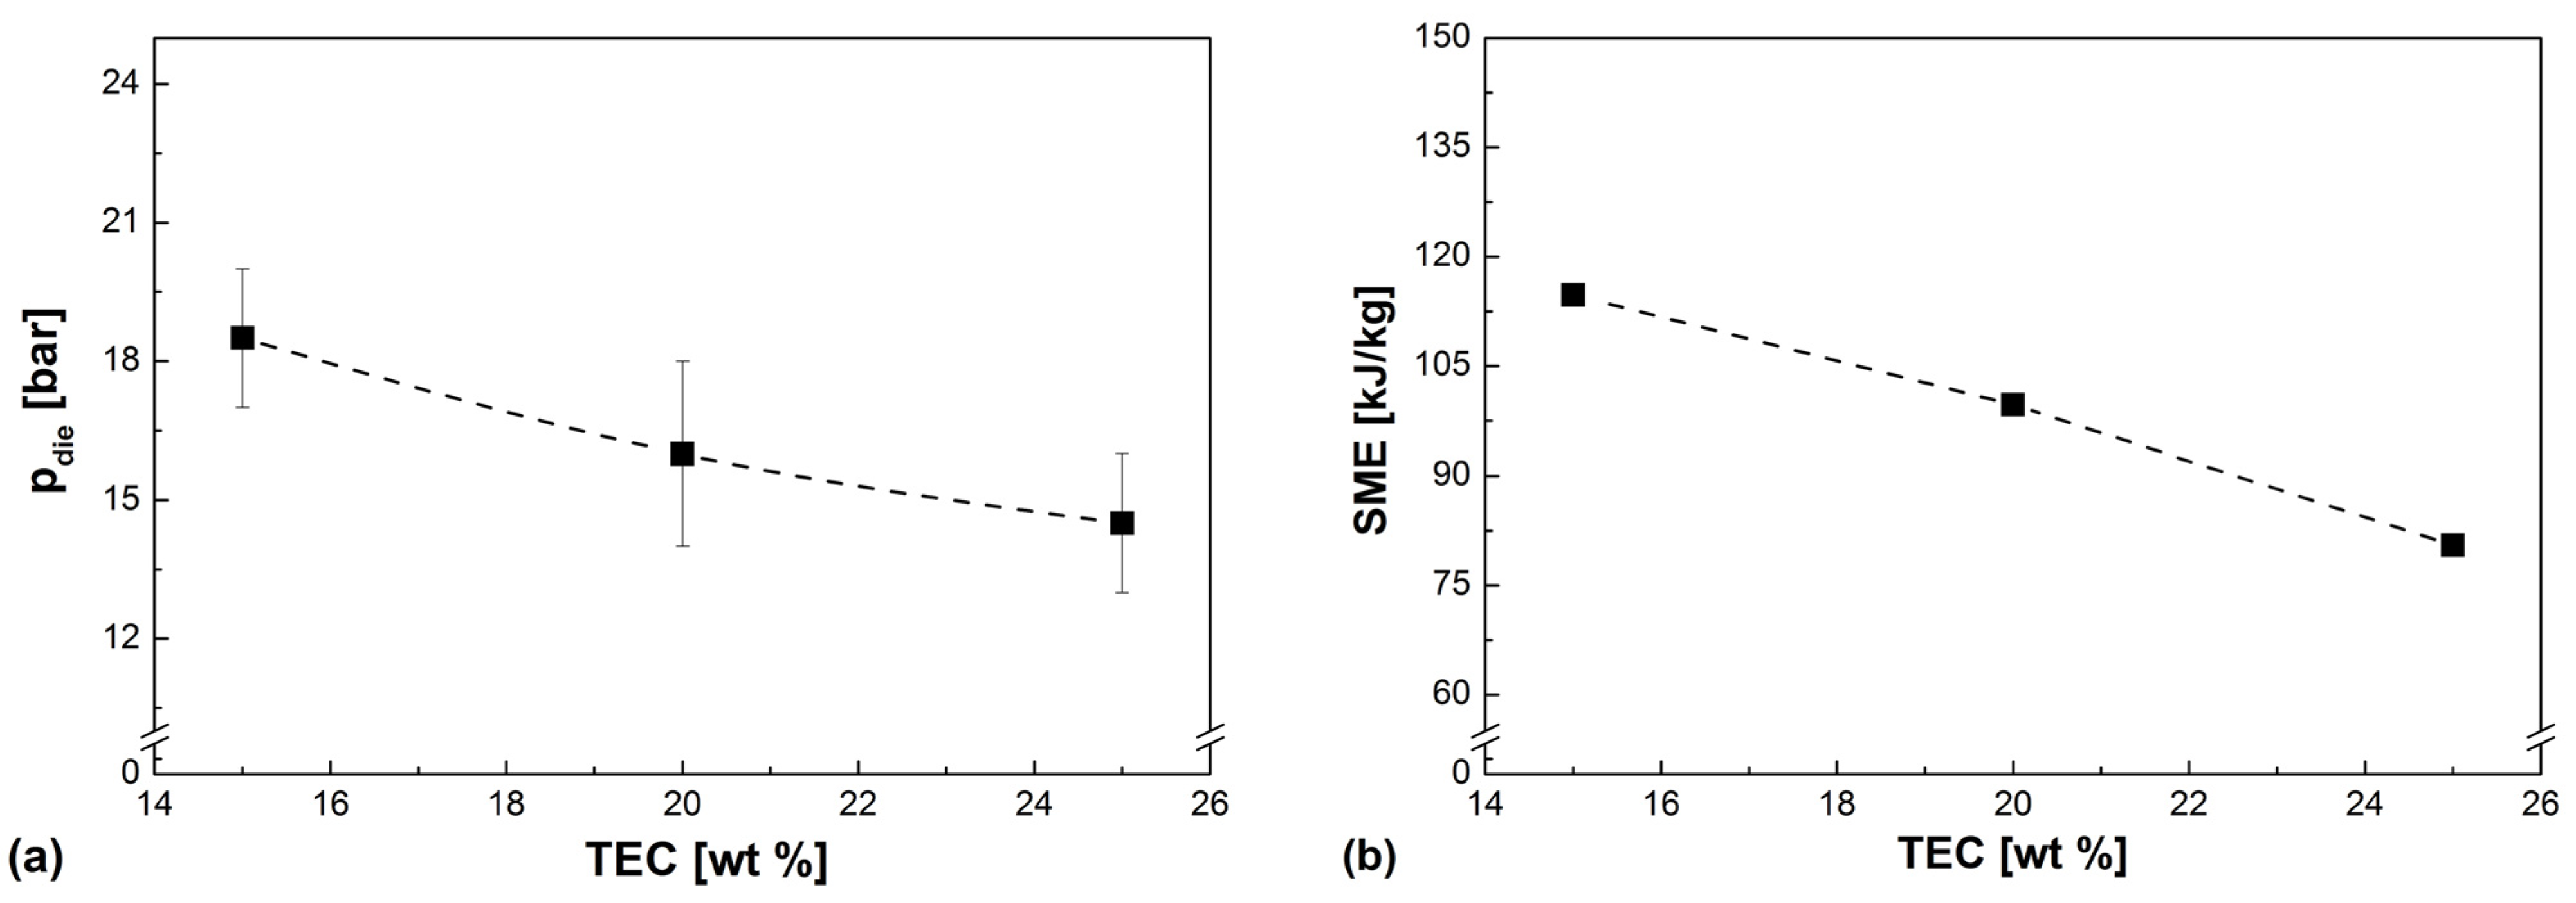
3.1. Influence of Plasticizer Content on Melt Processing of CA
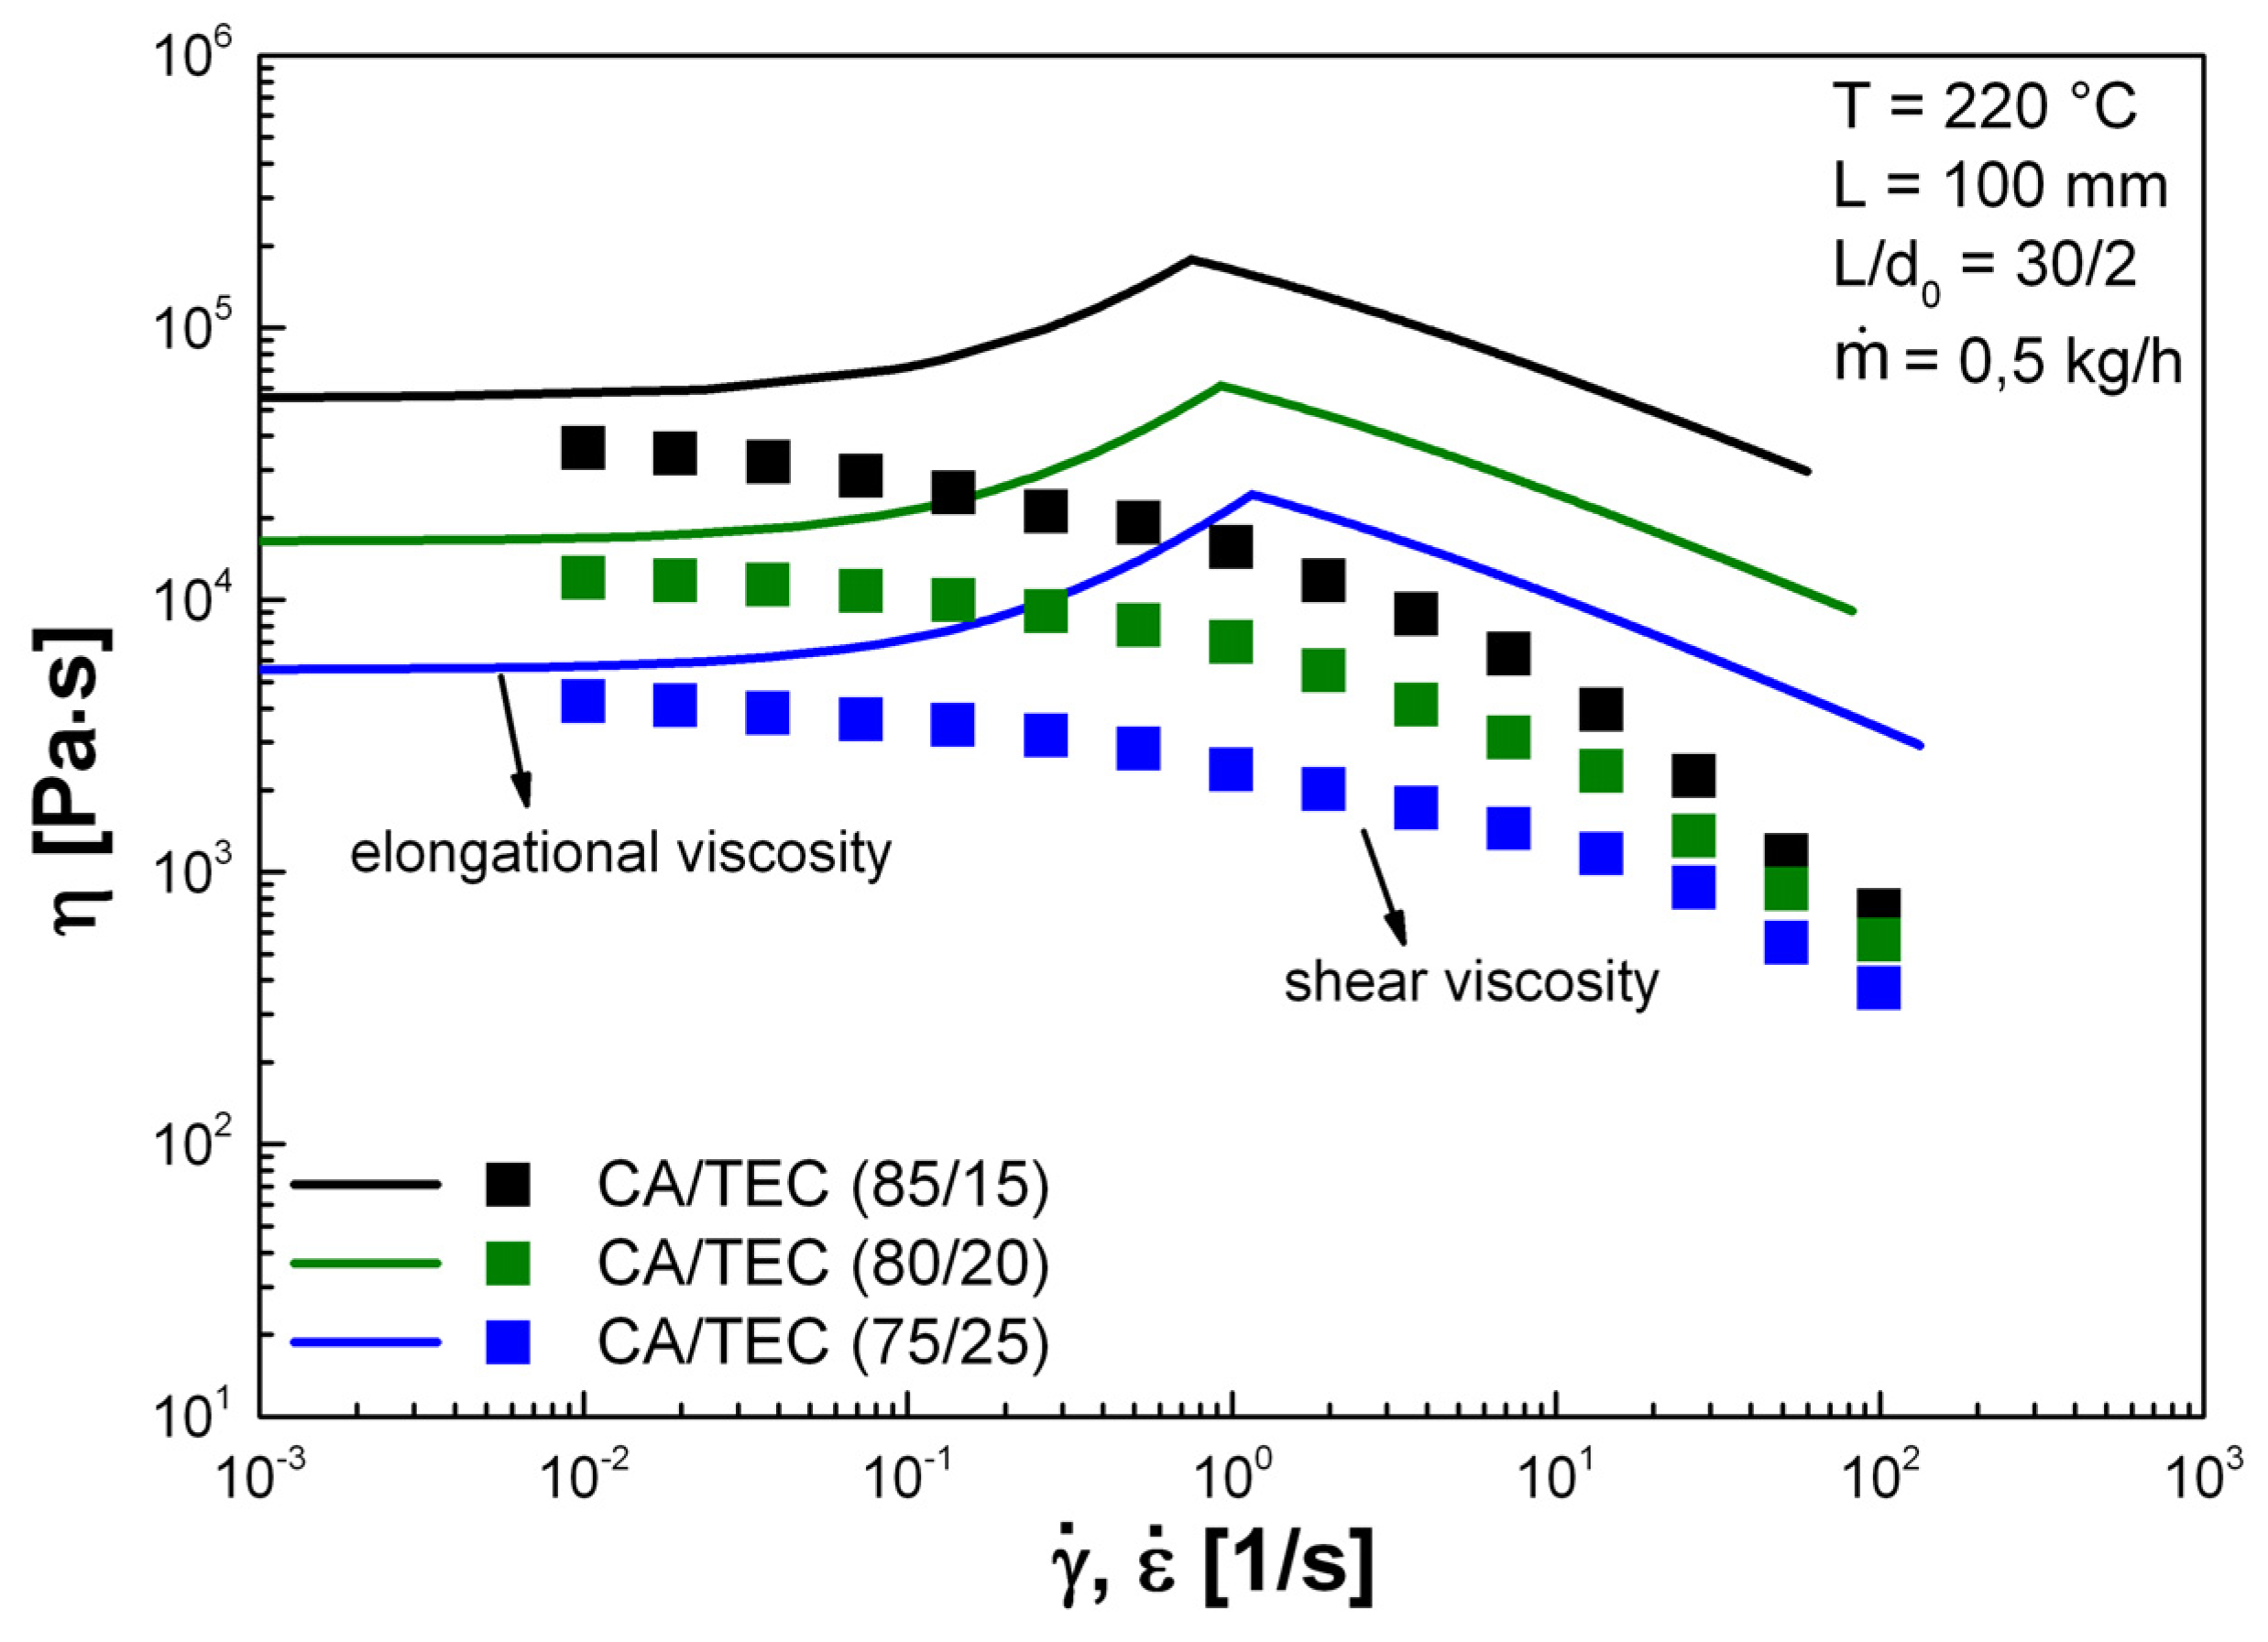
3.2. Influence of Plasticizer Content on Shear Viscosity and Elongational Flow Properties of CA
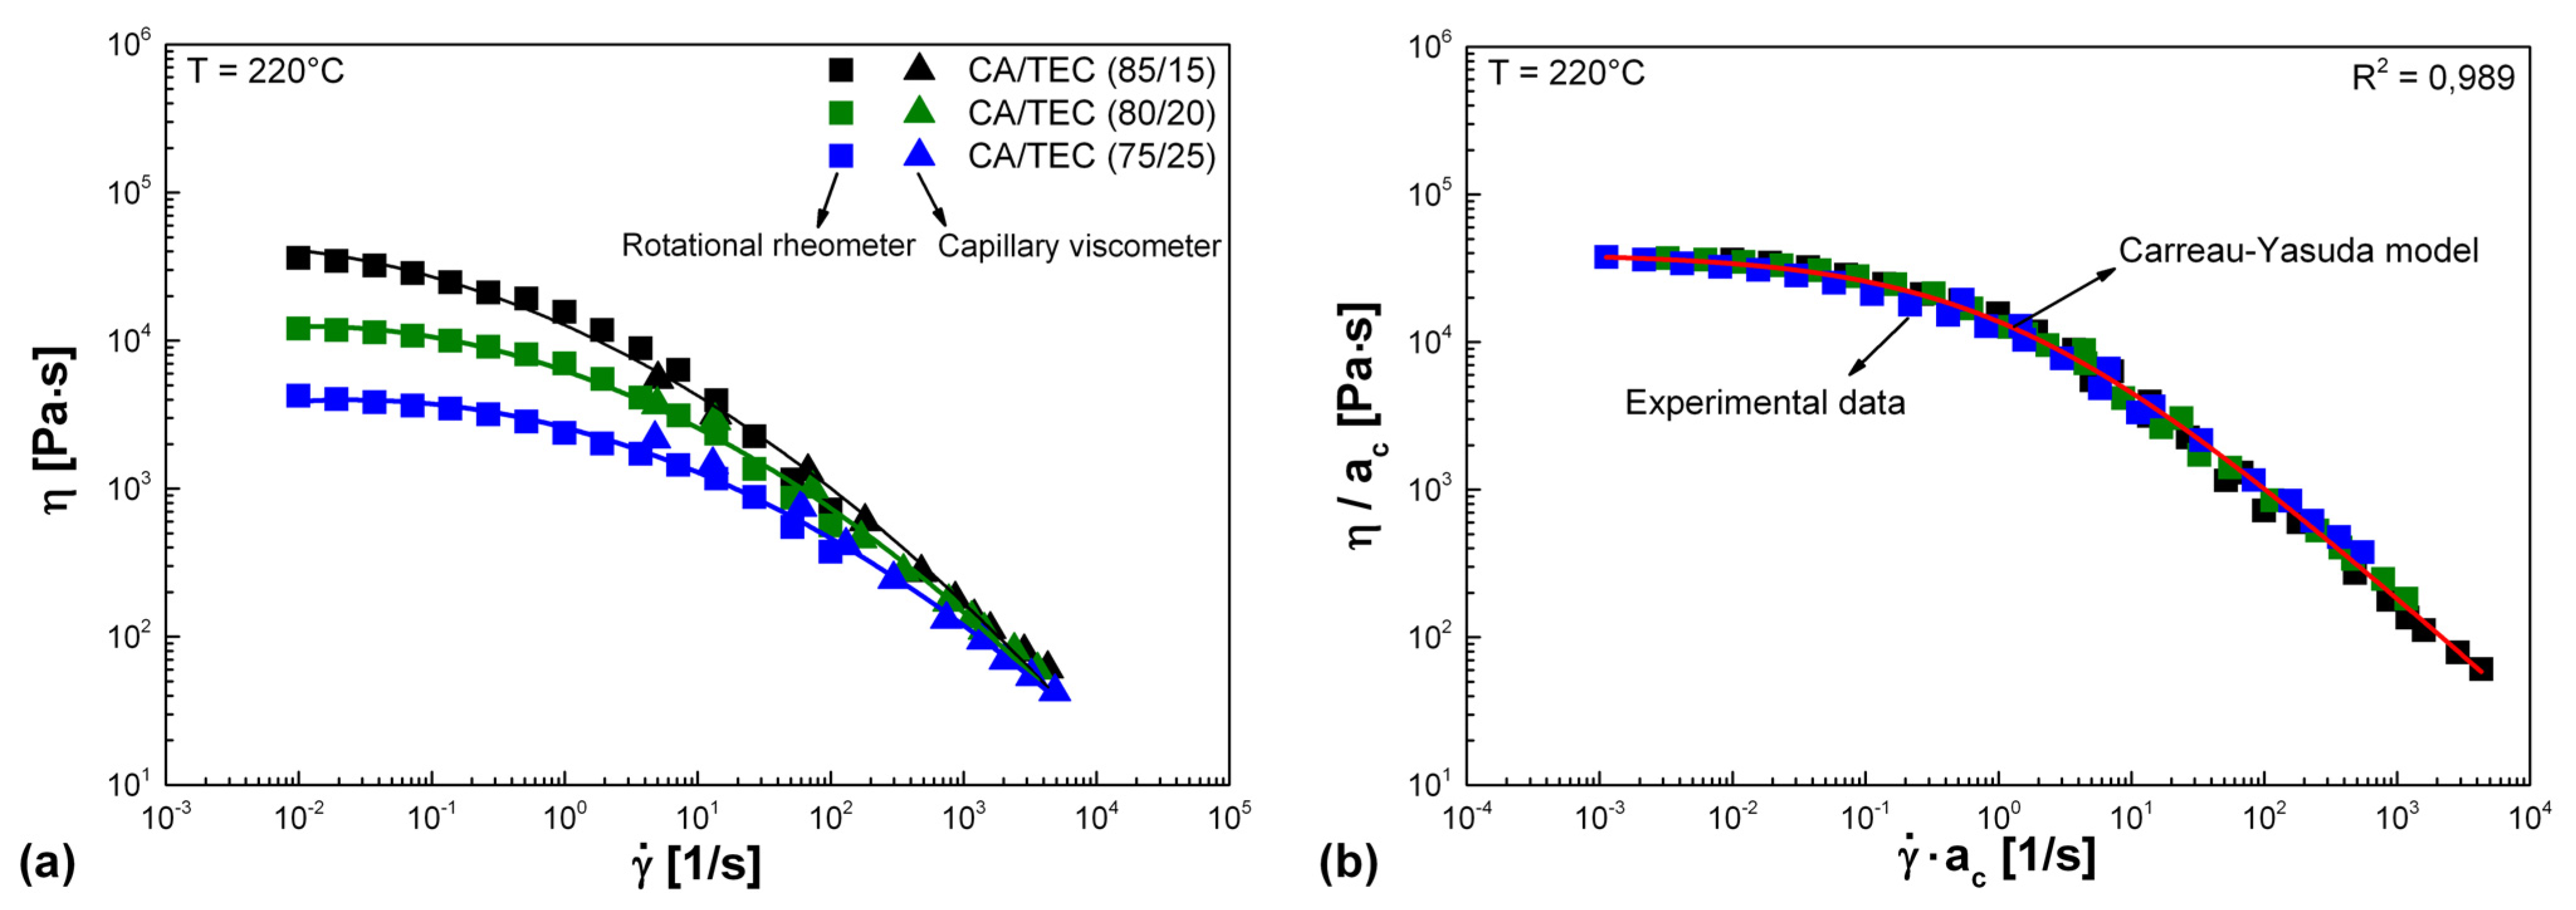
 in dependence of TEC content; (b) Calculated master curve using a concentration-dependent shift factor ac and predicted master curve using the Carreau-Yasuda model.
in dependence of TEC content; (b) Calculated master curve using a concentration-dependent shift factor ac and predicted master curve using the Carreau-Yasuda model.
in dependence of TEC content; (b) Calculated master curve using a concentration-dependent shift factor ac and predicted master curve using the Carreau-Yasuda model.
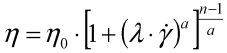 , the power law exponent n, and a dimensionless parameter a, which describes the width of the transition between the zero shear viscosity region and the power law region.


| Property | TEC (wt %) | ||
|---|---|---|---|
| 15 | 20 | 25 | |
| MFR (g/10 min) | 2.2 | 5.7 | 11.8 |
| η0 (Pa·s) | 36210 | 12060 | 4250 |
| Fmax (cN) | 35.0 | 23.7 | 15.0 |
| Fmid (cN) | 18.3 | 12.1 | 7.5 |
| Fmin (cN) | 4.3 | 3.4 | 2.3 |
| vmax (mm·s−1) | 528.5 | 758.1 | 1056.6 |
| Vmax (–) | 12.1 | 16.2 | 21.6 |
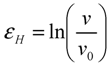
| εH (–) | 2.5 | 2.8 | 3.1 |
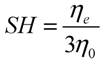
| SH (–) | 1.7 | 1.4 | 1.2 |
 of the extruder according to Equation (6).
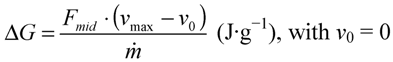
| Property | TEC (wt %) | ||
|---|---|---|---|
| 15 | 20 | 25 | |
| ΔG at vmax (v0 = 0) (J·g−1) | 0.70 | 0.66 | 0.57 |
| FN at Vmax (N) | 2.21 | 1.96 | 1.62 |
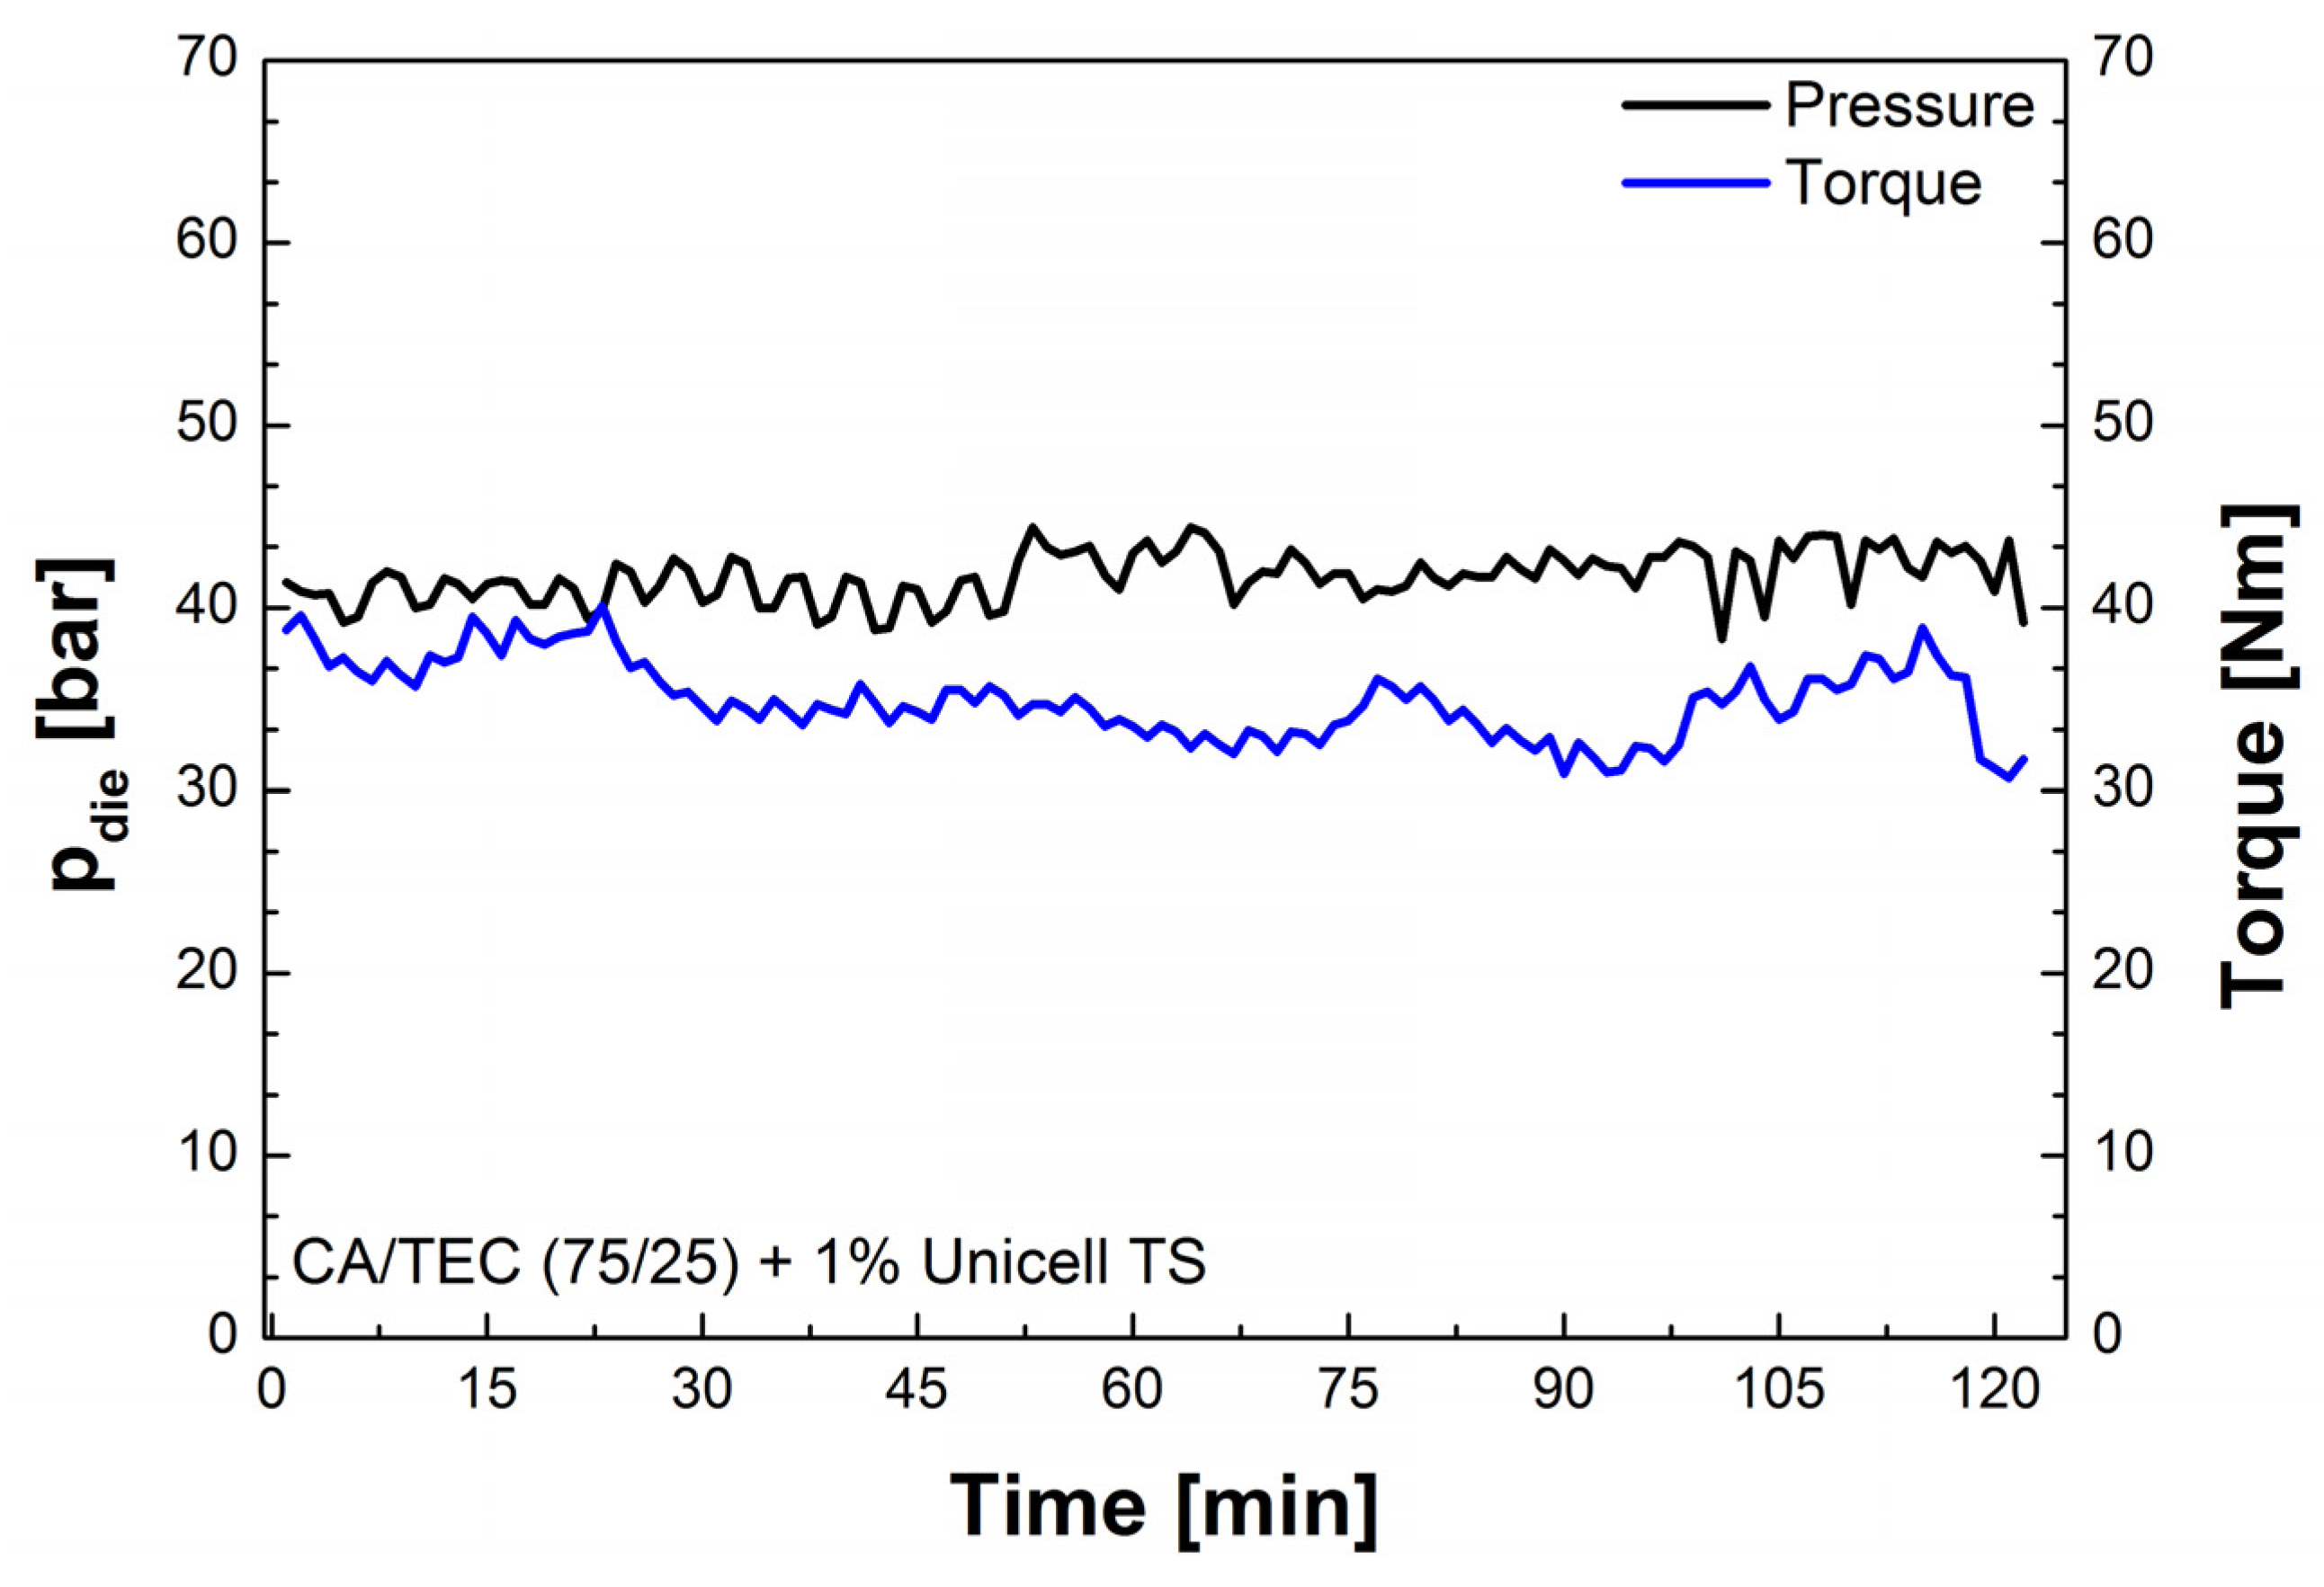
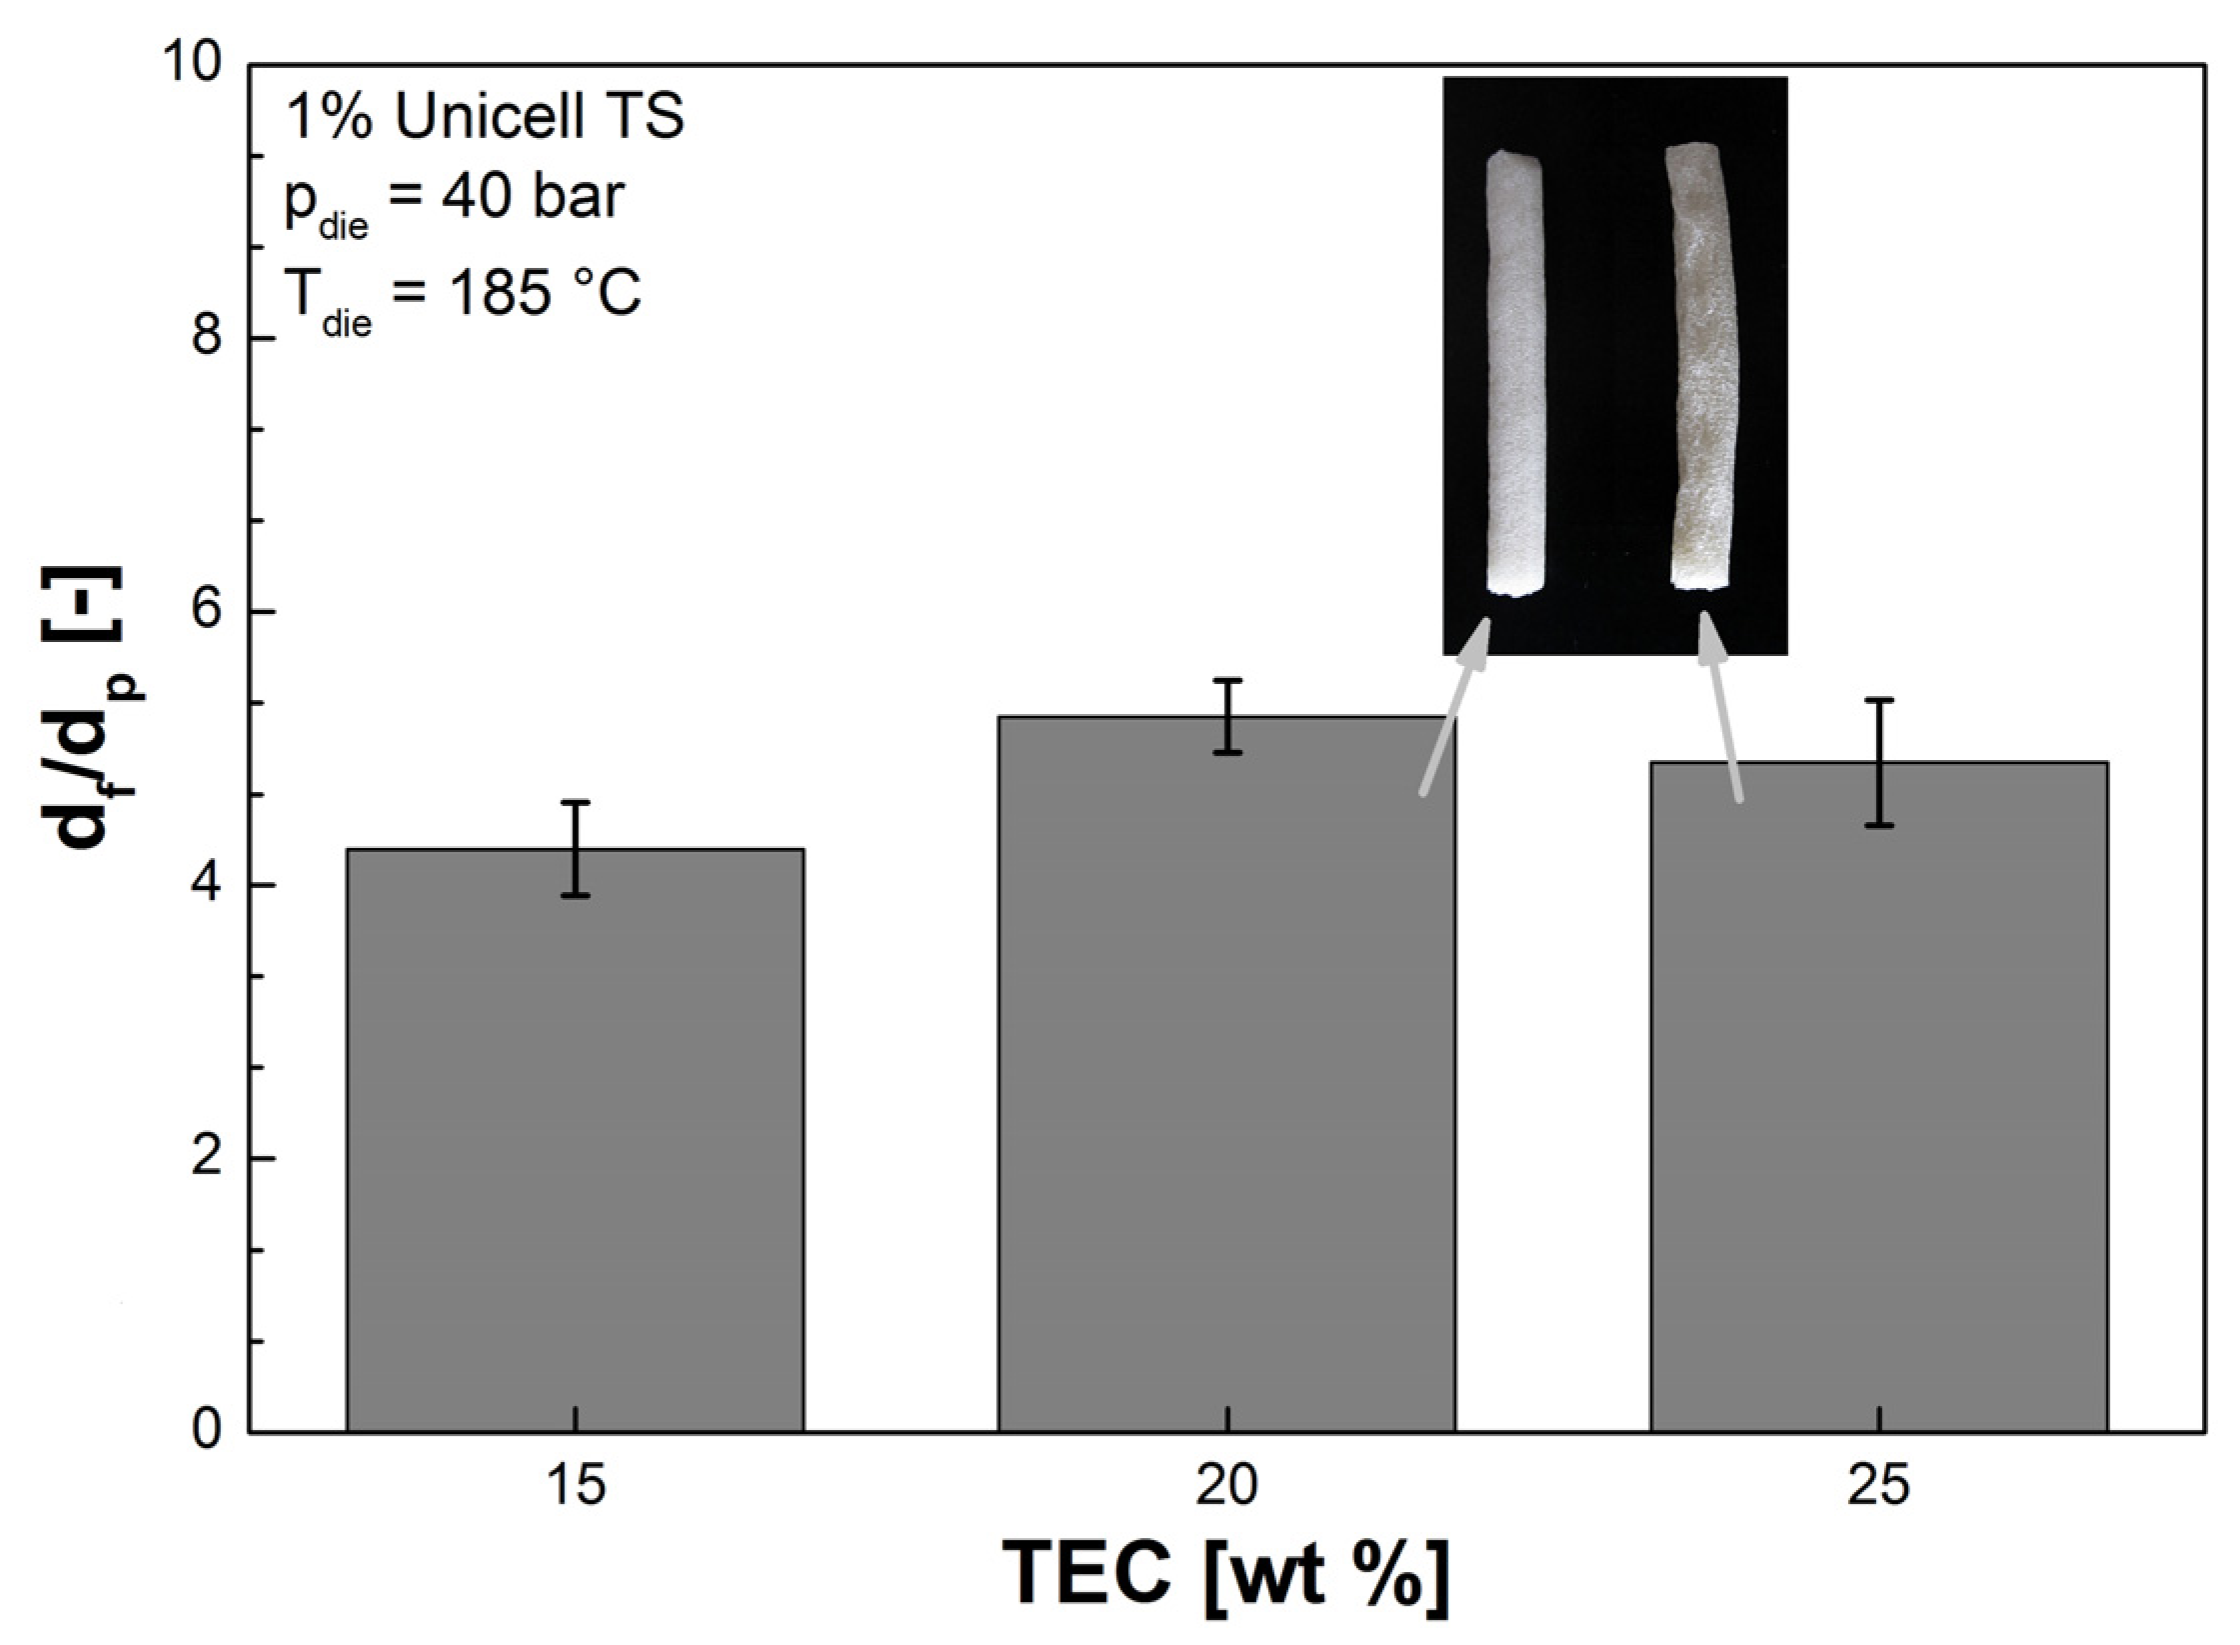
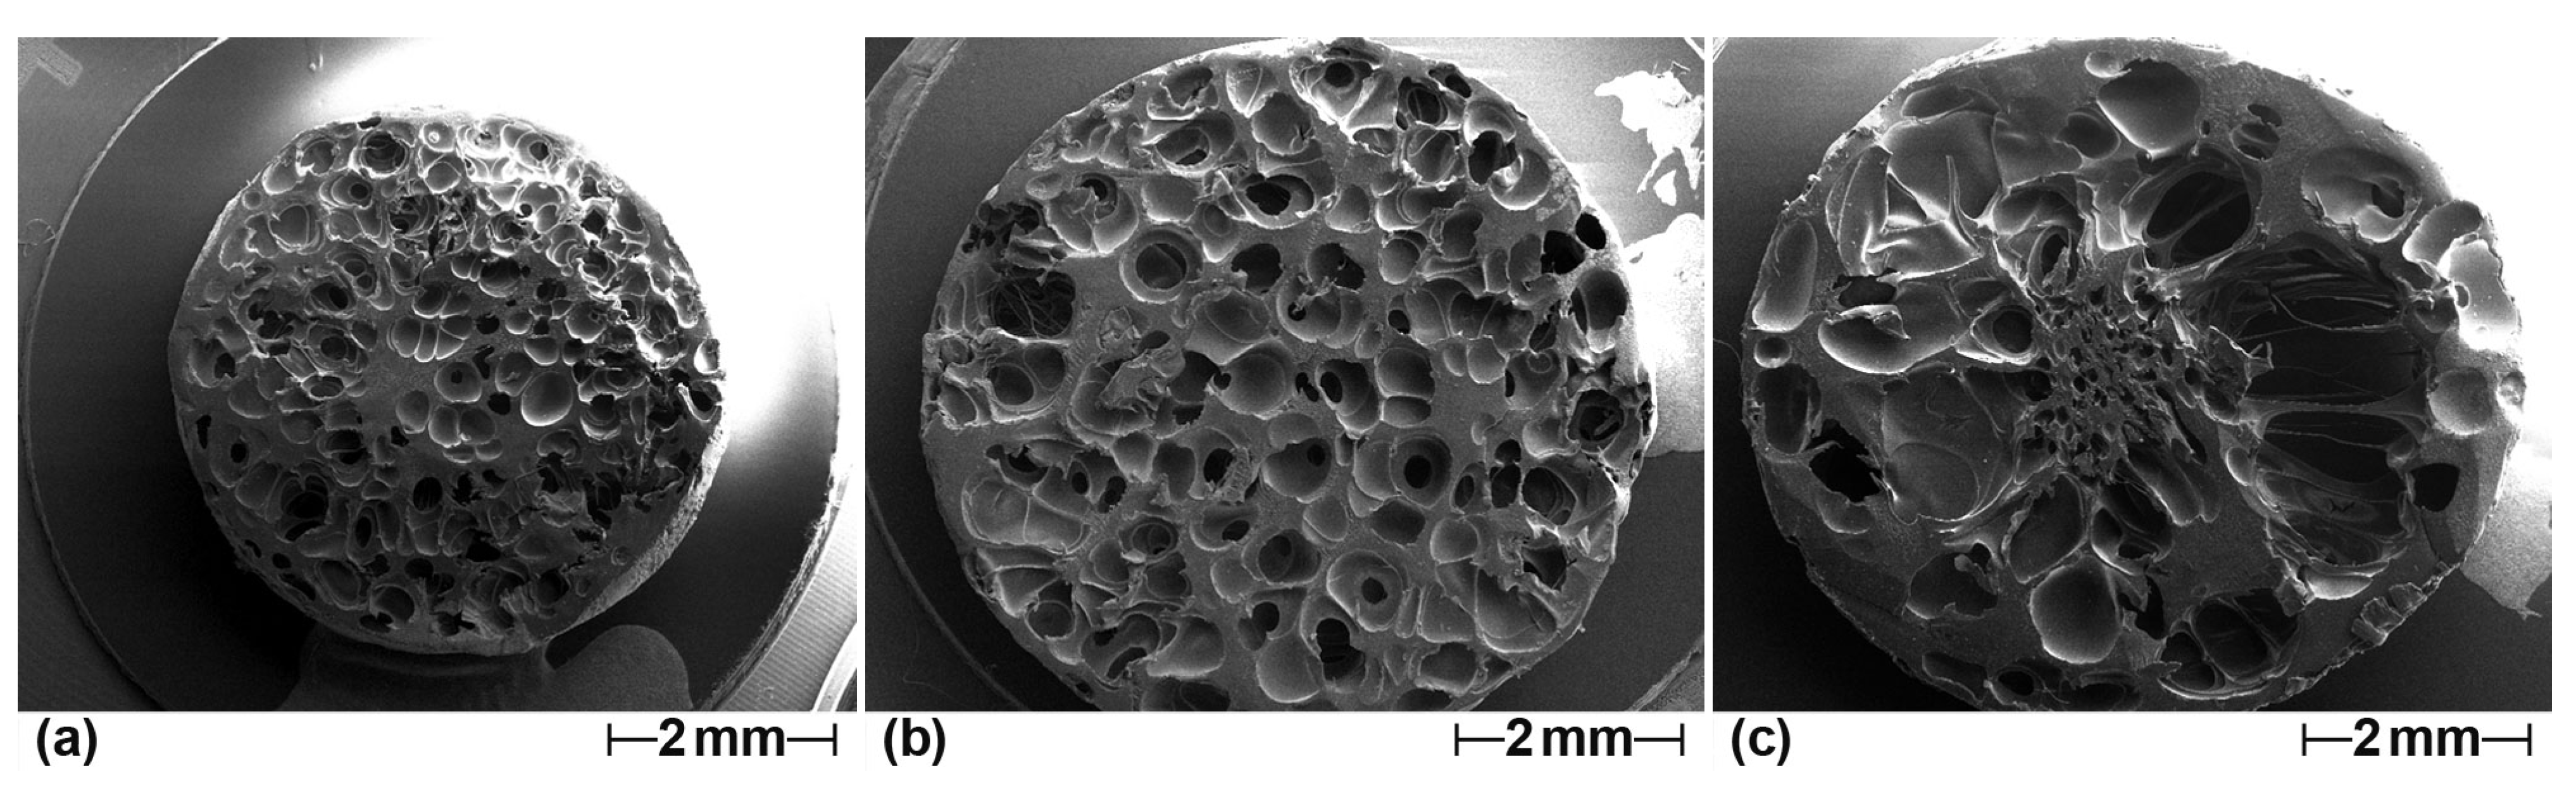
3.3. Influence of Plasticizer Content on Foam Extrusion Behavior of CA


4. Conclusions
Acknowledgments
References
- Zhang, Q.; Xanthos, M. Material Properties Affecting Extrusion Foaming. In Polymeric Foams: Mechanisms and Materials; Lee, S.-T., Ramesh, N.S., Eds.; CRC Press: Boca Raton, FL, USA, 2004; Chapter 4; pp. 111–138. [Google Scholar]
- Gendron, R. Rheological Behavior Relevant to Extrusion Foaming. In Thermoplastic Foam Processing: Principles and Development; Gendron, R., Ed.; CRC Press: Boca Raton, FL, USA, 2005; Chapter 2; pp. 43–103. [Google Scholar]
- Kwag, C.; Manke, C.W.; Gulari, E. Effects of dissolved gas on viscoelastic scaling and glass transition temperature of polystyrene melts. Ind. Eng. Chem. Res. 2001, 40, 3048–3052. [Google Scholar] [CrossRef]
- Lee, M.; Park, C.B.; Tzoganakis, C. Measurements and modeling of PS/supercritical CO2 solution viscosities. Polym. Eng. Sci. 1999, 39, 99–109. [Google Scholar] [CrossRef]
- Gendron, R.; Daigneault, L.E.; Caron, L.M. Rheological behavior of mixtures of polystyrene with HCFC 142b and HFC 134a. J. Cell. Plast. 1999, 35, 221–246. [Google Scholar]
- Tatibouët, J. Investigating Foam Processing. In Thermoplastic Foam Processing: Principles and Development; Gendron, R., Ed.; CRC Press: Boca Raton, FL, USA, 2005; Chapter 5; pp. 192–234. [Google Scholar]
- Lee, S.-T. Foam Nucleation in Gas-Dispersed Polymeric Systems. In Foam Extrusion: Principles and Practice; Lee, S.-T., Ed.; CRC Press: Boca Raton, FL, USA, 2000; Chapter 4; pp. 81–124. [Google Scholar]
- Stange, J. Einfluss rheologischer Eigenschaften auf das Schäumverhalten von Polypropylenen unterschiedlicher molekularer Struktur. Ph.D. Dissertation, Friedrich-Alexander University, Erlangen-Nürnberg, Germany, 2006. [Google Scholar]
- Gunkel, F.; Spörrer, A.N.J.; Lim, G.T.; Bangarusampath, D.S.; Altstädt, V. Understanding melt rheology and foamability of polypropylene-based TPO blends. J. Cell. Plast. 2008, 44, 307–325. [Google Scholar] [CrossRef]
- Xanthos, M.; Yilmazer, U.; Dey, S.K.; Quintans, J. Melt viscoelasticity of polyethylene terephthalate resins for low density extrusion foaming. Polym. Eng. Sci. 2000, 40, 554–566. [Google Scholar] [CrossRef]
- Bergamaschi, E.; Smargiassi, A.; Mutti, A.; Franchini, I.; Lucchini, R. Immunological changes among workers occupationally exposed to styrene. Int. Arch. Occup. Environ. Health 1995, 67, 165–171. [Google Scholar]
- Guillemin, M.P.; Berode, M. Biological monitoring of styrene: A review. Am. Ind. Hyg. Assoc. J. 1988, 49, 497–505. [Google Scholar] [CrossRef]
- Anttila, A.; Bhat, R.V.; Bond, J.A.; Borghoff, S.J.; Bosch, F.X.; Carlson, G.P.; Castegnaro, M.; Cruzan, G.; Gelderblom, W.C.A.; Hass, U.; et al. Styrene. In IARC Monographs on the Evaluation of Carcinogenic Risks to Humans: Some Traditional Herbal Medicines, Some Mycotoxins, Naphthalene and Styrene; International Agency for Research on Cancer (IARC) Press: Lyon, France, 2002; Volume 82, pp. 437–550. [Google Scholar]
- Cherry, N.; Gautrin, D. Neurotoxic effects of styrene: Further evidence. Br. J. Ind. Med. 1990, 47, 29–37. [Google Scholar]
- Edgar, K.J.; Buchanan, C.M.; Debenham, J.S.; Rundquist, P.A.; Seiler, B.D.; Shelton, M.C.; Tindall, D. Advances in cellulose ester performance and applications. Prog. Polym. Sci. 2001, 26, 1605–1688. [Google Scholar] [CrossRef]
- Mohanty, A.K.; Wibowo, A.; Misra, M.; Drzal, L.T. Development of renewable resource-based cellulose acetate bioplastics: Effect of process engineering on the performance of cellulosic plastics. Polym. Eng. Sci. 2003, 43, 1151–1161. [Google Scholar] [CrossRef]
- Wypych, G. Plasticizers Use and Selection for Specific Polymers. In Handbook of Plasticizers; Wypych, G., Ed.; ChemTec Publishing: Toronto, Canada, 2004; Chapter 11; pp. 273–379. [Google Scholar]
- Fridman, O.A.; Sorokina, A.V. Criteria of efficiency of cellulose acetate plasticization. Polym. Sci. B 2006, 48, 233–236. [Google Scholar]
- Zepnik, S.; Kabasci, S.; Radusch, H.-J.; Wodke, T. Influence of external plasticization on rheological and thermal properties of cellulose acetate with respect to its foamability. J. Mater. Sci. Eng. A 2012, 2, 152–163. [Google Scholar]
- Das, M. Effect of screw speed and plasticizer on the torque requirement in single screw extrusion of starch based plastics and their mechanical properties. Indian J. Chem. Technol. 2008, 15, 555–559. [Google Scholar]
- Jiugao, Y.; Ning, W.; Xiaofei, M. The effects of citric acid on the properties of thermoplastic starch plasticized by glycerol. Starch/Stärke 2005, 57, 494–504. [Google Scholar]
- Shah, B.L.; Shertukde, V.V. Effect of plasticizers on mechanical, electrical, permanence, and thermal properties of poly(vinyl chloride). J. Appl. Polym. Sci. 2003, 90, 3278–3284. [Google Scholar] [CrossRef]
- Gil, N.; Negulescu, I.; Saska, M. Evaluation of the effects of bio-based plasticizers on thermal and mechanical properties of poly(vinyl-chloride). J. Appl. Polym. Sci. 2006, 102, 1366–1373. [Google Scholar] [CrossRef]
- Marcilla, A.; Beltrán, M. Mechanisms of Plasticizers Action. In Handbook of Plasticizers; Wypych, G., Ed.; ChemTec Publishing: Toronto, Canada, 2004; Chapter 5; pp. 107–120. [Google Scholar]
- Qian, J.W.; Rudin, A.; Teh, J.W. Effects of plasticizer on shear modification of polystyrene. Polym. Int. 1991, 24, 165–171. [Google Scholar] [CrossRef]
- Ghanbarzadeh, B.; Oromiehie, A.; Musavi, M.; Razmi, E.; Milani, J. Effect of polyolic plasticizers on rheological and thermal properties of zein resins. Iran. Polym. J. 2006, 15, 779–787. [Google Scholar]
- Sungsanit, K.; Kao, N.; Bhattacharya, S.N.; Pivsaart, S. Physical and rheological properties of plasticized linear and branched PLA. Korea-Aust. Rheol. J. 2010, 22, 187–195. [Google Scholar]
- Lin, C.-A.; Ku, T.-H. Shear and elongational flow properties of thermoplastic polyvinyl alcohol melts with different plasticizer contents and degrees of polymerization. J. Mater. Process. Technol. 2008, 200, 331–338. [Google Scholar] [CrossRef]
- Hansen, C.M. Hansen Solubility Parameters: A User’s Handbook, 2nd ed.; CRC Press: Boca Raton, FL, USA, 2007. [Google Scholar]
- Villmow, T.; Kretzschmar, B.; Pötschke, P. Influence of screw configuration, residence time, and specific mechanical energy in twin-screw extrusion of polycaprolactone/multi-walled carbon nanotube composites. Compos. Sci. Technol. 2010, 70, 2045–2055. [Google Scholar] [CrossRef]
- Wagner, M.H.; Bernnat, A.; Schulze, V. The rheology of the rheotens test. J. Rheol. 1998, 42, 917–928. [Google Scholar] [CrossRef]
- Muke, S.; Ivanov, I.; Kao, N.; Bhattacharya, S.N. The melt extensibility of polypropylene. Polym. Int. 2001, 50, 515–523. [Google Scholar] [CrossRef]
- Kao, N.; Chandra, A.; Bhattacharya, S. Melt strength of calcium carbonate filled polypropylene melts. Polym. Int. 2002, 51, 1385–1389. [Google Scholar] [CrossRef]
- Spoerrer, N.J.; Bangarusampath, D.S.; Altstädt, V. The Challenge of Foam Injection-Moulding Possibilities to Improve Surface Appearance, Foam Morphology and Mechanical Properties. In Proceedings of the 9th International Conference on Blowing Agents and Foaming Processes, Frankfurt, Germany, 22–23 May 2007. Paper 16.
- Bernnat, A. Polymer Melt Rheology and the Rheotens Test. Ph.D. Dissertation, University of Stuttgart, Stuttgart, Germany, 2001. [Google Scholar]
- Stadlbauer, M.; Folland, R.; DeMink, P. Extruded Polyolefin for the Manufacture of Cellular Material. Eur. Pat. 1816158 A1, 8 August 2007. [Google Scholar]
- Mitrus, M. Changes of specific mechanical energy during extrusion cooking of thermoplastic starch. TEKA Kom. Mot. Energ. Roln. 2005, 5, 152–157. [Google Scholar]
- Van der Burgt, M.C.; van der Woude, M.E.; Janssen, L.P.B.M. The influence of plasticizer on extruded thermoplastic starch. J. Vinyl Addit. Technol. 1996, 2, 170–174. [Google Scholar] [CrossRef]
- Guerrero, P.; Beatty, E.; Kerry, J.P.; de la Caba, K. Extrusion of soy protein with gelatin and sugars at low moisture content. J. Food Eng. 2012, 110, 53–59. [Google Scholar] [CrossRef]
- Gerhardt, L.J.; Manke, C.W.; Gulari, E. Rheology of polydimethylsiloxane swollen with supercritical carbon dioxide. J. Polym. Sci. B Polym. Phys. 1997, 35, 523–534. [Google Scholar] [CrossRef]
- Dealy, J.M.; Larson, R.G. Structure and Rheology of Molten Polymers: From Structure to Flow Behavior and Back Again; Hanser Publishers: Munich, Germany, 2006; pp. 329–413. [Google Scholar]
- Sungsanit, K. Rheological and Mechanical Behaviour of Poly(lactic acid)/Polyethylene Glycol Blends. Ph.D. Dissertation, RMIT University, Melbourne, Australia, 2011. [Google Scholar]
- Lau, H.C.; Bhattacharya, S.N.; Field, G.J. Melt strength of polypropylene: Its relevance to thermoforming. Polym. Eng. Sci. 1998, 38, 1915–1923. [Google Scholar]
- Steffl, T. Rheological and Film Blowing Properties of Various Low Density Polyethylenes and Their Blends. Ph.D. Dissertation, Friedrich-Alexander University, Erlangen-Nürnberg, Germany, 2004. [Google Scholar]
© 2013 by the authors; licensee MDPI, Basel, Switzerland. This article is an open access article distributed under the terms and conditions of the Creative Commons Attribution license (http://creativecommons.org/licenses/by/3.0/).
Share and Cite
Zepnik, S.; Kabasci, S.; Kopitzky, R.; Radusch, H.-J.; Wodke, T. Extensional Flow Properties of Externally Plasticized Cellulose Acetate: Influence of Plasticizer Content. Polymers 2013, 5, 873-889. https://doi.org/10.3390/polym5030873
Zepnik S, Kabasci S, Kopitzky R, Radusch H-J, Wodke T. Extensional Flow Properties of Externally Plasticized Cellulose Acetate: Influence of Plasticizer Content. Polymers. 2013; 5(3):873-889. https://doi.org/10.3390/polym5030873
Chicago/Turabian StyleZepnik, Stefan, Stephan Kabasci, Rodion Kopitzky, Hans-Joachim Radusch, and Thomas Wodke. 2013. "Extensional Flow Properties of Externally Plasticized Cellulose Acetate: Influence of Plasticizer Content" Polymers 5, no. 3: 873-889. https://doi.org/10.3390/polym5030873