Review

Peculiarities in the Director Reorientation and the NMR Spectra Evolution in a Nematic Liquid Crystals under the Effect of Crossed Electric and Magnetic Fields

1
Saint Petersburg Institute for Machine Sciences, The Russian Academy of Sciences, Saint Petersburg 199178, Russia
2
Poznan University of Economics and Business, Department of Mathematical Economics, Al. Niepodleglosci 10, 61-875 Poznan, Poland
*
Author to whom correspondence should be addressed.
Crystals 2019, 9(5), 262; https://doi.org/10.3390/cryst9050262
Submission received: 6 May 2019 / Revised: 14 May 2019 / Accepted: 15 May 2019 / Published: 20 May 2019
(This article belongs to the Special Issue Nuclear Magnetic Resonance of Liquid Crystals)

Abstract

:
The illustrative description of the field-induced peculiarities of the director reorientation in the microsized nematic volumes under the effect of crossed magnetic B and electric E fields have been proposed. The most interesting feature of such configuration is that the nematic phase becomes unstable after applying the strong E . The theoretical analysis of the reorientational dynamics of the director field provides an evidence for the appearance of the spatially periodic patterns in response to applied large E directed at an angle α to B . The feature of this approach is that the periodic distortions arise spontaneously from a homogeneously aligned nematic sample that ultimately induces a faster response than in the uniform mode. The nonuniform rotational modes involve additional internal elastic distortions of the conservative nematic system and, as a result, these deformations decrease of the viscous contribution U vis to the total energy U of the nematic phase. In turn, that decreasing of U vis leads to decrease of the effective rotational viscosity coefficient γ eff ( α ) . That is, a lower value of γ eff ( α ) , which is less than one in the bulk nematic phase, gives the less relaxation time τ on ( α ) γ eff ( α ) , when α is bigger than the threshold value α th . The results obtained by Deuterium NMR spectroscopy confirm theoretically obtained dependencies of τ on ( α ) on α .
PACS:
61.30.Cz; 65.40.De

1. Introduction

Liquid crystal (LC) materials have been referred to as a curious soft matter, but their impact on current technology is very impressive. The original technological revolution brought by these LC materials has been in the field of displays. The nature of the orientational relaxation process of the director field n ^ to its equilibrium orientation n ^ eq in a microsized nematic liquid crystal volume, which is subjected to crossed magnetic B and electric E fields has been investigated both experimentally and theoretically. The theoretical analysis is based on the hydrodynamic theory including both the director motion and fluid flow, with appropriate boundary and initial conditions, whereas the experimental progress in understanding both the structural and dynamic properties of LC materials is based on the nuclear magnetic resonance ( NMR ) spectroscopy [1,2,3,4]. Recently, the time-resolved deuterium NMR spectroscopic measurements of field-induced director reorientations have been performed [1,2,3,4,5,6,7,8,9,10,11,12,13,14,15,16]. Taking into account that the quadrupolar splitting is related to the angle α made by the director n with the magnetic field B (see Figure 1a), deuterium NMR spectroscopy is found to be a powerful method to investigate the dynamic director reorientation in nematic films. When, for instance, the deuterated 4 α , α d 2 p e n t y l 4 c y a n o b i p h e n y l ( 5 CB - d 2 ) is subjected to crossed magnetic B and electric E fields, a set of the time-resolved NMR spectra can be recorded during both the turned-on and turned-off processes. When the large electric field E is turned-on at an angle α to B , the director moves from being parallel to B to being parallel to E (the turned-on process), with the relaxation time τ ON . After removing of E , the director relaxes back to being parallel to B (the turned-off process), with the relaxation time τ OFF . Results of these deuterium NMR measurements show that at the certain balance between E and B , the values of τ ON ( α ) monotonically increase with increasing of the angle α , up to the maximum value τ ON ( max ) [4,11]. With further growth of α , up to the right angle ( α π 2 ), τ ON ( α π 2 ) rapidly decreases with a few milliseconds with respect to τ ON ( max ) [4,11]. Analysis of these experimental results, based on the predictions of hydrodynamic theory including both the director motion and fluid flow, provides an evidence that at the certain balance between E and B , in such nematic material, in response to the suddenly applied E at the angles α > 60 , the spatially periodic patterns in the initially homogeneously aligned nematic domains may appear. These nonuniform rotational modes involve additional internal elastic distortions of the conservative nematic system and, as a result, these deformations decrease the viscous contribution U vis to the total energy of the nematic phase. In turn that decreasing of U vis leads to decrease the effective rotational viscosity coefficient γ eff ( α ) and gives a faster response of the director rotation than for a uniform mode, as observed in NMR experiment [4].
In this article, we describe the field-induced peculiarities of the director reorientation in the microsized nematic volumes under the effect of crossed magnetic B and electric E fields. The most interesting feature of such configuration is that the state of the nematic system becomes unstable after applying the large (∼1 V/ μ m) electric field. When the misalignment of the director with respect to the direction imposed by the aligning magnetic field is due to the thermal fluctuations with small amplitudes, the reorientation caused by the strong E manifests itself by the growing of one particular Fourier mode. In this case, the spectral line shape characterizing the initially aligned nematic sample broadens with time-dependent splitting while the initial steady doublet with constant splitting progressively vanishes [4,11]. In this case the application of the large E gives rise to the appearance of new doublet with vanishing amplitude that progressively grows with constant splitting so that the total spectral intensity is transferred from the initial doublet to the new one, with half the quadrupolar splitting. These results strongly suggest that the initial state is not homogeneous and perturbed by thermal fluctuations. It is, therefore, necessary to analyze the nematic response to an initial state exhibiting some thermal fluctuations of the director under the influence of the strong electric field. Since anomalous changes of the spectral line shapes do not give any information about the average director orientation, the additional numerical investigations of the system that include both the director reorientation and fluid flow should be done.
The understanding of how both the crossed E and B and confinement influence the orientational dynamics of the nematic films has relevance for several different areas of applied physics and material science.
The layout of this article is as follows. In the next section we give the theoretical background to the orientational dynamics of the nematics under the effect of the crossed electric and magnetic fields. The experimental deuterium NMR study are described in Section 2.1. The field-induced peculiarities in the dynamics of the director reorientation in confined nematic liquid crystals, both in the linear and nonlinear approaches, are given in Section 2.2. The results for the simulation of the time-resolved 2 H spectra are described in Section 2.2. Our conclusions are given in Section 3.
Parts of this review contain extracts and adapted material from some of our previous primary publications, which have been cited in figure captions and in the text (American Physical Society [11,17] and Elsevier [18,19]).

2. Theoretical Treatment of the Orientational Dynamics of Nematics under the Effect of the Crossed Electric and Magnetic Fields

The aim of this section is to show some useful routes not only for further examining of the validity of theoretical treatment of the orientational dynamics in the microsized nematic volume under the effect of crossed electric and magnetic fields, but also for analyzing the NMR spectra evolution in these nematics. The theoretical analysis of the reorientational dynamics of nematic LCs based on continuum theory have been carried out to complement the existing NMR spectroscopy experiments. This analysis together with time-resolved and time-averaged NMR spectroscopy allows us to describe with high accuracy the relaxation processes in thin nematic film in response to application or removing of the electric field. In this section, we illustrate how the field-induced dynamic director reorientation in thin nematic film under the influence of crossed electric and magnetic fields can be described in the framework of the hydrodynamic theory which includes both the director motion and the fluid flow.

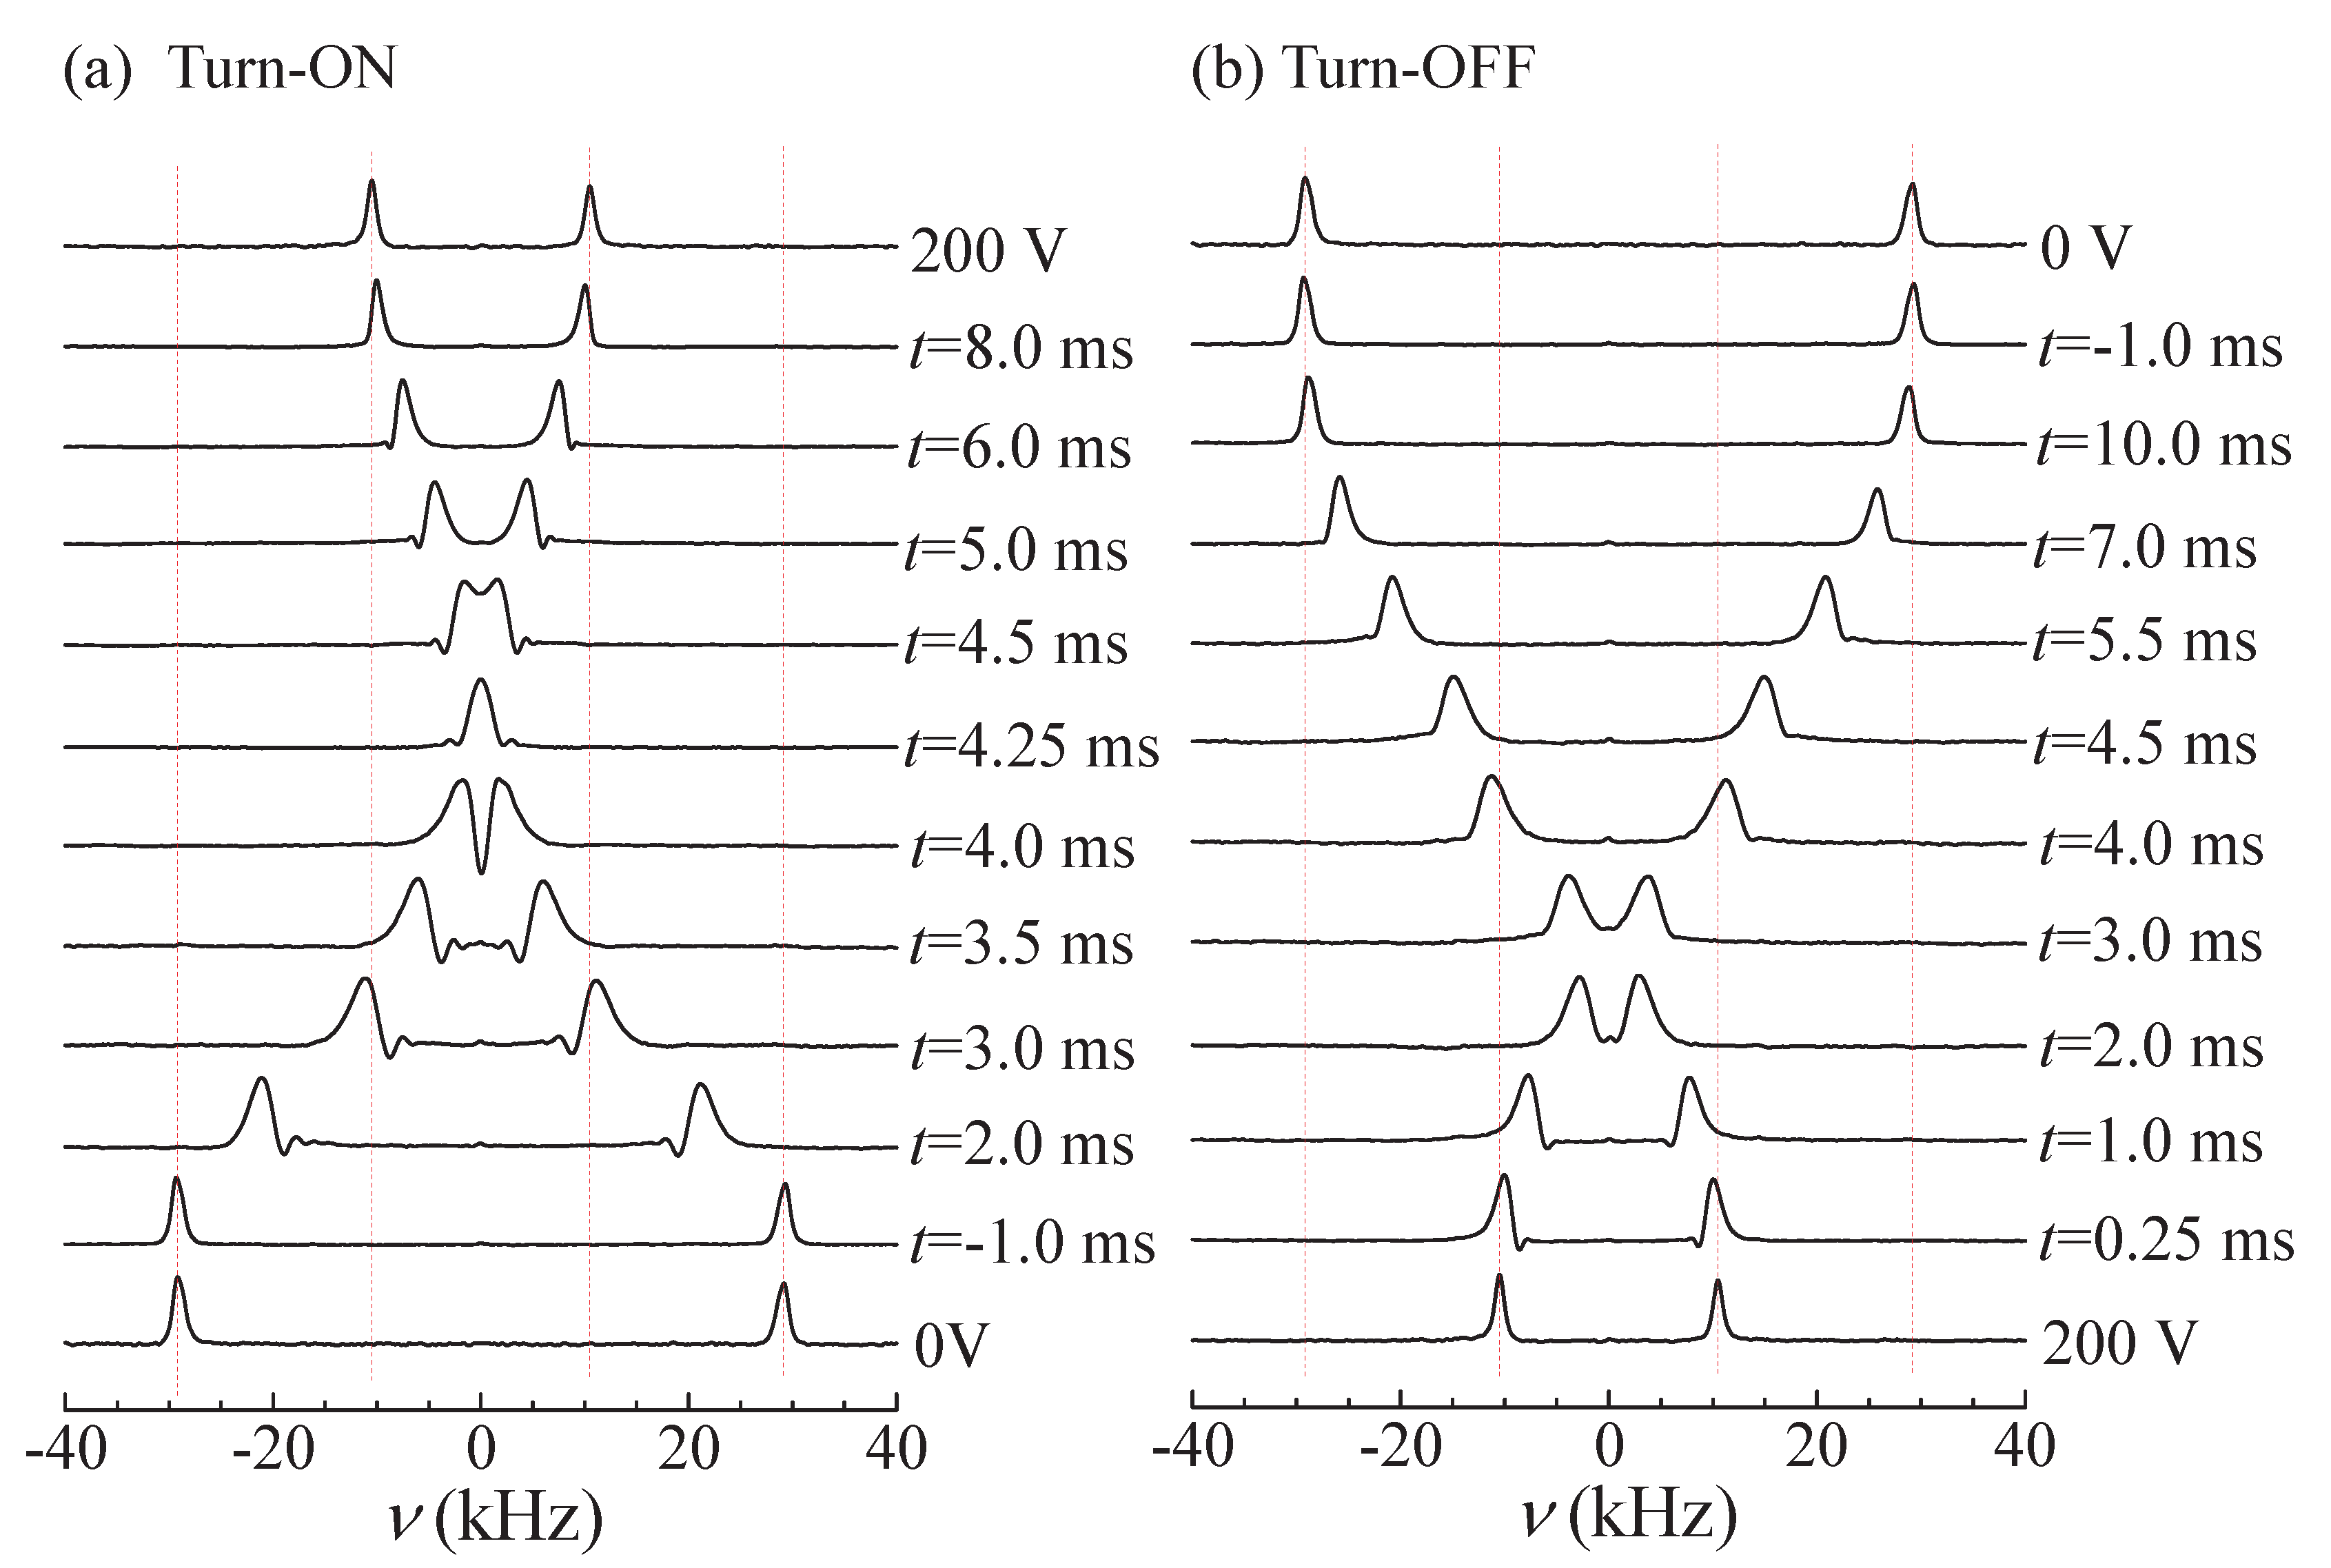
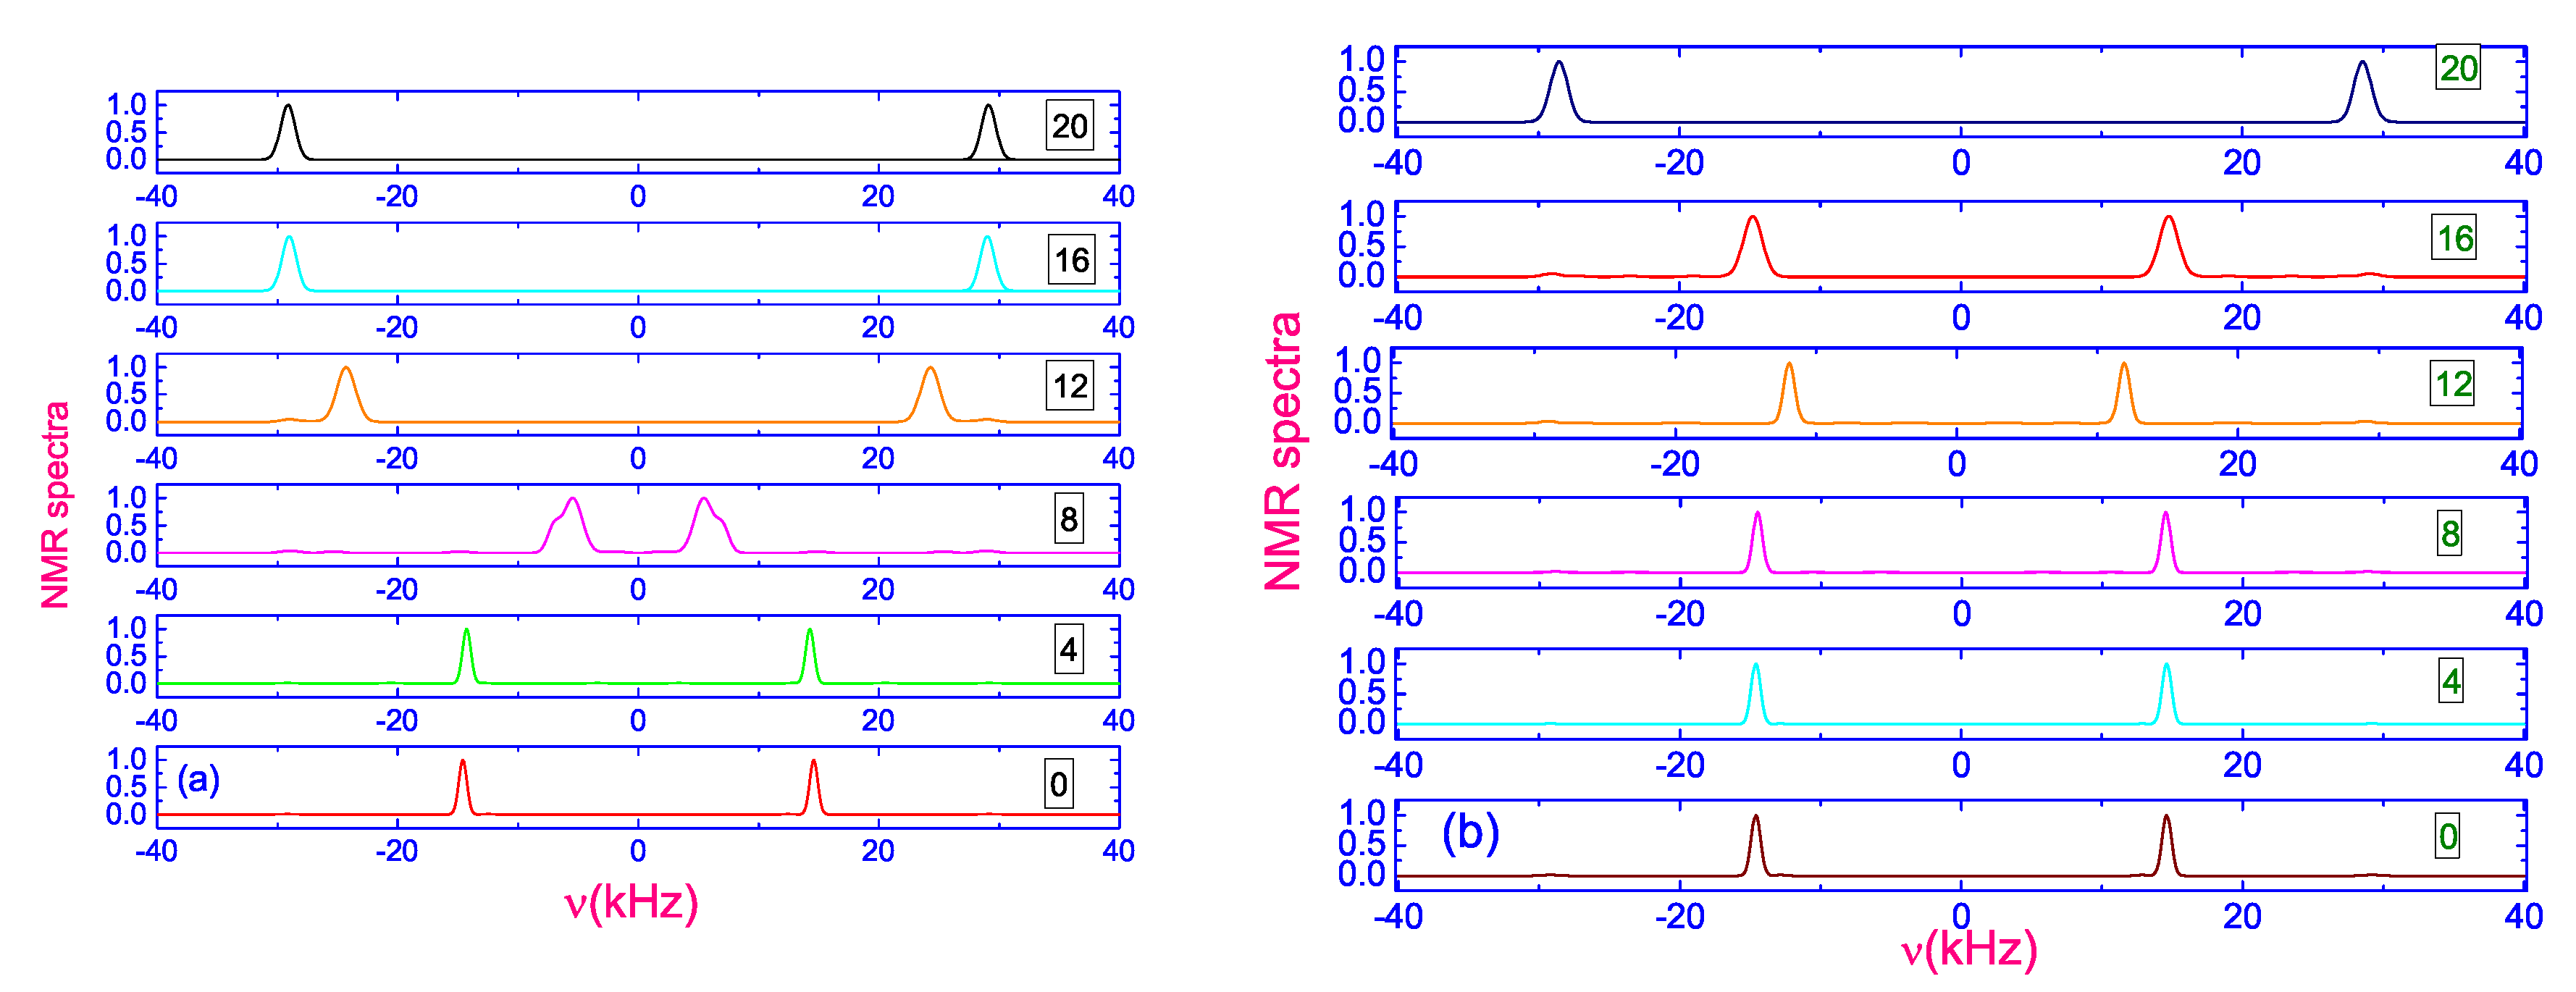
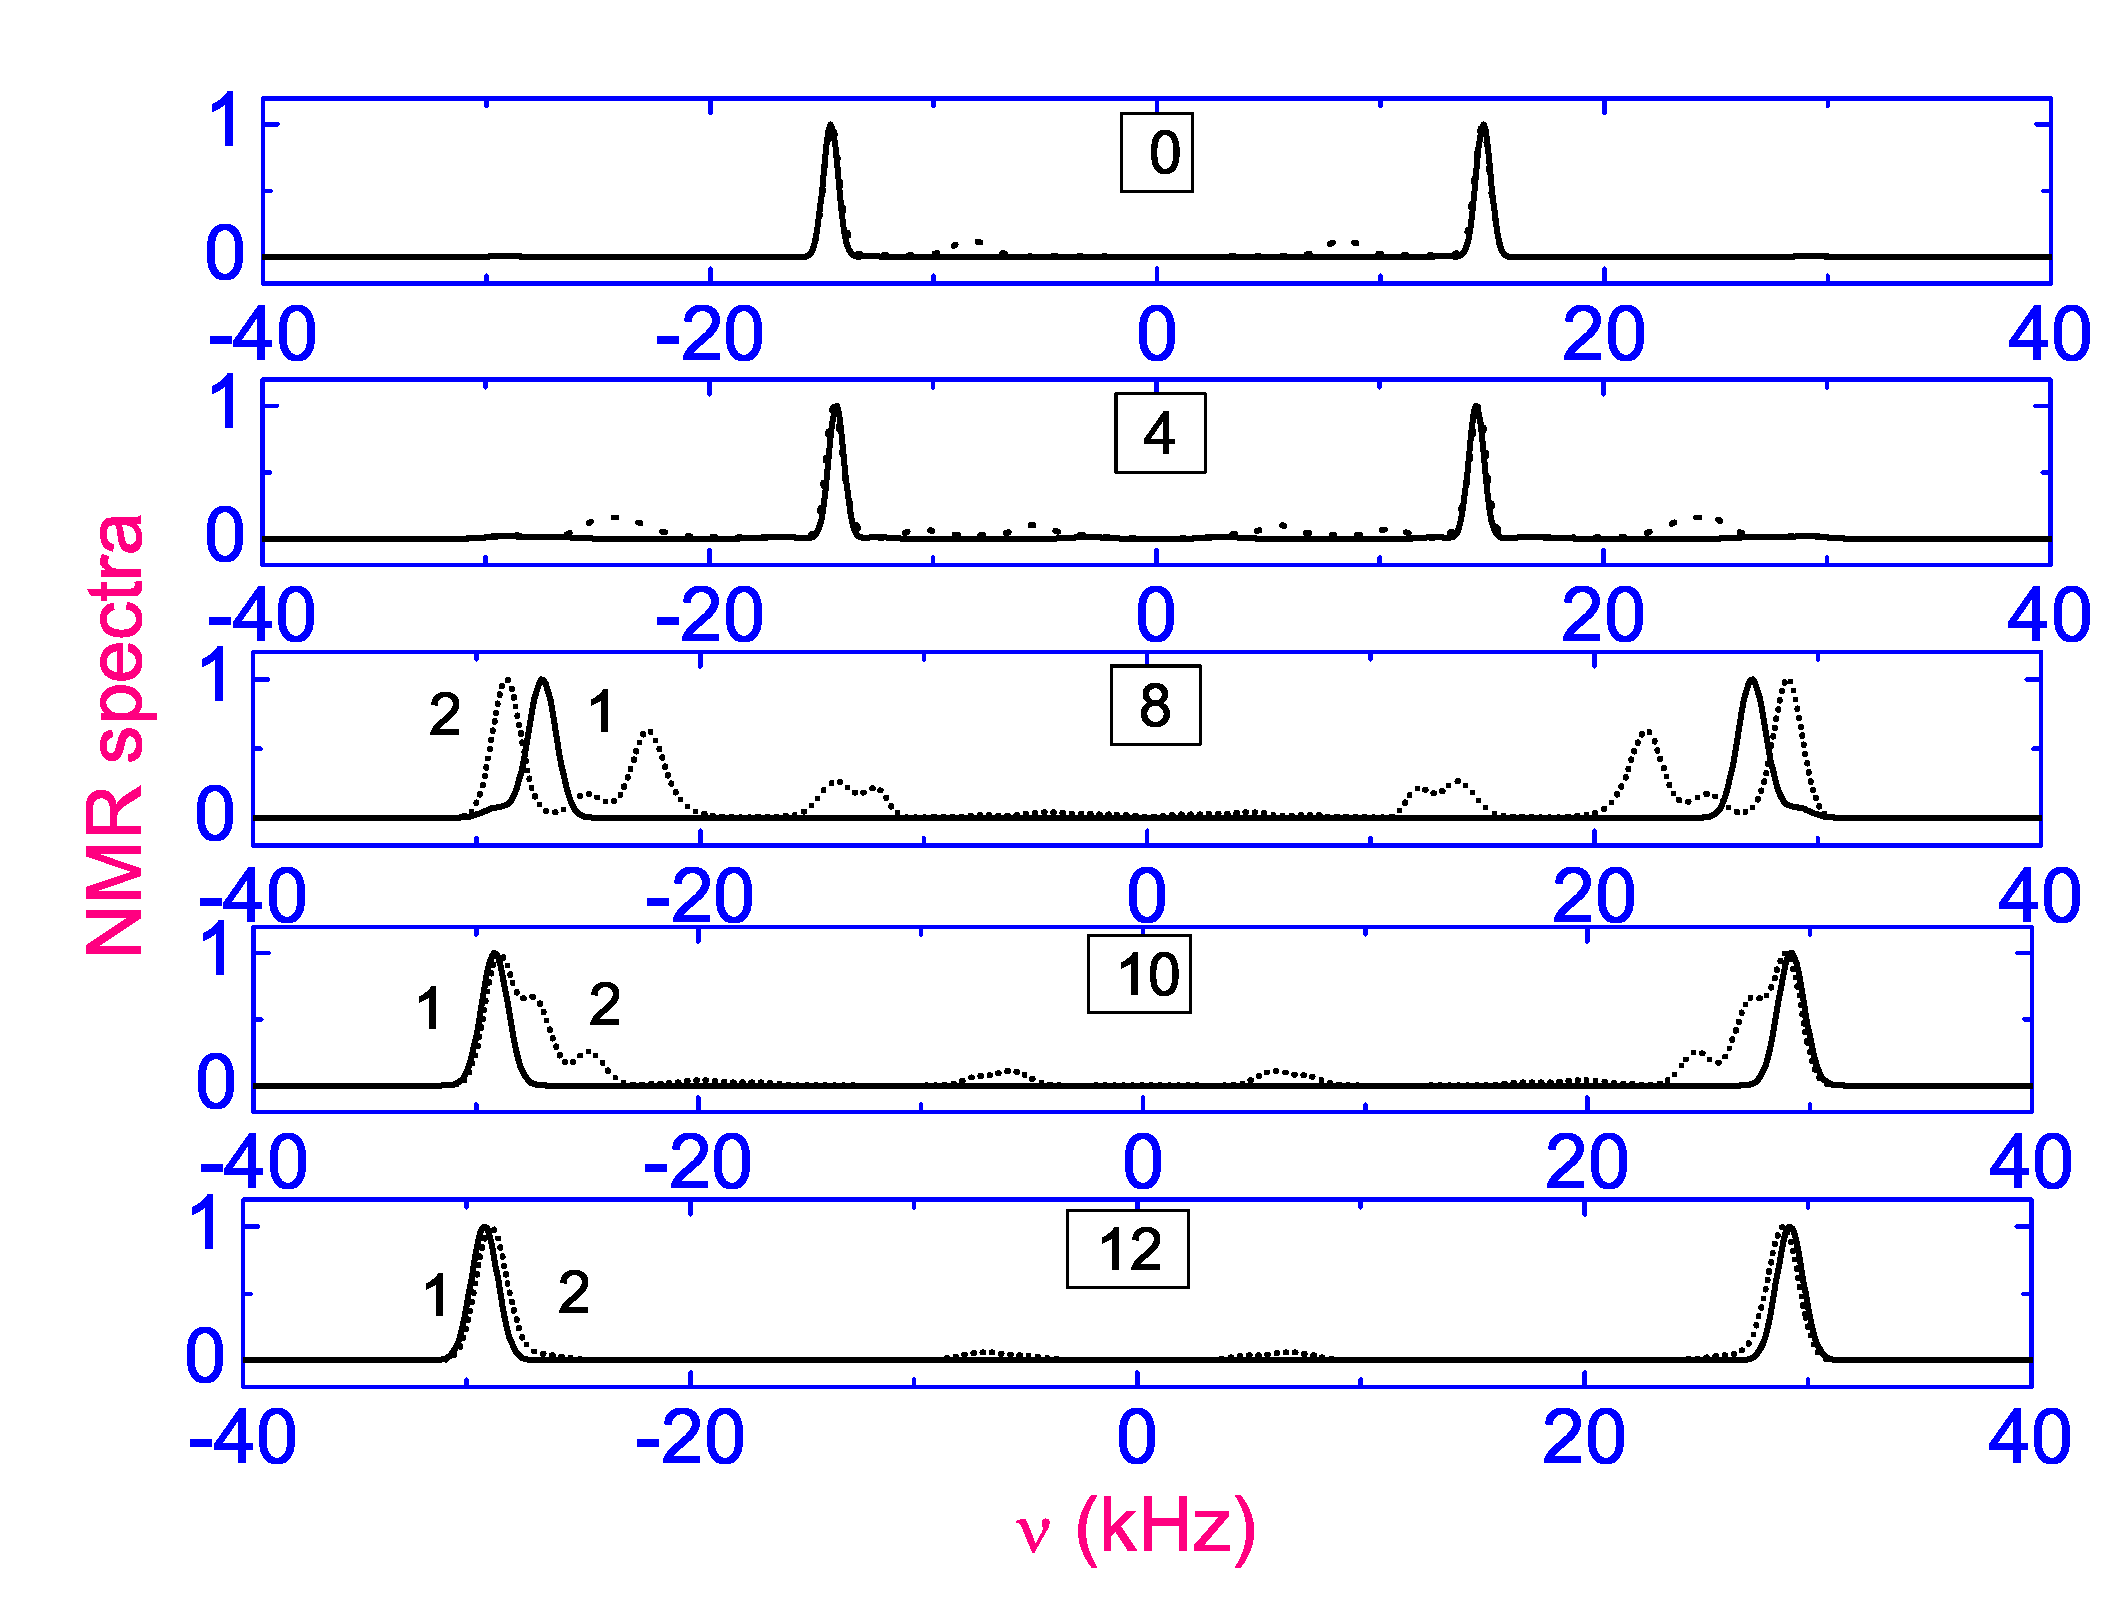
2.1. Deuterium Nuclear Magnetic Resonance Study

The dependence of the quadrupolar splitting Δ ν ( θ ) on the angle θ made by the director n ^ with the magnetic field B of the NMR spectrometer is given by
Δ ν ( θ ) = Δ ν 0 P 2 ( cos θ ) ,
where Δ ν 0 is the splitting when n ^ is parallel to B and P 2 ( cos θ ) is the second Legendre polynomial. After applying or removing the electric field E , the director n ^ orientation is moving in the plane defined by B and E . Thus, the value of the angle θ can be determined directly from Equation (1), by measuring the quadrupolar splittings, Δ ν ( θ ) and Δ ν 0 (see Figure 2). When the director moves from being parallel to B , the splitting is decreased, pass through zero at the magic angle ( θ mag = 54 . 74 ) and then to increase to one half of Δ ν 0 , when the director is parallel to E . As an example, a set of the time-resolved NMR spectra of 5CB- d 2 recorded during the turned-on and turned-off processes for α = 79 . 7 [4,11] are shown in Figure 3a,b, respectively. In the turned-on process, the spectral intensity is transferred from the initial doublet Δ ν 0 to new Δ ν ( θ ) , with half the quadrupolar splitting with time after about 10 ms. In the turned-off process the Δ ν ( θ ) increases because the director moves from being at θ = 71 . 9 to 0, i.e., to being parallel to B . In turn, the time resolved deuterium NMR spectra give the time dependent function for the quadrupolar splitting frequency Δ ν ( θ ) / Δ ν 0 . Such ratios and Equation (1) give the director orientation as a function of time during the turned-on and turned-off processes at each angle α [4,11], as shown by the symbols in Figure 3a,b, respectively. Figure 3a shows that in the case of turned-on process the director rotates from the initial angle θ 0 = 0 and then aligns at the limiting angle θ , whereas in the case of turned-off process, the director rotates back parallel to the magnetic field B (shown in Figure 3b). In the later case, the relaxation time τ OFF is less than in the turned-on process.
By fitting the ratio of the quadrupolar splitting frequencies Δ ν ( θ ) / Δ ν 0 as a function of time and using the Equation (1), one can estimate the relaxation times τ ON ( α ) and τ OFF ( α ) at each angle α . Figure 4 (solid curves) shows the time dependent functions τ ON ( α ) = τ M / 1 + 2 ρ cos 2 α + ρ 2 and τ OFF ( α ) = γ 1 / U M , obtained from the torque balance equation for a monodomain nematic [4]. Here ρ = U E / U M is the ratio of the anisotropic electric and magnetic energies, respectively, whereas γ 1 is the rotational viscosity coefficient. Also the angle α dependent functions τ ON ( α ) and τ OFF ( α ) (both open and closed circles) [4,11], obtained from the best fits in Figure 3a,b, respectively, are shown in Figure 4. It is also apparent that when α tends to 90 , the angle α dependence of τ ON ( α ) is deviated from the theoretical curve obtained from the torque balance equation for a monodomain nematic and starts to decrease. When the values of the angle α are larger than about 80 , then the spectral line shape recorded with time shows the broadening and the director distribution is no longer monodomain. In turn, when the values of α is larger than 89 , the NMR spectra recorded during the relaxation of the director distribution show the spectra change to powderlike spectral line shapes. Because the anomalous changes of the spectral line shapes do not give any information about the average director orientation, the experimental results discussed in this section has been limited to a region, with uniform director orientation. Thus, the experimental explanation of the nonuniform director reorientation under the effect of crossed magnetic B and electric E fields is beyond the scope of the present subject and were discussed elsewhere. Dynamical peculiarities observed during the director reorientation in the microsized nematic volume subjected to strong electric field may be caused by the appearance of stripes in the nematic sample. In the next section the theoretical analysis of the nonuniform director reorientation in response to suddenly applied E will be discussed. The feature of this theoretical approach is that the periodic distortions, in response to suddenly applied E , arise spontaneously from a homogeneously aligned nematic sample that ultimately induces a faster response than in the uniform mode. The nonuniform rotational modes involve additional internal elastic distortions of the conservative nematic system and, as a result, these deformations decrease the viscous contribution U vis to the total energy U of the nematic phase. In turn, that decreasing of U vis leads to decrease of the effective rotational viscosity coefficient γ eff ( α ) . That is, a lower value of γ eff ( α ) , which is less than one in the bulk nematic phase, gives the less relaxation time τ on ( α ) γ eff ( α ) , when α is bigger than the threshold value α th .

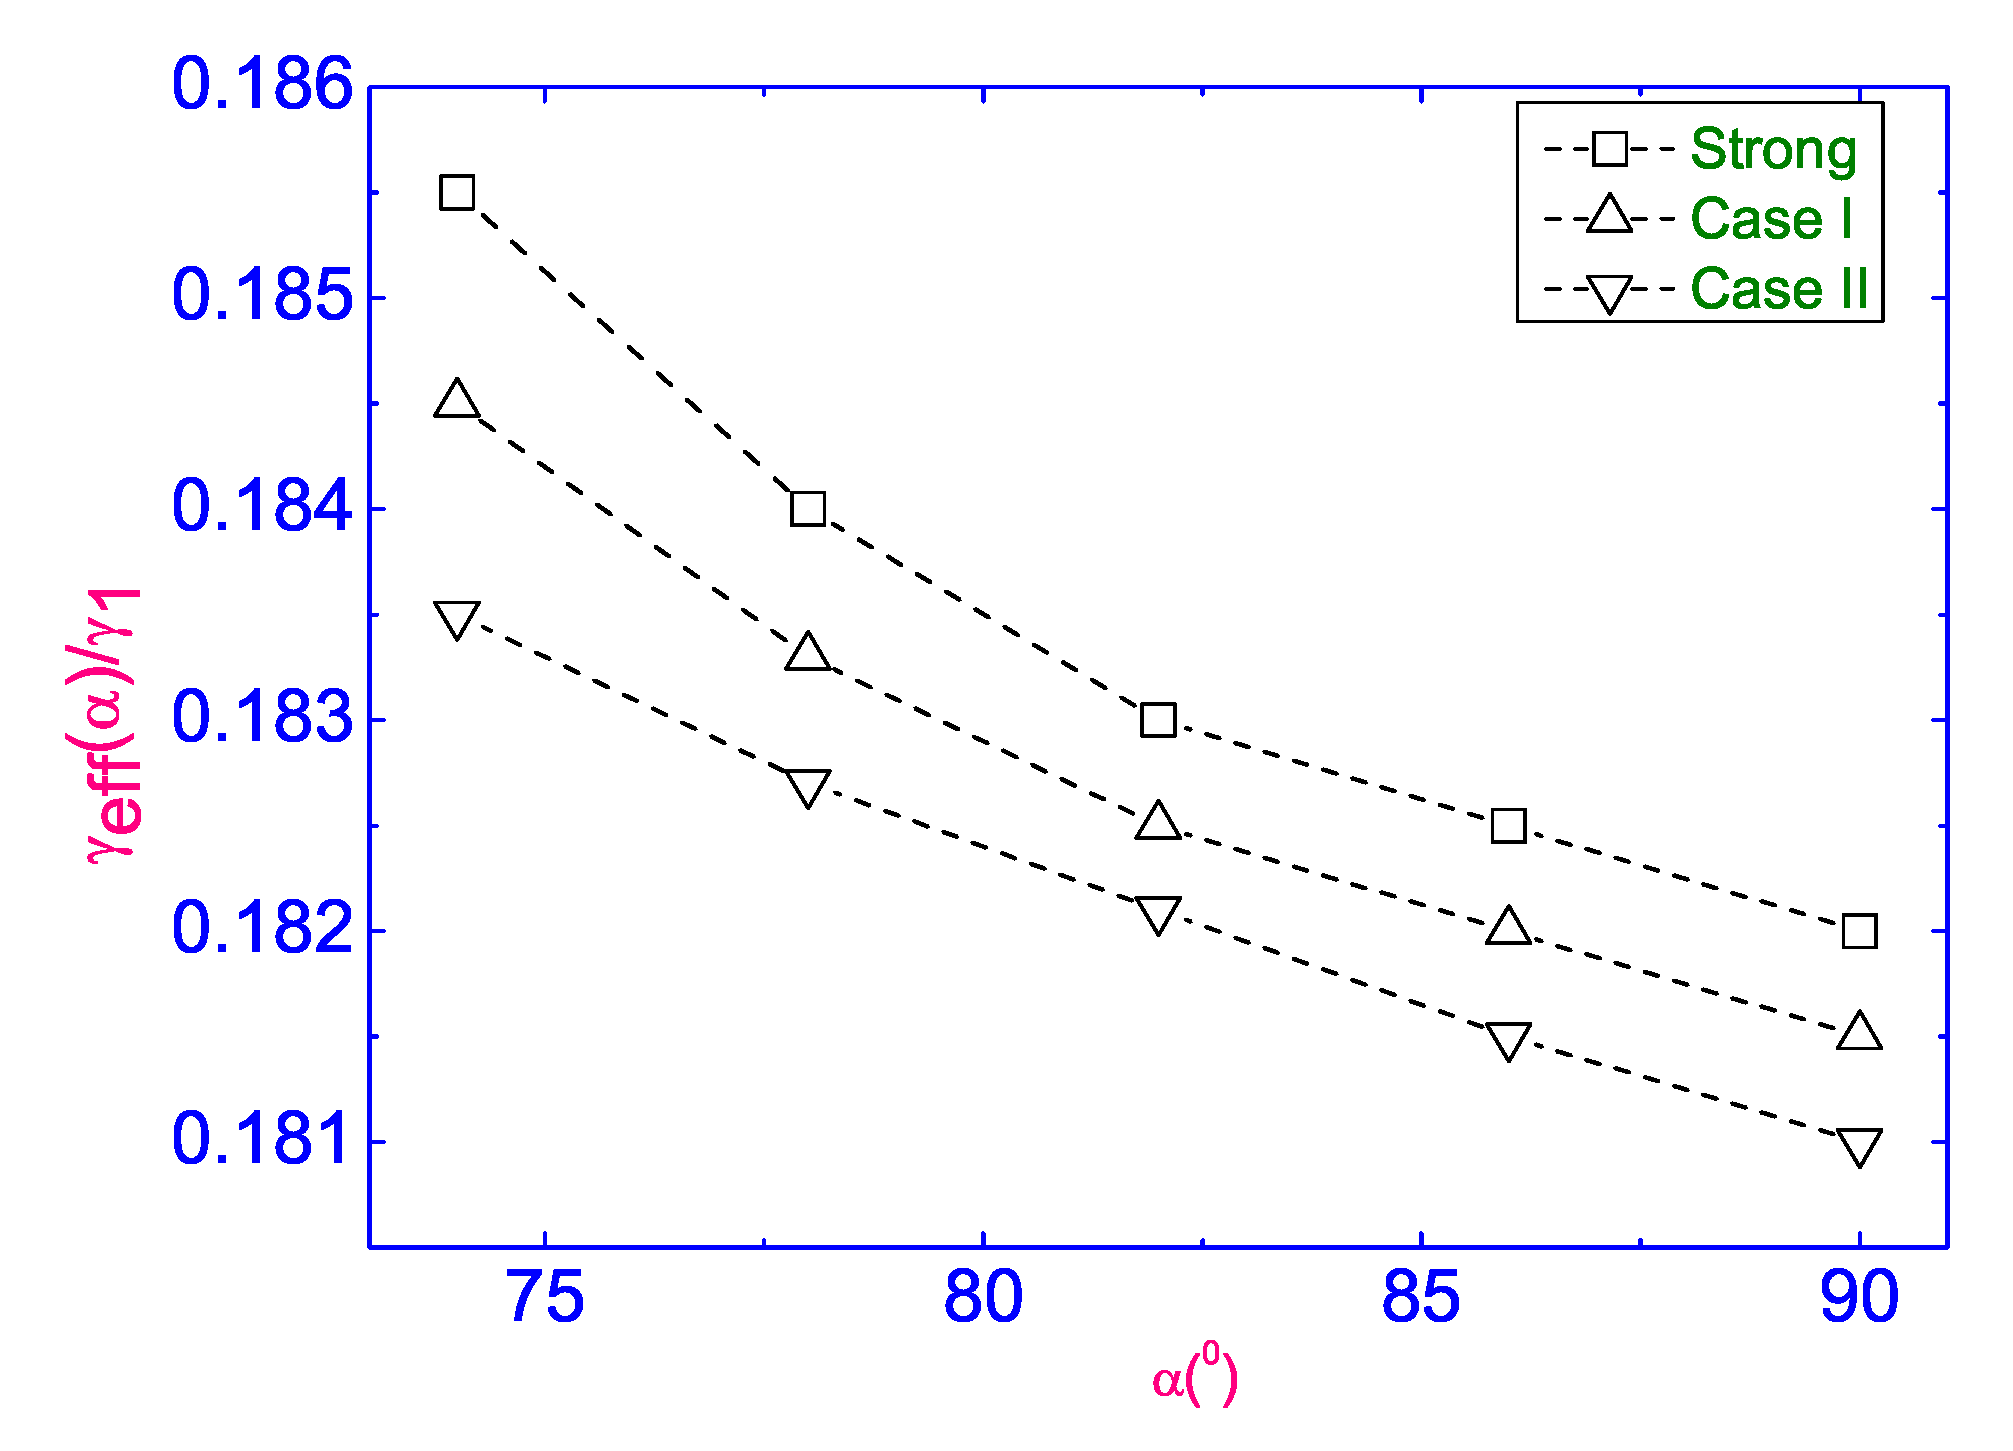
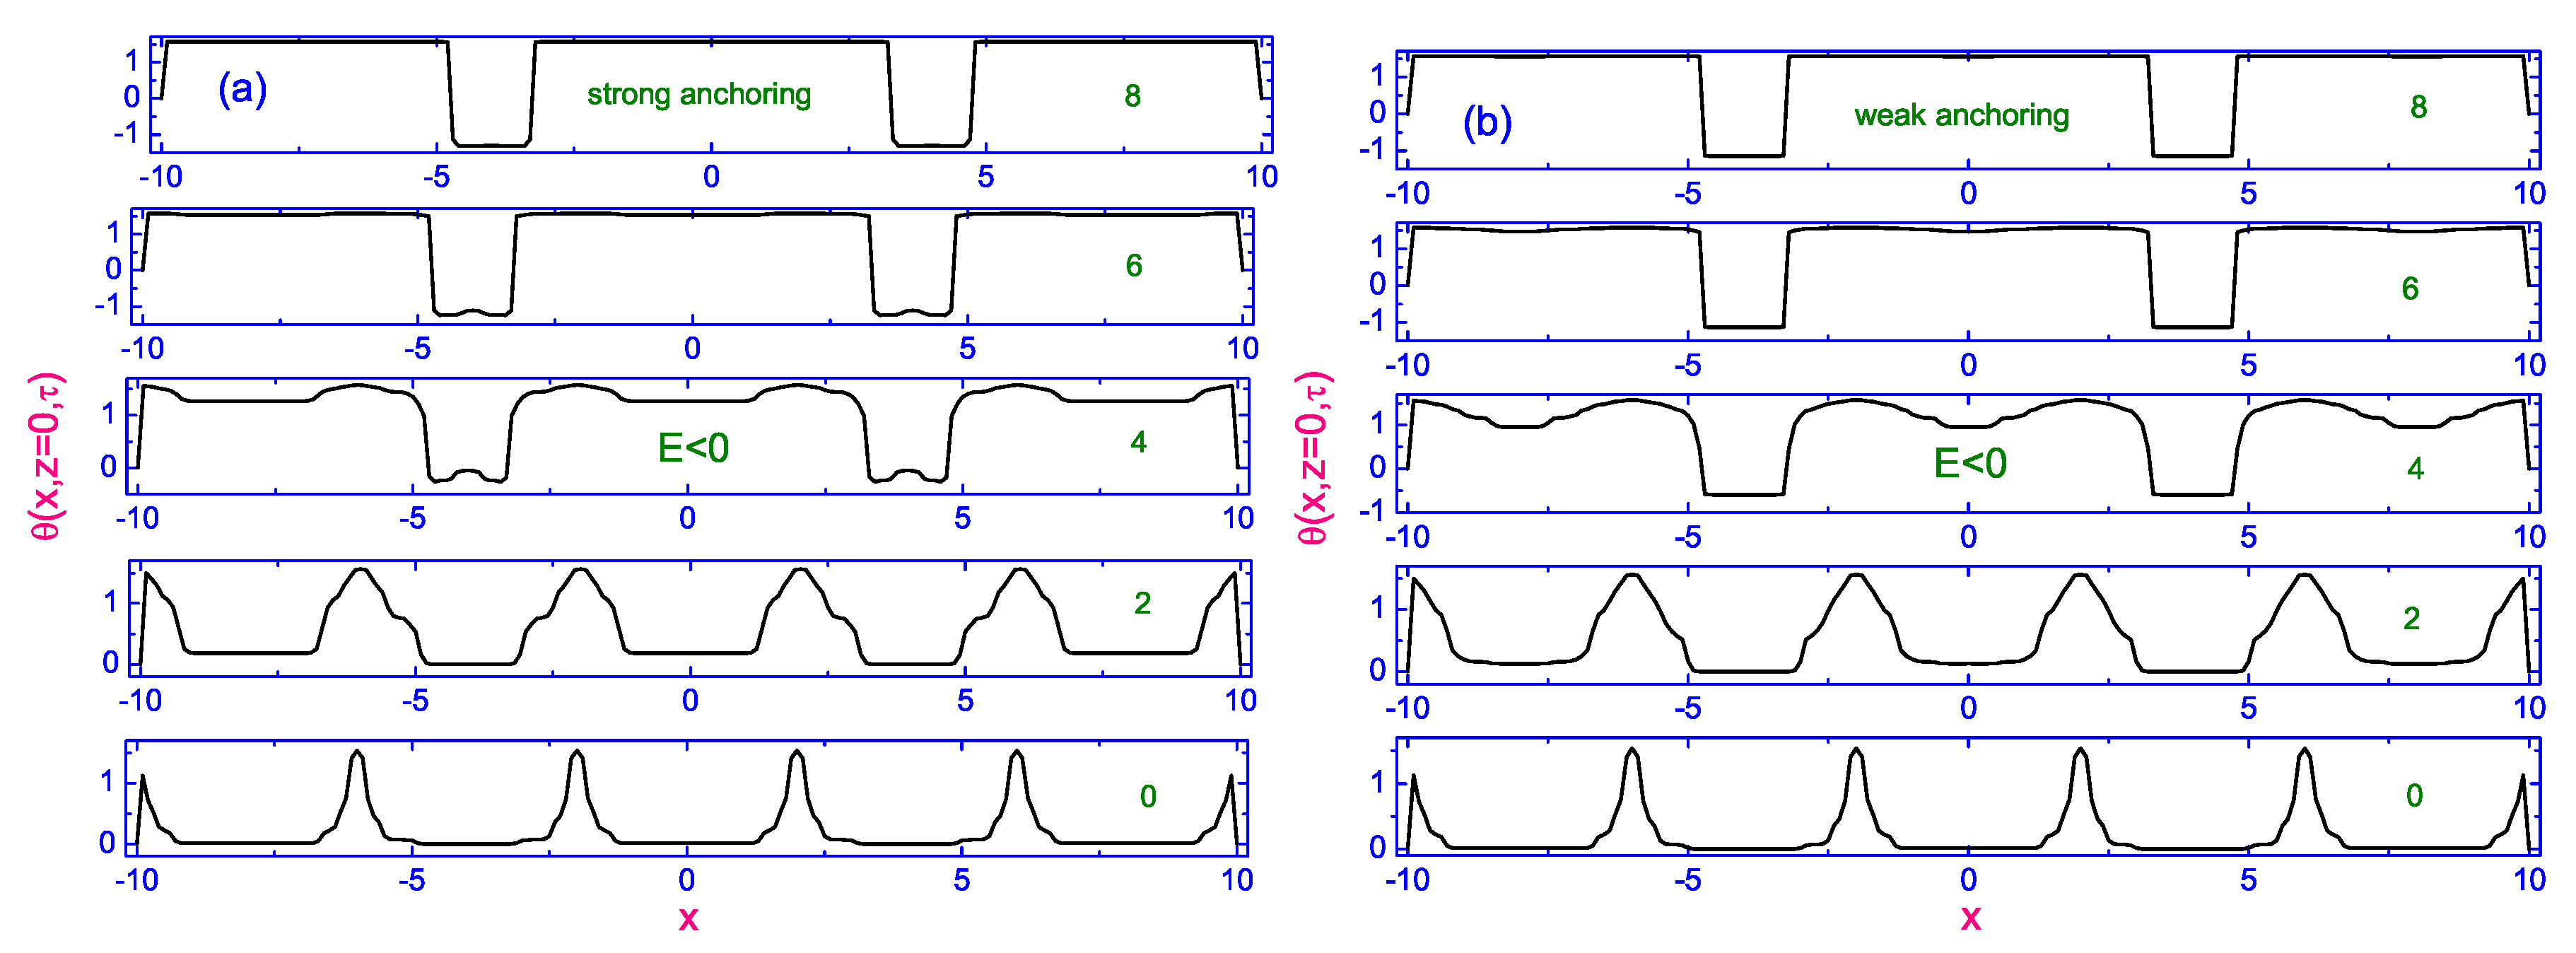
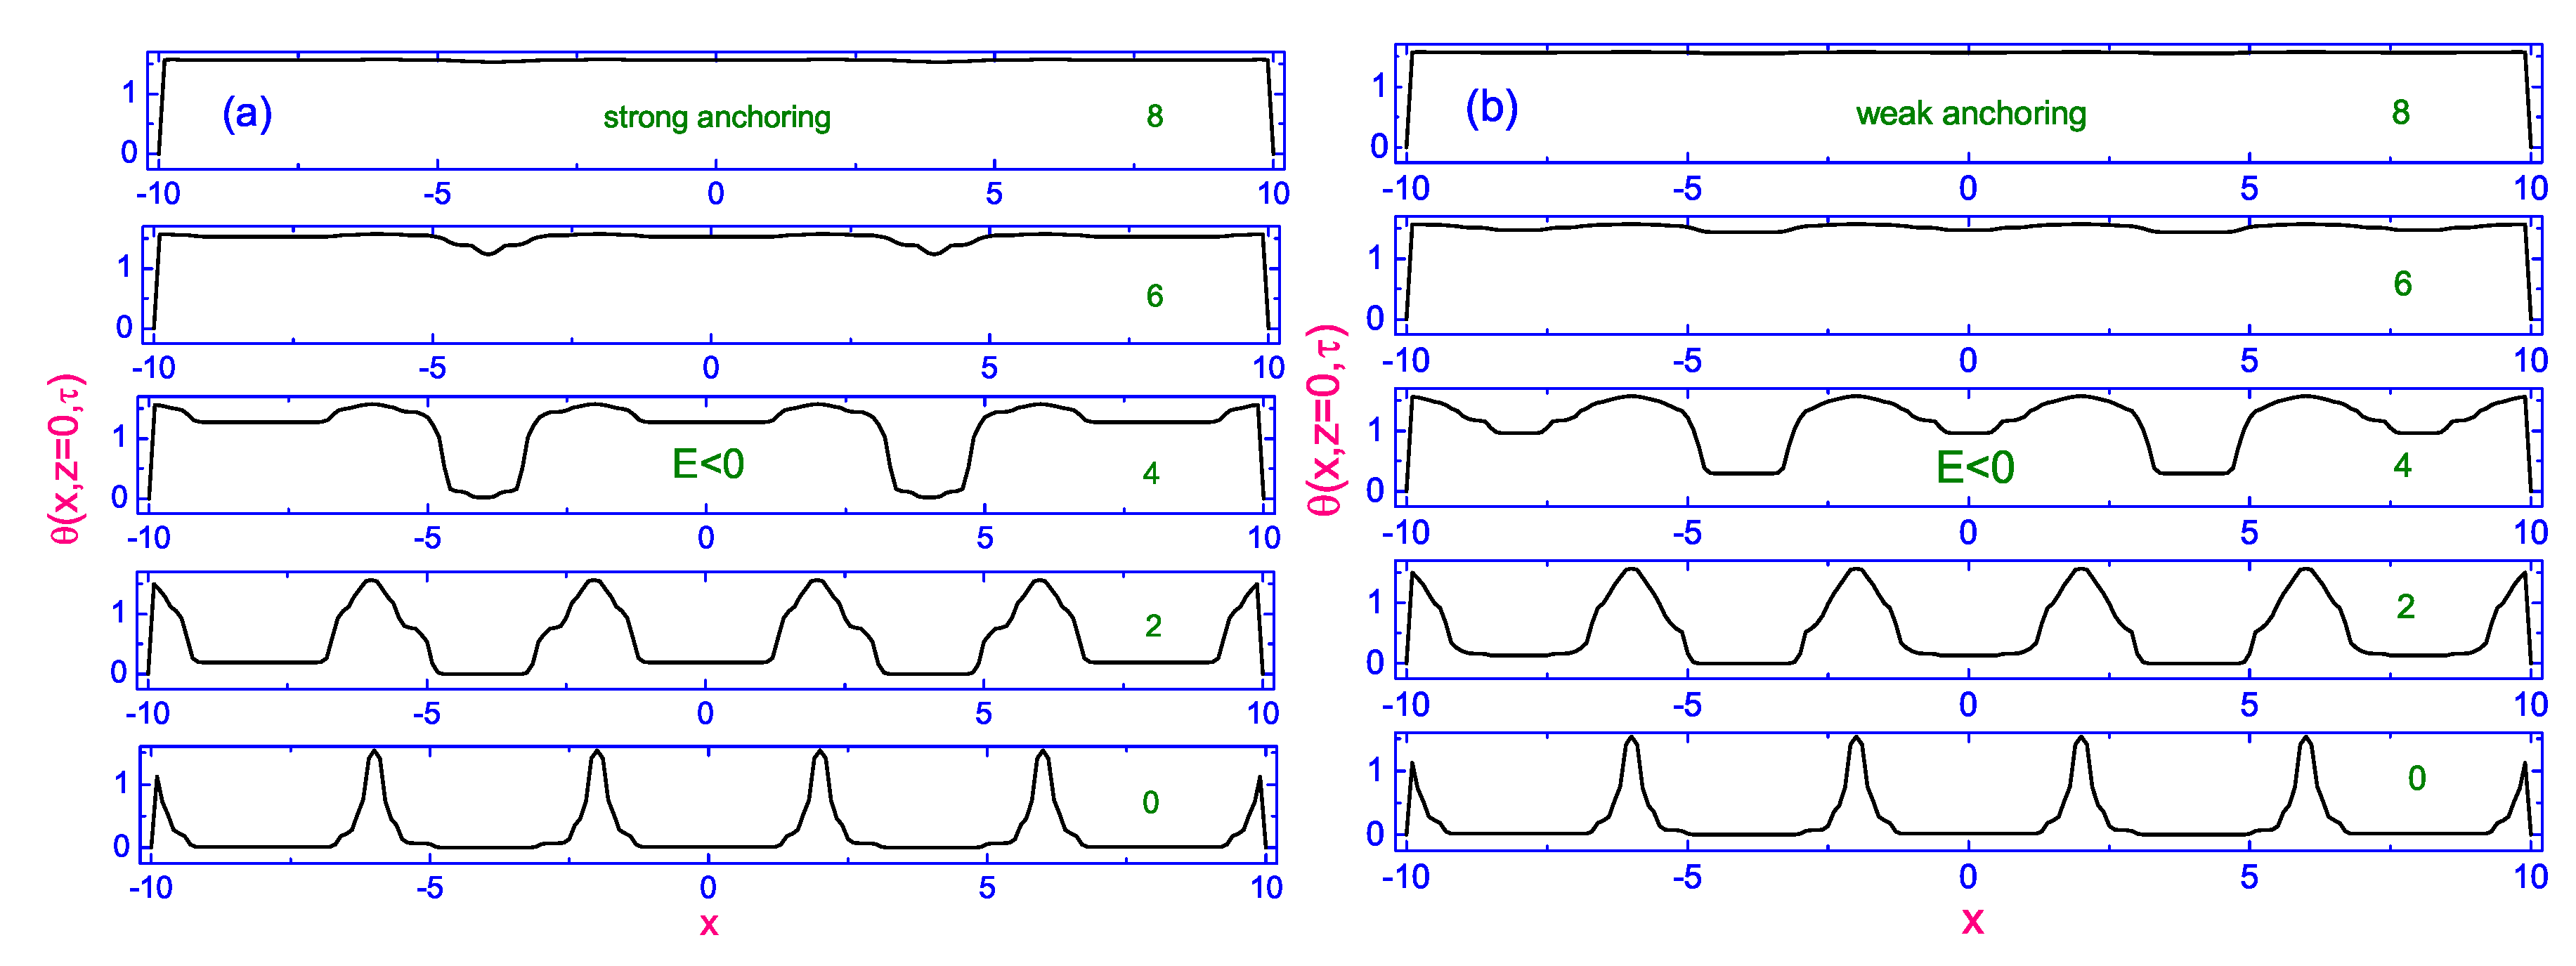
2.2. Peculiarities in the Director Reorientation under the Effect of Crossed Electric and Magnetic Fields

The main goal of the present section is the description of the dynamical peculiarities in the microsized nematic volume, composed of the deuterated 5 CB - d 2 molecules, in response to suddenly applied E directed at an angle α to the magnetic field B . That theoretical analysis is based on the predictions of the hydrodynamic theory which includes both the director motion and fluid flow. Under certain circumstances that approach provides an evidence for the appearance of the spatially periodic patterns in confined nematic volume in response to a suddenly applied large E directed at an angle α to B . The novelty of this theory is that the periodic distortion emerges spontaneously from a homogeneous state of the nematic system. It may induce a faster response than in the uniform mode, because these periodic distortions produce a lower effective rotational viscosity (ERV) γ eff ( α ) than in the homogeneous state. This is due to the fact that the nonuniform rotational modes involve additional internal elastic distortions U elast of the conservative nematic system and, as a result, it causes the decrease of the viscous contribution U vis to the total energy U tot of the nematic system. That is, a lower value of γ eff ( α ) gives the less value of the relaxation time τ ON ( α ) , when α is bigger than the threshold value α th . When the values of α are less then α th , the dynamics of the director reorientation can be described on the basis of the torque balance equation for a monodomain nematic, as observed in experiments [4,11].
We are focused here on the dynamics of the director n ^ reorientation in confined nematic volume, which is delimited by two horizontal and two lateral surfaces at mutual distances 2 d and 2 L on a scale in the order of tens micrometers. In our calculations the choice of the width/length≪1 allows us to avoid the effect of the bounding lateral walls on the director reorientation inside the nematic cell. We consider the coordinate system which assumes that the x -axis is directed parallel to B and both electrodes (see Figure 1a), whereas the z -axis is directed perpendicular to these electrodes. The electric field E and director n ^ make the angles α and θ , respectively, with the magnetic field B . According to our task, the nematic system may be seen as two-dimensional, since the director is maintained within the xz -plane (or in the yz plane) defined by two external fields, where i ^ is the unit vector directed parallel to the electrodes, k ^ is the unit normal vector, and j ^ = k ^ × i ^ . We can suppose that the components of the director n ^ = n x i ^ + n z k ^ = cos θ ( x , z , t ) i ^ + sin θ ( x , z , t ) k ^ depend only on x , z -coordinates and the time t .
So, the goal of this section is to investigate the dynamical peculiarities observed during the director reorientation in the microsized nematic volume confined between two transparent electrodes under the effect of crossed the strong electric E and magnetic B fields [11,18]. This problem will be investigated in the framework of the Ericksen-Leslie theory [20,21], that includes both the director motion and the fluid flow. Taking into account the width of the nematic film, one can assume the mass density ρ to be constant across the nematic film, and thus we can deal with an incompressible fluid. The incompressibility condition Δ · v = 0 assumes that
x u + z w = 0 ,
where u and w are the components of the vector v = v x ( x , z , t ) i ^ + v z ( x , z , t ) k ^ = u ( x , z , t ) i ^ + w ( x , z , t ) k ^ , and x u = u x . The hydrodynamic equations describing the reorientation of the director field n ^ in microsized 2D nematic phase can be derived from the torque and linear momentum balance equations [11,18] as
T vis + T elast + T el + T mag = 0 ,
and
ρ d v d t = · σ ,
respectively. Here T vis = δ R vis δ n ^ , t × n ^ is the viscous, T elast = δ Ψ e l a s t δ n ^ × n ^ is the elastic, T el = δ Ψ e l δ n ^ × n ^ is the electric and T mg = δ Ψ mg δ n ^ × n ^ is the magnetic torques exerted on the director, respectively, whereas σ denotes the full stress tensor (ST), and d v d t is the material derivative of the velocity v . Here, R vis = α 1 n ^ · M · n ^ 2 + γ 1 n ^ , t W · n ^ 2 + 2 γ 2 n ^ , t W · n ^ · M · n ^ n ^ · M · n ^ n ^ + α 4 M : M + ( α 5 + α 6 ) n ^ · M · M · n ^ 2 is the viscous contribution to the Rayleigh dissipation function, whereas α 1 , , α 6 are the Leslie viscosity coefficients, γ 1 = α 3 α 2 is the rotational viscosity coefficient, γ 2 = α 3 + α 2 is the viscosity coefficient which characterizes the contribution to the torque due to a shear velocity gradient, M = 1 2 v + ( v ) T and W = 1 2 v ( v ) T are the symmetric and asymmetric contributions to the rate of strain tensor, respectively, and n ^ , t = d n ^ d t is the material derivative of the director n ^ . In the case of 2D nematic system, when the director moves from being parallel to B to being parallel to E , the elastic energy density can be written as Ψ elast = 1 2 K 1 · n ^ 2 + K 3 n ^ × × n ^ 2 , where K 1 and K 3 are the splay and bend elastic constants, respectively. In turn, the electric and magnetic energy densities are Ψ el = 1 2 ϵ 0 ϵ a n ^ · E 2 and Ψ mag = 1 2 χ a μ 0 n ^ · B 2 , where ϵ 0 , μ 0 , χ a and ϵ a are the dielectric permittivity, magnetic constant, magnetic and dielectric anisotropy of the nematic sample, respectively. In our case the full ST can be written in the form σ i j = P δ i j + ρ v i v j σ i j vis , where P is the hydrostatic pressure in the nematic film, δ i j is the Kronecker delta function, and σ i j vis = α 1 n k n l M k l n i n j + α 2 n i N j + α 3 n j N i + α 4 M i j + α 5 n i n k M k j + α 6 n j n k M k i is the viscous contribution to the stress tensor. Here N = n ^ , t W · n ^ is the Leslie vector.
Note that the director dynamics in the monodomain nematic, both with and without accounting the backflow, has been investigated earlier in Refs. [4,12]. However, our main goal is the understanding of how both the crossed E and B , as well as the confinement are responsible for appearance of the periodic distortion emerging spontaneously from the homogeneous state of the nematic phase [10,17,18,19,22,23,24,25,26,27]. The theoretical study of the periodic structures in the nematic phase imposed by the strong E has been commonly associated with the wavelength corresponding to the mode of fastest growth [11,17,18,19,25,26,27]. Analysis of the numerical results for the turned-on process in the microsized nematic volume provides the evidence for the appearance of the spatially periodic patterns, only in response to the suddenly applied strong electric field E E th , directed practically orthogonal to the magnetic field B [11,17,18,19,25,26,27].
“It has been shown that for a certain balance among the electric, magnetic, elastic and viscous torques there is the threshold value of the amplitude of the thermal fluctuations of the director n ^ = n ^ 0 + δ n ^ which provides the nonuniform rotation mode rather than the uniform one, whereas the lower value of the amplitude dominates the uniform mode. So, in the case of E E th , the nematic system is suddenly placed far from equilibrium and any small perturbation in the initially uniform alignment will begin to grow exponentially [11,17,18,22,23,27] with a rate being inversely proportional to some ERV during the backflow reorientation process. It responds by creating distortion which maximizes the rate at which the nematic lowers its total free energy. In this configuration the thermal fluctuations with small amplitudes n ^ = n ^ 0 + δ n ^ ( δ n ^ 1 ) manifest themselves by the growing fluctuations with the wavelength corresponding to the fastest growing of distortions. Physically, this means that the periodic distortion emerging spontaneously from the homogeneous state may induce the faster response than in the uniform mode. The nonuniform rotation modes involve additional internal elastic distortions that are absent in the uniform rotation mode. This leads to a compromise that determines the wavelength of the fastest-growing periodic structure in the nematic film. The large-amplitude distortions lead to the increase of the elastic energy of the conservative nematic system and, as a result, it causes the decrease of the viscous contribution to the total energy of the LC system. In turn, as n ^ 2 = n ^ 0 2 = 1 , then in the linear approximation n ^ 0 · δ n ^ = 0 , that is δ n ^ n ^ 0 . Since initially the director is aligned parallel to B , at which n ^ remains parallel to n ^ 0 , so, there is only one δ n ^ z -component of the vector δ n ^ . Therefore, it is a good assumption that a small-amplitude distortion which will be modulated in the z -direction (see Figure 1a), and all physical quantities depend only on x and z coordinates, and in the case of the planar geometry both the thermal fluctuation of the director δ n ^ = ( 0 , 0 , δ n z ) and velocity v = ( v x , 0 , v z ) = ( u , 0 , w ) fields are in the xz plane.” [18].

2.2.1. Theoretical Analysis in Case of the Linear Balance Equations

For the case of 2D nematic system in which the inertial term is negligible the linear momentum balance equation can be written as [11,18,26]
η 5 x x u + η 1 z z u + η 4 x z w + α 3 z t δ n z x P = 0 , η 2 x x w + η 6 x z u + 2 η 3 z z w + α 2 x t δ n z z P = 0 ,
whereas the torque balance equation reads in the form
γ 1 t δ n z + α 2 x w + α 3 z u + ϵ 0 ϵ a E 2 cos 2 α δ n z + χ a μ 0 B 2 δ n z K 1 z z δ n z K 3 x x δ n z = 0 .
Here t = / t , x = / x , x z = 2 / x z , whereas η 1 = 1 2 α 4 + α 3 + α 6 , η 2 = 1 2 α 4 + α 5 α 2 , η 3 = 1 2 α 4 , η 5 = 1 2 α 4 + α 6 α 3 , and η 6 = 1 2 α 2 + α 4 + α 5 are six temperature dependent viscous coefficients.
In the case of the linearized 2D nematic system, the dynamics of the thermal fluctuation δ n z under the effect of crossed E and B fields can be obtained by solving the system of the linear differential Equations (5) and (6) with the appropriate boundary and initial conditions. By means of transmittance of the torque balance to the bounding surfaces, one can obtain the boundary conditions for the thermal fluctuation δ n z . In our case it can be written as [11,18]
z δ n z z = 0 , d = W K 1 Δ n .
Here W is the anchoring strength, Δ n = n s e , n s is the director orientation on the bounding surfaces, e is the easy axis orientation, and d is the film thickness, respectively. Note that the velocities u and w on both electrodes have to satisfy the boundary conditions (case of free boundaries)
w z = 0 , d = 0 , z u z = 0 , d = 0 .
In turn, the initial conditions both for δ n z and v can be written in the form
δ n z t = 0 = n 0 , v t = 0 = 0 ,
respectively.
In order to observe the formation of the spatially periodic patterns, excited by electric E and magnetic B fields, we assume a harmonic dependencies along x and z axes both for the thermal fluctuation and velocity [11,18]
δ n z = n 0 sin q x x sin q z z exp s t , u = v 0 q z sin q x x cos q z z exp s t , w = v 0 q x cos q x x sin q z z exp s t ,
where n 0 δ n t = 0 , v 0 v t = 0 .
In that case, the linearized torque balance Equation (6) takes the form
A 1 v 0 A 2 n 0 = 0 ,
whereas the linearized linear momentum balance Equation (5) can be written as
A 3 v 0 A 4 n 0 = 0 ,
where A 1 = 1 d α 2 q x 2 α 3 q z 2 , A 2 = B K 1 d q z 2 K 3 d q x 2 γ 1 s , A 3 = 1 d 2 η 1 q z 4 + η 8 q z 2 q x 2 + η 2 q x 4 and A 4 = 1 d α 3 q z 2 α 2 q x 2 s = A 1 s , whereas B = ϵ 0 ϵ a E 2 cos 2 α + χ a μ 0 B 2 = U U th 2 λ 1 cos 2 α + λ 2 , λ 1 = ϵ 0 ϵ a U th K 1 , λ 2 = χ a μ 0 B d 2 K 1 are two parameters of the nematic system, U th = π K 1 ϵ 0 ϵ a is the threshold voltage, and η 8 = η 5 η 6 η 4 + α 4 is the viscosity coefficient of the nematic system.
In our case the components of the velocity v = u i ^ + w k ^ have to satisfy the boundary conditions
w z = 0 , 1 = 0 , z u z = 0 , 1 = 0 ,
whereas the boundary conditions on both electrodes for director fluctuation δ n ^ take the form [11,18]
K 1 W d q z = tan q z z z = 0 , 1 .
Substituting Equation (12) into Equation (11) and solving them yields
s q x , q z = B + K 31 q x 2 + q z 2 γ eff K 1 d 2 ,
and one can calculate the ERV coefficient as
γ eff = γ 1 1 α ¯ 3 q z 2 α ¯ 2 q x 2 2 η ¯ 1 q z 4 + η ¯ 2 q x 4 + η ¯ 8 q z 2 q x 2 ,
where K 31 = K 3 K 1 , η ¯ i = η i / γ 1 ( i = 1 , . . . , 8 ) and α ¯ i = α i / γ 1 ( i = 2 , 3 ) are the dimensionless elastic and viscous coefficients, respectively. Notice that the linearized analysis is valid as long as the amplitude of the response δ n z is sufficiently small. Having obtained from Equation (15) the growth rate s q x , q z , one can determine the value of the angle α which provides a periodic response for the nematic phase at applied electric field E above threshold value E th = π d K 1 ϵ 0 ϵ a .
For further analysis the values of the splay K 1 = 8.7 p N and bend K 3 = 10.2 p N elastic constants for 5CB at temperature T = 300 K and density 10 3 kg / m 3 , as well as the dielectric constants ϵ = 19.5 and ϵ = 8 [11], has been used. In turn, the rotational viscosity [11] γ 1 0.072 Pa s , together with the measured data for all Leslie coefficients are used at the same temperature.
It should be noted that the NMR measurements were made with deuterated 5CB- d 2 nematic sample of the thickness of 194.7 μ m using a JEOL Lambda 300 spectrometer [4], which has a magnetic flux density B of 7.05 T . The values of voltages in our calculations is varied between 20 and 200 V . The last value of U was chosen to be equal to the value used in the NMR spectroscopy experiment [4]. So, the values of the dimensionless parameters λ 1 and λ 2 were estimated to be equal to 47,418 and 5486, respectively. The values of the anchoring strengths W for 5CB is varied in the range from 10 5 to 10 6 J/m 2 [11]. The calculation of the root of Equation (14) yields the minimal q z min = 0 , at z = 0 , whereas at z = 1 the minimal q z min has to satisfy the following equation:
κ q z min = tan q z min ,
where κ = K 1 / ( W d ) . The calculated values of the dimensionless coefficient κ are equal to 0.044 for the value of W = 10 6 J/m 2 (case I), and 0.0044 for the value of W = 10 5 J/m 2 (case II), respectively. These values of K 1 / ( W d ) provide the minimal values of the dimensionless wavelengths q min q z min , which are equal to Δ = π + δ , where δ = 0.1434 in case I and 0.01434 in case II, respectively. Note that in the limiting case of strong anchoring, when W , lim Δ W = π .
“Having obtained the values of q min = Δ (case I), one can calculate, by using of Equation (15), the dimensionless growth rate s q x d / π / s 0 vs. the dimensionless wavelength q x d / π under the effect of the electric field E . Calculations of the dimensionless growth rate s q x d / π / s 0 vs. dimensionless wavelength q x d / π , for two voltages U = 20 V (Figure 5a) and U = 50 V (Figure 5b) applied across the nematic film, for a number of values of the angle α : 0.157 ( 9 )(curve (1)); 0.471 ( 27 )(curve (2)); 0.785 ( 45 )(curve (3)); 1.257 ( 72 )(curve (4)), and 1.57 ( 90 )(curve (5)), respectively, are shown in Figure 5a,b [11,18]. The main result of this calculations is that the periodic response appear for the high value of the voltage U 50 V, when for each value of the angle α > 70 there is an optimal dimensionless wavelength q x max corresponding to the fastest growth of the distortion. For instance, in case I, and when the voltage U = 50 V, the strong periodic distortion emerging spontaneously from the homogeneous state by the strong E may induce faster than in the uniform mode only for the high values of the angle α 65 and higher. Calculations of the dimensional growth rate s q x d / π (in s 1 ) vs. q x d / π , under the effect of both the voltage U = 200 V and the magnetic field B 7.05 T , for a number of values of the angle α (same as in Figure 5), are shown in Figure 6. The main result of this calculation is that the periodic response appears only for the values of α α th 45 and higher, and for each value of the angle α > α th there exist an optimal dimensionless wavelength q x max corresponding to the fastest growth of the distortion. This means that the threshold value of the angle α th , at which a periodic structure in the homogeneously aligned nematic film under the effect of crossed electric and magnetic fields begins to form, decreases with increasing the voltage applied across the LC film. Calculations show that for such nematic film, with thickness ∼200 μ m, the character of the anchoring conditions (strong or weak) has a weak effect on the growth rate s and the dimensionless wavelength q max q x max (see Figure 7a). Note that when α tends to 90 , then the value of the optimal q max q x max , corresponding to the fastest growth of the distortion (see Figure 7b), increases slightly (see Table 1). Having obtained the values of q max α , corresponding to each value of α , one can calculate the effective viscosity [18]
γ eff α , W / γ 1 = 1 α ¯ 3 Δ 2 α ¯ 2 q max α 2 2 η ¯ 1 Δ 4 + η ¯ 2 q max α 4 + η ¯ 8 Δ 2 q max α 2
as a function of both the angle α and the anchoring strength W . In the limiting case of q max = 0 the ERV coefficient γ eff ( 0 ) is equal to
γ eff 0 = γ 1 1 α 3 2 η 1 1 + γ 2 γ 1 ,
which agrees with the result reported in the literature [22]. Calculations of the dimensionless ERV coefficient γ eff α , W / γ 1 as the function of both the angle α and the anchoring strength W are shown in Figure 8. It is evident that when α tends to be 90 , then the value of the optimal q max q x max , corresponding to the fastest growth of the distortion, providing the lower ERV coefficient γ eff α being less than one in the bulk nematic phase. Physically, this means that the periodic distortion emerging spontaneously from a homogeneous state may induce a faster response than in the uniform mode. The nonuniform rotation modes involve additional internal elastic distortions that are absent in the uniform rotation mode. This leads to a compromise that determines the wavelength of the fastest-growing periodic structure in the nematic film. In turn, the large-amplitude distortions modulated in the x direction lead to the increase of the elastic energy of the conservative nematic system and, as a result, it causes the decrease of the viscous contribution to the total energy of the LC system. Both Figure 5 and Figure 6 show that there is a certain threshold value of the angle α th which provides the periodic distortion emerging spontaneously. That is, when α is close to a right angle (see curves (4) and (5) in Figure 6), the value of γ 1 in Equations (5) and (6) should be replaced by γ eff . That is, the lower value of γ eff α , W initiates another dynamics of the director reorientation in the nematic film under the effect of crossed electric and magnetic fields. In turn, since τ on α , W γ eff α , W [22], the lower value of γ eff will reduce the relaxation time, as observed experimentally by using the time-resolved deuterium NMR spectroscopy [4].” [18].

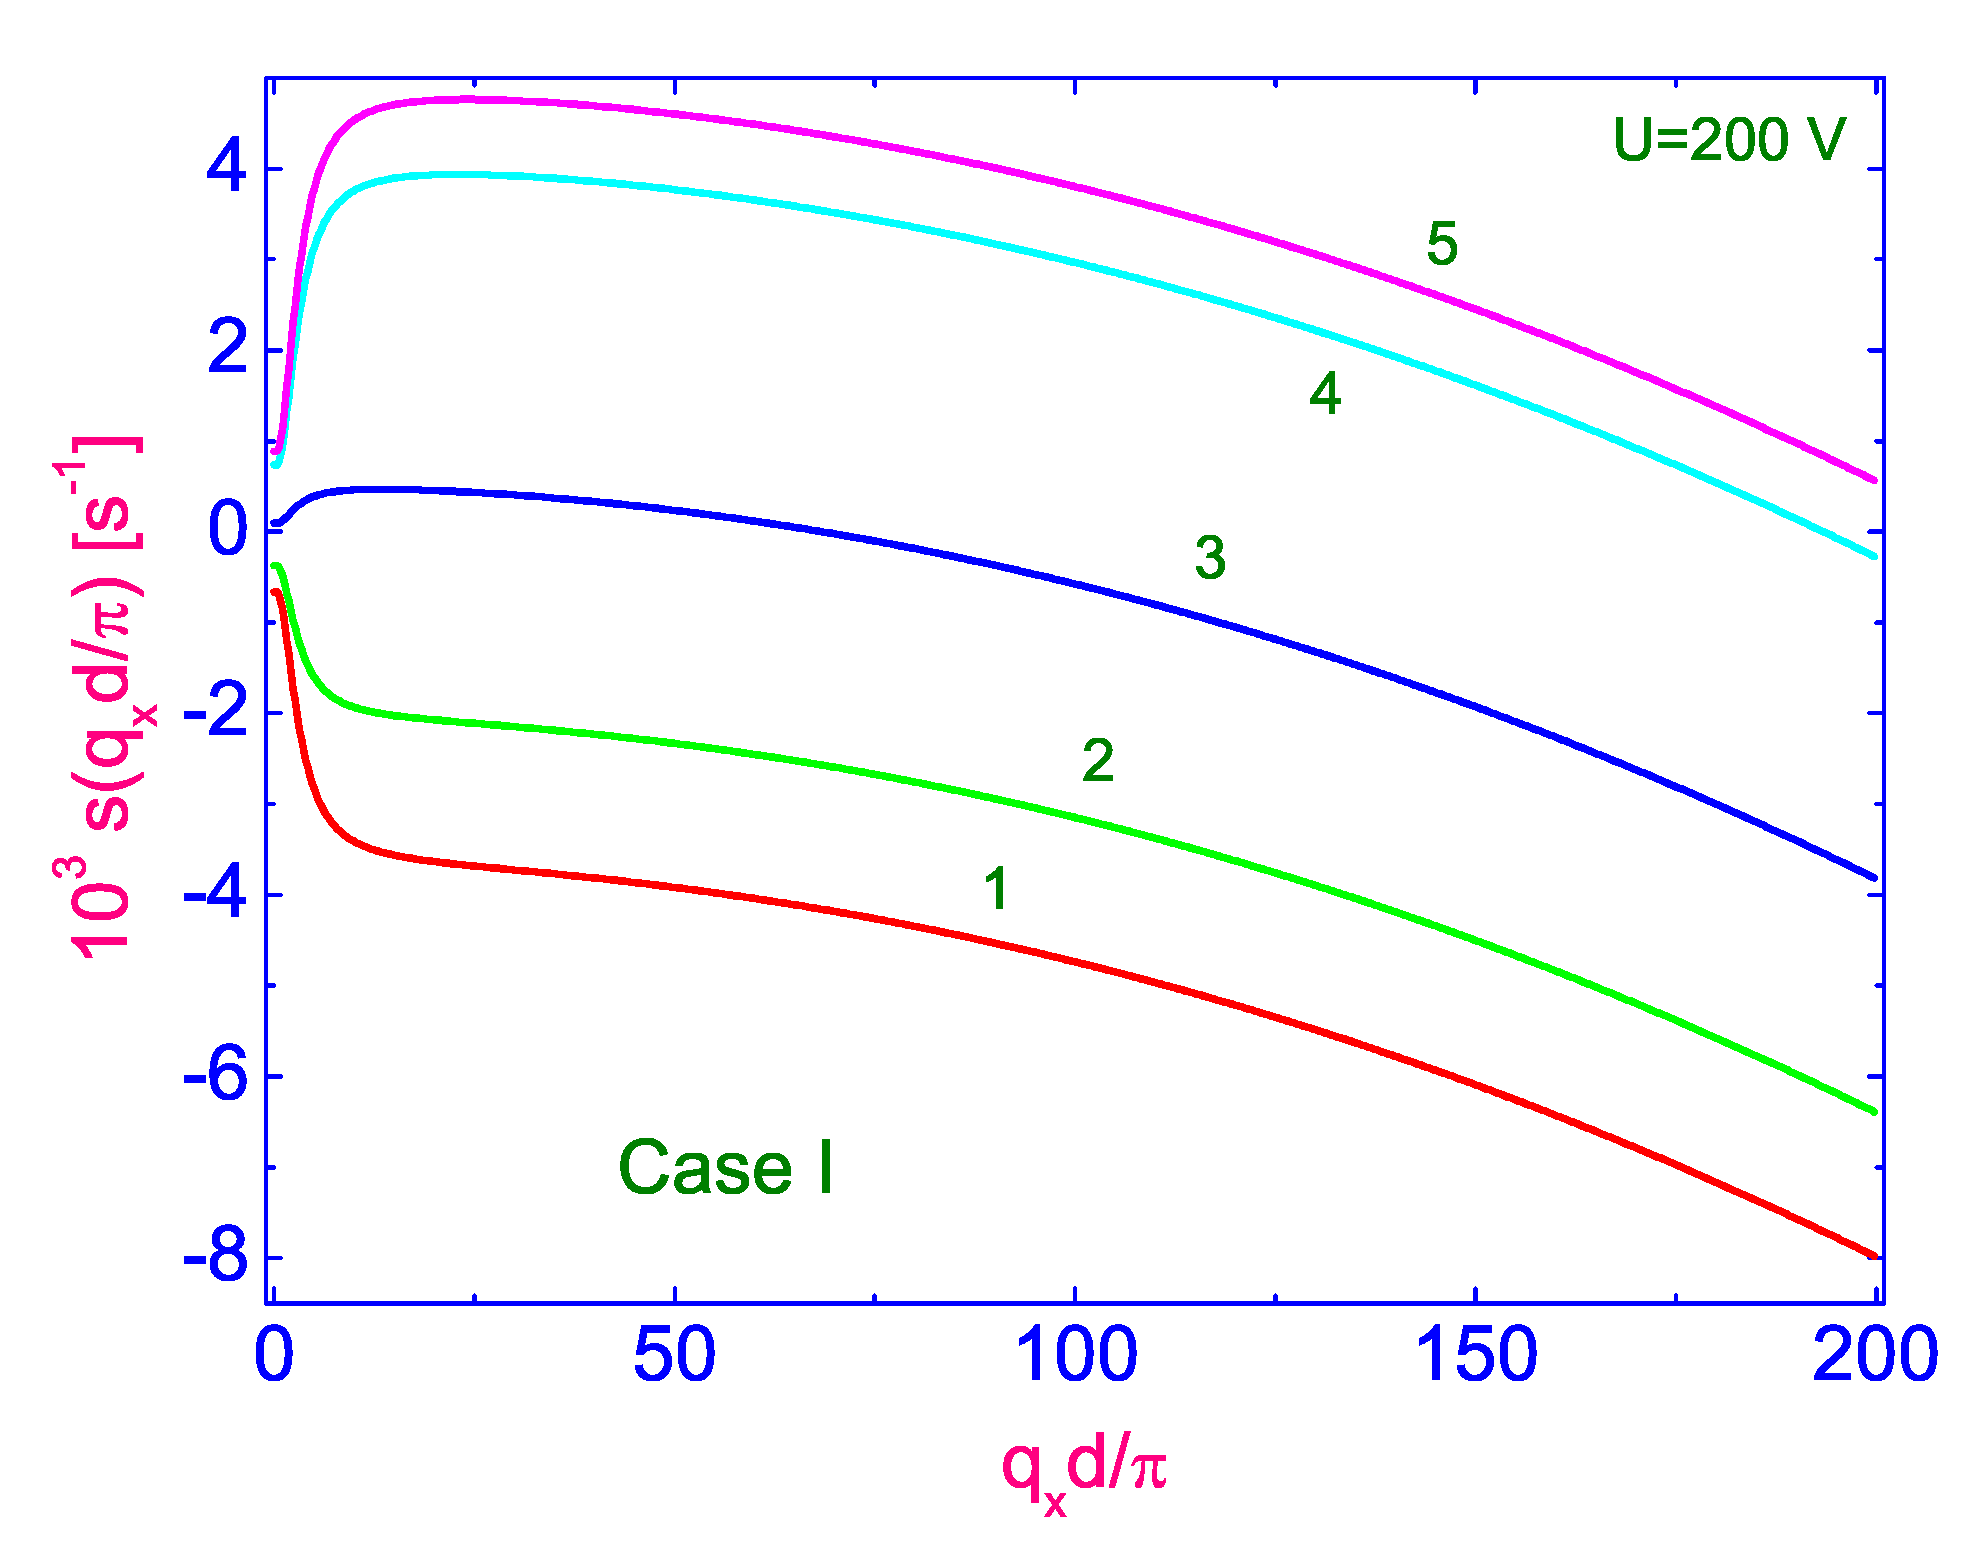
2.2.2. Theoretical Analysis in Case of the Nonlinear Balance Equations

The dimensionless torque balance and the dimensionless linear balance momentum equations describing the orientational dynamics of the nematic phase under the influence of strong electric field E can be written in the form (for details, see the Ref. [19])
θ , τ = δ 1 sin 2 θ + K 31 cos 2 θ θ , xx + cos 2 θ + K 31 sin 2 θ θ , zz + δ 1 K 31 1 sin 2 θ θ , xz + 1 2 1 K 31 sin 2 θ θ , x 2 θ , z 2 + δ 1 K 31 1 cos 2 θ θ , x θ , z + 1 2 E ¯ 2 ( z ) sin 2 α θ + 1 2 ψ , xx + ψ , zz ψ , z θ , x + ψ , x θ , z + γ sin 2 θ ψ , xz + 1 2 ψ , xx ψ , zz ,
δ 2 Δ ψ , τ + ψ , z Δ ψ , x ψ , x Δ ψ , z = L ^ ψ + F ,
where v = u x , z , τ i ^ + w x , z , τ k ^ is the dimensionless velocity, which can be expressed by means of the dimensionless stream function ψ x , z , τ as u = ψ z and w = ψ x , respectively. Here u u x , z , τ and w w x , z , τ are the dimensionless components of the vector v , the operator L ^ ψ and the function F are listed in the Appendix of Ref. [19], Δ ψ = ψ , xx + ψ , zz , τ = ϵ 0 ϵ a γ 1 V 2 d 2 t is the dimensionless time, γ 1 and γ 2 are two rotational viscosity coefficients (RVCs), δ 1 = 4 K 1 ϵ 0 ϵ a V 2 , δ 2 = ρ ϵ 0 ϵ a V 2 4 γ 1 2 , γ = γ 2 γ 1 , and K 31 = K 3 K 1 are four parameters of the nematic system. It should be noted that the overbars in the space variables x and z have been (and will be) eliminated in the last as well as in the following equations.
In our case the electric field E = E x i ^ + E z k ^ = E z cos α i ^ + E z sin α k ^ is applied across the nematic film and makes the angle α with the electrodes. Note that in our case the value of the angle α is close to the value of the right angle. In turn, the dimensionless electric field E ( z ) satisfies the basic equation of electrostatics for dielectrics [19]
z ϵ ϵ a + sin 2 θ E ¯ ( z ) sin α + δ 2 θ , z sin 2 θ = 0 , 1 = 1 1 E ¯ ( z ) d z ,
where E ¯ ( z ) = 2 d E ( z ) V , and V is the voltage applied across the cell. Consider now the microsized nematic volume confined between two transparent electrodes when the director is weakly anchored at the bounding surfaces and the anchoring energy can be written in the form [11] W an = 1 2 A sin 2 Δ θ , where Δ θ = θ s θ 0 , θ s and θ 0 are the pretilt angles of the surface director n ^ s and the easy axis n ^ 0 , respectively. In order to elucidate the role of the thermal fluctuations in maintaining of the spatially periodic patterns in the nematic film under the effect of the strong E , we have performed a numerical study of Equations (20)–(22) with an appropriate boundary conditions for the angle θ . In the first case, it reads as (hereafter referred to as case A)
θ , z ( 10 < x < 10 , z = ± 1 ) = ± δ 3 θ ( 10 < x < 10 , z = ± 1 ) , θ ( x = ± 10 , 1 < z < 1 ) = 0 ,
where δ 3 = A d K 1 , whereas in the second case, with the strong anchoring condition for the angle θ , it reads as (hereafter referred to as case B)
θ 10 < x < 10 , z = ± 1 = 0 , θ x = ± 10 , 1 < z < 1 = 0 ,
respectively. The velocity on these electrodes has to satisfy the no-slip boundary conditions, i.e.,
v 10 < x < 10 , z = ± 1 = v x = ± 10 , 1 < z < 1 = 0 .
With aim to observe the formation of the spatially periodic patterns emerging spontaneously from homogeneous state under the effect of the strong E , the appropriate initial condition was written in the form [19]
θ ( x , z , 0 ) = θ 0 cos ( q x x ) cos ( q z z ) .
So, the initial condition in the form of Equation (26) defines the thermal fluctuations of the director with amplitude θ 0 and wavelengths q x and q z of an individual Fourier components of the modulation. In the case A, the wavelengths q x and q z of an individual Fourier components are described as q x = π 20 ( 2 k + 1 ) , where k = 0 , 1 , 2 , and q z = δ 3 cot q z z = ± 1 , whereas in the case B, as q α = π 2 ( 2 k + 1 ) , where α = x , z and k = 0 , 1 , 2 , .

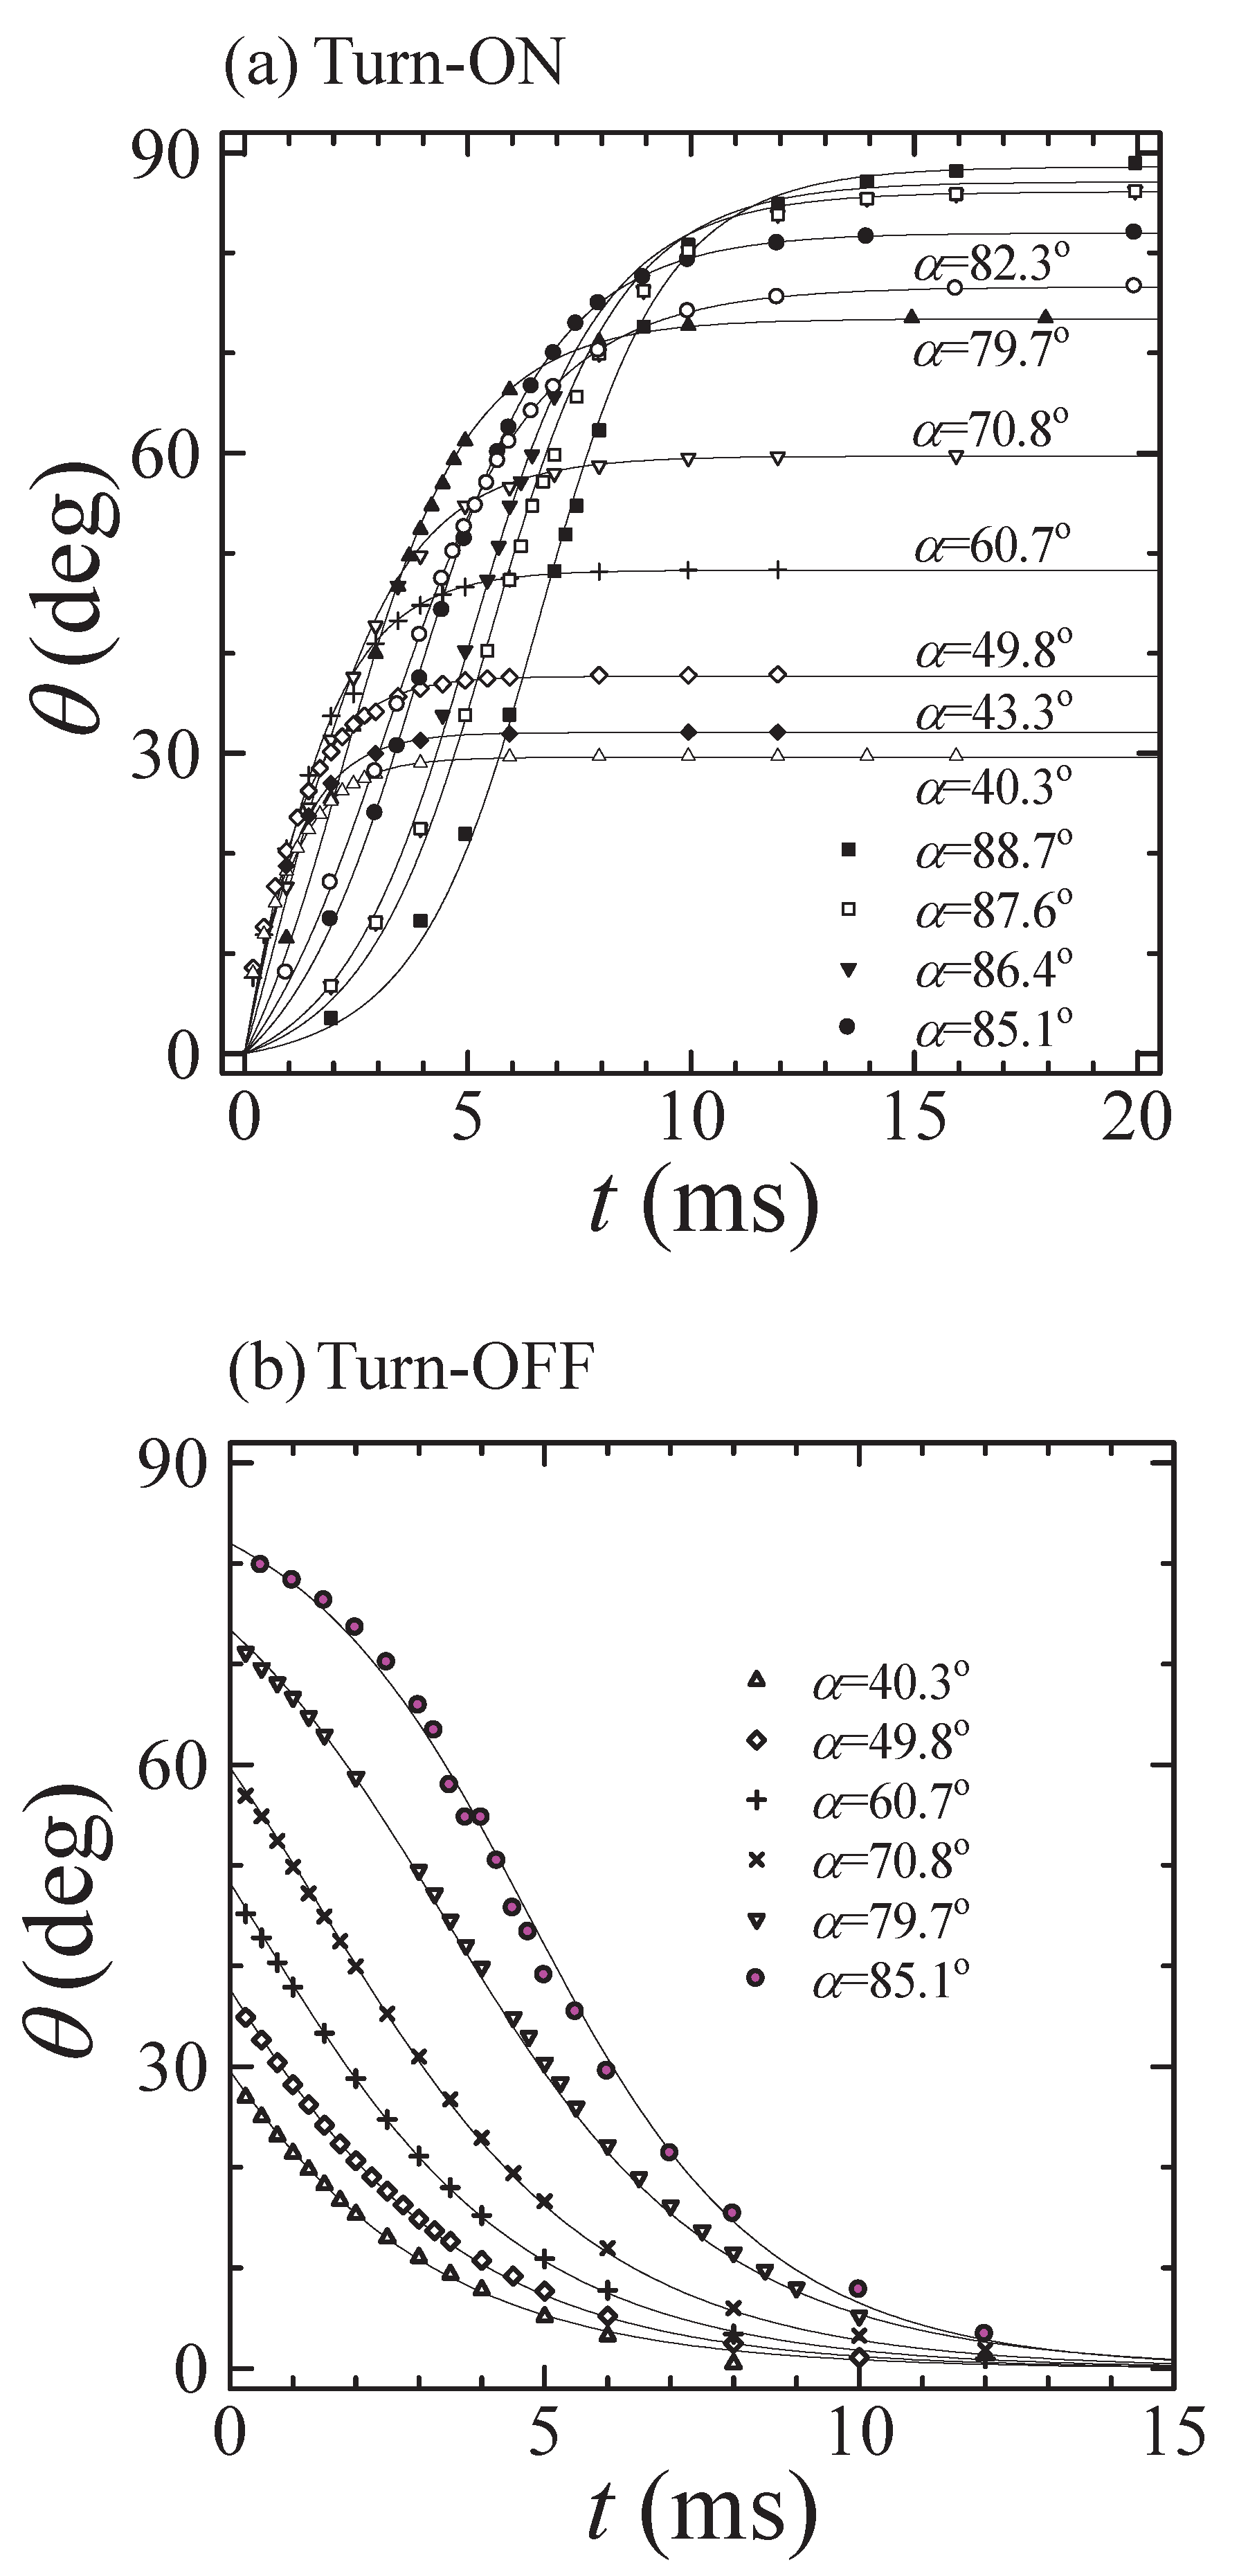
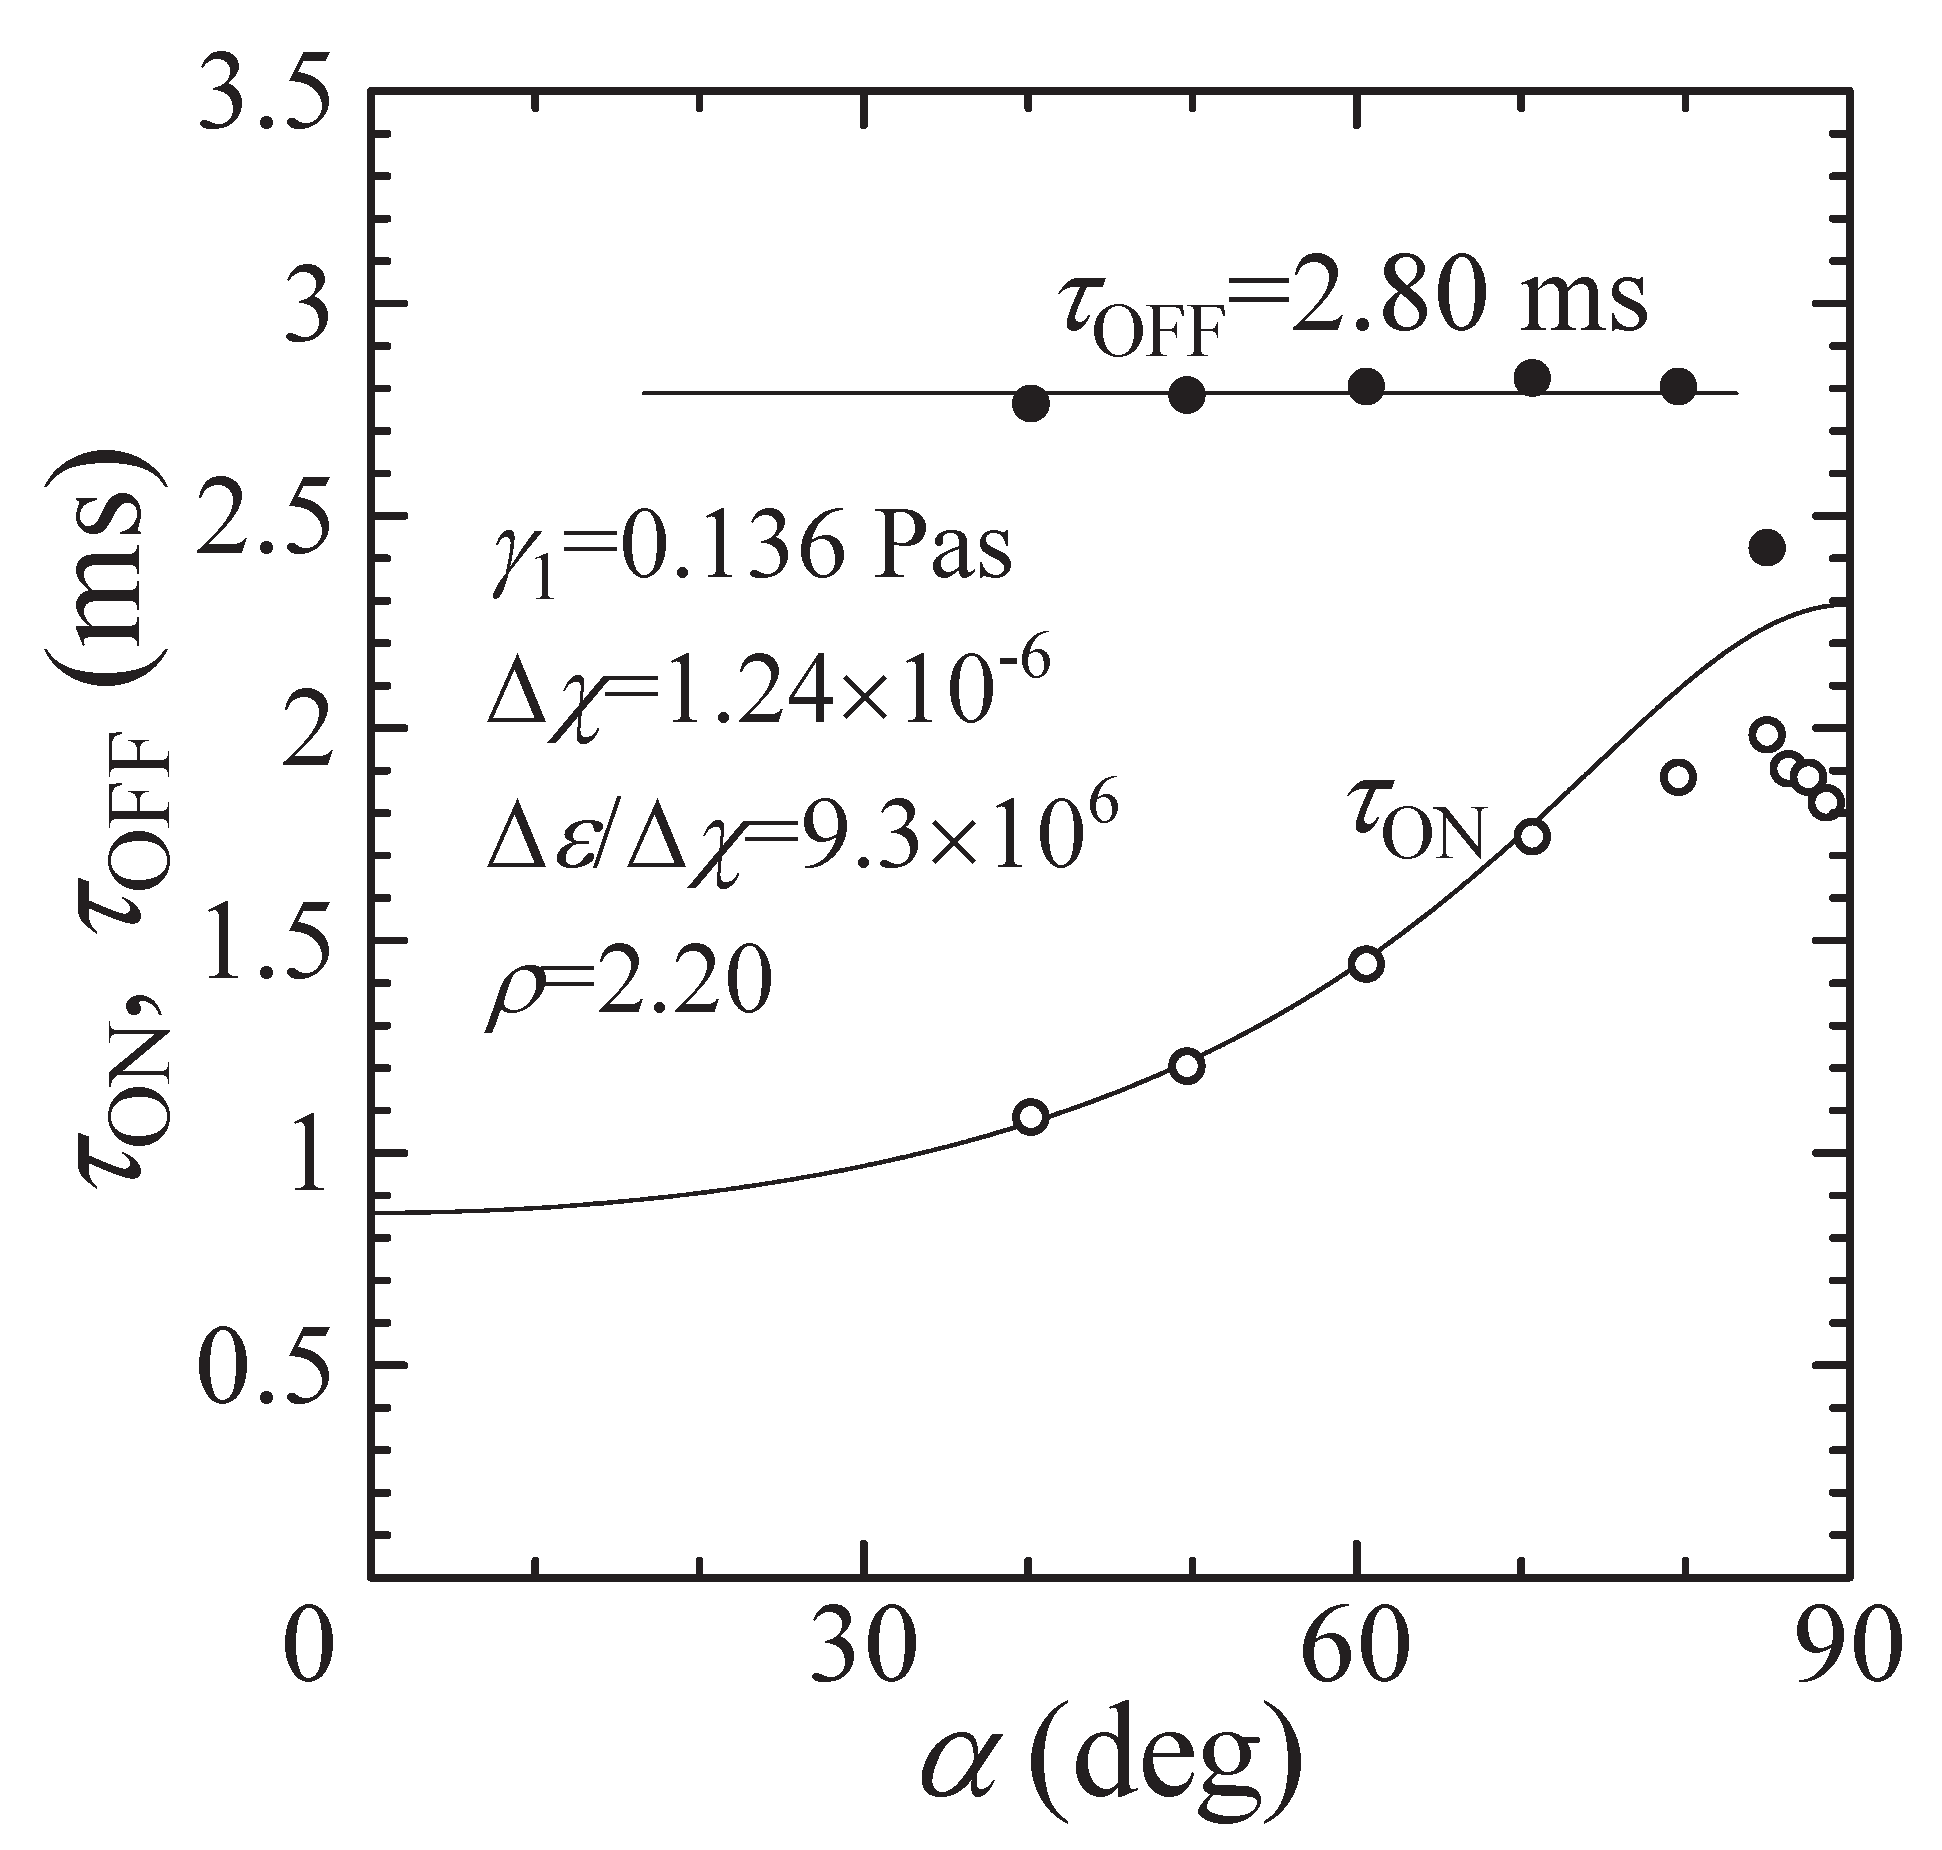
Switched-on Process in the Positive Sense

When a strong electric field E is applied in the positive sense at the angle α close to the right angle to the transparent electrodes, the director moves from being parallel to the direction preferred by the surfaces to being parallel to E (the turned-on process), because dielectric anisotropy is positive for all cyanobiphenyls. Now the evolution of the director n ^ to its final distribution across the microsized nematic volume under the effect of E can be obtained by solving the nonlinear partial differential Equations (20)–(22) with appropriate boundary (23)–(25) and initial (26) conditions. For the case of deuterated 5CB- d 2 , at the temperature 300 K corresponding to nematic phase, the mass density is equal to 10 3 kg / m 3 and the set of δ -parameters, which is involved in Equations (20)–(23), takes values [19] δ 1 = 8.6 × 10 6 , δ 2 = 0.19 , and δ 3 = 19.5 .
“It has been shown in the recent analysis of the numerical results for the turned- on process [19,25,27] that for a certain balance among the electric, elastic, and viscous torques there is the threshold value of the amplitude θ 0 of the thermal fluctuations of the director over the LC sample which provides the nonuniform rotation mode rather than the uniform one, whereas for the lower value of θ 0 the uniform mode dominates. It has been shown, for instance for the case of 5CB and the angle α = 1.57 ( 89 . 96 ) , that the periodic response appears only for the values of the amplitude θ 0 more than 0.01 (∼ 1 . 1 ), whereas for the lower values of θ 0 the certain balance of the torques provides only the uniform rotation mode. These nonlinear partial differential Equations (20)–(22), together with the boundary conditions both for the angle θ (Equation (23)) and the velocity v (Equation (25)), and the initial condition (Equation (26)), has been solved by using both the relaxation [28] and the sweep [29] methods. The relaxation criterion ϵ = | θ ( n + 1 ) τ θ ( n ) τ / θ ( n ) τ | for calculating procedure was chosen to be equal to 5×10 4 , and the numerical procedure was then carried out until a prescribed accuracy was achieved. Here n is the iteration number.” [19].
The relaxation both of the angle θ x , z = 0 , τ (Figure 9a) and the velocity components w ( x , z = 0 , τ ) and u ( x , z = 0 , τ ) (Figure 9b) of the vector v = u i ^ + w k ^ to their final distributions along the length of the dimensionless nematic film ( 10 x 10 ) , for a number of dimensionless times τ = 2 (∼12 ms), 4 (∼24 ms), 6 (∼36 ms), 8 (∼48 ms), and 10 (∼60 ms), are shown in Figure 9a,b [19], respectively. The values of the dimensionless time τ = ϵ 0 ϵ a γ 1 V 2 d 2 t are accounted after turned- on the electric field. The time propagation of the angle θ x , z = 0 , τ along the length of the dimensionless nematic film 10 x 10 with the value of the amplitude θ 0 = 0.01 ( 1 . 1 ) is characterized by the well- developed periodic structure with the lattice points at x = ± 2.175 and ± 5.83 (case A).
It should be pointed out that the velocity field in that case has a weak effect on the director s dynamics, and the distribution of the angle θ x , z = 0 , τ along the length of the dimensionless nematic film 10 x 10 , with and without accounting the backflow v practically does not distinguish each other. This means that the role of the viscous and elastic forces becomes negligible in comparison to the electric contribution. The evolution of the director field in the nematic film under the effect of the strong E directed practically perpendicular to the electrodes was obtained by solving the nonlinear partial differential Equations (20)–(22), with appropriate boundary condition (Equation (23) (case A) or (Equation (24) (case B)) for the angle θ and with the initial condition (Equation (26)). For both cases A and B, and for the values of θ 0 = 0 . 01 ( 1 . 1 ) and α = 1.57 , the time propagation of the angle θ x , z = 0 , τ profile along the x-axis 10 x 10 is characterized by well-developed periodic structure with the lattice points at x = ± 2.175 and ± 5.83 (case A) (Figure 10a) and x = ± 2.19 and ± 5.80 (case B) (Figure 10b), respectively. Physically, this means that the character of the anchoring to the bounding surfaces does not influence the final maintaining of the spatially periodic patterns (see Figure 10).
It should be noted that in our case the optimal dimensionless wavelengths q x and q z provide the minimal values of the total energy [19] W = W elast + W e , where
2 δ 1 W elast = d x d z ( θ eq , x ON ) 2 + ( θ eq , z ON ) 2 sin 2 θ eq ON + K 31 cos 2 θ eq ON + d x d z K 31 1 sin 2 θ eq ON θ eq , x ON θ eq , z ON
is the elastic contribution to the total energy, whereas
2 W e = d x d z E ¯ 2 θ eq ON cos 2 θ eq ON ( x , z ) α
is the electric contribution to the total energy. In this turned-off case, the equilibrium distribution of the angle θ eq ON ( x , z ) along the length of the dimensionless nematic film is achieved after the dimensionless time term τ = 12. It is also shown that only for the values of q x = 0.785, q z = 64.336, α = 1.57 , and θ 0 = 0.01 ( 1 . 1 ) and higher the solution shows that the periodic structure may appear spontaneously from homogeneous nematic phase under the effect of the strong electric field E and above mentioned boundary and initial conditions. These values of q x and q z provide the minimal values of the total energy W .

Switched-off Process

After removing the electric field, the director relaxes back to the direction preferred by the surfaces (the turned-off process). Now the reorientation of the director to its equilibrium distribution across the nematic film under the effect of the long-range elastic interactions and the anchoring force can be obtained by solving the nonlinear partial differential Equations (20) and (21), for the case of E = 0 , with appropriate boundary conditions Equation (23) (case A) or strong Equation (24) (case B) for the angle θ . The initial condition is taken in the form [19]
θ ( x , z , 0 ) = θ eq ON ( x , z ) ,
where θ eq ON is defined as an equilibrium distribution of the director across the nematic film obtained during the turned-on process and at the value of the angle α = 1.57 .
Figure 11 shows the relaxation of the polar angle θ x , z = 0 , τ during the turned-off process to its equilibrium distribution along the length of the dimensionless nematic film ( 10 x 10 ) [17] for two cases, A (Figure 11a,b), respectively, and for a number of dimensionless times τ = 2 (22) (∼12 ms), 6 (26) (∼36 ms), 8 (28) (∼48 ms), 12 (32) (∼72 ms) and 20 (40) (∼0.12 s). Here in our notation the first value means the dimensionless ( τ = ϵ 0 ϵ a γ 1 V 2 d 2 t ) time after turning- off the electric field, whereas the second value means the total time after starting the process. It is shown that after the time τ 18 (∼0.108 s), when the electric field is removed, the director slowly relaxes back to the direction preferred by surfaces and that process is characterized by the complex destruction of the initially periodic structure (see Figure 11), especially in the vicinity of the lattice points. Our calculations show that the director slowly relaxes back to the direction preferred by surfaces, and the angle θ 0 only after time τ R 400 (2.4 s). Physically, this means that the role of elastic, viscous and anchoring forces becomes comparable.” [19].

Switched-on Process in the Negative Sense
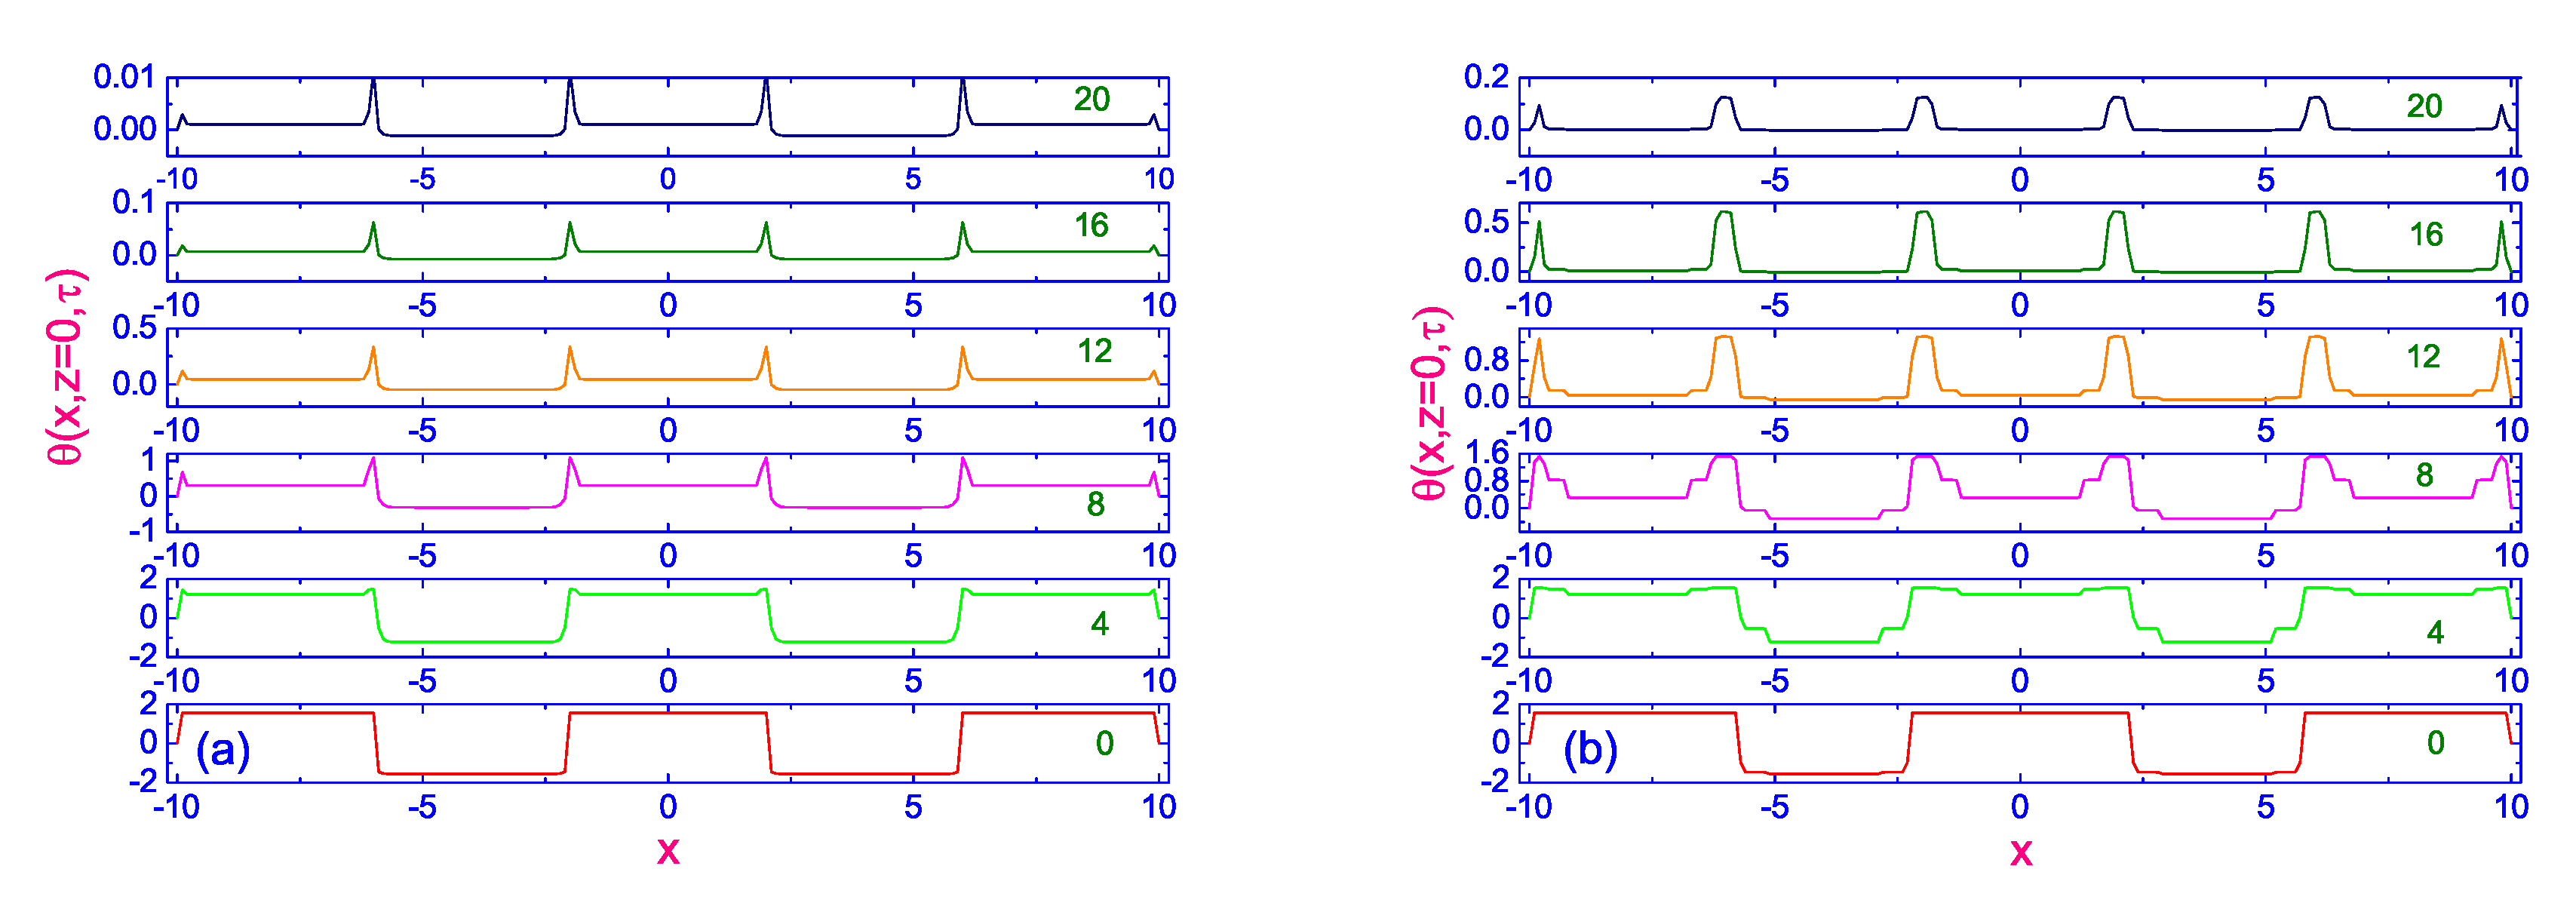
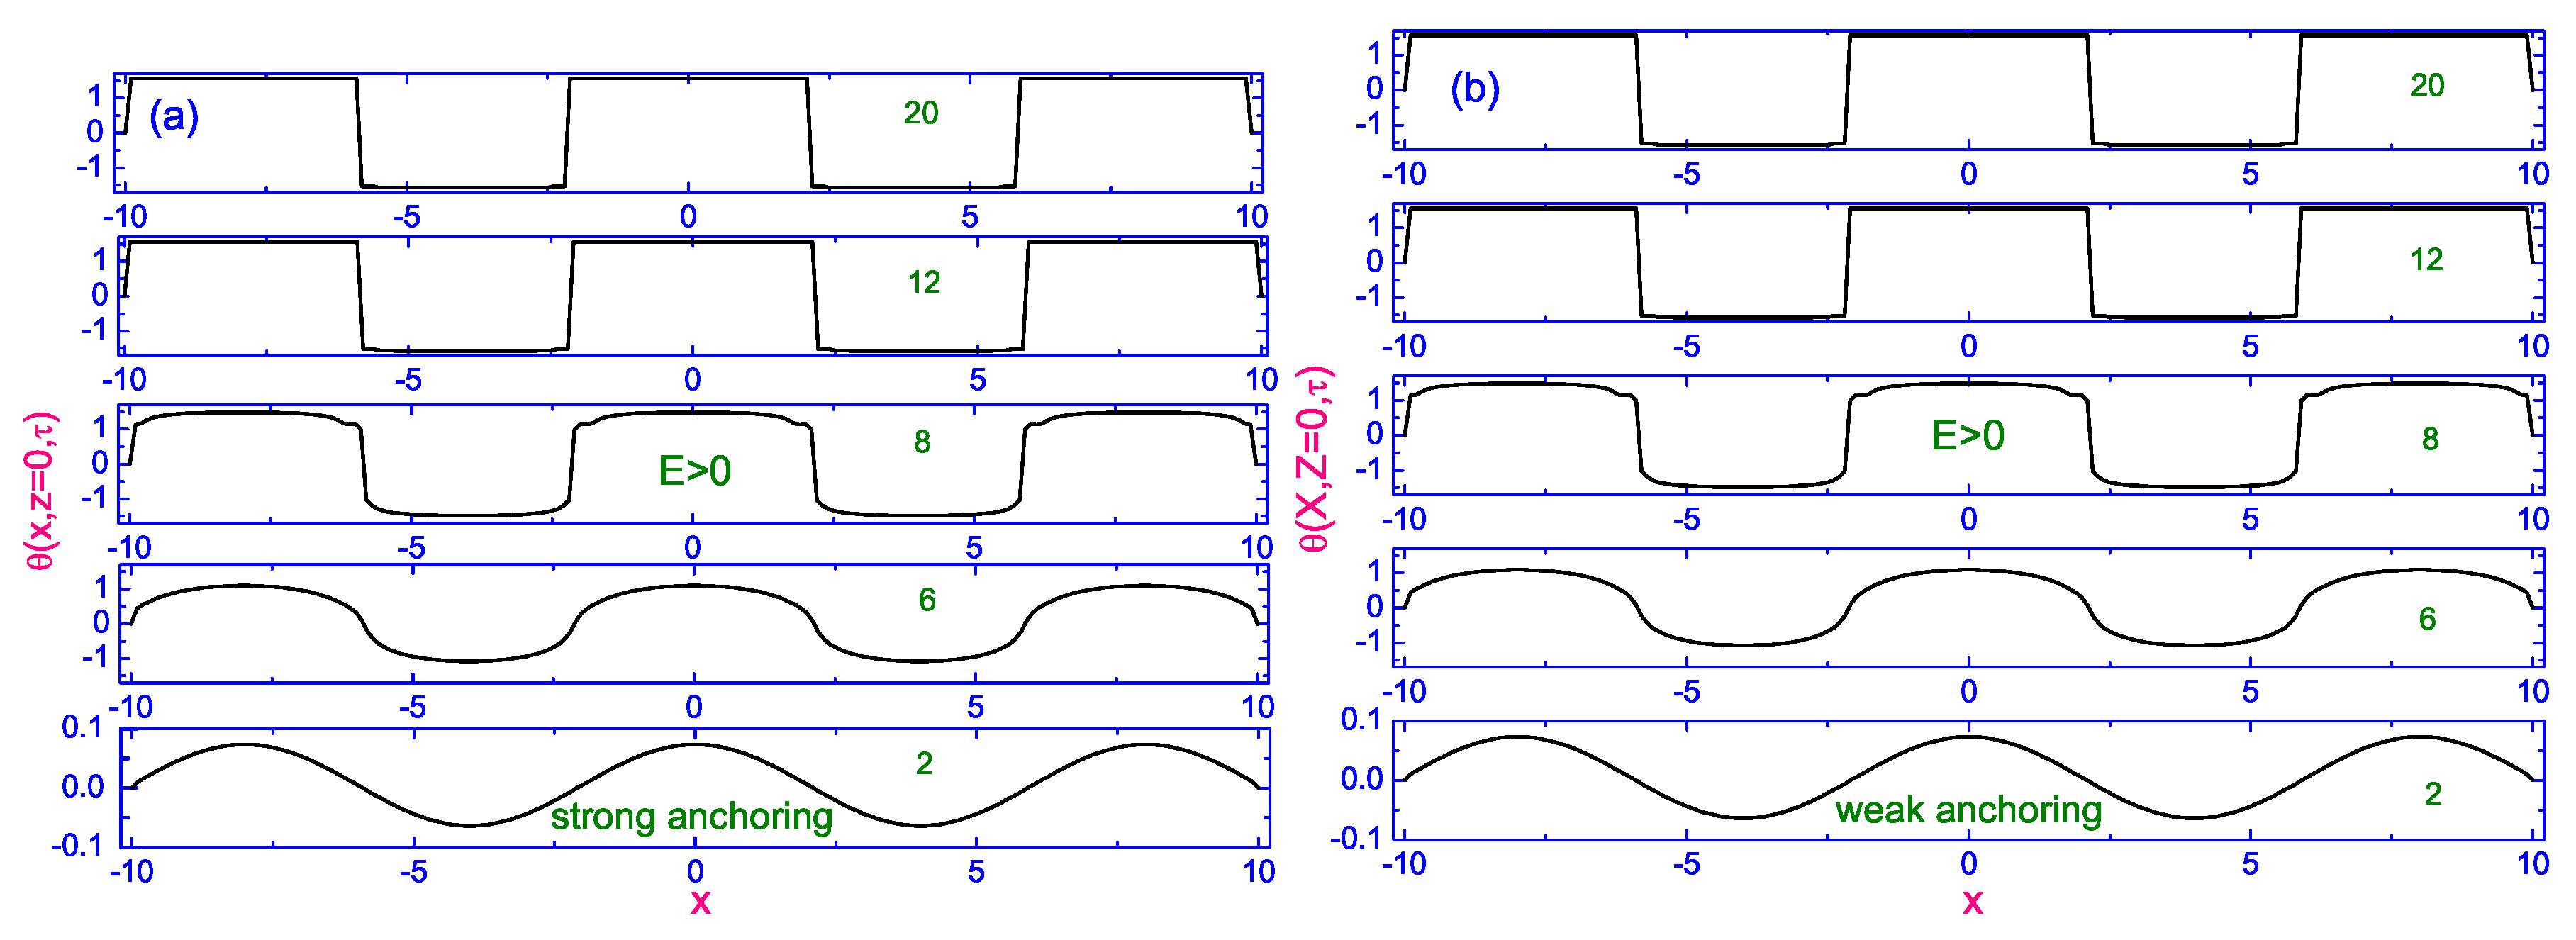
When the strong electric field E is applied again but in the negative sense at the angle α π 2 (see Figure 1b), the director moves from being parallel to n ^ OFF to being parallel to the electric field. Here n ^ OFF is the final orientation of the director after the time term τ OFF , when the electric field was removed. Now the relaxation of the director in the microsized nematic volume under the effect of the strong electric field E can be obtained by solving the nonlinear partial differential Equations (20)–(22), with the appropriate boundary Equations (23)–(25) and initial conditions.
“In that case the initial condition is taken in the form [19]
θ ( x , z , 0 ) = θ OFF ( x , z ) ,
where θ OFF ( x , z ) is defined as the final distribution of the director across the nematic film obtained during the turned-off process, when the electric field was removed. Two different scenarios of relaxation of the director n ^ to its equilibrium distribution across the nematic film under the effect of strong E directed in the negative sense at the angle α = −1.57 to the transparent electrodes are shown in Figure 12 and Figure 13 [19]. These evolutions are shown for two time sequences, first, for τ = 0 (248), 2 (250), 4 (252), 6 (254) and 8 (256) (see Figure 12), whereas, second, for τ = 0 (250), 2 (252), 4 (254), 6 (256) and 8 (258) (see Figure 13), respectively. Here the first value means the dimensionless time after turning-on the process in the negative sense, whereas the second value means the total time after starting the process. In these two cases (Figure 12 and Figure 13) the electric field is turned- on again after the dimensionless time terms τ = 248 (∼1.488 s) and τ = 250 (∼1.5 s), respectively. So, in these cases the electric field was removed during τ OFF = 228 ( 20 τ 248 ) and 230 ( 20 τ 250 ) dimensionless units, respectively. The main result of these calculations is that the final maintaining of the spatially periodic patterns, at α = −1.57, is possible only when the electric field was removed during 228 dimensionless time units or 20 τ OFF 248 ( 0 . 12 s t OFF 1 . 488 s ) (see Figure 12), whereas in the case of the longer delaying of turning -on the electric field, for instance, during 230 dimensionless time units, the certain balance among the electric, elastic, and viscous torques provides only the uniform mode (see Figure 13). Physically, this means that the further removing of the strong electric field leads both to the further decreasing of the value of the amplitude θ 0 and to the destruction of the periodic structure. Later, when the strong E is applied again, but in the negative sense, the director is reoriented as a monodomain nematic. This result confirms the previous suggestion that there exists the thereshold value of the amplitude θ 0 which provides the nonuniform rotation mode rather than the uniform one, whereas the lower value of θ 0 dominates the uniform mode [11]. Notice that in both these cases the final maintaining of the spatially periodic (Figure 12) and monodomain (Figure 13) structures are achieved after the same dimensionless time 8 (∼48 ms).” [19].
Thus, this theoretical analysis, based on the hydrodynamic theory including both the director motion and fluid flow, provides evidence for the appearance of spatially periodic patterns in response to the large E directed at the angle α to B , when α is bigger than the threshold value α th . When the value of α is less then α th , the director s dynamics can be described by the torque balance equation for a monodomain nematic. Notice that our calculation predicts that the dynamic periodic order emerges spontaneously from the homogeneous state only due to thermal fluctuations, without any initial local misalignment of the director.

2.3. Simulation of the Time-Resolved  2 H Spectra

One of the prime advantages in using NMR spectroscopy to determine the director orientation is that the form of the spectrum is also influenced by the distribution of the director with respect to the magnetic field. In other words, we can see from the spectrum whether the sample is a monodomain or not, and if not then the form of the director distribution can be determined given the aid of some theoretical prediction for the distribution function. So, when the director field is inhomogeneous, the NMR spectrum is a superposition of the elementary doublets I ( ν , θ ) weighted by the probability density f ( θ ) of finding a director with orientation θ . Accordingly, the full spectrum is given by [4]
I ( ν ) = π π f ( θ ) I ( ν , θ ) sin θ d θ ,
where I ( ν , θ ) denotes the shape of a spectral line centred at either ν + ( θ ) or ν ( θ ) and with a linewidth σ ( θ ) . For the simple model with Gaussian lineshapes the form of the elementary doublet associated with the orientation θ is defined by
I ( ν , θ ) = ± 1 2 π σ ( θ ) exp ν ν ± ( θ ) 2 2 σ 2 ( θ ) ,
where the angular dependent resonance frequency is
ν ± = ν 0 ± Δ ν 0 2 P 2 ( cos θ ) .
In the spectral simulations it is convenient to set the central frequency, ν 0 , coming from the Zeeman splitting to zero. The linewidth form σ is defined as
σ ( θ ) = σ 0 + σ 2 P 2 ( cos θ ) + σ 4 P 4 ( cos θ ) ,
where P 2 L ( cos θ ) ( L = 1 , 2 ) are the Legendre polynomials of rank L. There are a number of mechanisms which contribute to the width of a spectral line for deuterons. One of them is the deviation of the director distribution from a monodomain. Consider here for illustration a simple form [4,6]
f ( θ ) = ξ 2 ξ ( ξ 1 ) cos 2 θ 3 .
This function f ( θ ) is normalized in the range between π and π , and the parameter ξ controls the uniformity of the director distribution prior to the application of the electric field; when ξ is unity, the director is randomly distributed and as ξ , the distribution tends to the Dirac delta function.
Having obtained the evolution of the angle θ x , z = 0 , τ , for instance, during the turned-off process ( E = 0 ) along the length of the dimensionless nematic film ( 10 x 10 ) and for a number of dimensionless times τ = 2 (22), 6 (26), 8 (28), 12 (32) and 20 (40) (see Figure 11), respectively, we can calculate the evolution of the spectra I ( ν ) during the turned-off process. Calculated time-resolved 2 H spectra I ( ν ) for a turned-off process in 5CB nematic film at 14.8 C shows nonuniform director relaxation from being almost parallel to the electric field ( U = 200 V ) to being parallel to the magnetic field ( B = 7 . 05 T ), for a number of dimensionless times τ = 2 (22), 6 (26), 8 (28), 12 (32) and 20 (40) [17], respectively, as shown in Figure 14. Here were used σ 0 = 1 . 14 , σ 2 = 0 . 523 , and σ 4 = 1 . 14 kHz [17], respectively. The spectral range used in the simulation is taken to be 40 kHz ν 40 kHz.
“Such reorientation during the turned-off process has a typical NMR signature: the initial quadrupolar doublet characterizing the initially aligned nematic sample gives rise to an additional broad doublet with time-dependent splitting while simultaneously the initial doublet with constant splitting progressively vanishes (see in the Figure 14 during the first time terms up to 10 (∼13 ms)). In this case, removing of the strong electric field gives rise to the appearance of a new doublet that progressively grows with constant splitting so that the total spectral intensity is essentially transferred from the initial doublet to the new one, with double quadrupolar splitting. These results strongly suggest that the nonuniform director distribution relaxes to the uniform one, parallel to the magnetic field.” [17].
The simulated (case I) and measured (case II) spectra are compared in Figure 15. The solid curves in Figure 15 show a series of time-resolved deuterium NMR spectra of 5CB- d 2 for the turned-off alignment processes recorded at 15 C for α = 89 . 7 , whereas the dotted curves show the series of I ( ν ) for the turned-off alignment process obtained theoretically. At 5.2 ms ( τ = 4 ) after the electric field was removed the spectrum is still almost identical with its initial form. In case I, at 10.4 ms ( τ = 8 ), after removing the electric field, the dominant spectral lines are sharper indicating that the director is now aligned close to the magnetic field, whereas in case II there is still a small amount of the nematic for which the director is aligned close to its initial form. After 13 ms ( τ = 10 ), in both cases I and II, the director continues to move towards the magnetic field direction which finally was achieved after 15.6 ms ( τ = 12 ), after removing of the electric field. The results of comparison show that the complete reorientation of the director s field in both cases I and II occurs approximately in the same time and the director distribution starts and finishes in a uniform state but between these two extremes the distribution is markedly, at least in case I, nonuniform. So, the theoretical analysis, based on the predictions of hydrodynamic theory including both the director motion and fluid flow, provides an evidence for the appearance of the spatially periodic patterns in response of the suddenly applied electric field and provides the reasonable description of both the director s and spectral evolution.

3. Conclusions

In this article we describe some illustrative seminal studies of the field-induced peculiarities in the director reorientation for low molar mass nematics encapsulated in the microsized nematic volume. The most interesting feature of such configuration is that the state of the LC system becomes unstable after applying the strong electric field E . The theoretical analysis of the reorientational dynamics in the microsized nematic volume, based on continuum theory, which includes both the director motion and the fluid flow, provides an evidence for the appearance of spatially periodic patterns in response to a suddenly applied large electric field E directed at the angle α to the magnetic field B . The novelty of this approach is that the periodic distortion arises spontaneously from a homogeneously aligned nematic sample that ultimately induces a faster response than in the uniform mode. The nonuniform rotational modes involve additional internal elastic distortions of the conservative nematic system and, as a result, these deformations decrease the viscous contribution U vis to the total energy U of the nematic phase. In turn, that decreasing of U vis leads to decrease of the effective rotational viscosity coefficient γ eff ( α ) . That is, a lower value of γ eff ( α ) , which is less than one in the bulk nematic phase, gives the less relaxation time τ on ( α ) γ eff ( α ) , when α is bigger than the threshold value α th . The results obtained by Deuterium NMR spectroscopy confirm theoretically obtained dependencies of τ on ( α ) on α . When the values of α are less then α th , the director reorientation can be described by the torque balance equation for a monodomain nematic, as observed in experiments [4,11].

Funding

This work was supported by the Ministry of Education and Science of the Russian Federation (Grants No. 3.11888.2018/11.12 and 3.9585.2017/8.9).

Conflicts of Interest

The authors declare no conflict of interest.

References

  1. Dong, R.Y. Nuclear Magnetic Resonance of Liquid Crystals, 2nd ed.; Springer-Verlag: New York, NY, USA, 1997. [Google Scholar]
  2. Domenici, V.; Geppi, M.; Veracini, C. NMR in chiral and achiral smectic phases: Structure, orientational order and dynamics. Prog. Nucl. Mag. Res. Spectr. 2007, 50, 1–50. [Google Scholar] [CrossRef]
  3. Sugimura, A.; Luckhurst, G.R. Nuclear Magnetic Resonance Spectroscopy of Liquid Crystals; Dong, R.Y., Ed.; World Scientific Publishing Co.: Singapore, 2009; Chapter 10. [Google Scholar]
  4. Sugimura, A.; Luckhurst, G.R. Deuterium NMR investigations of field-induced director alignment in nematic liquid crystals. Prog. Nucl. Mag. Res. Spectr. 2016, 94–95, 37–74. [Google Scholar] [CrossRef] [PubMed]
  5. Fan, S.M.; Luckhurst, G.R.; Picken, S.J. A deuterium nuclear magnetic resonance investigation of orientational order and director kinetics in aramid solutions. J. Chem. Phys. 1994, 101, 3255–3267. [Google Scholar] [CrossRef]
  6. Luckhurst, G.R.; Miyamoto, T.; Sugimura, A.; Timimi, B.A. Director reorientation processes in a monodomain thin nematic liquid crystal film: A deuterium NMR spectroscopy study. J. Chem. Phys. 2002, 117, 5899–5907. [Google Scholar] [CrossRef]
  7. Luckhurst, G.R.; Sugimura, A.; Timimi, B.A.; Zimmermann, H. NMR determination of the physical properties of nematics. Liq. Cryst. 2005, 32, 1389–1396. [Google Scholar] [CrossRef]
  8. Hamasuna, D.; Luckhurst, G.R.; Sugimura, A.; Timimi, B.A.; Usami, K.; Zimmermann, H. Deuterium NMR spectra of a monodomain nematic: Angular dependence of the linewidths. Thin Solid Films 2008, 517, 1394–1401. [Google Scholar] [CrossRef]
  9. Cifelli, M.; Frezzato, D.; Luckhurst, G.R.; Moro, G.J.; Sugimura, A.; Veracini, C. Angular dependence of 2H-NMR longitudinal spin relaxation in aligned nematic 4-n-pentyl-4- cyanobiphenyl: Molecular rotation and director fluctuations. Liq. Cryst. 2010, 37, 773–784. [Google Scholar] [CrossRef]
  10. Martins, A.F.; Veron, A. Theory and numerical simulation of field-induced director dynamics in confined nematics investigated by nuclear magnetic resonance. Liq. Cryst. 2010, 37, 747–771. [Google Scholar] [CrossRef]
  11. Sugimura, A.; Zakharov, A.V. Field-induced periodic distortions in a nematic liquid crystal: Deuterium NMR study and theoretical analysis. Phys. Rev. 2011, E84, 021703. [Google Scholar] [CrossRef] [PubMed]
  12. Sugimura, A.; Vakulenko, A.A.; Zakharov, A.V. The effect of backflow on the field-induced director alignment process: Nuclear Magnetic Resonance study and theoretical analysis. Phys. Procedia 2011, 14, 102–114. [Google Scholar] [CrossRef] [Green Version]
  13. Kantola, A.M.; Luckhurst, G.R.; Sugimura, A.; Tanaka, T.; Timimi, B.A. Field-induced alignment of the nematic director: Studies of nuclear magnetic resonance spectral oscillations in the limit of fast director rotation. J. Chem. Phys. 2011, 135, 044501. [Google Scholar] [CrossRef]
  14. Hamasuna, D.; Luckhurst, G.R.; Sugimura, A.; Timimi, B.A.; Zimmermann, H. Director alignment by crossed electric and magnetic fields: A deuterium NMR study. Phys. Rev. 2011, E84, 011705. [Google Scholar] [CrossRef]
  15. Veron, A.; Sugimura, A.; Luckhurst, G.R.; Martins, A.F. Properties of the static NMR response of a confined thin nematic film of 5CB-d2 under crossed electric and magnetic fields: Theory and experiments. Phys. Rev. 2012, E86, 051708. [Google Scholar] [CrossRef]
  16. Hamasuna, D.; Hashim, R.; Luckhurst, G.R.; Sugimura, A.; Timimi, B.A.; Zimmermann, H. Macroscopic order in a nematic liquid crystal: Perturbation by spontaneous director fluctuations. Phys. Rev. E 2015, 91, 062502. [Google Scholar] [CrossRef]
  17. Zakharov, A.V.; Vakulenko, A.A. Field-induced director dynamics in confined nematic liquid crystals imposed by a strong orthogonal electric field. Phys. Rev. E 2013, 88, 022505. [Google Scholar] [CrossRef]
  18. Zakharov, A.V.; Maslennikov, P.V. Field-induced peculiarities in the dynamics of the director reorientation in confined nematic liquid crystals. Chem. Phys. Lett. 2018, 692, 285–290. [Google Scholar] [CrossRef]
  19. Zakharov, A.V.; Vakulenko, A.A. Dynamics of the periodic distortions in confined nematic liquid crystals imposed by a strong orthogonal electric field. J. Non-Newton. Fluid Mech. 2015, 217, 23–31. [Google Scholar] [CrossRef]
  20. Ericksen, J.L. Anisotropic Fluids. Arch. Ration. Mech. Anal. 1960, 4, 231–237. [Google Scholar] [CrossRef]
  21. Leslie, F.M. Some constitutive equations for liquid crystals. Arch. Ration. Mech. Anal. 1968, 28, 265–283. [Google Scholar] [CrossRef]
  22. Guyon, E.; Meyer, R.B.; Salan, J. Domain Structure in the Nematic Freedericksz Transition. Mol. Cryst. Liq. Cryst. 1979, 54, 261–273. [Google Scholar] [CrossRef]
  23. Lonberg, F.; Fraden, S.; Hurd, A.J.; Meyer, R.B. Field-Induced Transient Periodic Structures in Nematic Liquid Crystals: The Twist-Freedericksz Transition. Phys. Rev. Lett. 1984, 52, 1903–1906. [Google Scholar] [CrossRef]
  24. Martins, A.F.; Esnault, P.; Volino, F. Measurement of the Viscoelastic Coefficients of Main-Chain Nematic Polymers by an NMR Technique. Phys. Rev. Lett. 1986, 57, 1745–1748. [Google Scholar] [CrossRef] [PubMed]
  25. Zakharov, A.V.; Vakulenko, A.A. Dynamics of the modulated distortions in confined nematic liquid crystals. J. Chem. Phys. 2013, 139, 244904. [Google Scholar] [CrossRef] [PubMed]
  26. Zakharov, A.V.; Maslennikov, P.V. Field-induced stress response of nematics encapsulated in microsized volumes. Chem. Phys. Lett. 2017, 684, 212–218. [Google Scholar] [CrossRef]
  27. Sugimura, A.; Vakulenko, A.A.; Zakharov, A.V. Field-induced non-uniform director reorientation for a low molar mass nematic imposed by a strong orthogonal electric field. Thin Solid Films 2014, 554, 64–68. [Google Scholar] [CrossRef]
  28. Berezin, I.S.; Zhidkov, N.P. Computing Methods, 4th ed.; Clarendon: Oxford, UK, 1965. [Google Scholar]
  29. Samarskij, A.A.; Nikolaev, E.S. Numerical Method for Grid Equations; Birkhauser: Basel, Switzerland, 1988. [Google Scholar]
Figure 1. (a) The coordinate system used for analyzing the time-resolved NMR experiments and theoretical analysis. The x -axis is taken as being parallel to the magnetic field B and both electrodes. The electric field E and director n ^ make the angles α and θ , respectively, with the magnetic field B . (b) Three regimes of a voltage pulses.
Crystals 09 00262 g001
Figure 2. Two sets of time-resolved deuterium NMR spectra for the turned-on (a) and turned-off (b) experiments recorded for 5CB- d 2 at 15 C and α = 79 . 7 [11].
Crystals 09 00262 g002
Figure 3. Plot of the angle θ ( t ) vs. time t for the turned-on (a) and the turned-off (b) processes obtained for a number of values of α [11]. The symbols were obtained from the time dependence of Δ ν ( θ ) / Δ ν 0 ( P 2 ( cos θ ) ) , whereas the solid lines were obtained from the torque balance equation for a monodomain nematic.
Crystals 09 00262 g003
Figure 4. Plot of the functions τ ON ( α ) and τ OFF ( α ) (solid lines) vs. angle α , obtained from the torque balance equation for a monodomain nematic, whereas the symbols indicate the relaxation times obtained from the best-fits in Figure 3a,b, respectively.
Crystals 09 00262 g004
Figure 5. Plot of the dimensionless growth rate s q x d / π / s 0 vs. dimensionless wavelength q x d / π for a number of values of the voltage (a) U = 20 V and (b) U = 50 V [18], and for a number of values of the angle α : 0.157 (∼ 9 ) (curve (1)); 0.471 (∼ 27 ) (curve (2)); 0.785 (∼ 45 ) (curve (3)); 1.257 (∼ 72 ) (curve (4)), and 1.57 ( 90 ) (curve (5)), respectively.
Crystals 09 00262 g005
Figure 6. Plot of the growth rate s q x d / π in s 1 vs. dimensionless wavelength q x d / π under the effect of the voltage U = 200 V, calculated for a number of values of the angle α [11], same as in Figure 5.
Crystals 09 00262 g006
Figure 7. (a) Plot of the growth rate s q x d / π vs. dimensionless wavelength q x d / π obtained for a number of values of the anchoring strength W [11,18]: cases I (curve 1) and II (curve 2), as well as for the case of the strong anchoring (curve 3), respectively. (b) Same as Figure 6, but for a number of values of the angle α : 1.22 (∼ 70 )(curve (1)); 1.29 (∼ 74 )(curve (2)); 1.36 (∼ 78 )(curve (3)); 1.43 (∼ 82 )(curve (4)), and 1.50 (∼ 86 )(curve (5)), respectively.
Crystals 09 00262 g007
Figure 8. Plot of the dimensionless ERV coefficient γ eff α , W / γ 1 vs. the angle α for a number of values of the anchoring strength W [18].
Crystals 09 00262 g008
Figure 9. Plot of the evolution of the polar angle θ x , z = 0 , τ (a) and the velocity field v = u x , z = 0 , τ i ^ + w x , z = 0 , τ k ^ (b) to their equilibrium distributions along the length of the dimensionless nematic cell ( 10 x 10 ) [19], for a number of dimensionless times τ = 2, 4, 6, 8, and 10, respectively. In both cases (a) and (b) the evolutions are shown during the turned-on process ( E > 0 ), whereas the solid (curves 1) and the dash dotted (curves 2) lines are the calculated results for the vertical w x , z = 0 , τ and horizontal u x , z = 0 , τ components of v , respectively.
Crystals 09 00262 g009
Figure 10. Plot of the evolution of the polar angle θ x , z = 0 , τ to its equilibrium distribution along the length of the dimensionless nematic film ( 10 x 10 ) , for a number of dimensionless times τ = 2 (∼12 ms), 6 (∼36 ms), 8 (∼48 ms), 12 (∼72 ms), and 20 (∼0.12 s) [19], respectively. (a) shows the case B, while (b) shows the case A during the turned-on process ( E > 0 . In all these cases θ 0 = 0.01 (∼ 1 . 1 ) and α = 1.57 ( 89 . 96 ) ).
Crystals 09 00262 g010
Figure 11. Plot of the evolution of the polar angle θ x , z = 0 , τ to its equilibrium distribution along the length of the dimensionless nematic film ( 10 x 10 ) and for a number of dimensionless times τ = 2 (22), 6 (26), 8 (28), 12 (32) and 20 (40) [17], respectively. (a) shows the case B, while (b) shows the case A, respectively, during the turned-off process ( E = 0 ).
Crystals 09 00262 g011
Figure 12. Plot of the evolution of the polar angle θ x , z = 0 , τ to its equilibrium distribution along the length of the dimensionless nematic film ( 10 x 10 ) for a number of dimensionless times τ = 0(248), 2 (250), 4 (252), 6 (254), and 8 (256), respectively. (a) shows the case B, while (b) shows the case A during the turned-on process in the negative sense ( E < 0 ) [19]. In all these cases θ 0 = 0.01 (∼ 1 . 1 ) and α = 1.57 ( 89 . 96 ) ).
Crystals 09 00262 g012
Figure 13. The same as in Figure 12, but plot of the evolution of the polar angle θ x , z = 0 , τ to its equilibrium distribution along the length of the dimensionless nematic film ( 10 x 10 ) , for a number of dimensionless times τ = 0 (250), 2 (252), 4 (254), 6 (256), and 8 (258) [19], respectively.
Crystals 09 00262 g013
Figure 14. The deuterium NMR spectra I ( ν ) of 5CB-d 2 calculated for a number of times τ = 0 , 4 , 12 , 16 , and 20, both for the case of strong (a) and weak (b) anchoring, respectively. In both sets of spectra the solid lines show the turned-off process ( E = 0 ) [17].
Crystals 09 00262 g014
Figure 15. The deuterium NMR spectra I ( ν ) of 5CB-d 2 calculated (dotted curves) and measured (solid curves) for the turned-off process at 14.8 C.
Crystals 09 00262 g015
Table 1. The optimal values of the dimensionless wavelength q x max α as a function of both the angle α and the anchoring strength W [18].
α q max α ( Strong ) q max α ( Case I ) q max α ( Case II )
74 20.5 20.6 21.3
78 20.96 21.3 21.7
82 21.8 22.0 22.6
86 22.1 22.2 22.9
90 23.0 23.2 23.6

