In-Situ Synchrotron Profile Analysis after High-Pressure Torsion Deformation
by
 ,
,
Michael Kerber
1, 
Florian Spieckermann
2,
Roman Schuster
3,
Bertalan Joni
4,
Norbert Schell
5 and
Erhard Schafler
1,* 1
Faculty of Physics, University of Vienna, Vienna 1090, Austria
2
Chair of Materials Physics, Department of Material Science, University of Leoben, Leoben 8700, Austria
3
Department of Lithospheric Research, University of Vienna, Vienna 1090, Austria
4
Department of Materials Physics, Eötvös University Budapest, 1518 Budapest, Hungary
5
Deutsches Elektronen-Synchrotron DESY, 22607 Hamburg, Germany
*
Author to whom correspondence should be addressed.
Crystals 2019, 9(5), 232; https://doi.org/10.3390/cryst9050232
Submission received: 5 April 2019
/
Revised: 26 April 2019
/
Accepted: 26 April 2019
/
Published: 29 April 2019
(This article belongs to the Special Issue X-ray and neutron Line Profile Analysis of Microstructures)
Abstract
:The presence of hydrostatic pressure is a general crucial characteristic of severe plastic deformation methods for reaching high strains and for introducing large quantities of lattice defects, which are necessary to establish new grain boundaries. Insights into the processes occurring during deformation and the influence of hydrostatic pressure are necessary to help better understand the SPD methods. A special experimental procedure was designed to simulate the hydrostatic pressure release: High pressure torsion (HPT)-deformed microstructure changes related to the release of hydrostatic pressure after the HPT deformation of copper and nickel were studied by freezing the sample before releasing the pressure. High-resolution in-situ X-ray diffraction of the heating process was performed using synchrotron radiation in order to apply X-ray line profile analysis to analyze the pressure release. The results on copper and nickel generally indicated the influence of hydrostatic pressure on the mobility and interaction of deformation-induced defects as well as the resulting microstructure.
1. Introduction
Severe plastic deformation (SPD) imposes strains up to several orders of magnitude, which can be provided by special deformation techniques and tools. In addition to the principles of conventional plastic deformation, the presence of hydrostatic pressure is a key characteristic of most SPD methods. It is usually achieved with special tool designs that prevent the material from free flow. Additionally, iterative folding and deformation sequences feature a hydrostatic pressure component to some extent. All together these allow very high strains to be achieved, and subsequently enable the generation of extremely high amounts of lattice defects, which are responsible for grain fragmentation down to submicron- or even nanometer-scale.
The hydrostatic pressure also affects intrinsic material properties such as the Young’s modulus and the flow stress, and in [1] was estimated to increase the flow stress by 15% per 1 GPa pressure. In this adaption of a large-strain work hardening model [2,3,4], the enhanced hydrostatic pressure also increases the enthalpy of vacancy migration, which affects the annihilation of edge dislocations via its increment. Thus, a certain hydrostatic pressure p induces an extra work (p ) when a vacancy migrates through the lattice ( is the atomic volume), which increases the vacancy migration enthalpy. Thus, during the high-pressure torsion deformation process, the vacancy mobility is reduced and therefore the dynamic defect annihilation processes are as well. Furthermore, after the release of the hydrostatic pressure the migration enthalpy decreases again and the accumulated defects become more mobile and may interact and also annihilate.
2. Materials and Methods
2.1. In Principle Considerations
It is generally experimentally difficult to observe the evolution of the microstructure during the high-pressure torsion (HPT) process—both quantitatively and qualitatively. This can be circumvented by exploiting the consideration that lowering the temperature has a similar influence on the defect mobility as applying hydrostatic pressure.
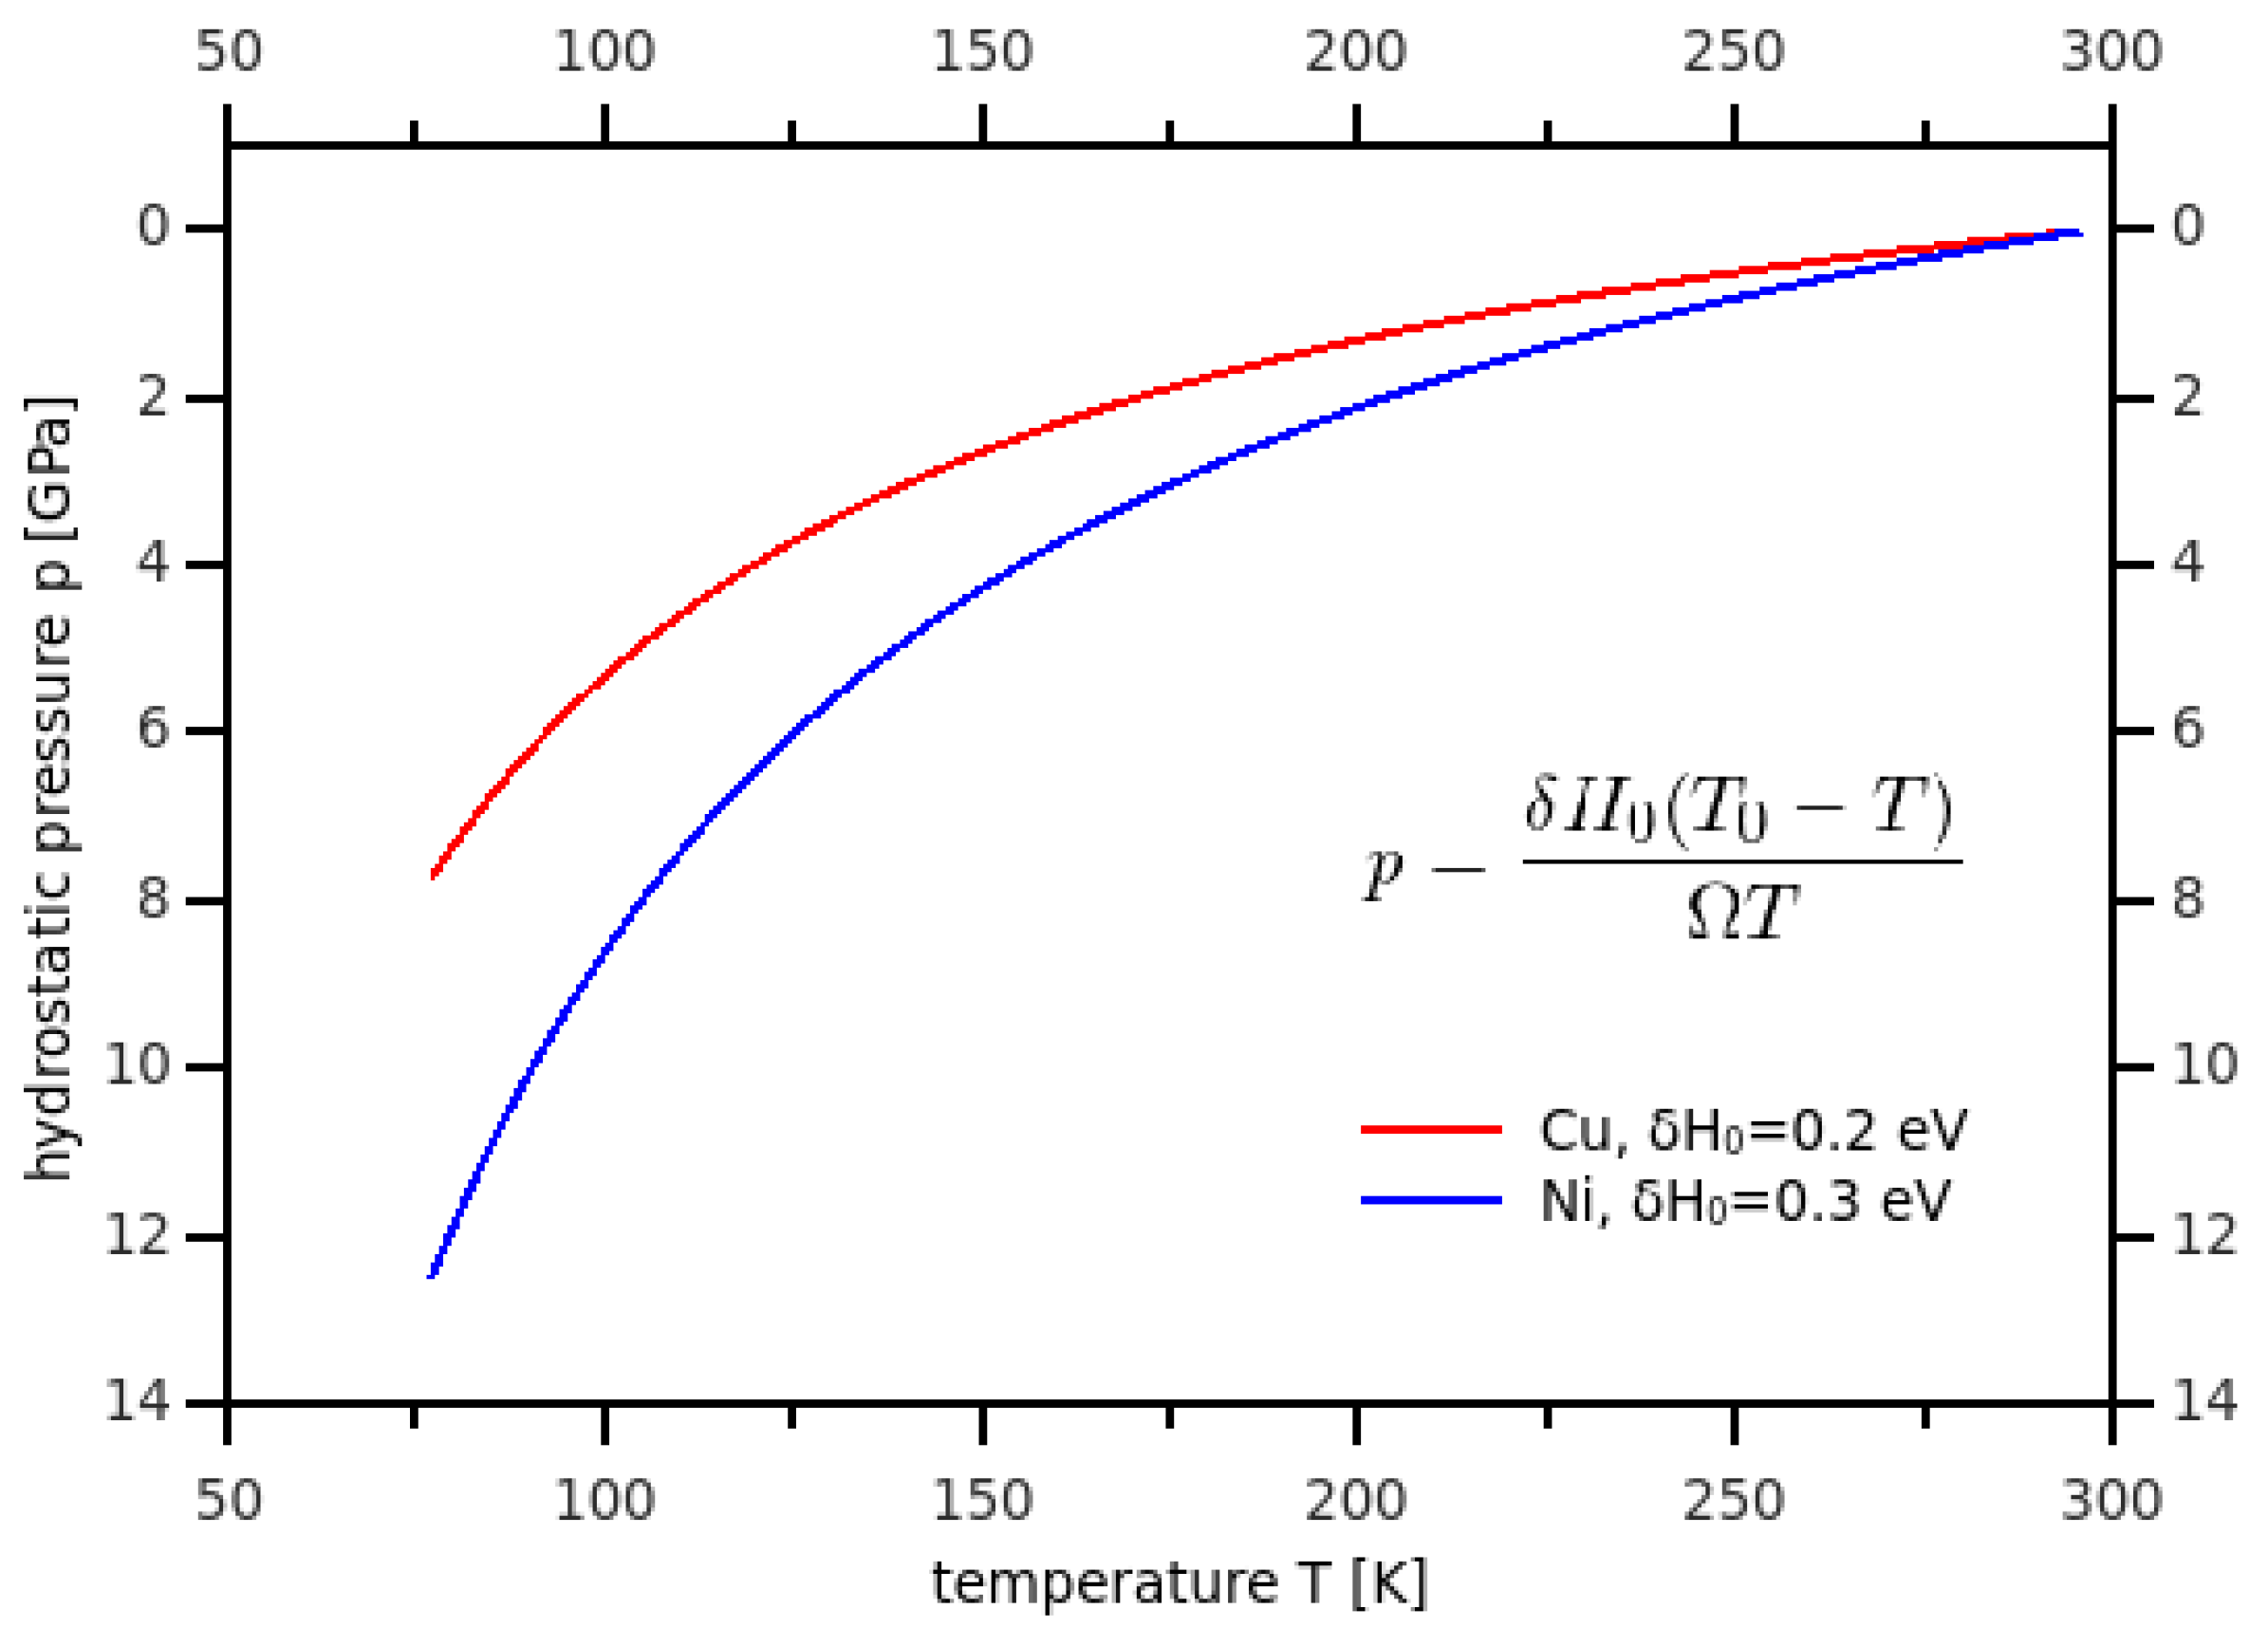
The mobility of vacancies is estimated to depend on , where is the enthalpy of vacancy migration of the material at ambient pressure, k is the Boltzmann constant, and T is the temperature. When applying a hydrostatic pressure p, this enthalpy has to be replaced by
where is the atomic volume. Now, one may vary the Arrhenius exponent by applying either pressure p or changing temperature T. When is room temperature, we can draw a pressure-to-temperature equivalence according to Equation (1) and the Arrhenius exponent as
This non-linear correlation is shown in Figure 1 for the investigated materials. The values of the vacancy migration enthalpy at ambient conditions were taken from [8,9] and were reduced to about 1/3 of the original values because vacancies in highly strained lattices are much more mobile by dislocation core diffusion, as was determined for Cu and Al in [2,10].
Note that for all figures in this publication, the hydrostatic pressure (release) is drawn on the x-axis as obtained by this equivalence.
Based on this background, the microstructural state can be “frozen” by cooling down the sample after the torsional deformation, but before releasing the hydrostatic pressure. The warming to room temperature during the investigation by means of X-ray diffraction corresponded to the pressure release at room temperature.
2.2. Materials and Methods
In this work Cu 99.99% and Ni 99.99% were investigated due to their role as “model” materials for the principle investigation of plastic deformation and the connected microstructural evolution. There are many well-understood post-deformation investigations on these materials, allowing us to focus on the changes originating from the pressure release.
Disc-shaped samples were deformed by high-pressure torsion (HPT) at 4 GPa and/or 8 GPa at room temperature by 1 and 1.5 rotations, respectively. The resulting strains at the investigated position of the samples were 25 and 35, respectively, where
N is the number of rotations, R is the radius of the investigated sample position, and d is the sample thickness. The most essential part of the deformation process was that after this torsional deformation under hydrostatic pressure, the pressure was maintained during cooling after the rotation was stopped. The sample together with the deformation tool was cooled down by liquid nitrogen. Then, at that temperature the pressure was released and the sample was exported cold to a liquid nitrogen transport/storage dewar and kept there until the X-ray diffraction experiment (thus ensuring that no changes in the microstructure occurred upon the pressure release ≡ temperature increase).
A self-designed cooling chamber was set up at the High Energy Materials Science beamline (P07) at PETRA III (HEMS), DESY, Hamburg. A procedure was developed to transfer the cooled sample from the liquid nitrogen bath onto the already-cooled low-temperature LINKAM TMS90 stage without intermediate warming-up and/or icing. The cooling stage could keep a minimum temperature of about 90 K. After the transfer and awaiting the thermal equilibrium (~1 min), diffraction patterns were recorded (1–2 s exposure time) by a two-dimensional Perkin Elmer XRD 1621 flat panel detector during a controlled increase of the temperature at a rate of 10 K/min up to room temperature. The X-ray energy and wavelength were 50 keV and nm, respectively. The X-ray beam size was 100 m × 200 m and the sample to detector distance was about 2.7 m and was refined during the integration method of the Debye–Scherrer ring sectors using the FIT2D-software package.
2.3. Evaluation
X-ray Line Profile Analysis (XPA)
The method of X-ray line profile analysis (XPA) has been developed as a powerful tool for the characterization of microstructures either in the bulk or in loose-powder materials. The diffraction modeling and evaluation procedures as well as the experimental possibilities and techniques have been significantly improved. The new generation of X-ray generators, enhanced focusing and monochromatizing techniques, and last but not least the sources of the highly brilliant synchrotron radiation allow investigations even in highly distorted and/or plastically deformed materials at high temporal and spatial resolution. The ideal narrow diffraction patterns show numerous deviations which are related to the microstructure of the material, and are the subject of peak profile analysis. These deviations include: (i) Peak broadening, which originates from the finite sizes of crystallites and the presence of microstrains (-stresses), strain (stress) gradients, and/or chemical heterogeneities. (ii) Anisotropic peak broadening (including asymmetric peak shapes) arising from anisotropic crystallite shape, anisotropic strain, long-range internal (third order) strains (stresses), planar faults, or chemical heterogeneities [11,12,13,14,15,16].
According to the kinematic theory of scattering, diffraction profiles result from the convolution of the size (S) and distortion (D) profiles. The Fourier transform of this is the Warren–Averbach equation [17]:
in terms of Fourier coefficients , L being the Fourier length. One of the main challenges related to this equation is the way in which the size of Fourier coefficients, , and the mean square strain, , as the central part of the Fourier coefficient are interpreted (g is the diffraction vector). The dislocation model of takes into account that the contribution of a dislocation to strain broadening depends on its “contrast”—that is, the relative orientations between the diffraction vector g and the line and Burgers vectors of dislocations, l and b, respectively, in a similar way as the contrast of dislocations in electron microscopy. The anisotropic contrast can be described by contrast factors C, which can be calculated numerically on the basis of the crystallography of dislocations and the elastic constants of the crystal [17,18]. The expression for the strain Fourier coefficient then reads as:
where b is the Burgers vector, is the dislocation density, and is the outer cut-off radius of a dislocation.
State-of-the-art profile analysis uses physical modeling of the experimental data by least squares optimization algorithms [19,20,21]. Thus, it is possible to fit to the lower-order Fourier coefficients evaluated from the experimental data or even to compute the real space functions from the Fourier space models describing the broadened peaks. These functions are then fitted to the real space measured data directly. The latter method was applied in this work, whereas the starting fit parameters were varied in a wide range and the most frequent physical results with the lowest mean square error were considered [22].
As a result, the following fitting parameters describe the state of the material in terms of size and strain: the median m and variance of a log-normal function describing the size distribution of the coherently scattering domains (CSDs), the smallest volume representing a perfect, purely coherent scattering crystal. It should be noted that bimodal distributions and non-spherical crystallite shapes can also be modeled. Additionally, one obtains for the dislocation structure: the parameter q describing the average dislocation contrast, the dislocation density , and the outer cut-off radius , characterizing the extension of the strain field of the dislocations.
3. Results and Discussion
In the presentation of results and their discussion hereafter, the following expressions will be used to describe the sample/material treatment and condition:
Loaded state: The material was deformed by high-pressure torsion to a certain strain, then the torsion was stopped but the hydrostatic pressure was maintained—experimentally, this “deformed state under pressure” was conserved by cooling down the sample with liquid nitrogen, releasing the pressure after cooling, and then keeping it cooled there until the diffraction experiment.
Unloaded state: This refers to after the hydrostatic pressure was released—the material was slowly warmed from liquid nitrogen to room temperature—the in-situ diffraction experiments investigated this phase.
3.1. Copper
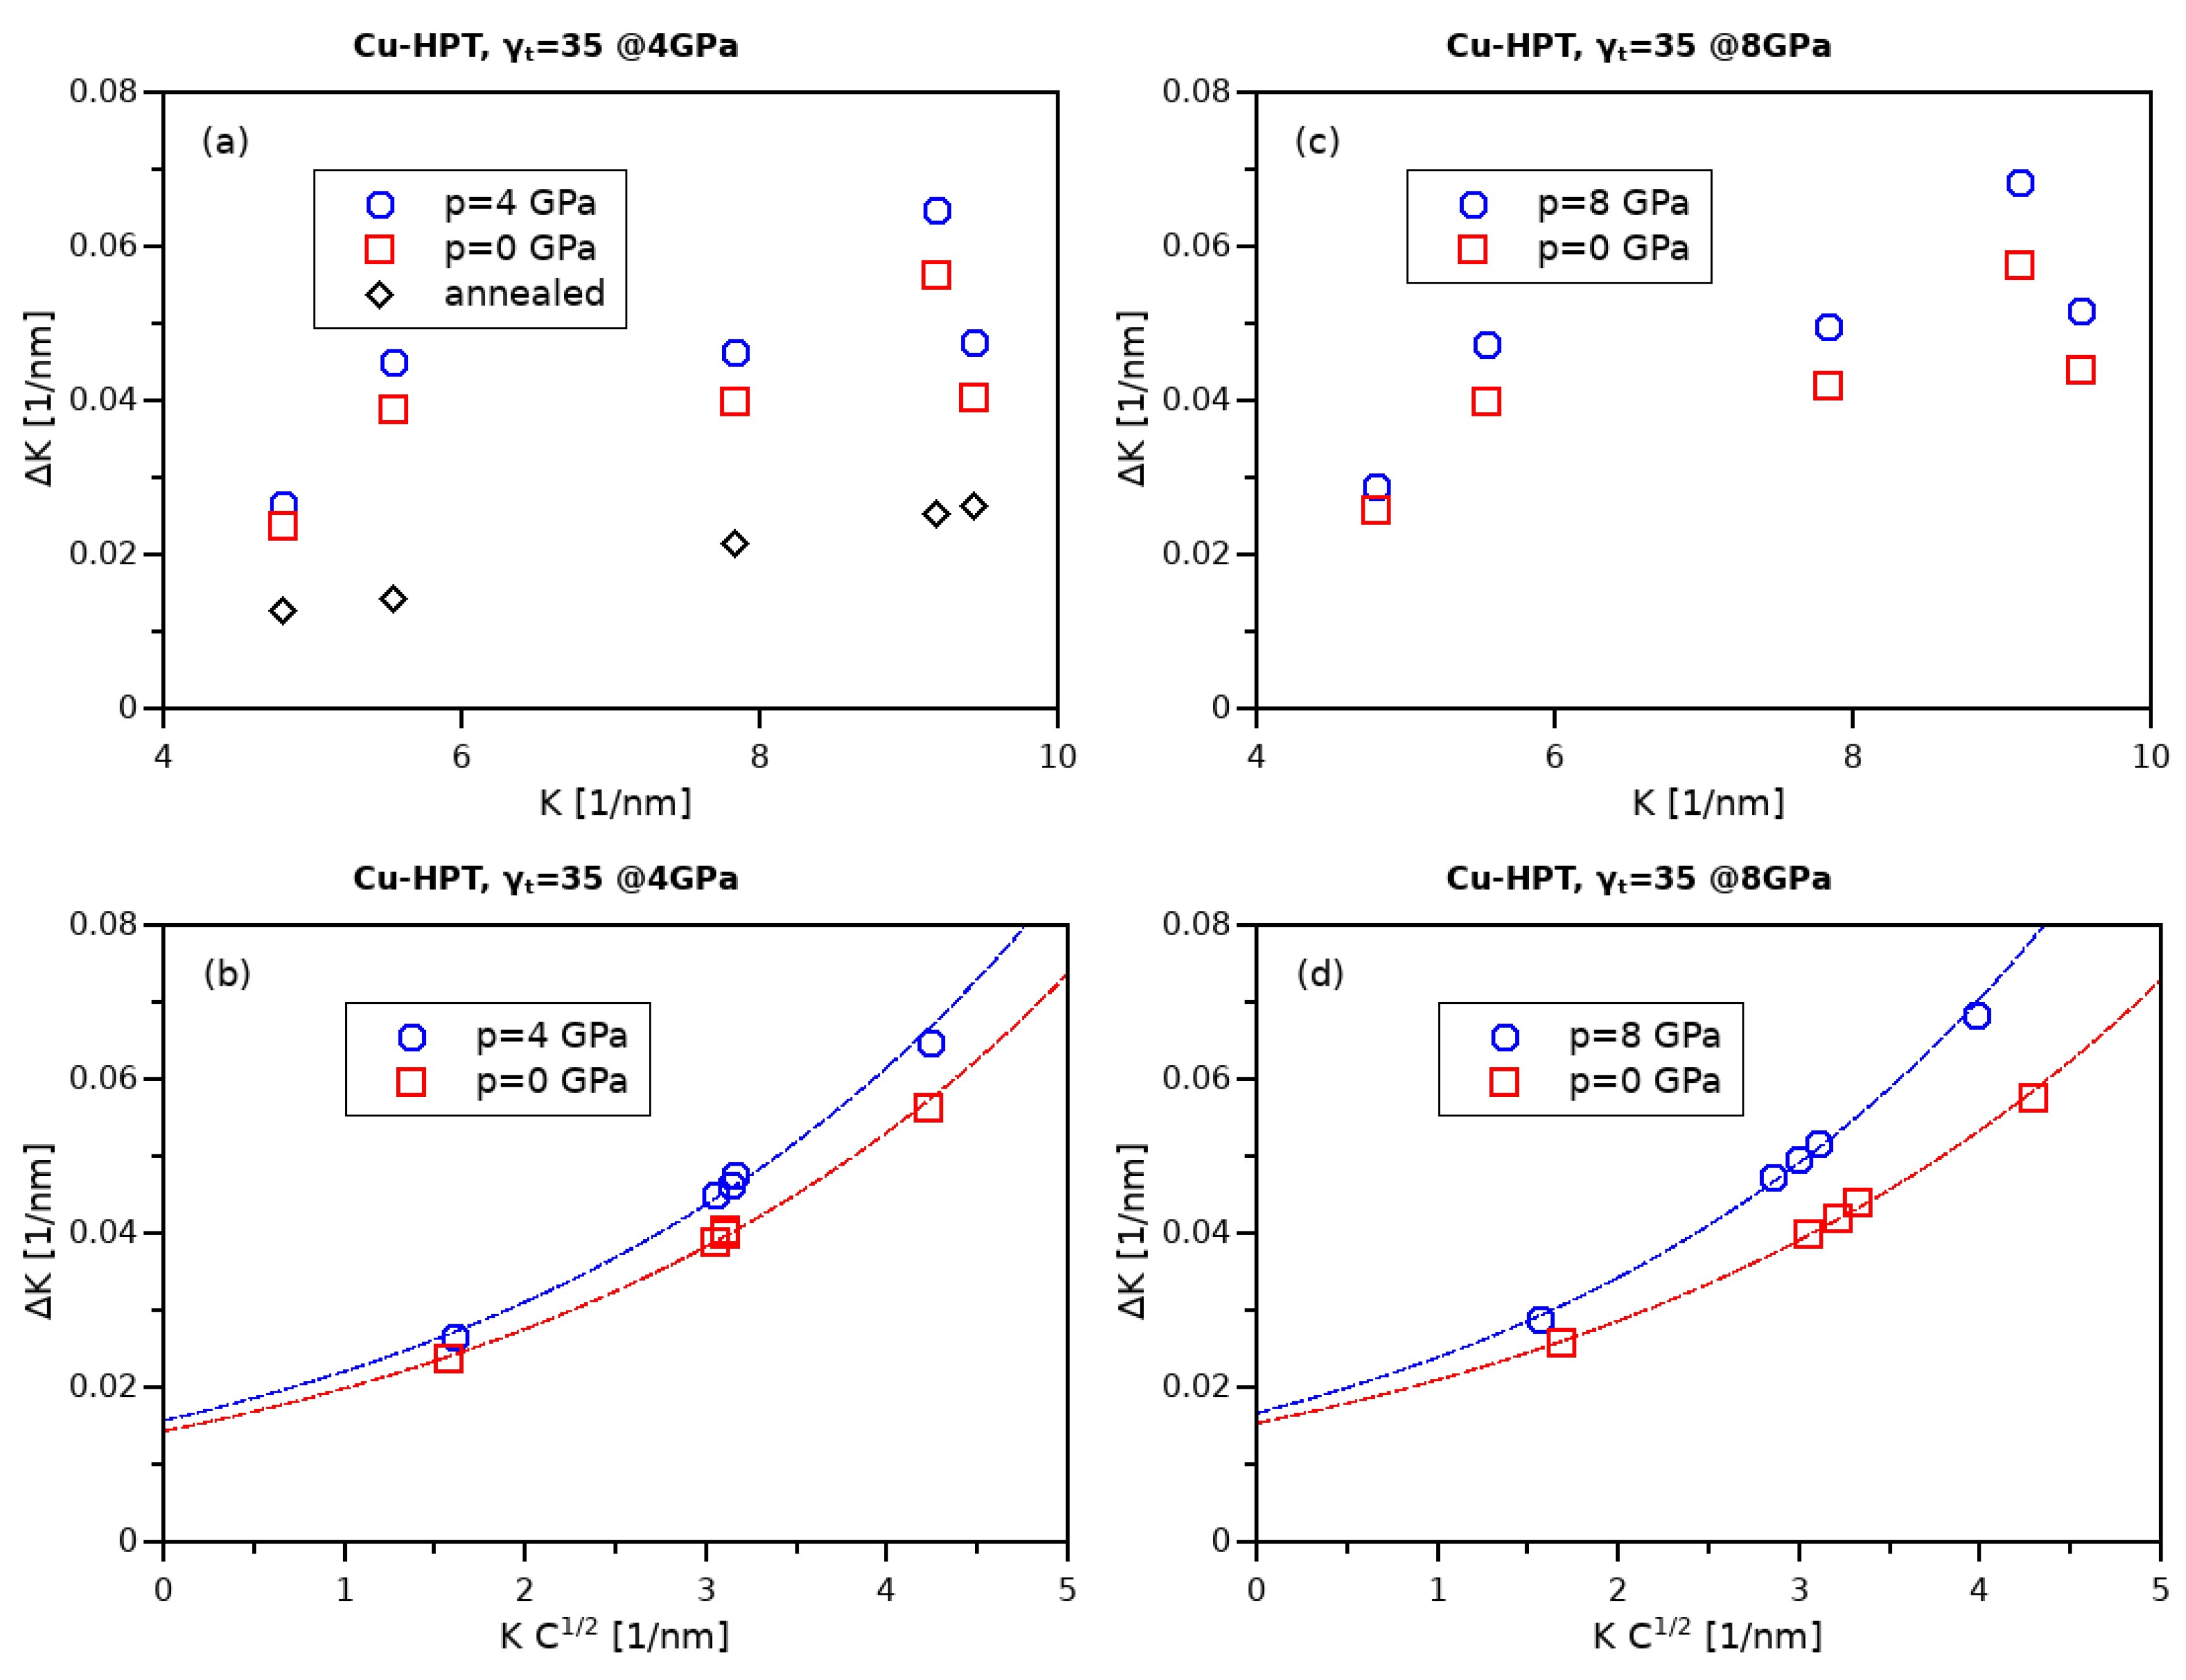
In Figure 2 the Williamson–Hall (WH) plot [23] and the modified Williamson–Hall (mWH) plot [24] are shown for the HPT-deformed copper at 4 and 8 GPa, respectively. Note that “ GPa” indicates the sample state after releasing the hydrostatic pressure (≡unloading). For the -values the integral breath of the line profiles was evaluated rather than the full-width at half maximum (FWHM) because the broadening of the peaks by dislocation-induced microstrains did not have a Gaussian character, but rather a Lorentzian one. The width obtained by the FWHM would thus be underestimated. In Figure 2 the qualitative effect of crystallite size (small size) and microstrain on the broadening of the X-ray line profile can be well identified. With the WH-plot, the strong elastic anisotropy of copper reveals a strongly non-monotonous increase of the versus K, where . When considering the elastic (strain) anisotropy in the mWH plot by taking the average dislocation contrast into account, the width usually followed a monotonous behavior, where the slope was qualitatively proportional to the microstrain (amount of dislocations) and the intersection at was inversely proportional to the crystallite (domain) size. Distinguishing the sample state under hydrostatic pressure (4 and 8 GPa) and after pressure release (0 GPa), the differences of the two measures can be seen in Figure 2b,d: the slope/curvature for the loaded sample state (under 4 and 8 GPa, respectively) was higher as compared to the unloaded state (0 GPa), which is equivalent to a higher dislocation density; the intercept of the curves with the y-axis at indicates a somewhat larger domain size after unloading.
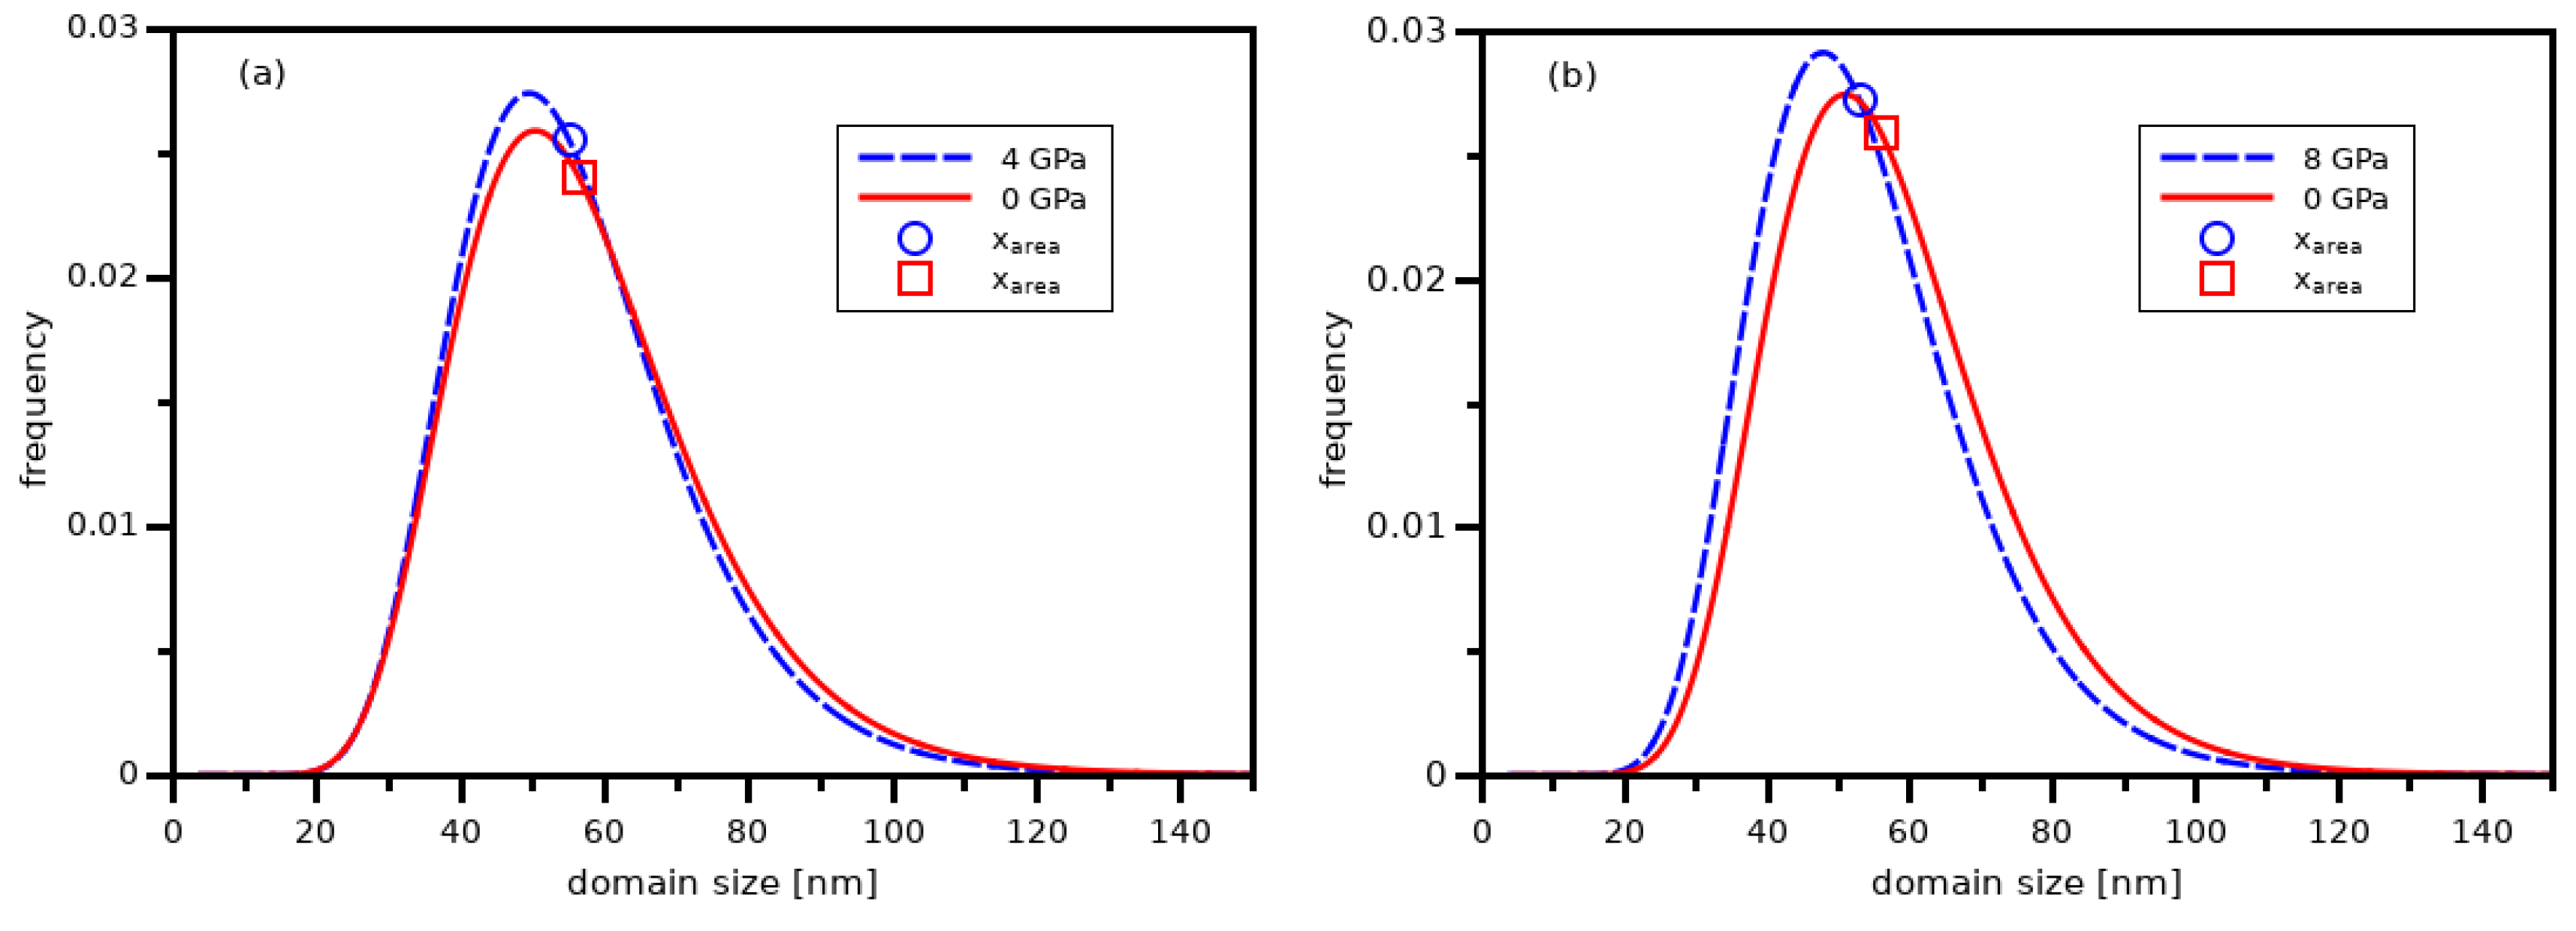
This average size could be obtained easily from the intersection by and yielded following values: 63 nm in the loaded and 69 nm in the unloaded state after 4 GPa, and 60 nm and and 65 nm, respectively, after 8 GPa deformation. This is in good agreement with previous investigations [6,7]. For better illustration of the principles of the method in Figure 2a, the integral breadths were measured when heating further to 475 K. In this highly strained material the deformation-induced defects were completely annealed/recrystallized; this has been investigated extensively by differential scanning calorimetry [25,26]. In Figure 2a it is obvious that the intercept at was much lower (growth of the domain size), the slope became quite smooth, and the non-monotonous behavior vanished, even in the classical WH plot, indicating the annihilation of dislocations due to the unloading/annealing treatment. In Figure 3 the corresponding log-normal size distribution of the coherently scattering domains obtained by convolutional multiple whole profile evaluation (CMWP) is shown [21]. From the median m and the variance , the area-weighted mean domain size was determined by [27] and indicated by the symbols. The values correspond nicely to the average sizes as determined by the modified Williamson–Hall analysis. In the following Figure 4, the referred domain sizes relate to this measure.
To put this peak-breadth-based analysis into perspective, one only has the first in-situ study of high-pressure torsion deformation by synchrotron radiation by Kilmametov et al. [28]. Copper powder was deformed and compacted by a constrained high-pressure torsion setup and the increase of the full width at half maximum (FWHM) was monitored by high-energy X-ray diffraction in situ. The relative change of the peak widths was up to 30% and grain refinement was then determined by TEM. The increase in the peak breadths compared to the present investigation was lower due to the lower hydrostatic pressure of about 500 MPa, but also showed a tendency of relaxation when the deformation was stopped.
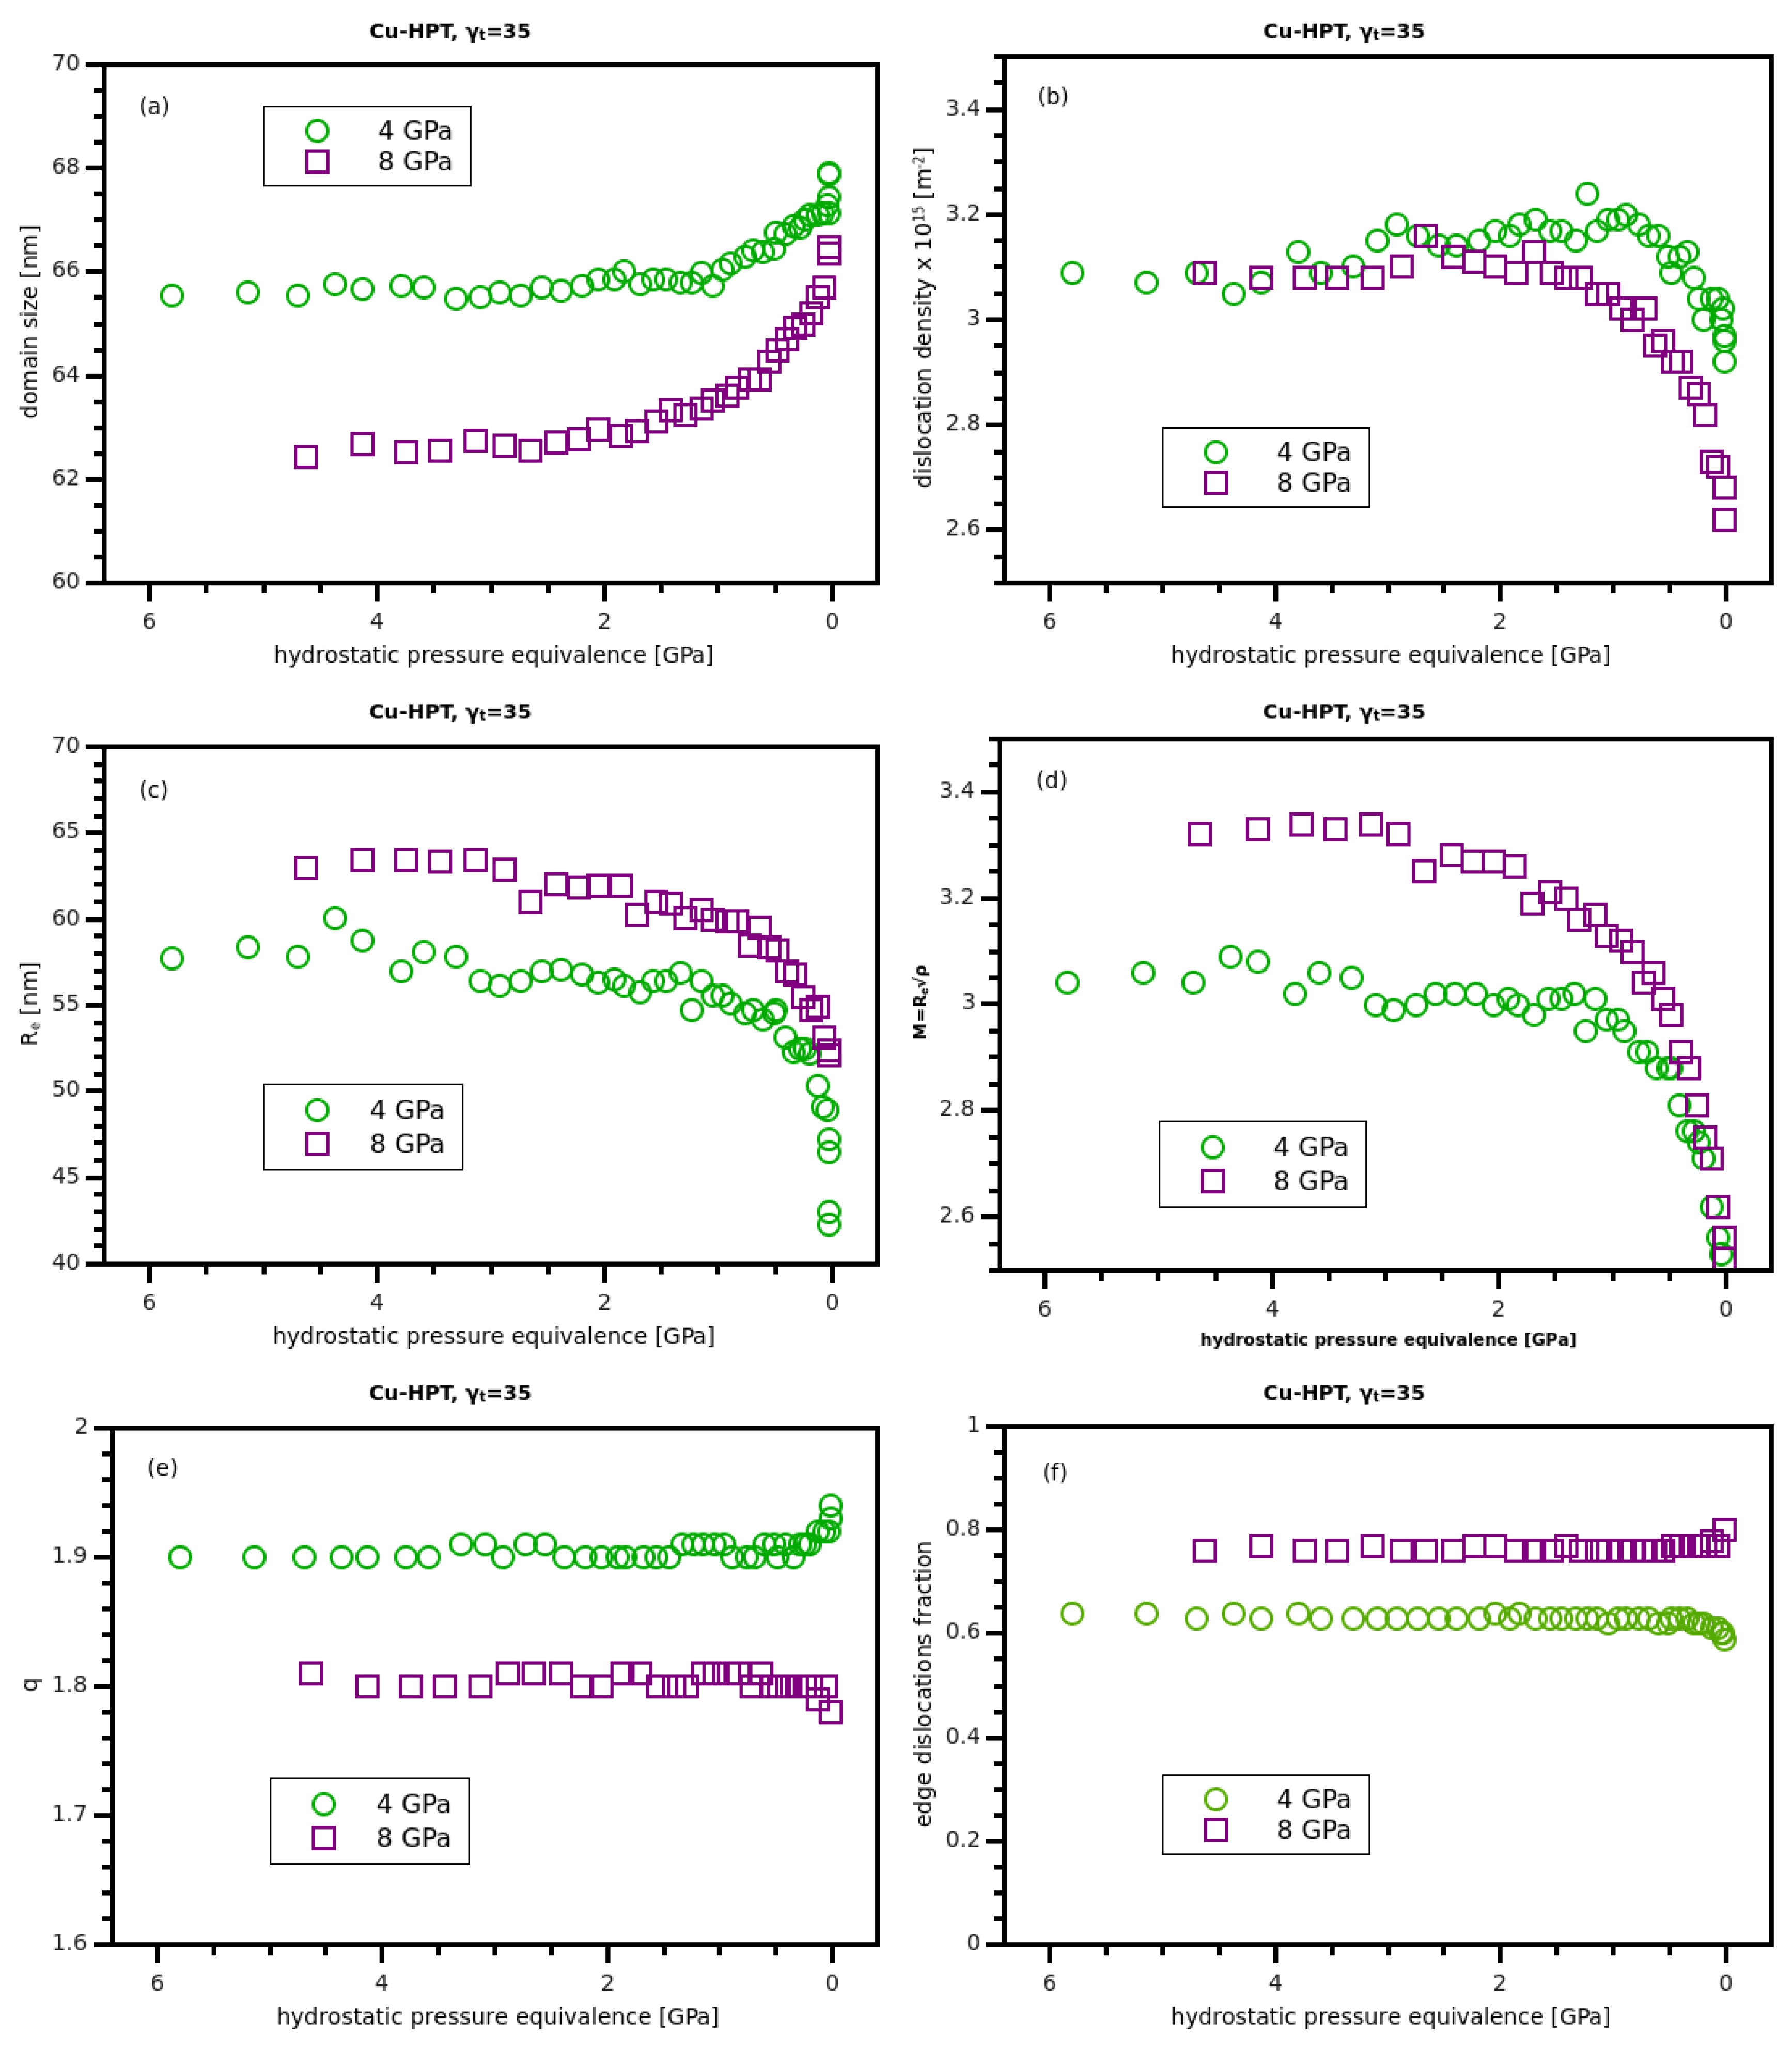
The evolution of the domain size during the unloading process investigated by in-situ diffraction is shown in Figure 4a; please remember that the pressure values drawn on the x-axis relate to the temperature as obtained from Equation (2). While the initial values during HPT deformation at 4 and 8 GPa did not differ strongly, the relative change when unloading the pressure was more interesting: while with 4 GPa deformation the size increase was about 2 nm (which started quite “late” at an unloading pressure of about 1 GPa), the 8-GPa-deformed sample showed a size increase of about 4 nm, beginning to grow at about 2 GPa. This behavior also agrees with the different evolution of the dislocation densities shown in Figure 4b, where the decrease for 8 GPa similarly started earlier and was stronger, while the initial dislocation densities were equal. This in principle means that the defect mobility not only depends on the effective migration enthalpy but also on internal stresses related to the defect structure, evolving somewhat differently with different applied hydrostatic pressures. This more stress-intensive arrangement of the defects could be identified by the outer cut-off radius of the dislocations shown in Figure 4c, which measures the extension of the dislocation strain field. The dislocation arrangement parameter M in Figure 4d is related to the cut-off radius of the dislocation density, and as both values determine the stored energy of a dislocation arrangement, a higher M value corresponds to higher internal stresses—another driving force during the unloading process.
The remaining physical parameter obtained from the profile analysis is related to the dislocation contrast; q in Figure 4e is related to the dislocation type and did not significantly change overall, while it was somewhat different for 4 and 8 GPa. Based on the theoretical q-values obtained in [18] for pure edge and pure screw dislocation, the screw/edge fractions could be determined from the experimental values. From Figure 4f it is obvious that this also did not change when unloading the pressure, while after HPT deformation at 8 GPa the dislocations had a somewhat stronger edge character.
3.2. Nickel
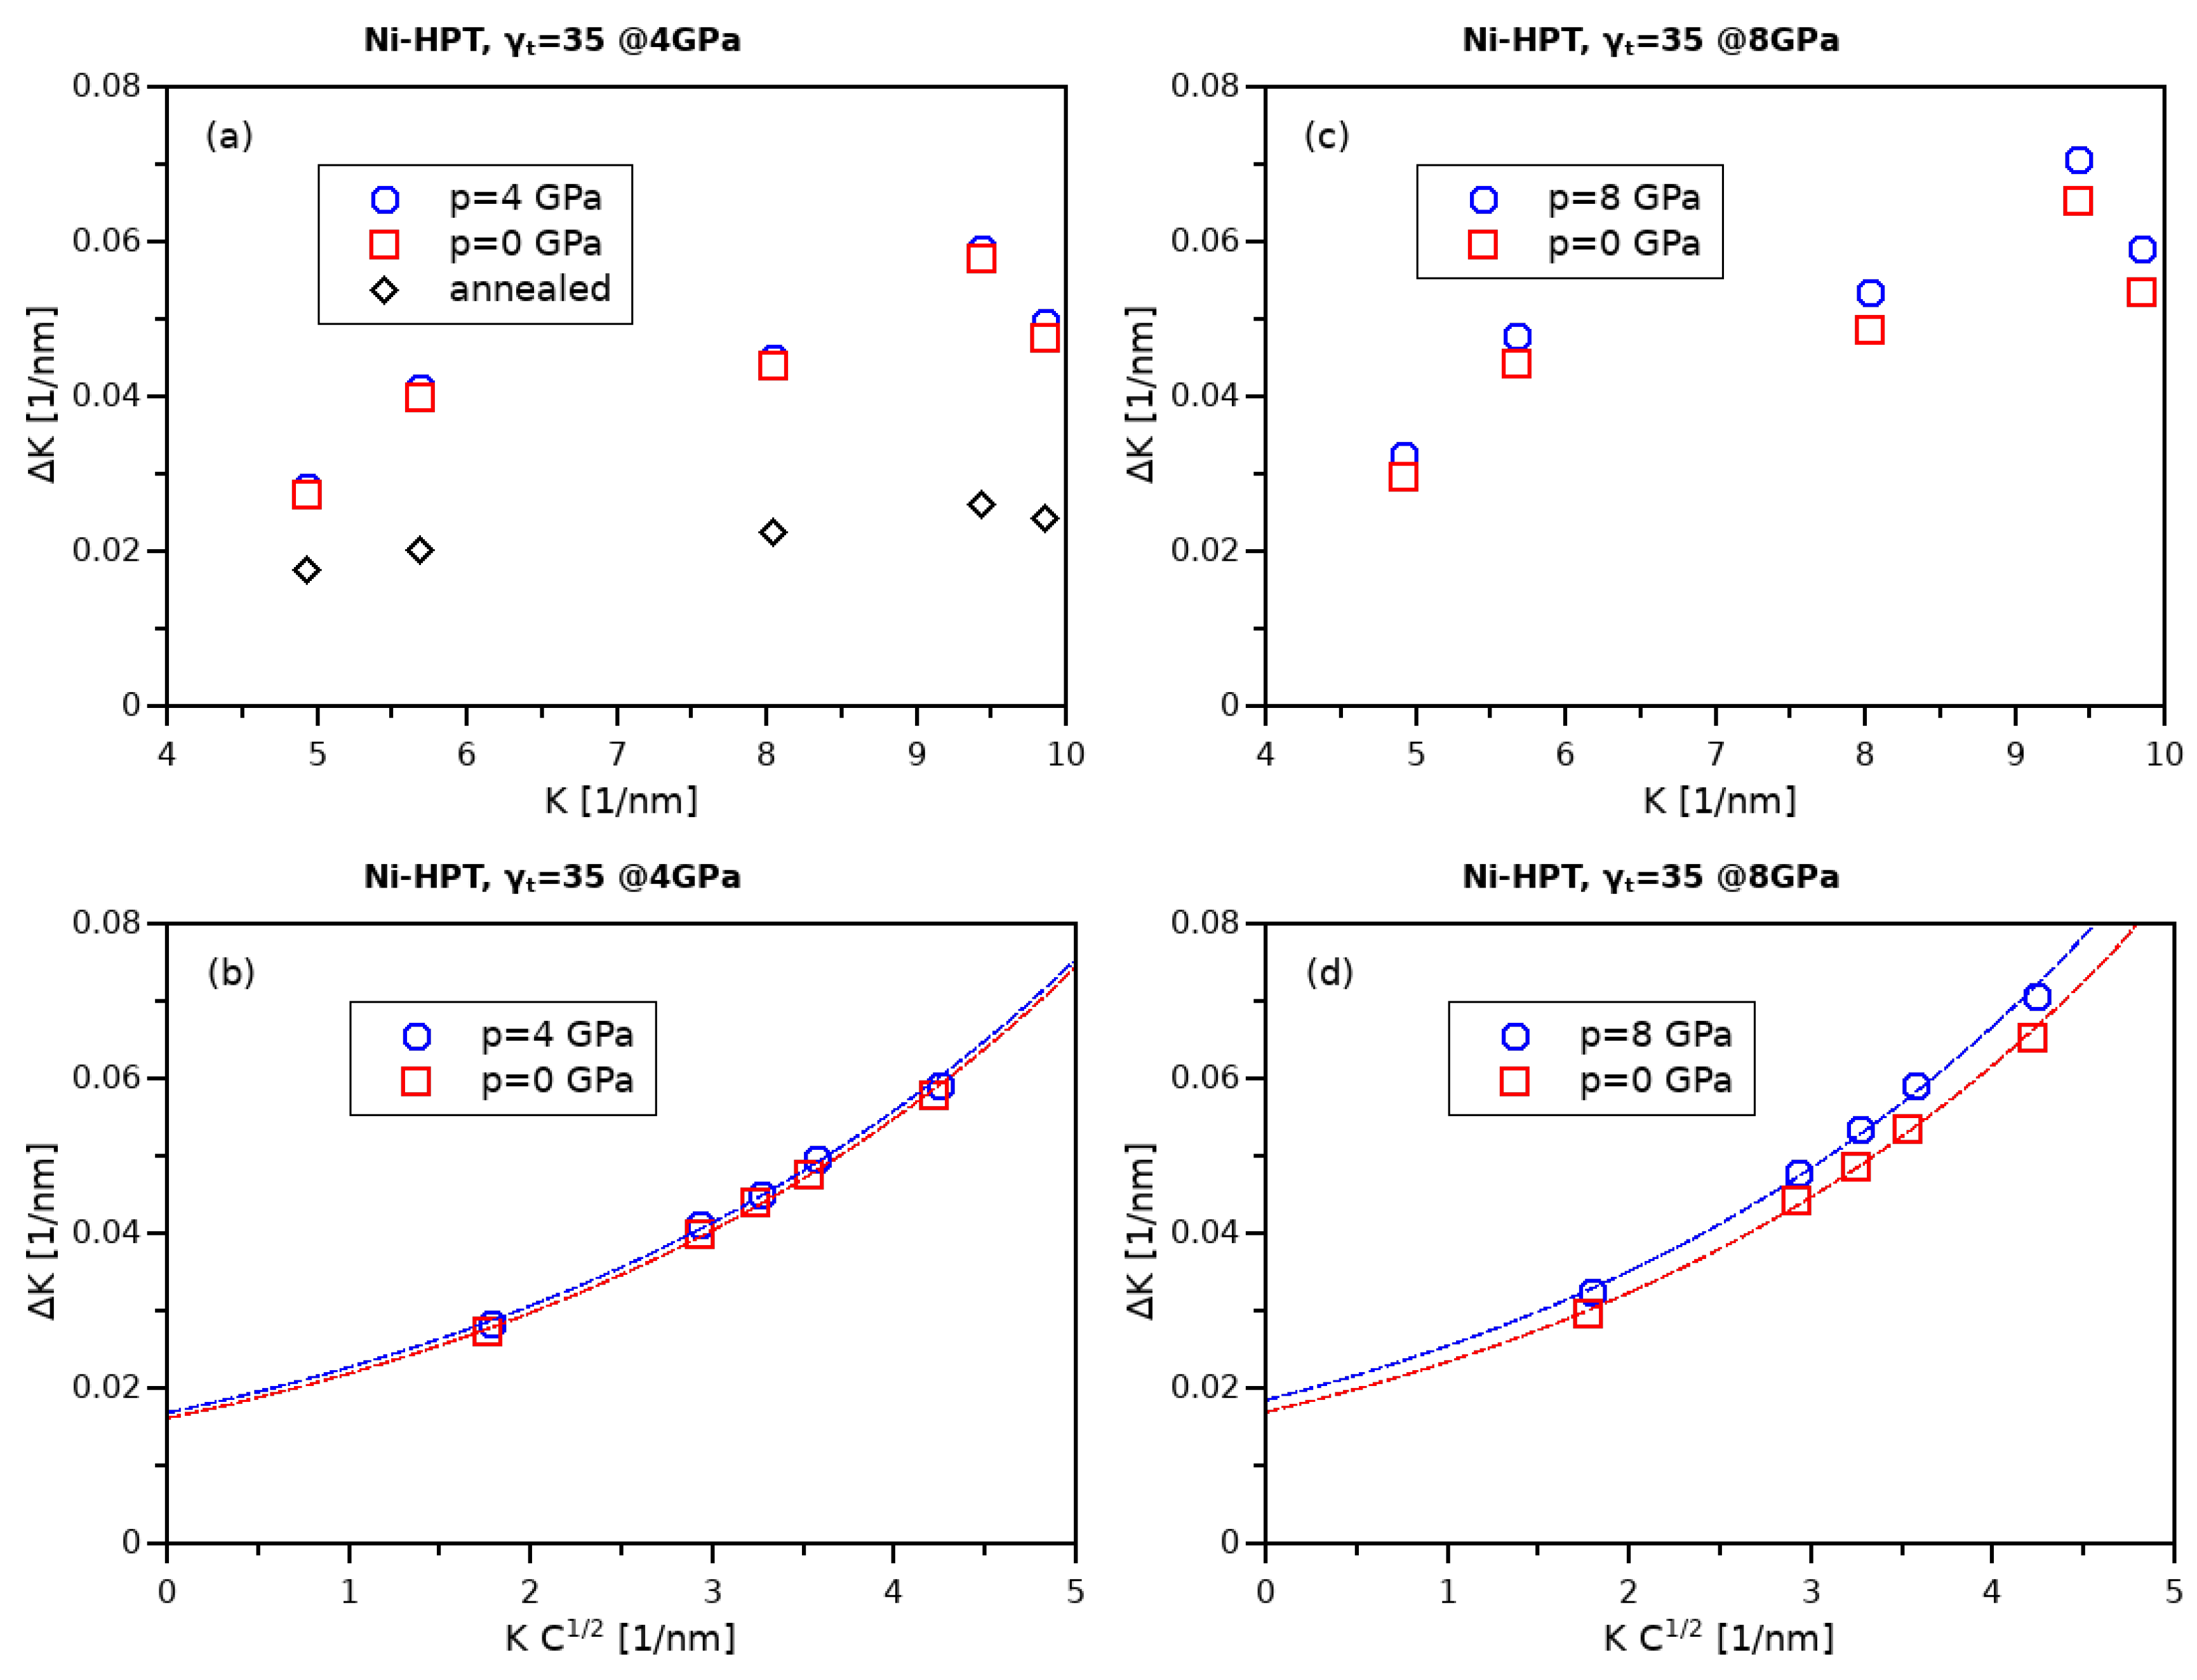
In Figure 5 the Williamson–Hall analysis of the “loaded” and “unloaded” states of Ni after HPT deformation to a strain at 4 and 8 GPa, respectively, is shown. In the conventional Williamson–Hall plots the elastic strain anisotropy is again obvious, although it is visibly weaker than with copper in Section 3.1. This is in perfect correspondence with the values of the anisotropy parameters [29] for Cu and Ni, which are 3.21 and 2.54, respectively.
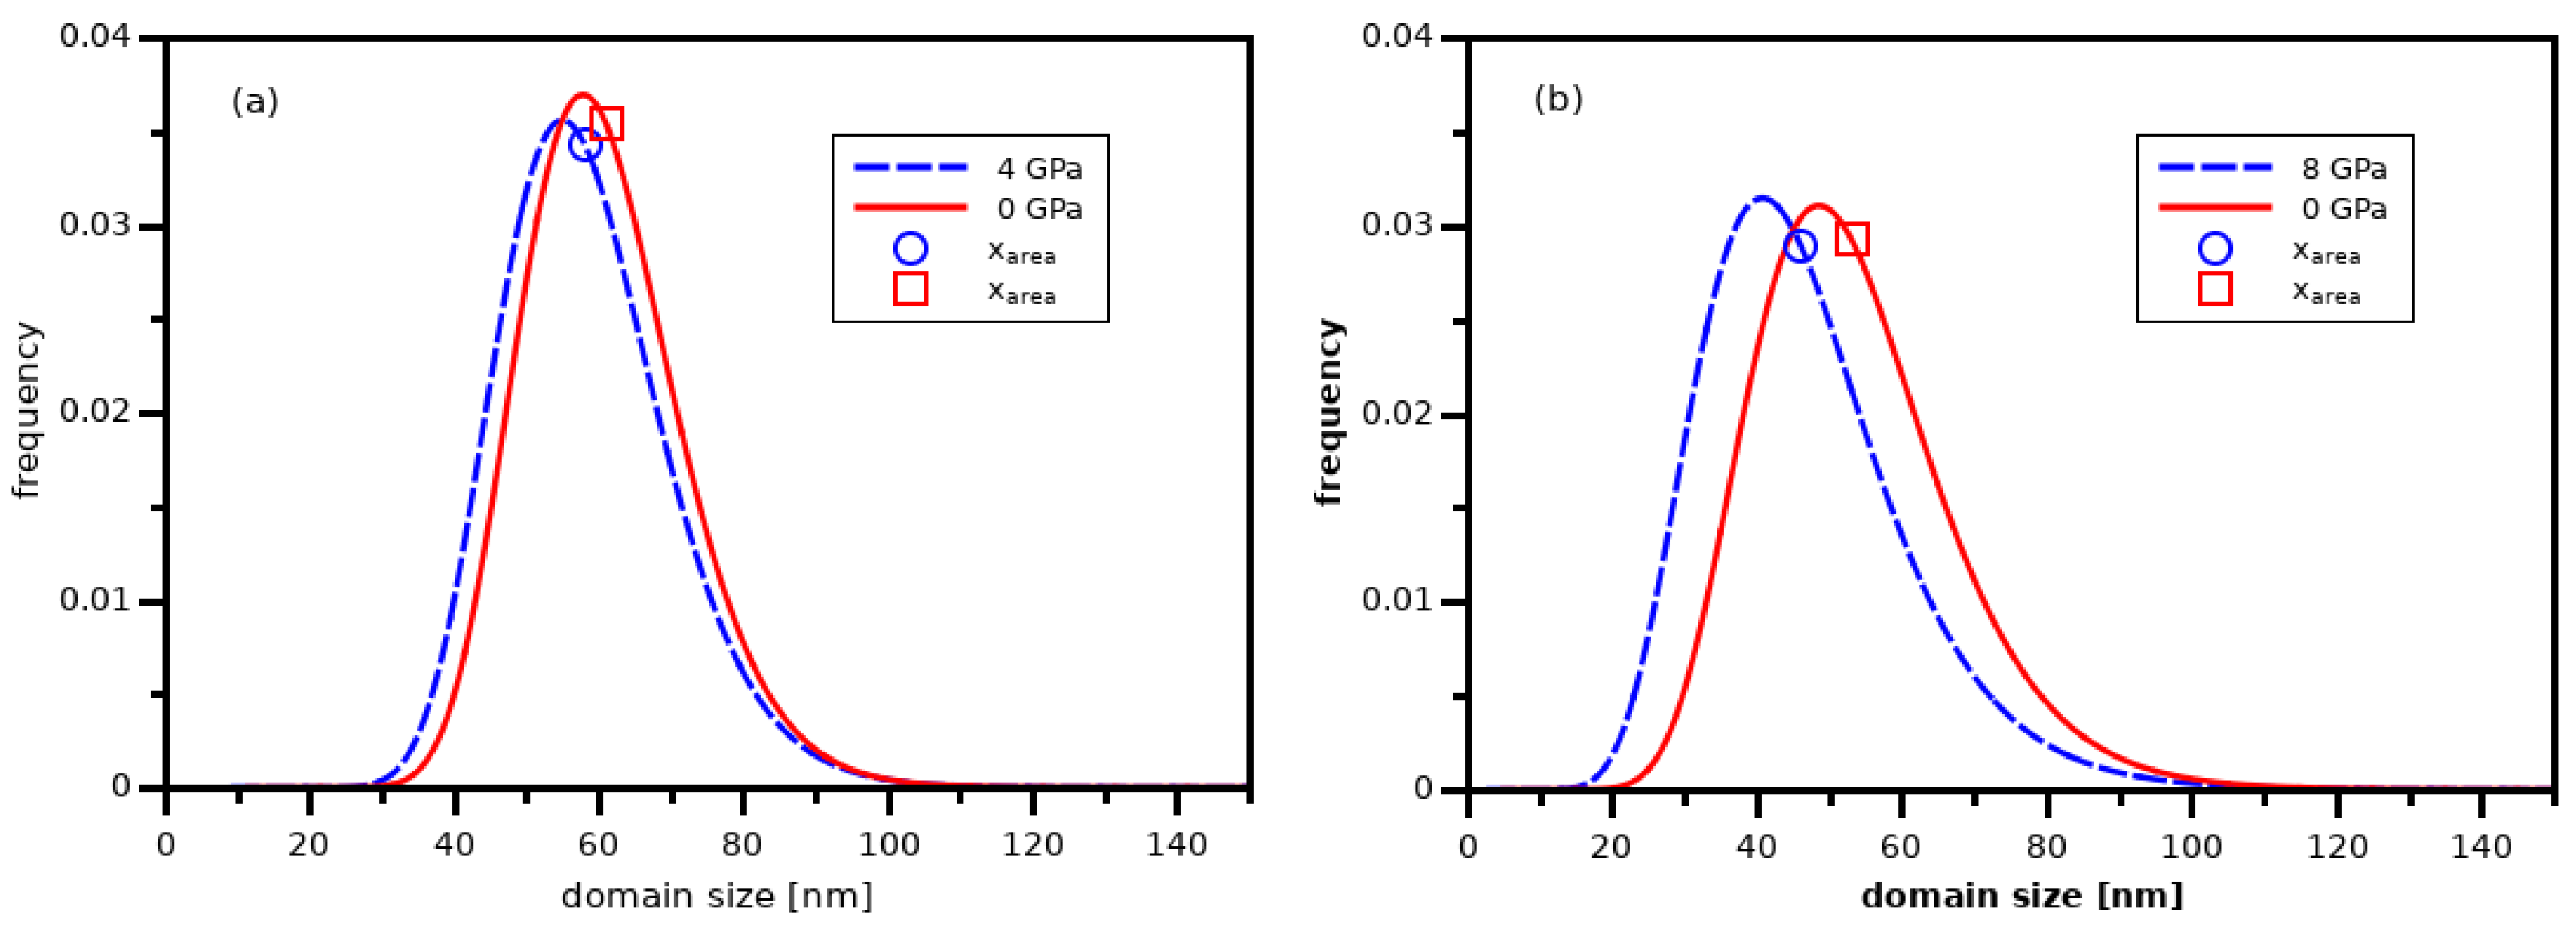
Qualitatively higher -values were evident after 8 GPa HPT deformation, and here also a principally stronger difference between “loaded” and “unloaded” states is apparent in the modified Williamson–Hall plot in Figure 5d, while after 4 GPa deformation the two curves in Figure 5b nearly coincide. The sample state after annealing at 498 K in Figure 5a indicates—as shown previously with copper—a vanishing of microstrains and thus also of strain anisotropy. For the average domain size, the behavior was similar: negligible difference for in “loaded” and “unloaded” states at 4 GPa deformation (59 and 62 nm, respectively); and somewhat more after 8 GPa (54 and 59 nm). This in principle also agrees with the area-weighted mean domain sizes resulting from the CMWP analysis, indicated by the symbol within the distribution curve. While for copper in Figure 3a and here for nickel deformed at 4 GPa (Figure 6a), the size distributions of the “loaded” and “unloaded” states were quite comparable. The difference of the size distributions of Ni deformed at 8 GPa was prominent: both distributions—“loaded” and “unloaded”—were generally broader than all before, and the curve for the “unloaded” condition was remarkably shifted to higher sizes. For this reason,the -values for the 8 GPa deformation differed considerably from the -values resulting from the simple Williamson–Hall analysis: the “loaded” and “unloaded” s were 46 and 53 nm, respectively.
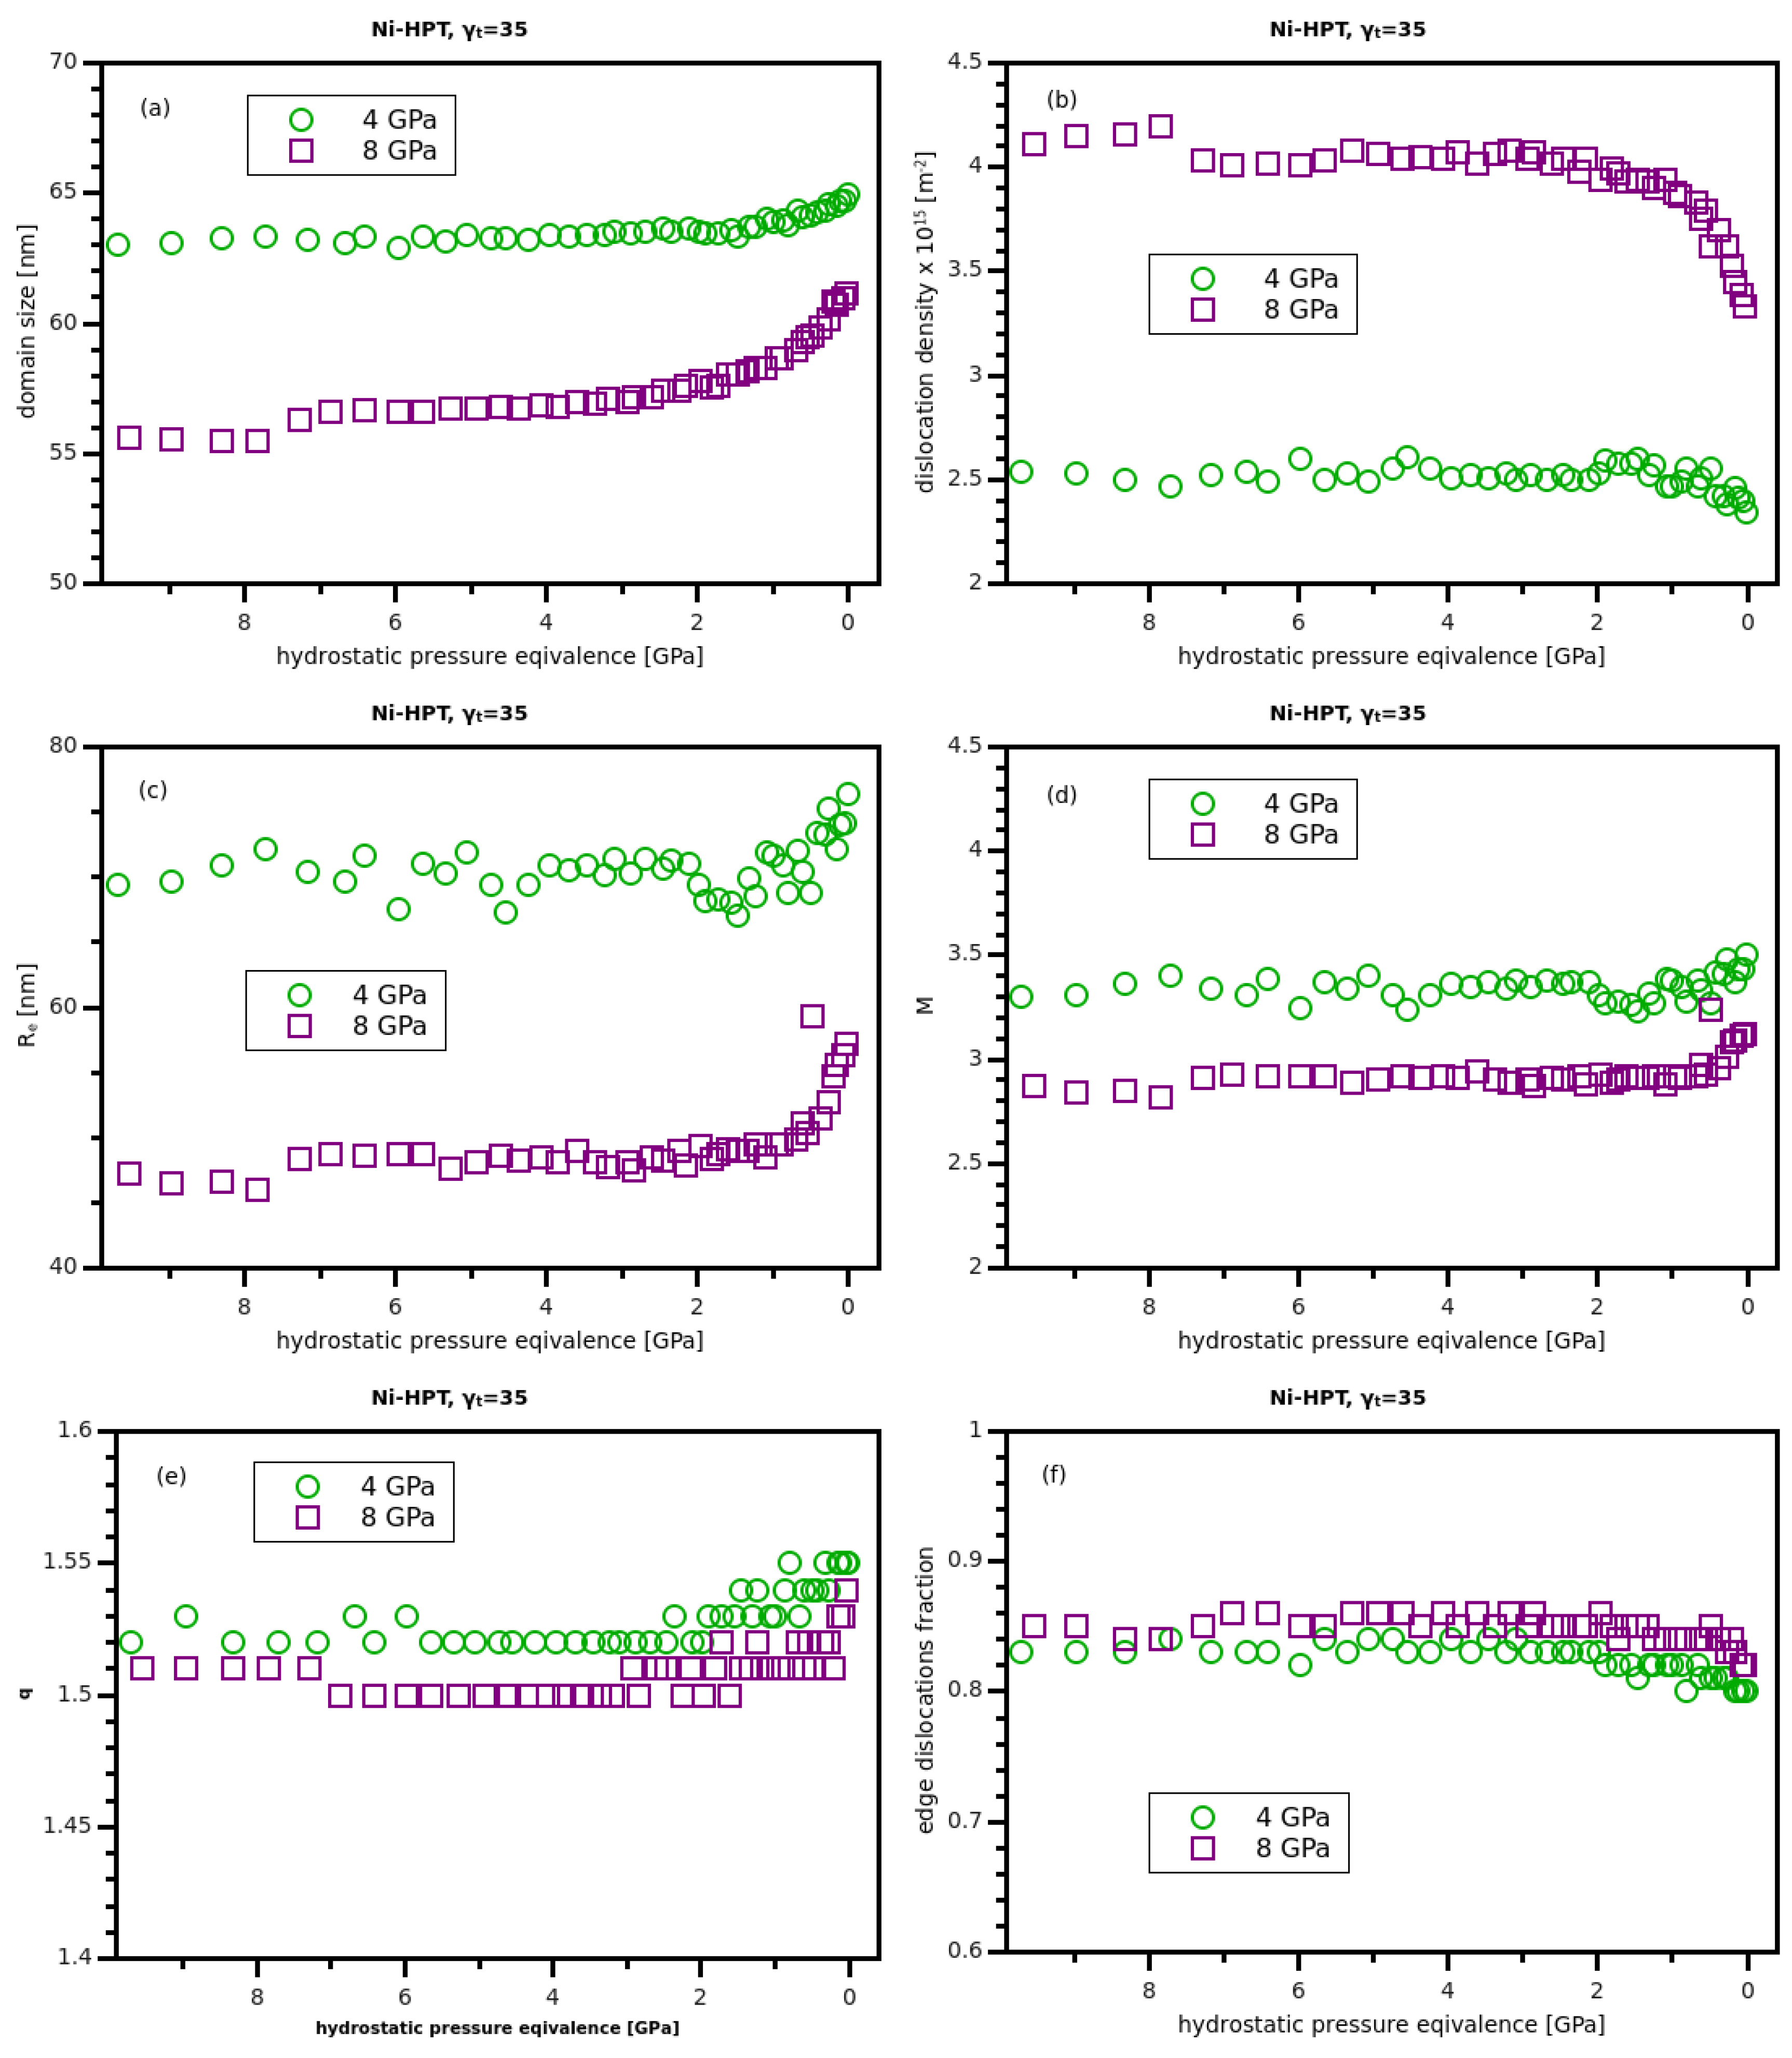
Considering again the continuous investigation during the unloading process shown in Figure 7, the features found with the Williamson–Hall analysis were also observed with the further measures. While the evolution of the coherently scattering domain size of nickel in Figure 7a was quite similar to that of copper, the difference after HPT deformation at 4 and 8 GPa was about a factor of two.More drastic differences can be observed in Figure 7b for the dislocation density, where values more than 50% higher for the HPT deformation at 8 GPa as compared to 4 GPa can be seen, while for copper at both pressures the initial values were about the same. The symptomatic earlier annihilation of dislocations for 8 GPa closely followed the case of copper again. The situation for the outer cut-off radius and the dislocation arrangement parameter M was drastically different: here in nickel, the two measures were larger after the 4 GPa deformation, which is the opposite to the case of copper. This means that in nickel the mutual strain field screening of dislocations was larger after 8 GPa deformation even when the dislocation density was much higher, which may be connected to its higher stacking-fault energy as compared to copper. There may be an easier rearrangement of non-split dislocations through its better mobility as compared to split-dislocations. This corresponds to previous findings of the different dislocation structures of copper and nickel [30,31] after conventional deformation. The earlier beginning of the dislocation annihilation with the 8 GPa deformation, as compared with 4 GPa, may then be connected to the much higher absolute value of dislocations as well as the proportionally greater number of generated vacancy-type defects, which were stored under the high pressure. Regarding the contrast parameter q and the corresponding fraction of edge and screw dislocations, the difference in pressure and the change during unloading was negligible, within about two times of the experimental error (size of symbols). This means that the same fractions of screw and edge dislocations were annealing during the unloading; this again is a similar behavior as observed in Copper, connected to a mobility change for all defects.
4. Conclusions
The effect of releasing the hydrostatic pressure reported in [5,6,7] was reproduced successfully in this work, supplementing the previous findings even with detailed monitoring of the microstructure during the steady release. This could be performed for copper and nickel after deformation at hydrostatic pressures of 4 and 8 GPa, respectively. Both materials showed considerable or strong effects upon the pressure release, and there was an observable influence of the extent of the hydrostatic pressure. The relative change of the dislocation density as well as its arrangement was about 10%–15%—this is a remarkable amount, especially when considering the microstructure’s influence on the strength of the material. This coincides with the differences found between the in-situ HPT–torque flow curves and the post-deformation strength by hardness measurement.
While for copper the dislocation density did not change as dramatically after deformation at higher pressure, in nickel the increase was rather pronounced. Furthermore, nickel showed no fundamental change in the dislocation arrangement (mutual screening of dislocation extension field) during and after unloading, whereas in copper a change in the arrangement was quite pronounced and also differed considerably with different deformation pressures. Nevertheless, both materials showed earlier defect mobility/annihilation after an 8 GPa deformation. The reason for this behavior is related to the discussed microstructural differences.
Author Contributions
Conceptualization, E.S. and M.K.; methodology, E.S. and M.K.; software, M.K.; formal analysis, E.S. and M.K.; investigation, E.S., F.S., R.S. and B.J.; resources, N.S.; data curation, E.S. and M.K.; writing–original draft preparation, E.S.; writing–review and editing, M.K.; visualization, E.S.; project administration, E.S.
Funding
The research leading to this result has been supported by the project CALIPSOplus under the Grant Agreement 730872 from the EU Framework Programme for Research and Innovation HORIZON 2020.
Conflicts of Interest
The authors declare no conflict of interest.
Abbreviations
The following abbreviations are used in this manuscript:
| SPD | Severe Plastic Deformation |
| HPT | High pressure Torsion |
| XPA | X-ray Profile Analysis |
| CSD | Coherent Scattering Domain |
| CMWP | Concolutional Multiple Whole Profile analysis |
References
- Zehetbauer, M.; Stuewe, H.; Vorhauer, A.; Schafler, E.; Kohout, J. The role of hydrostatic pressure in severe plastic deformation. Adv. Eng. Mater. 2003, 5, 330–337. [Google Scholar] [CrossRef]
- Zehetbauer, M. Cold Workhardenin in Stages IV and V of f.c.f. Metals - II. Model Fits and Physical Results. Acta Metall. Mater. 1993, 41, 589–599. [Google Scholar] [CrossRef]
- Zehetbauer, M. Effects of non-equilibrium vacancies on strengthening. Key Eng. Mater. 1994, 97–98, 287–306. [Google Scholar] [CrossRef]
- Zehetbauer, M.; Les, P. Micromechanisms of plastic deformation in metals. Kov. Mater. 1998, 36, 153–161. [Google Scholar]
- Schafler, E. Effects of releasing the hydrostatic pressure on the nanostructure after severe plastic deformation of Cu. Scr. Mater. 2010, 62, 423–426. [Google Scholar] [CrossRef]
- Schafler, E. Strength response upon pressure release after high pressure torsion deformation. Scr. Mater. 2011, 64, 130–132. [Google Scholar] [CrossRef]
- Schafler, E. Effect of Hydrostatic Pressure on the Microstructure and Mechanical Properties during and after High Pressure Torsion. Mater. Sci. For. 2011, 667–669, 657–664. [Google Scholar] [CrossRef]
- Wollenberger, H. Point defects. In Physical Metalurgy; Cahn, R., Haasen, P., Eds.; Elsevier: Amsterdam, The Netherlands, 1983; Chapter 17; pp. 1139–1221. [Google Scholar]
- Wollenberger, H. Point defects. In Physical Metalurgy; Cahn, R., Haasen, P., Eds.; Elsevier: Amsterdam, The Netherlands, 1996; Chapter 18; pp. 1621–1721. [Google Scholar]
- Sassa, K.; Petry, W.; Vogl, G. The nature of point defects in plastically deformed aluminium. Philos. Mag. A 1983, 48, 41–61. [Google Scholar] [CrossRef]
- Warren, B. X-ray measurement of grain size. J. Appl. Phys. 1960, 31, 2237–2239. [Google Scholar] [CrossRef]
- Warren, B.E.; Averbach, B.L. The effect of cold-work distortion on x-ray patterns. J. Appl. Phys. 1950, 21, 595–599. [Google Scholar] [CrossRef]
- Warren, B.; Averbach, B. The separation of stacking fault broadening in cold-worked metals. J. Appl. Phys. 1952, 23, 1059. [Google Scholar] [CrossRef]
- Groma, I.; Ungár, T.; Wilkens, M. Asymmetric X-ray Line Broadening of Plastically Deformed Crystals. I. Theory. J. Appl. Crystallogr. 1988, 21, 47–53. [Google Scholar] [CrossRef]
- Ungár, T.; Groma, I.; Wilkens, M. Asymmetric X-ray Line Broadening of Plastically Deformed Crystals. II. Evaluation Procedure and Application to [001]-Cu Crystals. J. Appl. Crystallogr. 1989, 22, 26–34. [Google Scholar] [CrossRef]
- Balogh, L.; Ribárik, G.; Ungár, T. Stacking faults and twin boundaries in fcc crystals determined by X-ray diffraction profile analysis. J. Appl. Phys. 2006, 100, 023512. [Google Scholar] [CrossRef]
- Dragomir, I.; Ungár, T. Contrast factors of dislocations in the hexagonal crystal system. J. Appl. Cryst. 2002, 35, 556–564. [Google Scholar] [CrossRef]
- Ungár, T.; Dragomir, I.; Revesz, A.; Borbely, A. The contrast factors of dislocations in cubic crystals: The dislocation model of strain anisotropy in practice. J. Appl. Crystallogr. 1999, 32, 992–1002. [Google Scholar] [CrossRef]
- Ungár, T.; Gubicza, J.; Ribárik, G.; Borbély, A. Crystallite size distribution and dislocation structure determined by diffraction profile analysis: Principles and practical application to cubic and hexagonal crystals. J. Appl. Crystallogr. 2001, 34, 298–310. [Google Scholar] [CrossRef]
- Scardi, P.; Leoni, M. Whole powder pattern modelling. Acta Crystallogr. A 2002, 58, 190–200. [Google Scholar] [CrossRef] [PubMed]
- Ribárik, G.; Gubicza, J.; Ungár, T. Correlation between strength and microstructure of ball-milled Al–Mg alloys determined by X-ray diffraction. Mater. Sci. Eng. A 2004, 387–389, 343–347. [Google Scholar] [CrossRef]
- Kerber, M.; Zehetbauer, M.; Schafler, E.; Spieckermann, F.; Bernstorff, S.; Ungar, T. X-ray Line Profile Analysis—An Ideal Tool to Quantify Structural Parameters of Nanomaterials. JOM 2011, 63, 61–70. [Google Scholar] [CrossRef]
- Williamson, G.K.; Hall, W.H. X-ray line broadening from filed Aluminium and Wolfram. Acta Metall. 1953, 1, 22–31. [Google Scholar] [CrossRef]
- Ungár, T.; Borbely, A. The effect of dislocation contrast on X-ray line broadening: A new approach to line profile analysis. Appl. Phys. Lett. 1996, 69, 3173–3175. [Google Scholar] [CrossRef]
- Setman, D.; Schafler, E.; Korznikova, E.; Zehetbauer, M. The presence and nature of vacancy type defects in nanometals detained by severe plastic deformation. Mater. Sci. Eng. A 2008, 493, 116–122. [Google Scholar] [CrossRef]
- Setman, D.; Kerber, M.; Schafler, E.; Zehetbauer, M. Activation Enthalpies of deformation induced lattice defects in SPD nanometals measured by Differential Scanning Calorimetry. Metall. Mater. Trans. A 2010, 41, 810–815. [Google Scholar] [CrossRef]
- Hinds, W. Aerosol Technology: Properties, Behavior and Measurement of Airbone Particles; Whiley: New York, NY, USA, 1982. [Google Scholar]
- Kilmametov, A.; Vaughan, G.; Yavari, A.; LeMoulec, A.; Botta, W.; Valiev, R. Microstructure evolution in copper under severe plastic deformation detected by in situ X-ray diffraction using monochromatic synchrotron light. Mater. Sci. Eng. A 2009, 503, 10–13. [Google Scholar] [CrossRef]
- Chung, D.; Buessem, W. The Elastic Anisotropy of Crystals. J. Appl. Phys. 1967, 38, 2010–2012. [Google Scholar] [CrossRef]
- Zehetbauer, M.; Ungar, T.; Kral, R.; Borbely, A.; Schafler, E.; Ortner, B.; Amenitsch, H.; Bernstorff, S. Scanning X-ray diffraction peak profile analysis in deformed Cu-polycrystals by synchrotron radiation. Acta Mater. 1999, 47, 1053–1061. [Google Scholar] [CrossRef]
- Schafler, E.; Zehetbauer, M.; Kopacz, I.; Ungar, T.; Hanak, P.; Amenitsch, H.; Bernstorff, S. Microstructural parameters in large strain deformed Ni polycrystals as investigated by synchrotron radiation. Phys. Status Solidi (A) Appl. Res. 1999, 175, 501–511. [Google Scholar] [CrossRef]
Figure 1.
The evaluated temperature-to-pressure equivalence for the dependence of the vacancy migration enthalpy according to the Arrhenius exponent and Equation (1) for the investigated materials.
Figure 1.
The evaluated temperature-to-pressure equivalence for the dependence of the vacancy migration enthalpy according to the Arrhenius exponent and Equation (1) for the investigated materials.

Figure 2.
Williamson–Hall plot and modified Williamson–Hall plot for copper after high-pressure torsion (HPT) deformation at 4 (a and b) and 8 GPa (c and d), respectively. “ GPa” denotes the sample state after the pressure release (unloading).
Figure 2.
Williamson–Hall plot and modified Williamson–Hall plot for copper after high-pressure torsion (HPT) deformation at 4 (a and b) and 8 GPa (c and d), respectively. “ GPa” denotes the sample state after the pressure release (unloading).

Figure 3.
The size distribution of the coherently scattering domains resulting from the convolutional multiple whole profile evaluation (CMWP) fit for copper after HPT deformation at 4 (a) and 8 GPa (b), respectively.“ GPa” denotes the sample state after the pressure release (unloading).
Figure 3.
The size distribution of the coherently scattering domains resulting from the convolutional multiple whole profile evaluation (CMWP) fit for copper after HPT deformation at 4 (a) and 8 GPa (b), respectively.“ GPa” denotes the sample state after the pressure release (unloading).

Figure 4.
The evolution of the microstructural parameters for copper after HPT deformation at 4 and 8 GPa as obtained by the CMWP fit: the coherently scattering domain size (a); the dislocation density (b); the outer cut-off radius of the strain field of dislocations (c); the M-parameter as a measure of the mutual strain field screening of dislocations (d); the contrast parameter q (e); the fraction of edge dislocations as determined from q (f).

Figure 5.
Williamson–Hall plot as well as modified Williamson–Hall plot for Nickel deformed at 4 (a,b) and 8 GPa (c,d), respectively. “ GPa” denotes the sample state after the pressure release (unloading).
Figure 5.
Williamson–Hall plot as well as modified Williamson–Hall plot for Nickel deformed at 4 (a,b) and 8 GPa (c,d), respectively. “ GPa” denotes the sample state after the pressure release (unloading).

Figure 6.
Size distributions of the coherently scattering domains resulting from the CMWP fit for nickel after deformation at 4 GPa (a) and 8 GPa (b), respectively. “ GPa” denotes the sample state after the pressure release (unloading).
Figure 6.
Size distributions of the coherently scattering domains resulting from the CMWP fit for nickel after deformation at 4 GPa (a) and 8 GPa (b), respectively. “ GPa” denotes the sample state after the pressure release (unloading).

Figure 7.
The evolution of the microstructural parameters for nickel after HPT deformation at 4 and 8 GPa as obtained by the CMWP fit: the coherently scattering domain size (a); the dislocation density (b); the outer cut-off radius of the strain field of dislocations (c); the M-parameter as a measure of the mutual strain field screening of dislocations (d); the contrast parameter q (e); the fraction of edge dislocations as determined from q (f).

© 2019 by the authors. Licensee MDPI, Basel, Switzerland. This article is an open access article distributed under the terms and conditions of the Creative Commons Attribution (CC BY) license (http://creativecommons.org/licenses/by/4.0/).
Share and Cite
MDPI and ACS Style
Kerber, M.; Spieckermann, F.; Schuster, R.; Joni, B.; Schell, N.; Schafler, E. In-Situ Synchrotron Profile Analysis after High-Pressure Torsion Deformation. Crystals 2019, 9, 232. https://doi.org/10.3390/cryst9050232
AMA Style
Kerber M, Spieckermann F, Schuster R, Joni B, Schell N, Schafler E. In-Situ Synchrotron Profile Analysis after High-Pressure Torsion Deformation. Crystals. 2019; 9(5):232. https://doi.org/10.3390/cryst9050232
Chicago/Turabian StyleKerber, Michael, Florian Spieckermann, Roman Schuster, Bertalan Joni, Norbert Schell, and Erhard Schafler. 2019. "In-Situ Synchrotron Profile Analysis after High-Pressure Torsion Deformation" Crystals 9, no. 5: 232. https://doi.org/10.3390/cryst9050232
Note that from the first issue of 2016, this journal uses article numbers instead of page numbers. See further details here.