Article

Microstructure and Phase Transformation Analysis of Ni50−xTi50Lax Shape Memory Alloys

1
College of Science, Inner Mongolia University of Technology, Hohhot 010051, China
2
College of Arts and Sciences, Shanghai Maritime University, Shanghai 201306, China
*
Author to whom correspondence should be addressed.
Crystals 2018, 8(9), 345; https://doi.org/10.3390/cryst8090345
Submission received: 20 July 2018 / Revised: 16 August 2018 / Accepted: 24 August 2018 / Published: 29 August 2018
(This article belongs to the Special Issue Microstructures and Properties of Martensitic Materials)

Abstract

:
The microstructure and martensitic transformation behavior of Ni50−xTi50Lax (x = 0.1, 0.3, 0.5, 0.7) shape memory alloys were investigated experimentally. Results show that the microstructure of Ni50−xTi50Lax alloys consists of a near-equiatomic TiNi matrix, LaNi precipitates, and Ti2Ni precipitates. With increasing La content, the amounts of LaNi and Ti2Ni precipitates demonstrate an increasing tendency. The martensitic transformation start temperature increases gradually with increasing La content. The Ni content is mainly responsible for the change in martensite transformation behavior in Ni50−xTi50Lax alloys.

1. Introduction

The unique shape memory effect and super elasticity of Ti–Ni alloys are related to martensitic transformation, which usually stems from the transformation of the B2 austenite parent phase into the B19’ martensite phase [1,2]. The martensitic transformation temperature is an important parameter that significantly affects the applications of Ti–Ni alloys. Some application fields, such as automotive and aerospace, require high martensitic transformation temperatures [3]. Experimental research suggests that adding a third element to Ti–Ni alloys is an effective approach to increase the martensitic transformation temperature [4]. Addition of Pd to Ti–Ni alloys can significantly increase the martensitic transformation temperature [5].Variations in Pd content enable adjustment of the martensitic transformation temperature of Ti–Ni–Pd alloys to the range of 100–530 °C, making Ti–Ni–Pd alloys suitable for use in high-temperature conditions. Besides Pd, addition of Au [6], Pt [7], or Hf [8] to Ti–Ni alloys can also effectively increase the martensitic transformation temperature. However, these elements are very expensive; thus, alternative low price materials, such as Cu added to Ni–Ti alloy to form Ni–Ti–Cu alloy [9] had been studied. While promising results have been obtained, these low-price materials are not useful at 100–300 °C [3]. Thus, research in this area is continuously being conducted.
Compared to Au, Pt, and Pd, rare earth (RE) elements are low-price. The resulting microstructure and martensitic transformation behavior observed from addition of RE elements such as Ce [10], Gd [11], Dy [12], and Y [13] to Ti–Ni alloys have been studied, and results show that Ti–Ni–RE alloys consist of a binary TiNi matrix, RENi precipitate, and Ti2Ni precipitate. The martensitic transformation temperature generally increases with increasing RE content [10,11,12,13]. In other words, adding RE elements to Ti–Ni alloys to replace Ni content can increase the martensitic transformation temperature. Thus, Ti–Ni–RE alloys are potential high-temperature shape memory alloys.
La is also a RE element, which is similar to Ce, Gd, Dy, and Y. Therefore, Ti–Ni–La is expected to be a potential high-temperature shape memory alloy. In our previous study, the microstructure and martensitic transformation behavior obtained after La addition to Ti50Ni50 alloys to replace Ti content was studied experimentally [14]. The microstructure of Ni50Ti50−xLax (x = 0, 0.1, 0.3, 0.5, 0.7, 0.9) alloys was found to consist of LaNi precipitates and near-equiatomic TiNi matrix. The martensitic transformation start temperatures decrease gradually with increasing La content, contrary to the behavior found in Ni–Ti–Ce [10], Ni–Ti–Gd [11], Ni–Ti–Dy [12], and Ni–Ti–Y [13] alloys. This difference is attributed to the decrease of Ti content because of the increase of La content in Ni50Ti50−xLax alloys. However, the microstructure and phase transformation behavior arising from addition of La to Ti50Ni50 alloys to replace Ni content remain unclear. Thus, we carried out an experimental study on the microstructure and phase transformation behavior of Ni50−xTi50Lax alloys.

2. Materials and Methods

Ni50−xTi50Lax (x = 0.1, 0.3, 0.5, 0.7) alloys were prepared by melting 40 g of raw material (99.99 mass% Ti, 99.99 mass% Ni, and 99.95 mass% La) with different nominal chemical compositions in a non-consumable arc-melting furnace. To ensure the uniform composition of the Ni50−xTi50Lax alloys, arc melting was repeated four times, and a pure Ti ingot was melted as an oxygen getter. The as-prepared Ni50−xTi50Lax ingots were spark cut into several 0.3 mm-thick plates, followed by solution treated at 850 °C for 1 h and then natural cooling in a vacuum quartz tube furnace.
The morphology of the Ni50−xTi50Lax alloys was observed by scanning electron microscope (SEM, Quanta 650 FEG, FEI, Hillsboro, USA) equipped with energy dispersive spectrometer (EDS) made by Oxford. X-ray diffraction (XRD) patterns were obtained using a D/MAX-2500PC X-ray diffractometer (Rigaku, Tokyo, Japan). The martensitic transformation temperature of the Ni50−xTi50Lax alloys were measured by differential scanning calorimeter (DSC, Q2000, TA Instrument, New Castle, USA) with a scanning rate of 10 °C/min during heating and cooling.

3. Results

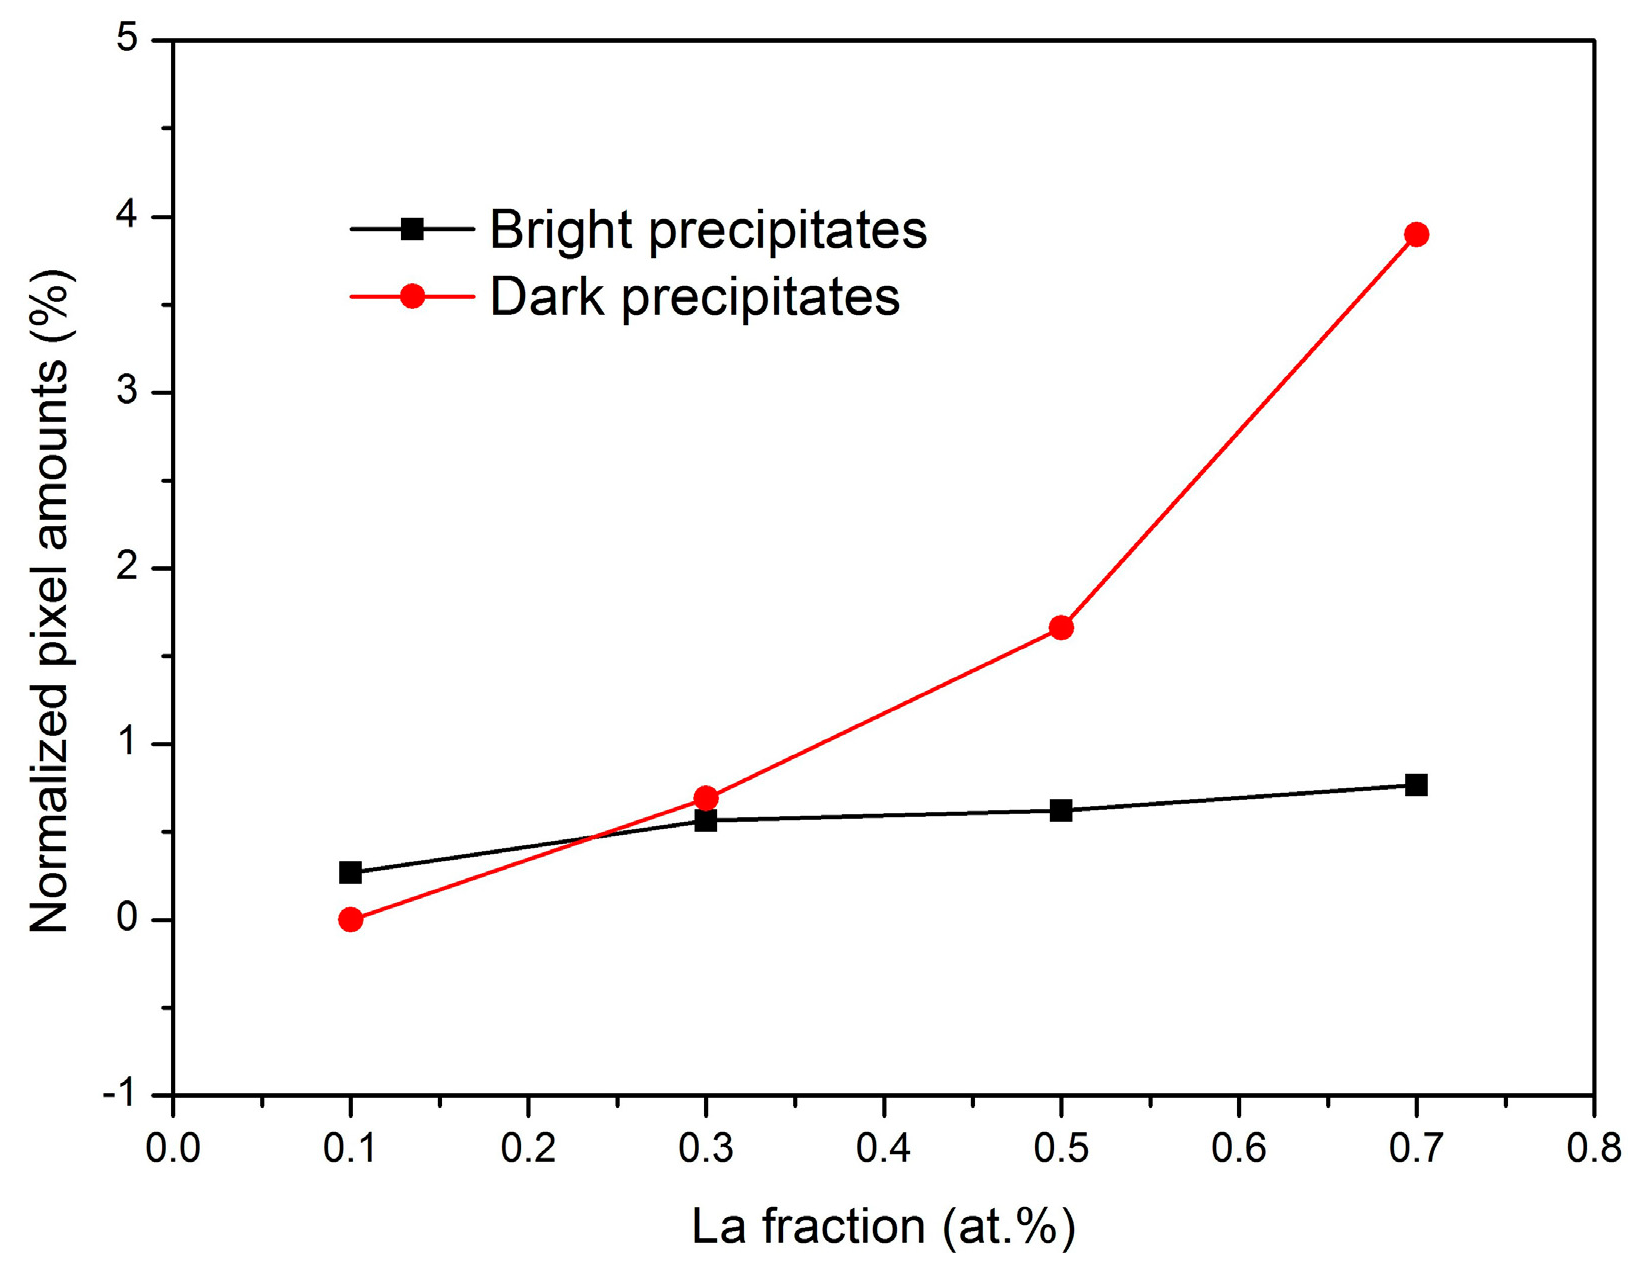
Figure 1 depicts the back-scattering SEM images of the Ni50−xTi50Lax alloys. Two different morphologies can be identified in the SEM image of the Ni49.9Ti50La0.1 alloy (Figure 1a): bright precipitates and a featureless matrix. By comparison, three different morphologies can be identified in the SEM image of the Ni49.7Ti50La0.3, Ni49.5Ti50La0.5, and Ni49.3Ti50La0.7 alloys (Figure 1b–d): bright precipitates, dark precipitates, and a featureless matrix. The bright precipitates are granular, while the dark precipitates are irregular in shape. To obtain the relationship between the La content and the amounts of precipitates produced, the pixel amounts of bright and dark precipitates in all four SEM images were counted as 707, 1486, 1633, 2005 and 0, 1809, 4349, 10,234, respectively (Figure 2). There are 262,144 (512 × 512) pixels in each SEM image. The normalized pixel amounts of bright and dark precipitates exhibit an increasing tendency, which indicates that the size and quantity of bright and black precipitates increase with increasing La content in Ni50−xTi50Lax alloys. This case is highly similar to the morphologies of Ni–Ti–Ce [10], Ni–Ti–Gd [11], Ni–Ti–Dy [12], and Ni–Ti–Y [13] alloys. The types and amounts of precipitates in Ti–Ni-based shape memory alloys can significantly affect their phase transformation behavior [15]. Thus, we present an analysis of the relation between the precipitates and phase transformation behavior of Ni50−xTi50Lax alloys in the Discussion section.
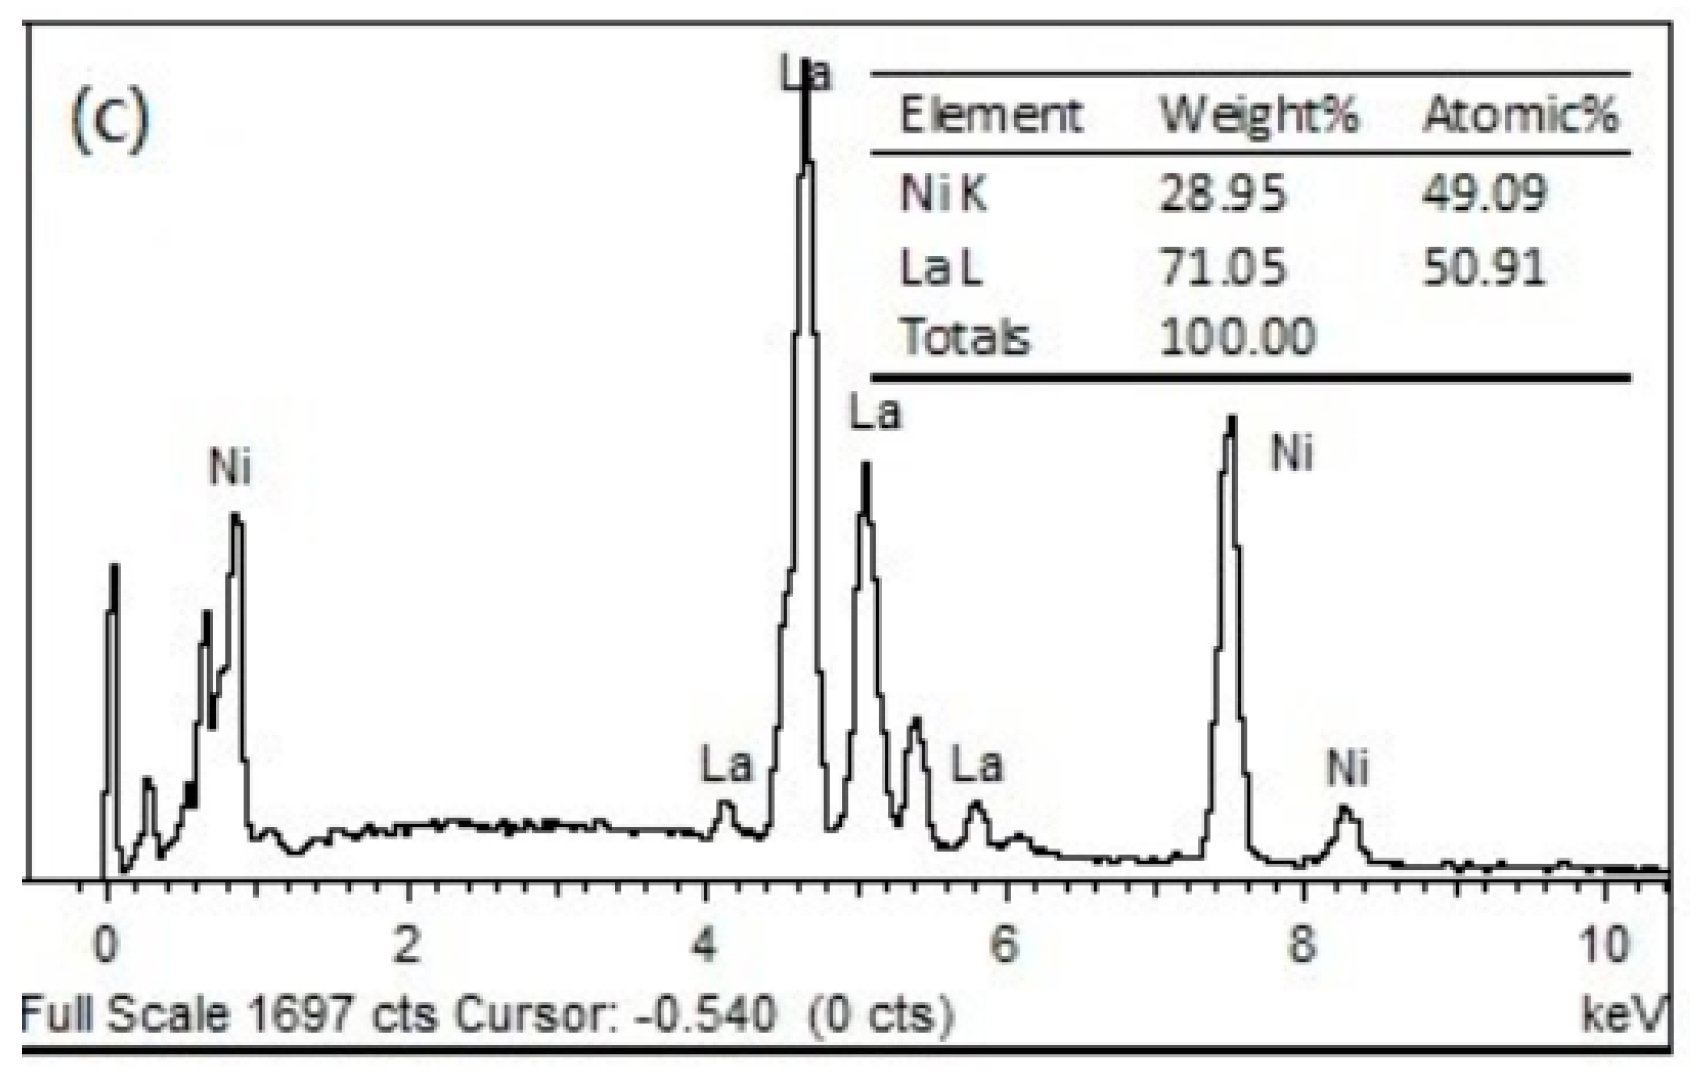
The actual chemical composition of phases in Ni50−xTi50Lax alloys were measured by SEM/EDS, and the results are summarized in Table 1. Meanwhile, a typical EDS spectrum of each phase in Ni49.3Ti50La0.7 are depicted in Figure 3. In the matrix of all Ni50−xTi50Lax alloys, the ratio of Ti and Ni atoms is very close to 1. According to the phase diagram of Ti–Ni binary alloys, the matrix is likely to be a near-equiatomic TiNi phase [16]. In all bright precipitates of the Ni50−xTi50Lax alloys, only La and Ni are detected, and the atomic ratio of La:Ni is also close to 1:1. According to the phase diagram of Ni–Ti–La ternary alloys, the bright precipitates may likely be a LaNi phase [17]. Only Ti and Ni are detected in the dark precipitates of Ni49.7Ti50La0.3, Ni49.5Ti50La0.5, and Ni49.3Ti50La0.7 alloys, and the atomic ratio of Ti:Ni is close to 2:1. According to the phase diagram of Ti–Ni binary alloys, the dark precipitates are probably a Ti2Ni phase [16]. No intermetallic compounds of Ti and La are found in all Ni50−xTi50Lax alloys, which is consistent with the phase diagram of Ni–Ti–La ternary alloys [17].
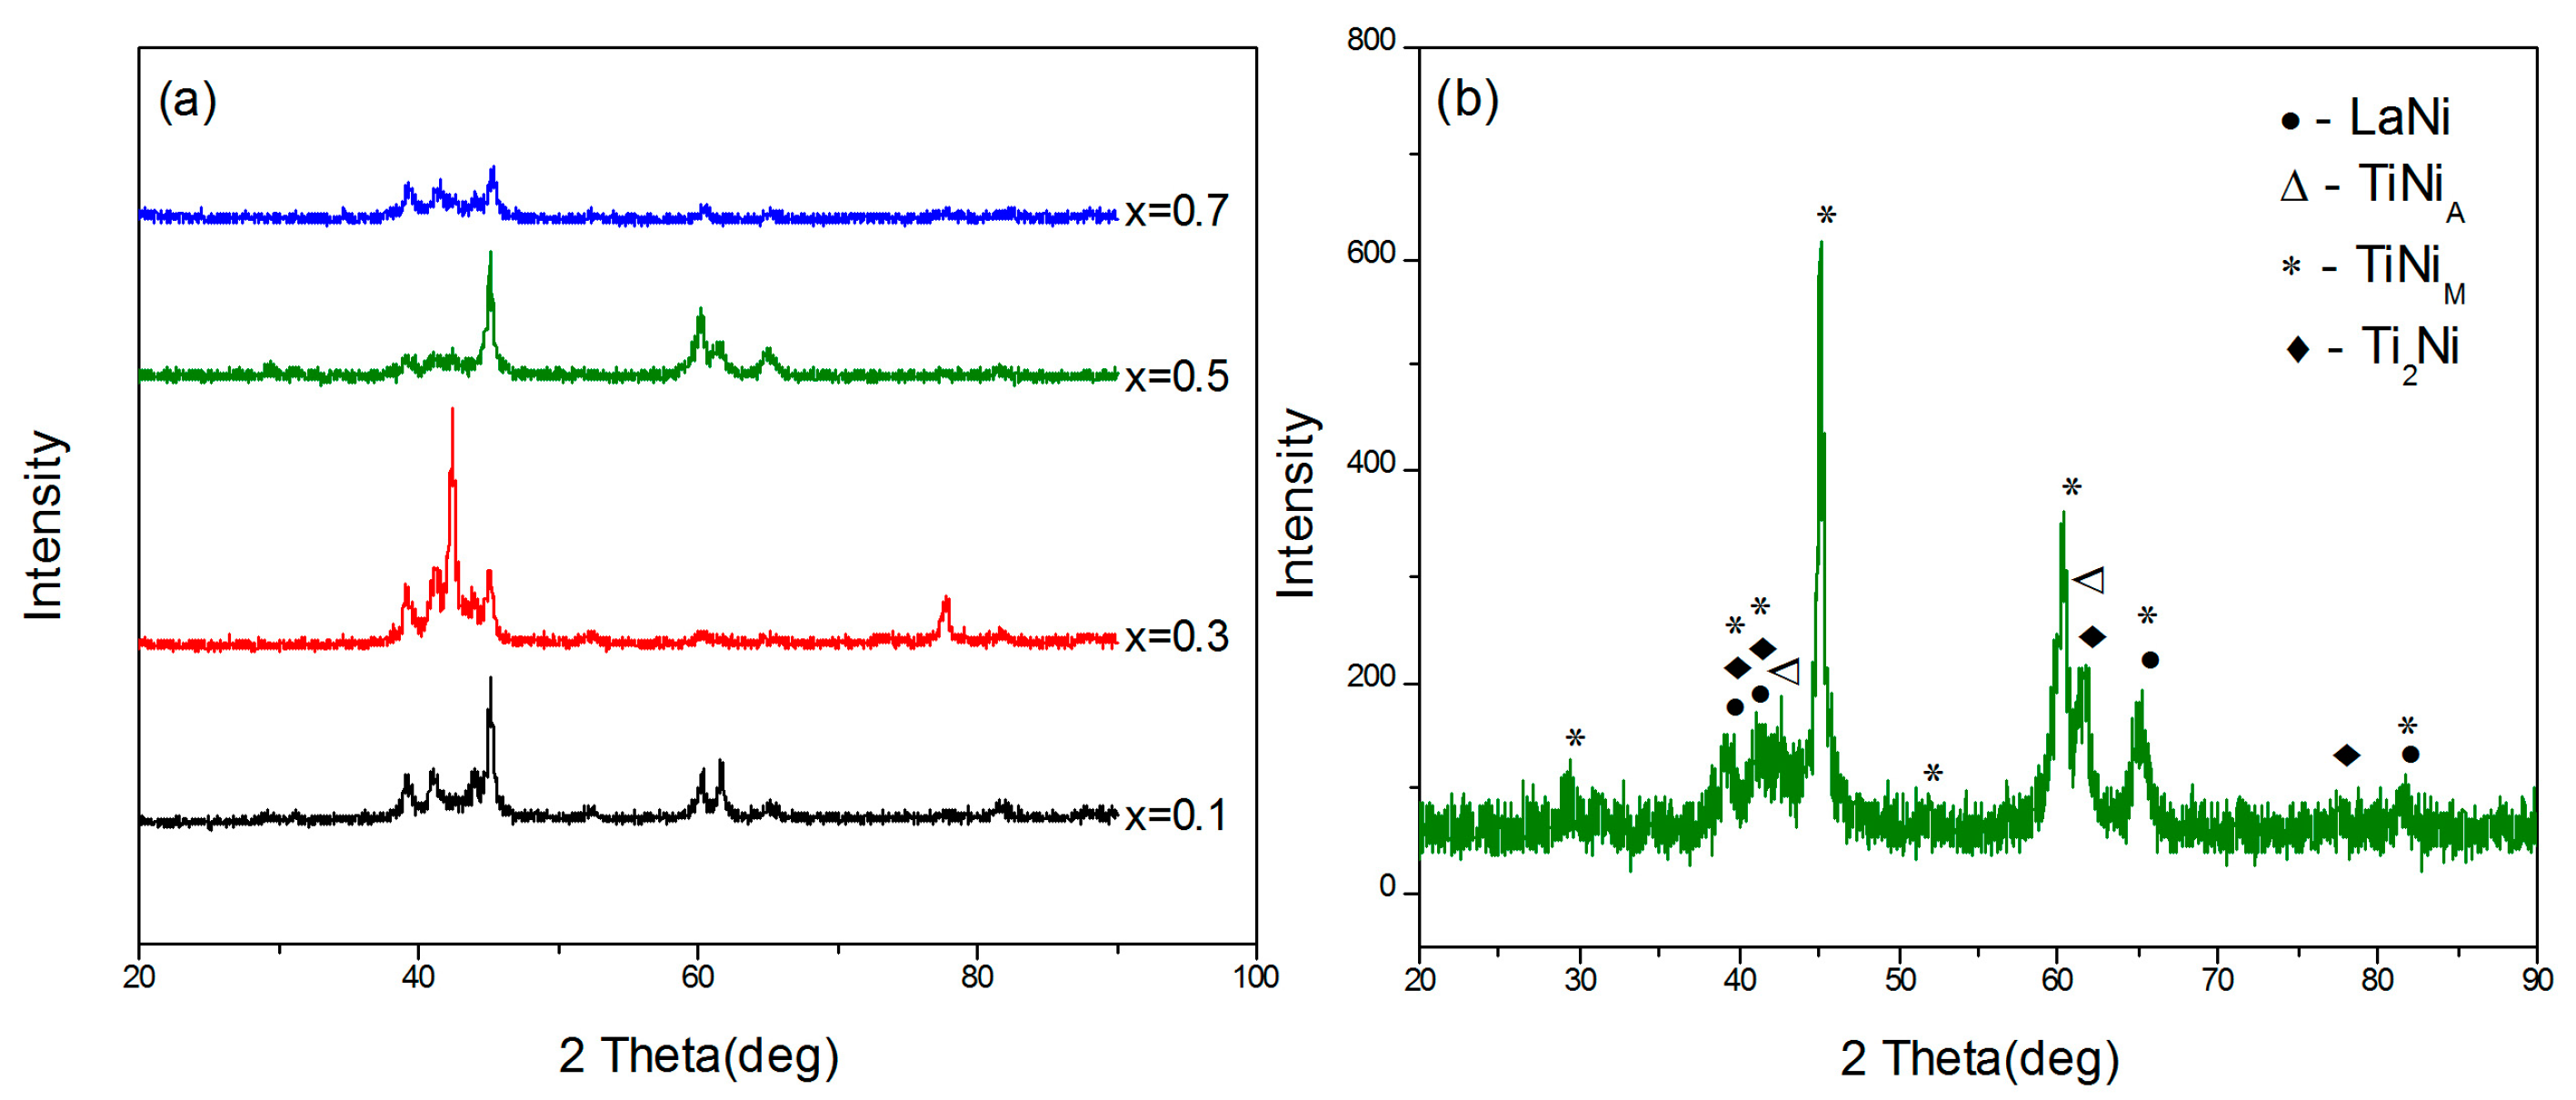
The XRD patterns of Ni50−xTi50Lax alloys at room temperature are depicted in Figure 4a. The diffraction peaks can be attributed to TiNi B19’ martensite, TiNi B2 austenite, a LaNi phase, and a Ti2Ni phase after comparison with the corresponding JCPDF cards (Nos. 65-0145, 65-4572, 19-0654, and 18-0898). As an example, the phases corresponding to diffraction peaks of Ni49.5Ti50La0.5 alloy are shown in Figure 4b. In this figure, letter M denotes the TiNi B19’ martensite, and letter A denotes the TiNi B2 austenite. By combining the XRD results with the EDS data, the Ni50−xTi50Lax alloys can be confirmed to consist of a near-equiatomic TiNi matrix, LaNi precipitates, and Ti2Ni precipitates. In our previous work, Ni50Ti50−xLax alloys consisted of a near-equiatomic TiNi matrix and LaNi precipitates only [14]. No Ti2Ni precipitates were found in the Ni50Ti50−xLax alloys, which is different from our findings on Ni50−xTi50Lax alloys.
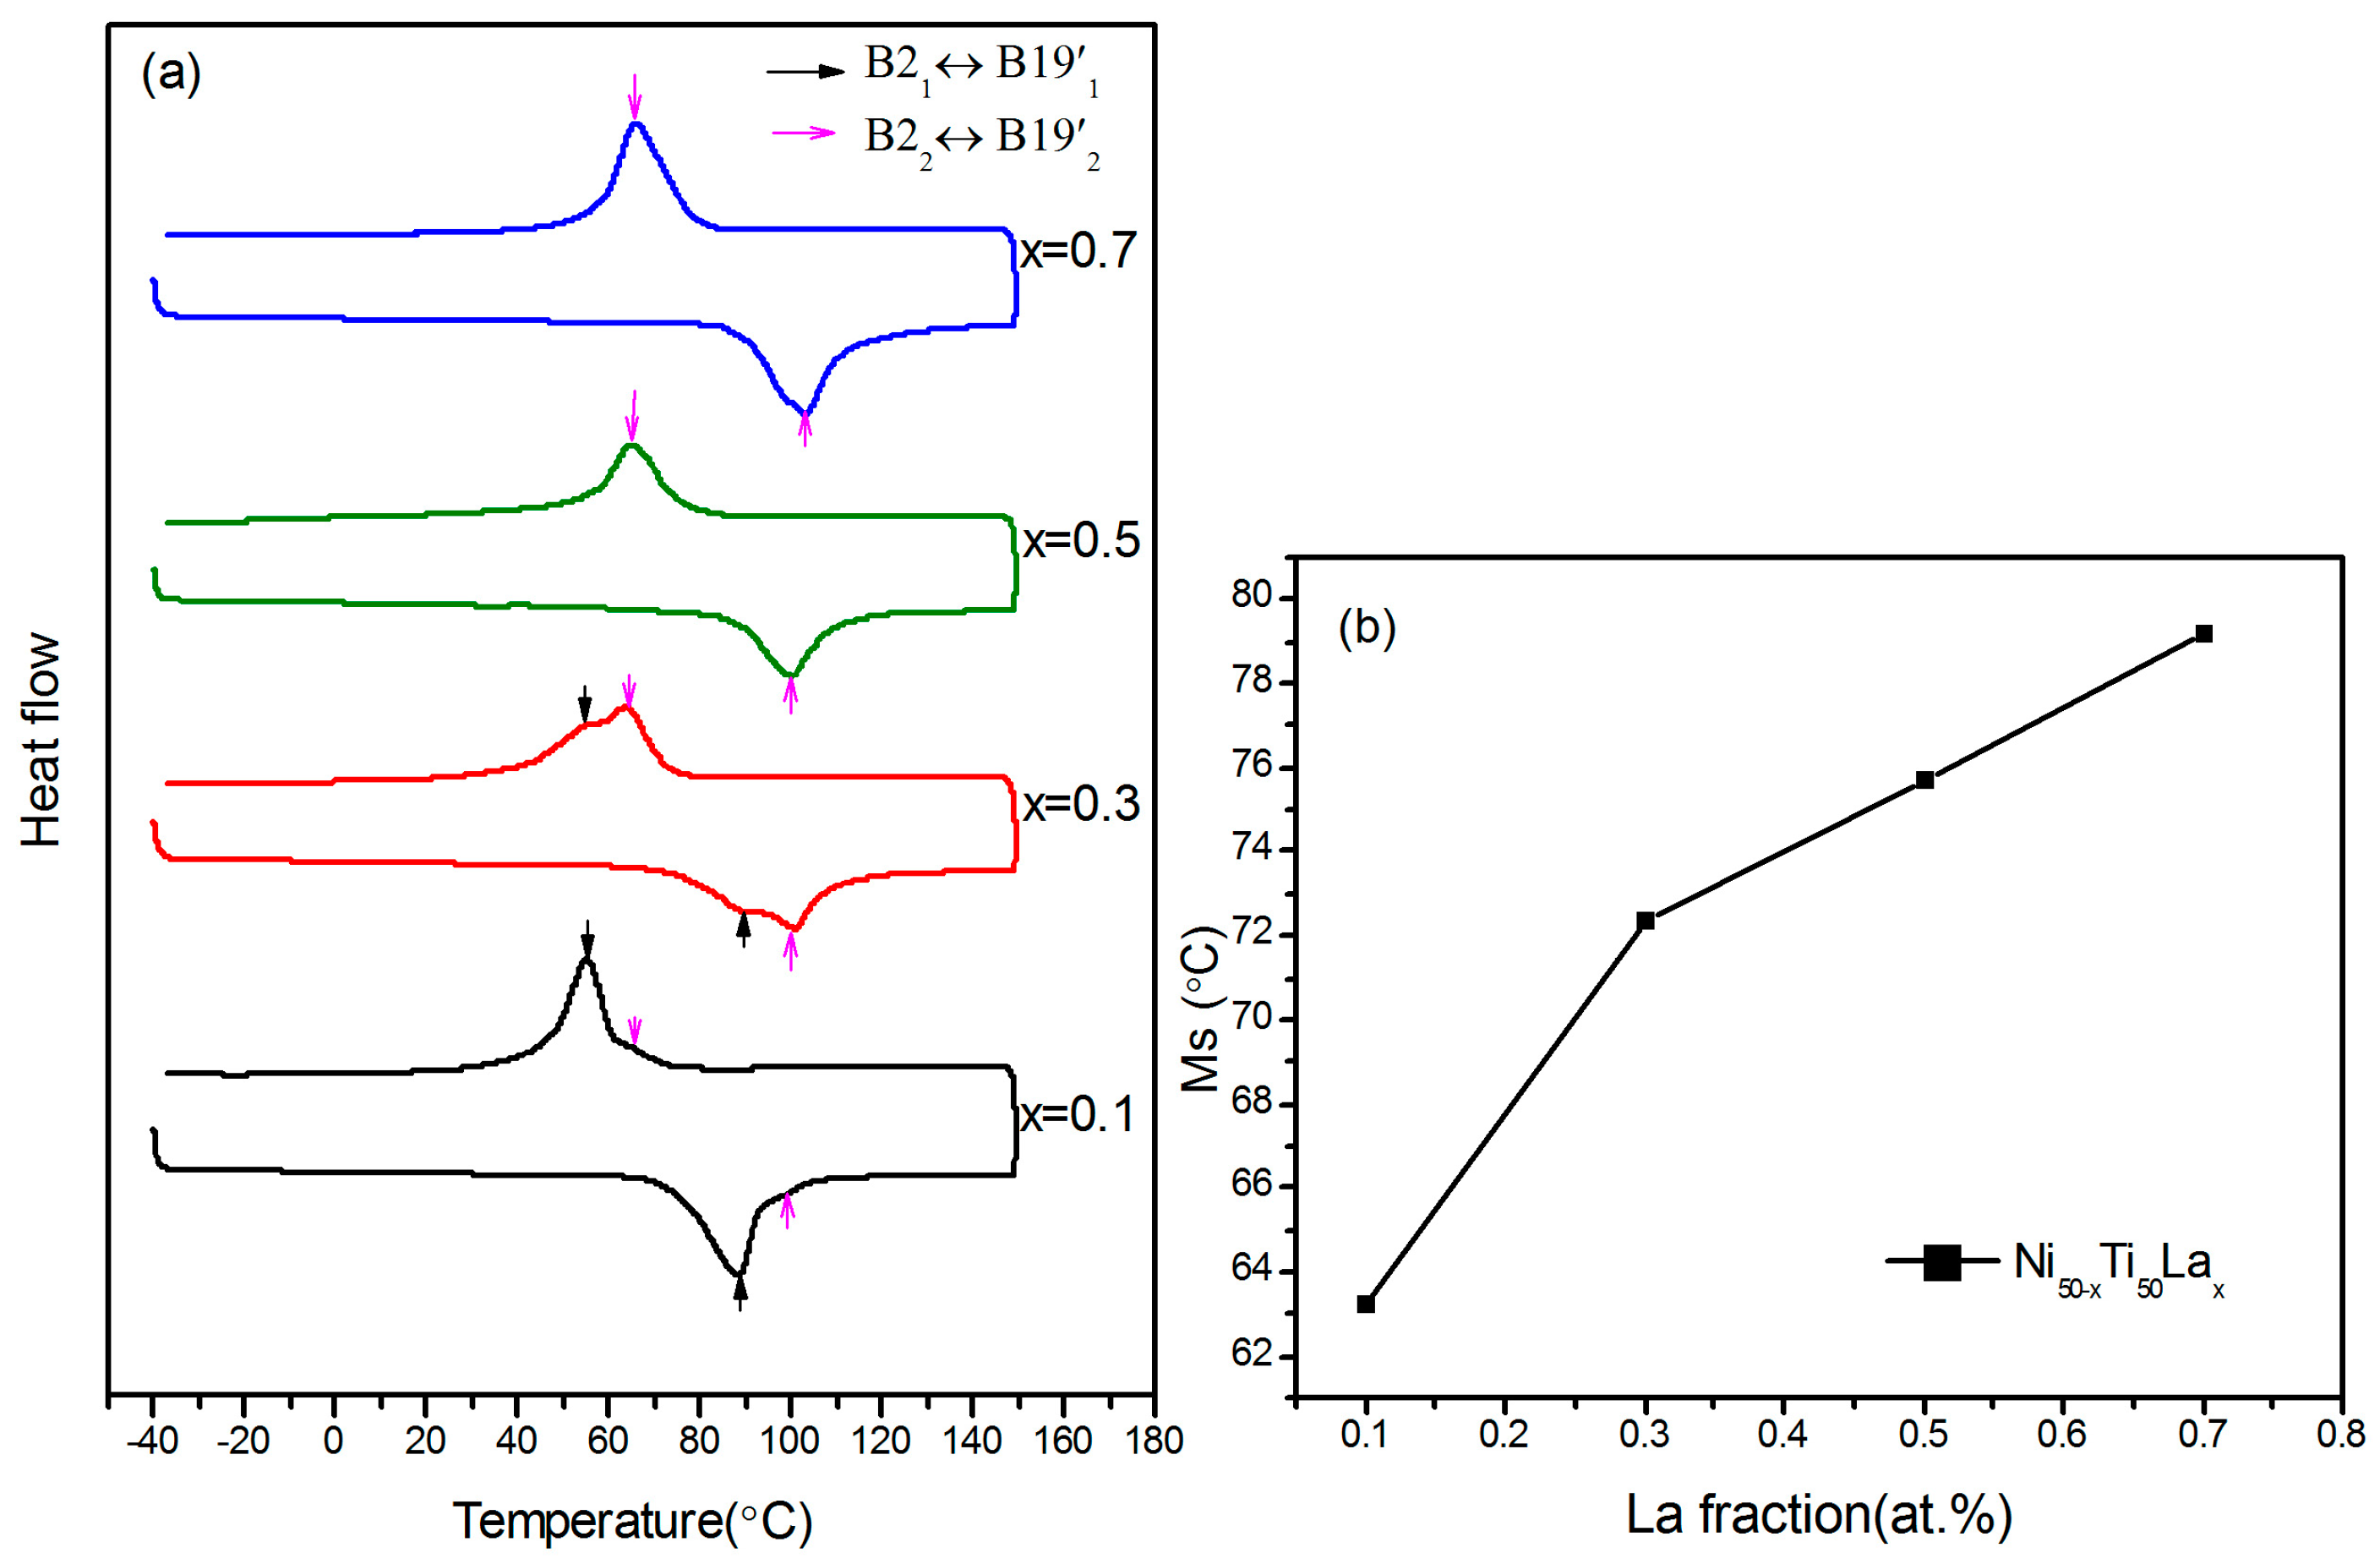
The DSC curves of the Ni50−xTi50Lax alloys are depicted in Figure 5a. The DSC curves of Ni49.9Ti50La0.1 and Ni49.7Ti50La0.3 show two peaks during heating and cooling. By contrast, the DSC curves of Ni49.5Ti50La0.5 and Ni49.3Ti50La0.7 only show one peak during heating and cooling. Figure 5b depicts the effect of La content on the martensitic transformation start temperature (Ms) of the Ni50−xTi50Lax alloys. Ms was determined from the DSC curve with the highest peak in Figure 5a. Ms clearly increases with increasing La content.

4. Discussion

4.1. Microstructure Formation Analysis

The formation enthalpies of the alloys were calculated using Miedema’s theory to analyze the reasons behind the morphology and phase transformation behavior of Ni50−xTi50Lax alloys [18]. According to Miedema’s semi-empirical model, the enthalpy (energy) effect takes place at the A–B interface when element A and element B forms an alloy. The formation enthalpy of a solid solution consists of three terms:
Δ H = Δ H chemical + Δ H elastic + Δ H structural
where ΔHchemical, ΔHelastic, and ΔHstructural are chemical, elastic, and structural contributions due to atom mixing, size mismatches, and differences in the valence electrons and crystal structures of solute and solvent atoms, respectively. Calculations by Mousavi et al. showed that the contributions of ΔHstructural and ΔHelastic in Ti–Ni alloys are negligible [19]. Thus, in this work, we only calculate ΔHchemical as the formation enthalpy of the phases in Ni50−xTi50Lax alloys. ΔHchemical can be expressed as follows:
Δ H chemical = 2 f ( c s ) ( x A V A 2 / 3 + x B V B 2 / 3 ) ( n w s A ) 1 / 3 + ( n w s B ) 1 / 3 [ P ( Δ φ ) 2 + Q ( Δ n w s 1 / 3 ) 2 ]
where xA and xB are the mole fractions of elements A and B, respectively; ϕ, V, and nws are the work function, molar volume, and electron density of the components, respectively; and P and Q are empirical constants (P = 14.1 and Q = 1.5). Other parameters related to the formation enthalpy are summarized in Table 2 [20]. f(cs) is the concentration function for solid solutions given by Equations (3) and (4).
f ( C s ) = C A s C B s
C A s = x A V A 2 / 3 x A V A 2 / 3 + x B V B 2 / 3 , C B s = x B V B 2 / 3 x A V A 2 / 3 + x B V B 2 / 3
The calculated formation enthalpies of LaNi, TiNi, and Ti2Ni are −76.26, −37.95, and −32.13 kJ/mol, respectively. Among, the value for TiNi is in very good agreement with Hu’s (−36.1 kJ/mol) [21] and Gachon’s (−34.0 kJ/mol) [22] experimental values. Meanwhile, the value for Ti2Ni is also in reasonable agreement with Gachon’s (−29.3 kJ/mol) [22] experimental values. The formation enthalpy refers to the energy of a compound composed of several elements. Therefore, the smaller the formation enthalpy, the easier a compound can be formed from its constituent elements [23]. The formation enthalpy of LaNi is smaller than that of TiNi and Ti2Ni. Thus, the LaNi phase is preferentially formed prior to the TiNi and Ti2Ni phases during fabrication of the Ni50−xTi50Lax alloy. We propose that, when adding La to the Ti–Ni alloy, x at.% La first combines with x at.% Ni to form the LaNi phase and the rest of the 50−2x at.% Ni combines with 50 at.% Ti to form a near-equiatomic TiNi matrix and Ti2Ni precipitates.

4.2. Phase Transformation Behavior

The DSC curve of the Ni49.9Ti50La0.1 alloy shows two peaks during heating and cooling. The peak at 55 °C is obviously higher than that at 65 °C. However, for the Ni49.7Ti50La0.3 alloy, the peak at 65 °C is higher than that at 55 °C. The Ni content is lower than the Ti content in each Ni50−xTi50Lax alloy. La and Ni combine preferentially to form the LaNi phase, which further reduces the Ni content in the matrix. In some Ti-rich regions, some amounts of Ti2Ni phase could be formed. Thus, the two peaks of the DSC curve arise from regions with different Ni contents: one peak is formed in regions with lower Ni contents at higher temperatures, indicating a B22 ↔ B19’2 phase transformation, and the other peak is formed in regions with higher Ni contents at lower temperatures, indicating a B21 ↔ B19’1 phase transformation (here, the subscript 1 denotes the phase transformation at 55 °C, and the subscript 2 denotes the phase transformation at 65 °C). For Ni49.9Ti50La0.1, only a few Ti-rich regions remain in its matrix because of the addition of a small amount of La. Obvious Ti2Ni precipitates were not observed by SEM, and the atomic ratio of Ti:Ni remained close to 1:1 in most regions of the matrix. Thus, the peak of B22 ↔ B19’2 is lower than that of B21 ↔ B19’1. For Ni49.7Ti50La0.3, with increasing La content, the Ti-rich regions also increased, and Ti2Ni precipitates could be observed clearly by SEM. The peak of B22 ↔ B19’2 considerably exceeded that of B21 ↔ B19’1. As the La content increased in Ni49.5Ti50La0.5 and Ni49.3Ti50La0.7, the Ti-rich regions and Ti2Ni precipitates increased further; thus, only one peak indicating B22 ↔ B19’2 transformation was observed clearly. Liu et al. observed a similar phase transformation behavior when discussing the effect of aging on the transformation behavior of a Ti-49.5 at.% Ni alloy [24]. The authors proposed that the observed multi-stage transformation may be attributed to the formation of Ti2Ni precipitates. However, they did not observe the microstructure of this alloy by SEM or transmission electron microscopy. Thus, the presence of Ti2Ni precipitates was only a speculation at best. In the present work, Ti2Ni precipitates were observed and identified by SEM and EDS, thus providing direct evidence supporting Liu et al.’s speculation.
The phase transformation behaviors of Ni50−xTi50Lax alloys obviously differed in comparison with those of Ni50Ti50−xLax alloys. For Ni50Ti50-xLax alloys, after formation of the LaNi phase, the atomic ratio of the Ti:Ni in matrix is nearly 1:1, and no Ti- or Ni-rich regions are further formed. Therefore, all Ni50Ti50−xLax alloys reveal only a one-stage B2 ↔ B19′ phase transformation [14].When the La content is low in Ni50−xTi50Lax alloys, some Ti-rich regions appear in the alloy, and both B21 ↔ B19’1 and B22 ↔ B19’2 phase transformations can be detected. When the La content is high, Ti-rich regions are dominant in the alloy, and only B22 ↔ B19’2 phase transformation can be detected.
The Ms of the Ni50−xTi50Lax alloys increases with increasing La content, contrasting findings on Ni50Ti50−xLax alloys. Given that the Ti:Ni ratio in the matrix of Ni50Ti50−xLax is 1:1, the phase transformation temperature depends on the stress between the matrix and the precipitates [14,15]. With increasing La content, the amount and size of LaNi precipitates, as well as the stress in the alloys, increase, leading to a decrease in Ms. When La combines with Ni to form the LaNi phase in Ni50−xTi50Lax, the Ni content in the matrix decreases and Ti2Ni precipitates are formed. The Ms of TiNi binary alloys is strongly dependent on the Ni content. An approximately 0.1 at.% increase in Ni content can lower the Ms of TiNi binary alloys by more than 10 °C [25]. Therefore, decreases in Ni content lead to an increase in Ms. However, we observed that the increase in Ms in Ni50-xTi50Lax alloys is obviously lower than that in TiNi binary alloys with the same Ni content. Thus, we propose that the stress in Ni50−xTi50Lax alloys can also result in a reduction in Ms. Taken together, the results reveal that the Ni content and stress between Ti2Ni precipitates and TiNi matrix are responsible for the change in the martensite transformation temperature of Ni50−xTi50Lax alloys; of these factors, the Ni content plays a dominant role.

5. Conclusions

The microstructure and martensitic transformation behavior of Ni50−xTi50Lax (x = 0.1, 0.3, 0.5, 0.7) alloys were investigated by XRD, SEM, and DSC. The microstructure of the Ni50−xTi50Lax alloys consists of a near-equiatomic TiNi matrix, LaNi precipitates, and Ti2Ni precipitates. Ni50−xTi50Lax alloys undergo a two-stage phase transformation of B21 ↔ B19’1 and B22 ↔ B19’2 for La contents of 0.1 at.% and 0.3 at.%, but exhibits a one-stage phase transformation of B22 ↔ B19’2 for La contents of 0.5 at.% and 0.7 at.%. The martensitic transformation start temperature increases gradually with increasing La content, which is mainly attributed to the decrease of Ni content in the matrix.

Author Contributions

C.Z. and W.L. conceived and designed the experiments; W.L. performed the experiments; W.L. and C.Z. analyzed the data; W.L. and C.Z. wrote the paper.

Funding

National Natural Science Foundation of China: 11672175, 51261017.

Acknowledgments

This work was funded by the National Natural Science Foundation of China (Grant No. 11672175, 51261017).

Conflicts of Interest

The authors declare no conflict of interest.

References

  1. Philip, T.V.; Beck, P.A. CsCl-Type ordered structures in binary alloys of transition elements. JOM 1957, 9, 1269–1271. [Google Scholar] [CrossRef]
  2. Kudoh, Y.; Tokonami, M.; Miyazaki, S.; Otsuka, K. Crystal-structure of the martensite in Ti-49.2 at.%Ni alloy analyzed by singly-crystal X-ray-diffraction method. Acta Metall. 1985, 33, 2049–2056. [Google Scholar] [CrossRef]
  3. Jani, J.M.; Leary, M.; Subic, A.; Gibson, M.A. A review of shape memory alloy research, applications and opportunities. Mater. Des. 2014, 56, 1078–1113. [Google Scholar] [CrossRef]
  4. Otsvka, K.; Ren, X. Physical metallurgy of Ti-Ni-based shape memory alloys. Prog. Mater. Sci. 2005, 50, 511–678. [Google Scholar] [CrossRef]
  5. Ma, J.; Karaman, I.; Noebe, R.D. High temperature shape memory alloys. Metall. Rev. 2010, 55, 257–315. [Google Scholar] [CrossRef]
  6. Wu, S.K.; Wayman, C.M. Martensitic transformation and the shape memory effect in Ti50Ni10Au40 and Ti50Au50 alloys. Metallography 1987, 20, 359–376. [Google Scholar] [CrossRef]
  7. Lo, Y.C.; Wu, S.K. Compositional dependence of martensitic transformation sequence in Ti50Ni50−xPdx alloys with x ≦ 15 at.%. Scr. Metal. Mater. 1992, 26, 1875–1877. [Google Scholar] [CrossRef]
  8. Pushin, V.G.; Kuranova, N.N.; Pushin, A.V.; Uksusnikov, A.N.; Koirov, N.I. Structure and thermoelastic martensitic transformations in ternary Ni–Ti–Hf alloys. Tech. Phys. 2016, 61, 51–56. [Google Scholar] [CrossRef]
  9. Nespoli, A.; Villa, E.; Besseghini, S. Characterization of the martensitic transformation in Ni50−xTi50Cux alloys though pure thermal measurements. J. Alloy. Comp. 2011, 509, 644–647. [Google Scholar] [CrossRef]
  10. Cai, W.; Liu, A.L.; Sui, J.H.; Zhao, L.C. Effects of cerium addition on martensitic transformation and microstructure of Ti49.3Ni50.7 alloy. Mater. Trans. 2006, 47, 716–719. [Google Scholar] [CrossRef]
  11. Liu, A.L.; Cai, W.; Gao, Z.Y.; Zhao, L.C. The microstructure and martensitic transformation of (Ti49.3Ni50.7)1−xGdx shape memory alloys. Mater. Sci. Eng. A 2006, 438–440, 634–638. [Google Scholar] [CrossRef]
  12. Liu, A.L.; Gao, Z.Y.; Cao, L.; Cai, W.; Wu, Y. Effect of Dy addition the microstructure and martensitic transformation of a Ni-rich TiNi shape memory alloy. Alloy Comp. 2007, 437, 339–343. [Google Scholar] [CrossRef]
  13. Liu, A.L.; Sui, J.H.; Lei, Y.C.; Cai, W.; Gao, Z.Y.; Zhao, L.C. Effect of Y addition on microstructure and martensitic transformation of a Ni-rich Ti–Ni shape memory alloy. J. Mater. Sci. 2007, 42, 5791–5794. [Google Scholar] [CrossRef]
  14. Zhao, C.W.; Li, W.Y.; Zhao, S.L.; Jin, Y.J.; Meng, X.K.; Hou, Q.Y. Effect of La addition on the microstructure and martensitic transformation of Ni–Ti–La alloys. Vacuum 2017, 137, 169–174. [Google Scholar] [CrossRef]
  15. Luo, H.B.; Shan, F.L.; Huo, Y.L.; Wang, Y.M. Effect of precipitates on phase transformation behavior of Ti-49 at.% Ni film. Thin Solid Films 1999, 339, 305–308. [Google Scholar] [CrossRef]
  16. Itin, V.I.; Bratchikov, A.D.; Merzhanov, A.G.; Doronin, V.N. Relation between combustion parameters and phase diagram for the systems Ti–Co and Ti–Ni. Combust. Explo. Shock. 1982, 18, 536–539. [Google Scholar] [CrossRef]
  17. Liu, J.Q.; Geng, K. The isothermal section of the phase diagram of the La–Ni–Ti ternary system at 673 K. J. Alloy Compd. 2000, 312, 121–123. [Google Scholar]
  18. Miedema, A.R.; Boer, F.R.D. Predicting heat effects in alloys. Phys. B 1981, 103, 67–81. [Google Scholar] [CrossRef]
  19. Mousavi, T.; Abbasi, M.H.; Karimzadeh, F. Thermodynamic analysis of NiTi by mechanical alloying. Mater. Lett. 2009, 63, 786–788. [Google Scholar] [CrossRef]
  20. Boer, F.R.D.; Boom, R.; Mattens, W.C.M.; Miedema, A.R.; Niessen, A.R. Fundamentals of the model. In Cohesion in Metals, 2nd ed.; Elsevier Inc.: Amsterdam, The Netherlands, 1988; pp. 24–25. [Google Scholar]
  21. Hu, R.X.; Nash, P.; Chen, Q. Enthalpy of formation in the Al–Ni–Ti System. J. Phase Equilib. Diffus. 2009, 30, 559–563. [Google Scholar] [CrossRef]
  22. Gachon, J.C.; Notin, M.; Hertz, J. The enthalpy of mixing of the intermediate phases in the systems FeTi, CoTi, and NiTi by direct reaction calorimetry. Thermochim. Acta 1981, 48, 155–164. [Google Scholar] [CrossRef]
  23. Yin, J.Y.; Li, G.F.; Si, Y.S.; Ying, G.; Peng, P. Micro mechanism of Cu and Fe alloying process on the martensitic phase transformation of NiTi-based alloys: First-principles calculation. J. Struct. Chem. 2015, 56, 1051–1057. [Google Scholar] [CrossRef]
  24. Liu, Y.N.; Blanc, M.; Tan, G.; Kim, J.I.; Miyazaki, S. Effect of ageing on the transformation behavior of Ti-49.5 at.% Ni. Mater. Sci. Eng. A 2006, 438–440, 617–621. [Google Scholar] [CrossRef]
  25. Tang, W. Thermodynamic study of the low-temperature phase B19’ and the martensitic transformation in near-equiatomic TiNi Shape Memory Alloys. Mater. Trans. A 1997, 28, 537–544. [Google Scholar] [CrossRef]
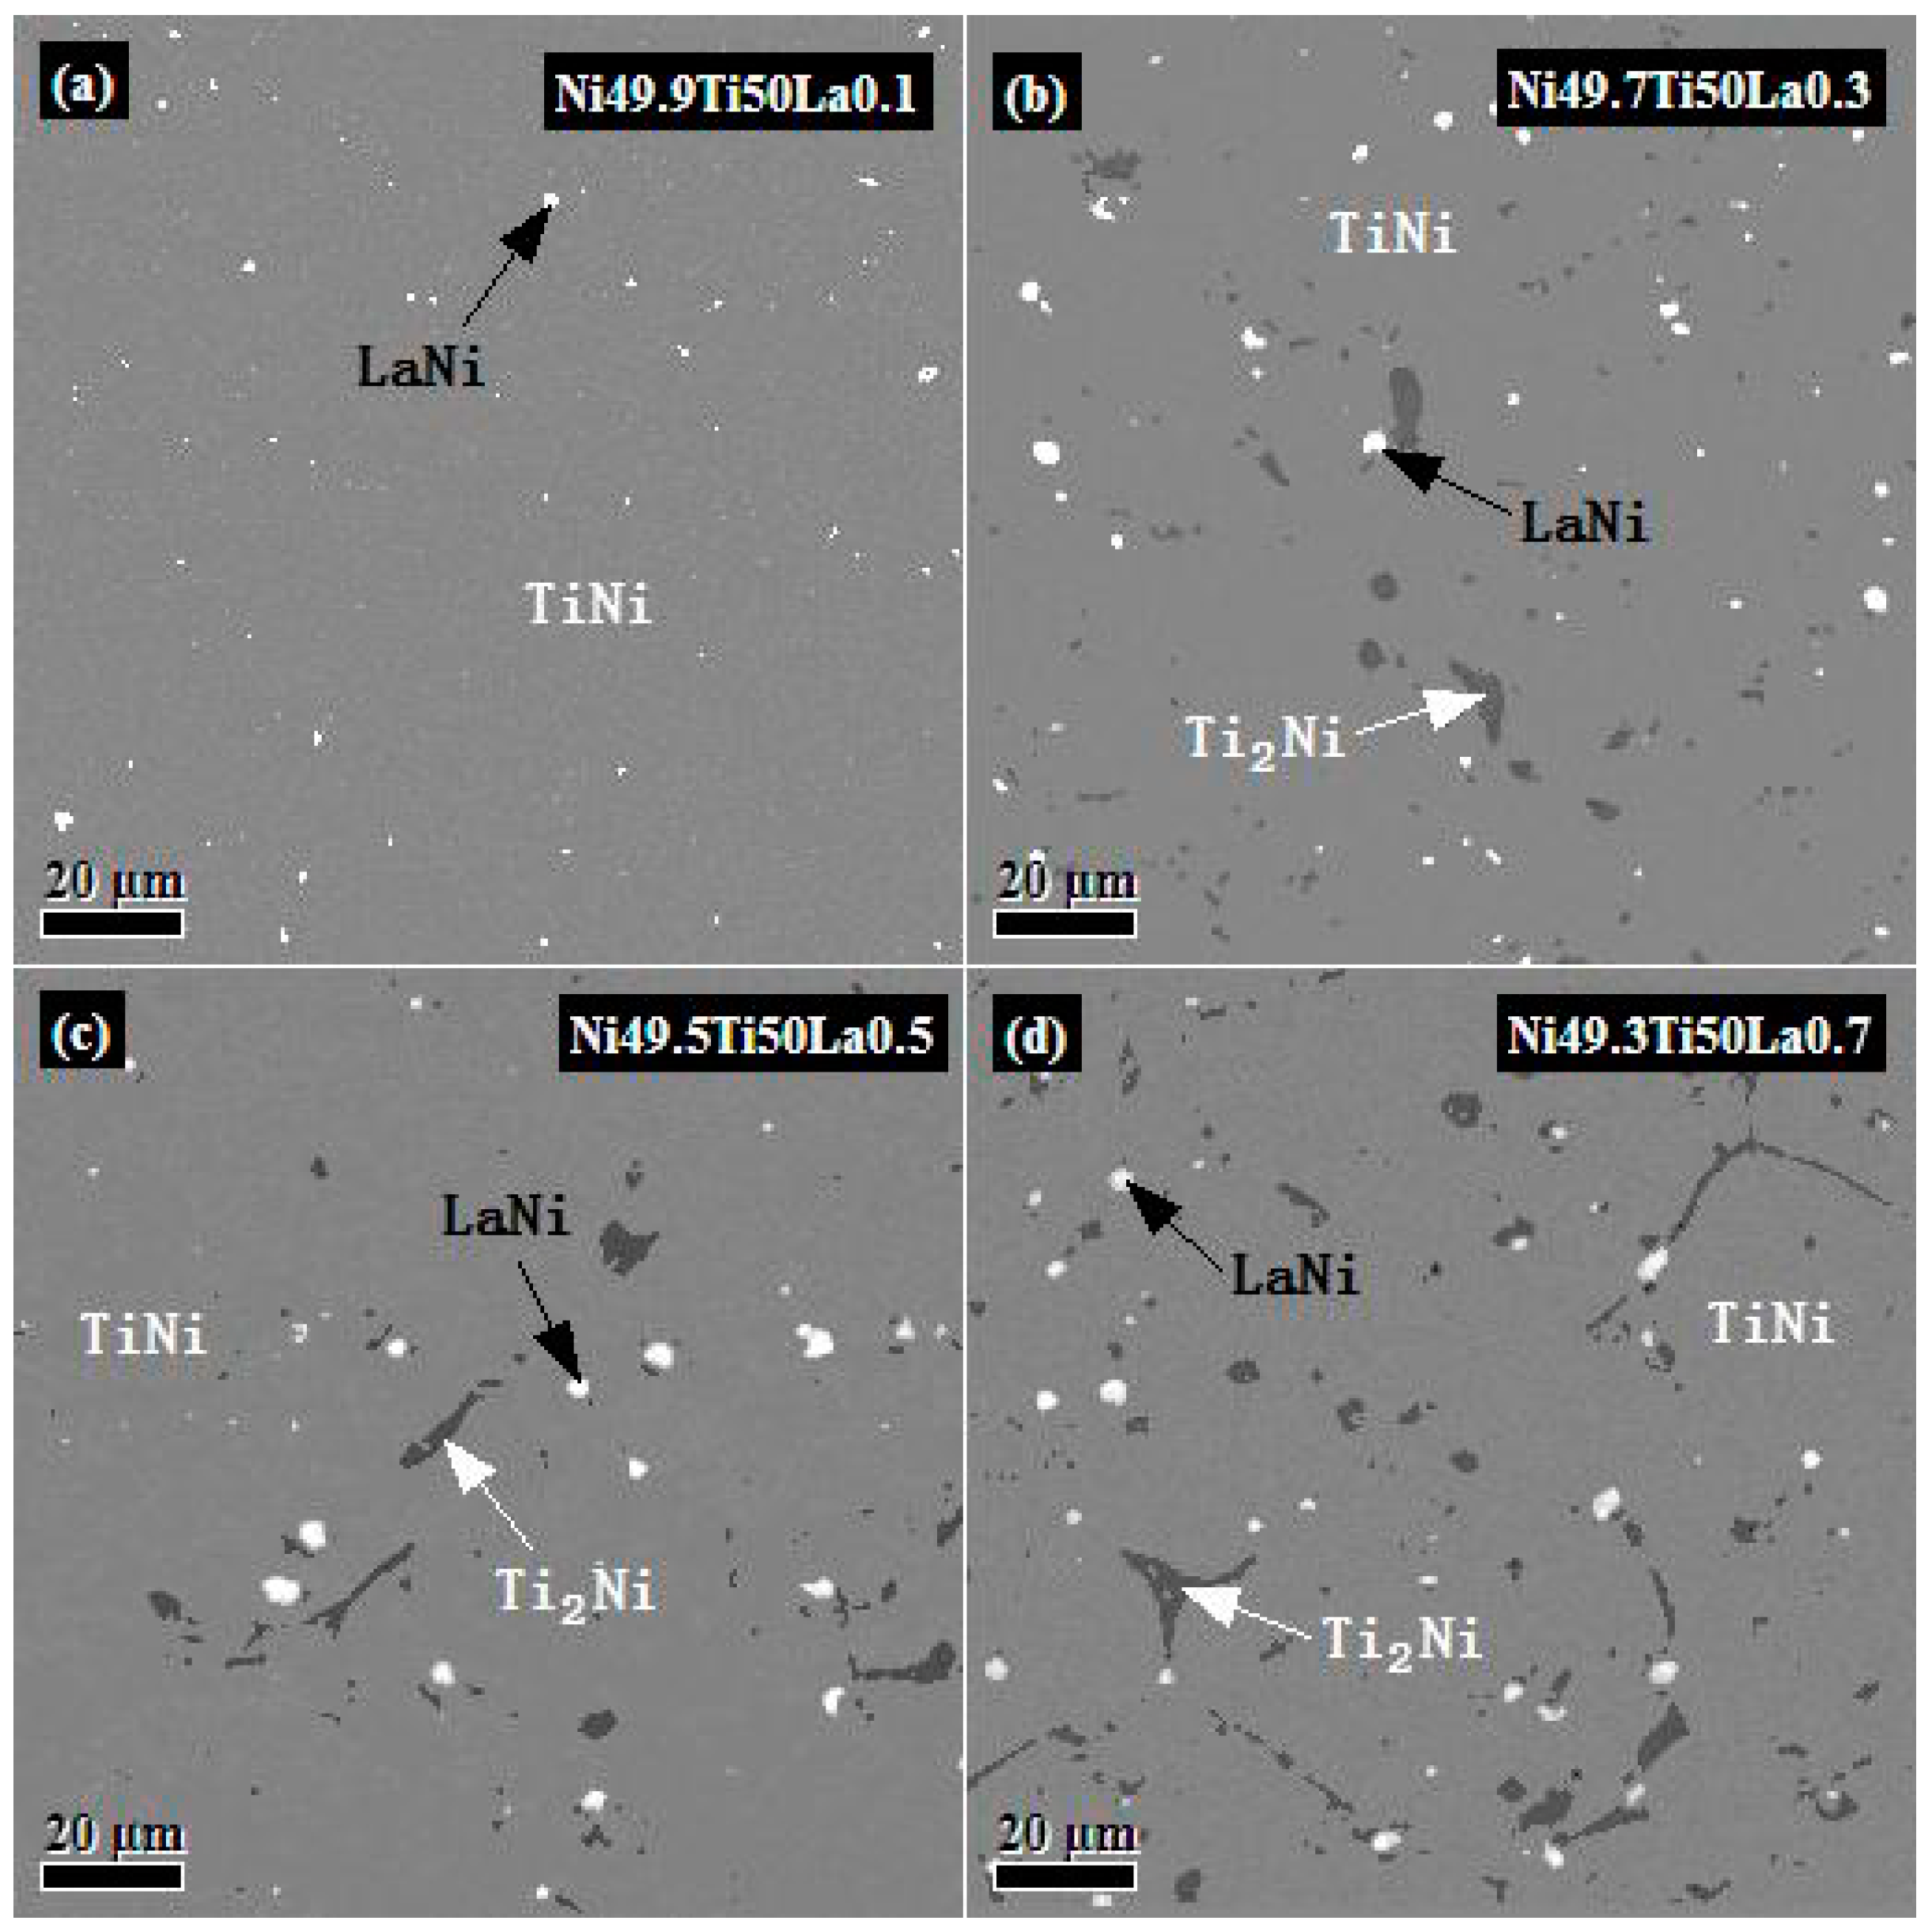
Figure 1. Back-scattering SEM images of Ni50−xTi50Lax alloys: (a) Ni49.9Ti50La0.1; (b) Ni49.7Ti50La0.3; (c) Ni49.5Ti50La0.5; (d) Ni49.3Ti50La0.7.
Crystals 08 00345 g001
Figure 2. Normalized pixel amounts of precipitates in SEM images of Ni50−xTi50Lax alloys.
Crystals 08 00345 g002
Figure 3. EDS spectra of phases in Ni49.3Ti50La0.7 alloy: (a) Ti2Ni; (b) TiNi; (c) LaNi.
Crystals 08 00345 g003aCrystals 08 00345 g003b
Figure 4. XRD patterns of Ni50−xTi50Lax alloys: (a) All alloys; (b) phases corresponding to diffraction peaks of Ni49.5Ti50La0.5.
Crystals 08 00345 g004
Figure 5. DSC results of Ni50−xTi50Lax alloys: (a) DSC curves; (b) Ms vs. La content.
Crystals 08 00345 g005
Table 1. Chemical composition of phases in Ni50−xTi50Lax alloys.
AlloysPhaseTi (at.%)Ni (at.%)La (at.%)
Ni49.9Ti50La0.1matrix50.649.4
bright precipitates 48.951.1
Ni49.7Ti50La0.3matrix50.449.6
bright precipitates 49.150.9
dark precipitates66.733.3
Ni49.5Ti50La0.5matrix51.049.0
bright precipitates 50.349.7
dark precipitates66.833.2
Ni49.3Ti50La0.7matrix50.949.1
bright precipitates 49.150.9
dark precipitates66.733.3
Table 2. Parameters of Ti, Ni, and La for formation enthalpy calculation.
n w s 1 / 3 V 2 / 3 ϕ
Ni1.753.55.2
Ti1.474.83.65
La1.187.942.86