Electro-optical Effect of Gold Nanoparticle Dispersed in Nematic Liquid Crystals


1
Graduate Institute of Photonics, National Changhua University of Education, Changhua 500, Taiwan
2
Department of Physics, National Changhua University of Education, Changhua 500, Taiwan
*
Author to whom correspondence should be addressed.
Crystals 2017, 7(10), 287; https://doi.org/10.3390/cryst7100287
Submission received: 13 July 2017
/
Revised: 21 September 2017
/
Accepted: 22 September 2017
/
Published: 23 September 2017
(This article belongs to the Special Issue Selected Papers from "3rd Asian Conference on Liquid Crystals, ACLC 2017")
Abstract
:The electro-optical performance of nematic liquid crystals (NLCs) dispersed with gold nanoparticles (GNPs) was investigated in this study. The addition of a small amount of GNP dopant decreased the threshold voltage for LC reorientation due to the decreased elastic constant and increased dielectric anisotropy of the LC mixture. The response time of the LC cell was decreased with the addition of tiny amounts of GNPs because of decrease in rotational viscosity of LCs. The doped GNPs also shorten LC reorientation angle during voltage switching, further decreasing the response time of the LC cell. The addition of high amounts of GNPs slowed down the response time of the LC cell, because excess GNPs aggregated and formed networks in the cell, thus disturbing LC alignment and hindering LC reorientation. The measured dielectric spectra of the GNP-LC mixture revealed that the addition of GNPs decreased the relaxation time constant of the LCs. This result confirmed that the GNP dopant decreased the rotational viscosity and elastic constant of the LCs.
1. Introduction
Over the past several years, liquid crystals (LCs) have attracted considerable attention because of their birefringence, which has potential applications in various devices, such as flat panel displays, optical lens, and spatial light modulators. Investigations on LC alignment methods and materials are indispensable in extending the applications of LC devices. However, most alignment methods are difficult, because of the complicated processing and apparatus required [1]. The composites of LCs and nanoparticles (NPs) are an intensely investigated soft matter, given the simple process of NP dispersal in LCs. LCs doped with various kinds of NPs exhibit improved performances. For example, a small amount of MgO NPs decreases the threshold voltage of LC devices [2]. Silica NPs suspended in LCs exhibit bi-stable characteristics [3]. Ferroelectric NP dopant significantly increases the dielectric anisotropy and rotational viscosity, and decreases the splay elastic constants of NLCs [4,5]. Doping with ZrO2 NPs suppresses the screening effect, which results from impurity ions in LC cells [6]. The addition of metallic NPs changes the elastic constant and the rotational viscosity of lyotropic LCs [7]. LCs exhibit faster operational speeds when doped with carbon nanotubes [8]. The addition of 14-nm diameter gold nanoparticles (GNPs) significantly changes the electro-optical behavior of a polymer-dispersed liquid crystal (PDLC) [9]. GNPs decrease threshold voltage, increase optical transmission at certain voltages, and influence the frequency response of PDLCs. The optical properties of NLCs near GNPs are markedly related to the anchoring conditions at the surface of the GNP [10]. GNP-doped NLC devices demonstrate alignment-controlled optical absorbance [11]. The magneto-optical properties of NLCs dispersed with ferromagnetic NPs have also been studied theoretically [12]. The dielectric and electrical properties of NLC/GNP composites have been widely studied; for example, inclusion of GNP in weakly polar NLCs lowers the nematic-isotropic transition temperature and increases the conductivity of the composites [13,14]; NLCs with doped tetraoctylammonium bromide (TOAB)-coated GNPs dramatically increase the two-beam coupling effect, and enhance the optical response due to changes in the anchoring strength and pretilt angle caused by both the surfactant TOAB and the GNPs [15]; LCs with organically functionalized GNP dopant induce an increase in conductivity and formation of electrode polarization at low frequencies [16]. The dielectric relaxation time and dielectric strength of twisted NLC cells doped with the monometallic or bimetallic NPs have been explained experimentally [17]. The fast response of super-twisted nematic cells doped with metallic NPs of Ag/Pd at low temperature has been studied by rotational viscosity measurement [18]. Metallic Ti NPs dispersed in NLCs decrease the threshold voltage and response time and pretilt angle of LC cells [19]. Generally, NP-doped LCs exhibit new features, such as low driving voltage [20], frequency modulation [21], and fast response [22]. NPs induce changes in the physical and chemical properties of LCs and improve the functions of LC devices.
In this paper, polarized optical microscopy (POM) was utilized to observe LC cells doped with various GNP concentrations. The influence of GNP concentration on voltage-dependent transmission, response time, and relaxation frequency of NLCs are reported in this paper. The experimental methods and results are discussed in the following sections.
2. Experimental Preparations
A 5-µm-thick empty cell was constructed with two indium–tin–oxide (ITO) glass substrates that were coated with homogeneous polyimide (PI). The top and bottom ITO glass substrates were rubbed in an antiparallel direction. The LC mixture consisted of nematic E7 (Daily Polymer Corp., Kaohsiung, Taiwan) and spherical GNP (particle diameter, 5 nm; Nanopartz Inc., Loveland, CO, USA). The spherical GNPs were firstly coated with the polymer polyvinylpyrrolidone (PVP) as a capping agent in order to improve the efficiency of distribution and stabilization in the LCs. The PVP-coated GNPs were then dispersed in the ethanol solvent to facilitate better compatibility with LCs. In our experiment, the GNP solution and nematic LCs E7 were mixed with ultrasonic stirrer, and the GNP concentrations were set at 0, 0.05, 0.07, 0.1 and 0.3 wt %. The empty cell was filled with the LC mixture by capillary action. The pre-tilt angles of the GNP-doped LC cells were measured via the crystal rotation method [23]. A He–Ne laser with a wavelength of 632.8 nm was utilized to measure the transmission versus voltage (T–V) curves of the GNP-doped LC cells. The waveform of the applied voltage was a 1 kHz square wave. The GNP-doped LC cell was placed between a pair of crossed polarizers. The rubbing direction of the cell had an angle of 45° with respect to the transmission axes of the polarizers. For the dielectric studies of the GNP-doped LC cells, the capacitance was measured by using a LCR meter (Hioki 3532-50, Nagano Prefecture, Japan). The applied AC field to the cell was 0.1 V/µm, and the frequency was changed from 1 kHz to 1 MHz.
3. Results and Discussion
Figure 1 shows the POM photographs of the LC cells doped with various concentrations of GNPs. The rubbing directions of the cells were set at 45° with respect to the transmission axes of the polarizer and analyzer. As observed in Figure 1a–c, the POM photographs of the GNP-doped LC cells with GNP concentrations below 0.07 wt % exhibit uniform colors, indicating that the LCs are uniformly aligned in an orderly fashion. The white defects indicate the employed ball spacers. When the GNP concentration reaches 0.1 wt %, connected networks appear in the cell due to the aggregation of GNPs and the disordered LC alignment near the GNPs, as observed in Figure 1d. At 0.3 wt % GNP concentration, numerous connected networks formed by GNP aggregations occupy the cell and disturb the LC alignment, as shown in Figure 1e. The directions of the connected networks are oriented along the rubbing direction of the cell because the colloidal particles dispersed in the NLCs self-align in the direction of LC alignment satisfied by the formation of an accompanying hyperbolic defect [24]. The dark images in the LC cells with GNP concentration above 0.1 wt % are caused by auto exposure compensation of the digital camera used. The pretilt angles of the GNP-doped LC cells with various GNP concentrations almost remain constant at ~1.5°. The measured T-V curves also confirm the LCs are aligned at a low pretilt angle in the GNP-doped LC cells.
Figure 2 shows the T–V curves of the pristine E7 and of GNP-doped LC cells. Compared with that of the pristine E7 LC cell, the T–V curves of GNP-doped LC cells are shifted towards the left side, indicating that the GNP-doped LC cells require a relatively low operation voltage. The T–V curves also reveal that the threshold voltage of the cell decreases with increasing GNP concentration, as shown in the inset of Figure 2. The threshold voltage is defined as the voltage when the initial transmission of the cell begins to change. The highest reduction in threshold voltage is 21% with a GNP dopant concentration of 0.07 wt %. According to Equation (1) [25],
the threshold voltage (Vth) of the LC cell is proportional to the square root of the elastic constant K and is inversely proportional to the square root of the dielectric anisotropy Δε. The nematic-isotropic transition temperature of pristine E7 is 62 °C, whereas that of LC mixture with GNP concentration of 0.3 wt % is 44 °C. This indicates that doping GNPs markedly decreases the order parameter of NLCs. As is well known, the elastic constant is proportional to the square of the order parameter S, indicating that the addition of GNPs also decreases the elastic constant of the LCs. Furthermore, the dielectric anisotropy of LCs was obtained by the dielectric spectrum measurement. The measured dielectric anisotropies of LCs doped with GNP concentrations of 0, 0.05, 0.07 and 0.1 wt % are 12.62, 12.99, 13.02 and 13.32, respectively. The dielectric anisotropy of NLCs slightly increases with GNP doping. Accordingly, the reduction of threshold voltage of the LC cell is related to the simultaneously decreased elastic constant and increased dielectric anisotropy of the LC mixture. As shown in Figure 2, the transmissions of the pristine LC and 0.05 wt % GNP-doped cells initially rise and then decline with the supplied voltages, whereas those of the other cells decline directly with the supplied voltage. This indicates that the phase retardations of the pristine LC and 0.05 wt % GNP-doped cells are slightly larger than those of the other cells. The differences in phase retardations may also be caused by the slightly cell gap errors. Notably, the doped GNPs may also disorder the LC alignment, and hence reduce the threshold voltages and phase retardations of the LC cells. If cell gap errors are ruled out, the birefringence of NLCs can be evaluated by the T–V curve, indicating that the birefringence of NLCs with GNP concentrations of 0, 0.05, 0.07, 0.1 and 0.3 wt % are 0.19, 0.19, 0.17, 0.17 and 0.18, respectively. With GNP dopant, the slight decrease in birefringence of NLCs possibly originates from the disorder of the LC alignment.
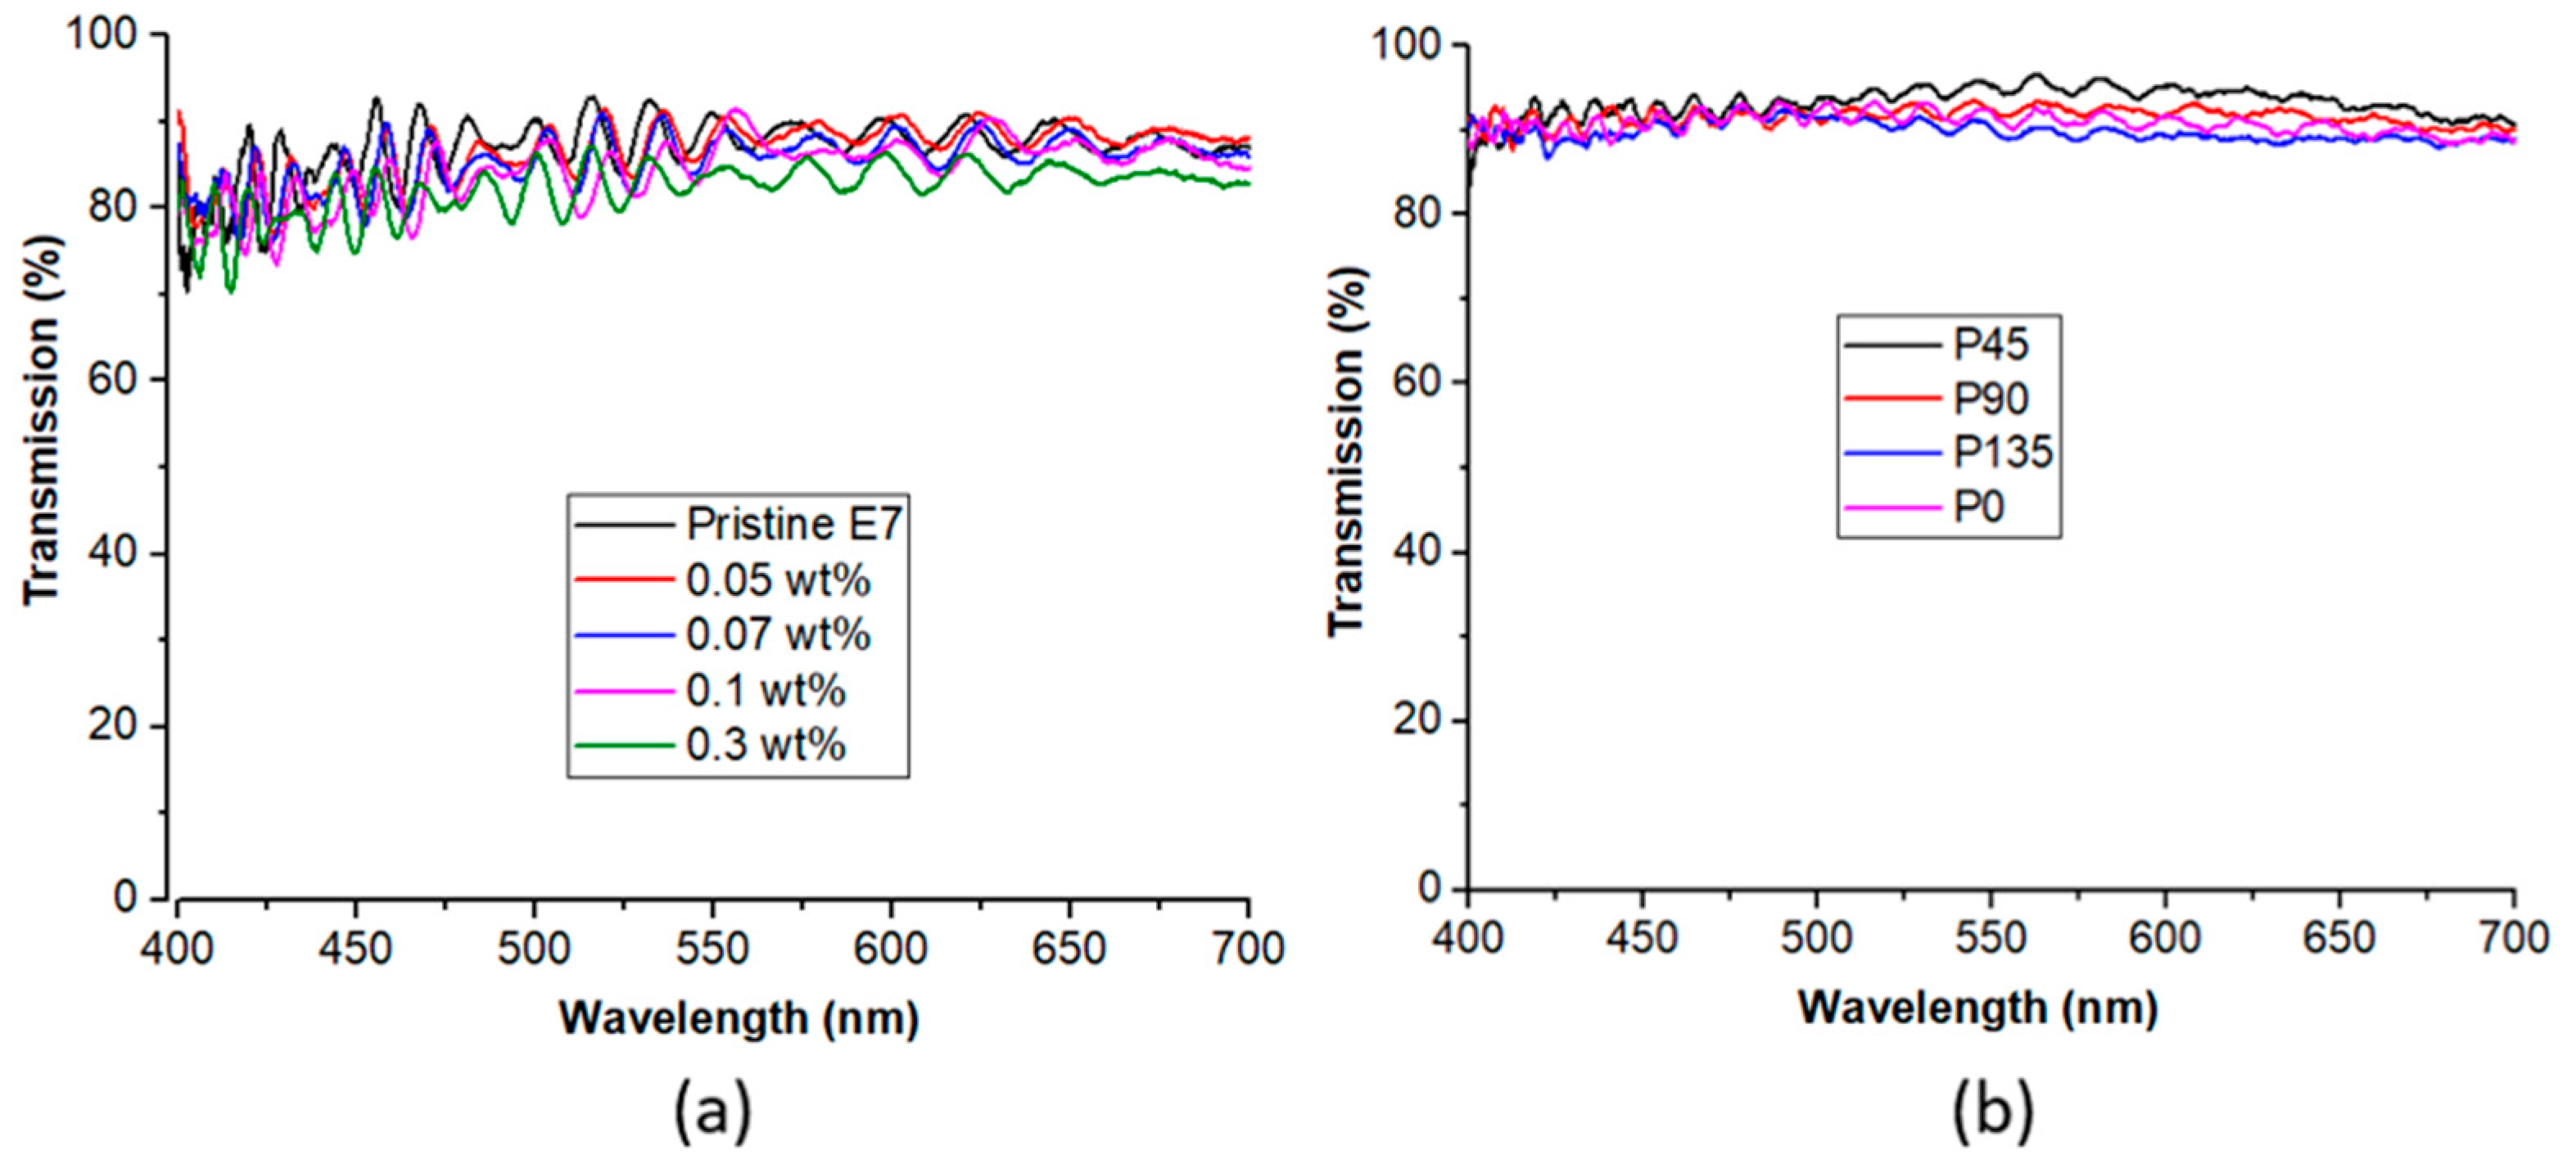
Figure 3a shows the transmission spectra of the pristine E7 and of LC cells doped with various GNP concentrations. At GNP concentration below 0.1 wt %, the transmissions of the GNP-doped LC cells are almost identical to that of the pristine E7 cell. When the GNP concentration reaches 0.3 wt %, the transmission of the GNP-doped LC cell decreases by ~4% due to light scattering, because the dispersed GNPs disturb LC alignment around GNPs and scatter incident light. The slight decrease in the transmission indicates that the scattering caused by the doped GNPs is negligible. The color impression of the GNP solution used is reddish. The missing resonance peak in Figure 3a is attributed to the low GNP concentration doped in the nematic host. As shown in Figure 3b, the transmissions of the 0.3 wt % GNP-doped cell with different polarizations of incident light almost remain at the same level. Thus, the transmission of GNP-doped LC cell is polarization independent with tiny GNP dopant. The surface plasmon resonance effect of the GNP-doped LC cell will be investigated in the near future.
Response time is also an important index for the performance of the LC devices. In this study, the rise (fall) time is defined as the time required for the transmission change of the LC cell when the voltage is suddenly turned on (off) from 2 V to 10 V (10 V to 2 V). As observed in Figure 4, the rise and fall times decrease with increasing GNP concentrations. According to Equations (2) and (3) [26,27], for small LC reorientation angles with the supplied voltage slightly above Vth, both rise (τr) and fall (τf) times of the LC cell can be estimated by the effective rotational viscosity ηi,
where E, Δε, d, Kii and αi are the applied electric field, dielectric anisotropy, cell gap, elastic constant, and Leslie coefficients, respectively. γ1 = α3 – α2 is the rotational viscosity of twist deformation. Notably, in measuring the response time of the cell in this paper, the supplied voltage is far above Vth, consequently, the measured rise and fall times cannot be accurately estimated by Equations (2) and (3), owing to the intense flow effect in the cell. Nonetheless, Equations (2) and (3) still macroscopically explain that the response times of LC cell are dependent on the change of LC rotational viscosity. As shown in Figure 4, when the GNP concentration drops below 0.07 wt %, the rise and fall times of the cells simultaneously decrease with the increasing GNP concentrations, due to the decreased rotational viscosity. Furthermore, as shown in Figure 2, at 2 V, the transmittances of the cells are decreased with the increasing GNP concentration, indicating the increased LC tilted angle with GNP doping owing to the decreased Vth. In this paper, the response times of the cells are measured from 2 V to 10 V. The increased tilt angle at 2 V with GNP dopant indicates that the shortened LC reorientation angle when the voltage is switched between 2 V and 10 V. The shortened reorientation angle also decreases the response time of the LC cell. Once the GNP concentration exceeds 0.07 wt %, the excess GNPs hinder the reorientation of LCs, thus slowing down the rise and fall times of the cells. Notably, the maximum decrease in rise time and fall time due to GNP addition are ~9% and ~24%, respectively, compared with that of the pristine E 7 LC cell. The extent of the decrease in rise time is less than that in fall time, because rise time is mainly determined by the supplied voltage. The variation of surface anchoring energy due to GNP addition can be neglected, owing to the tiny GNP dopant and strong surface anchoring energy on the substrate resulted from the commercially available PI.
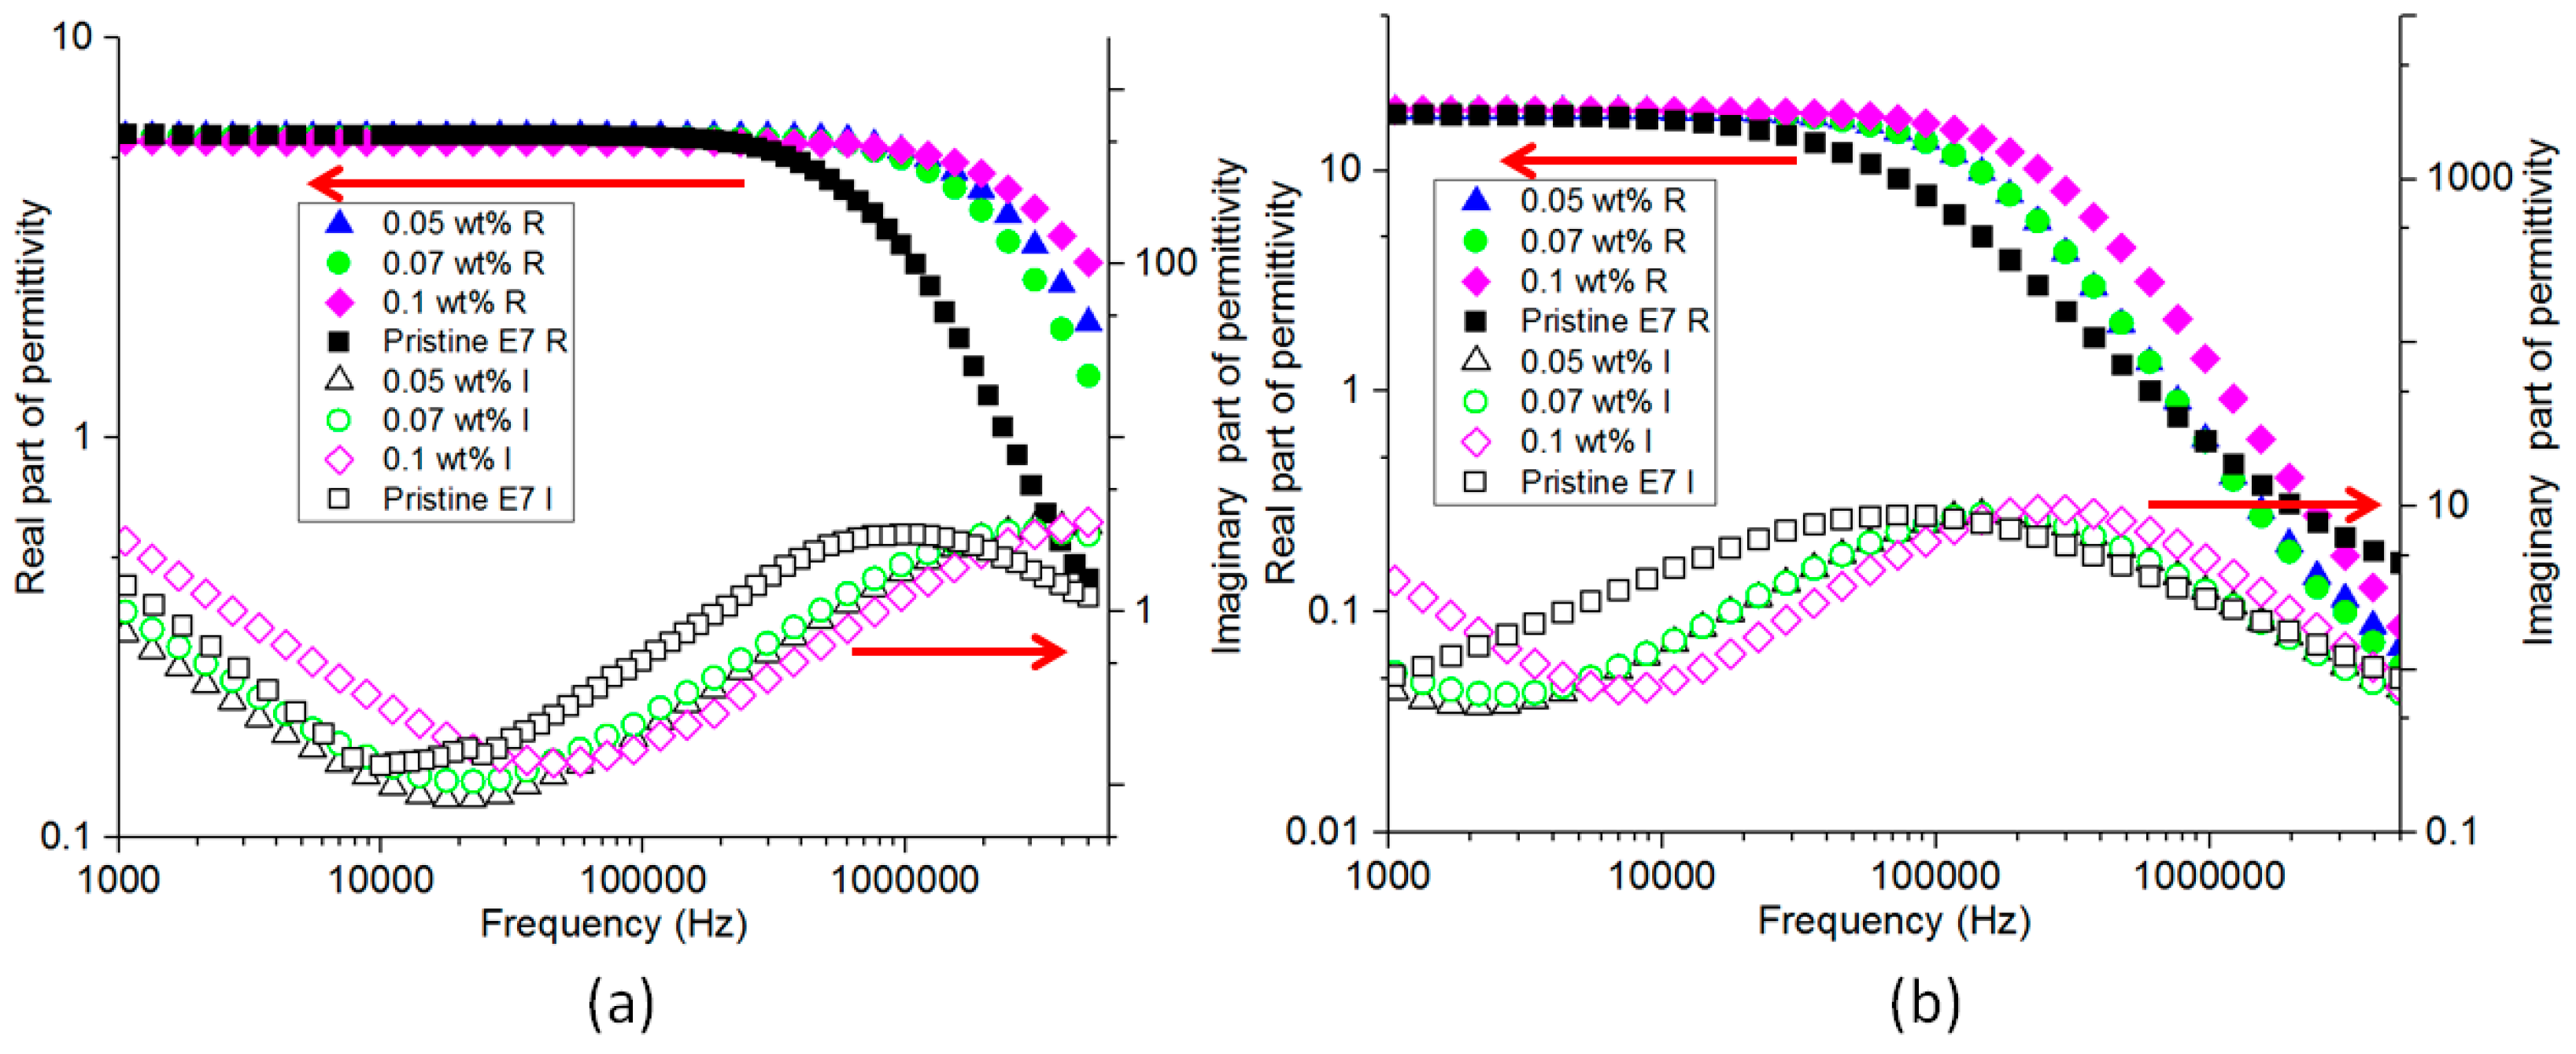
To analyze the dielectric relaxation of the LC mixture, the vertically aligned LC cell was constructed with two ITO glass substrates that were coated with vertical PI. Figure 5 shows the dielectric spectra of the pristine E7 and GNP-doped LC cells at various GNP concentrations. In the homogeneously aligned cell, the direction of the LCs is parallel to the substrate surface, and is thus perpendicular to the direction of supplied electric field. In contrast, in the vertically aligned cell, the direction of the LCs is perpendicular to the substrate surface, and is thus parallel to the direction of supplied electric field. When a dielectric medium is supplied with an external electric field, it attains a new equilibrium state through dielectric relaxation. Dielectric relaxation is a reflection of the fact that electric displacement requires a finite time to reach equilibrium. To confirm the relaxation mode, the dielectric spectra of the empty cell were measured, indicating that the relaxation frequency of the empty cell appeared at ~107 Hz, which was the cell relaxation originating from the finite resistance of the ITO electrode and the inductance of connecting wires used in the cell [28,29]. Furthermore, as demonstrated in the literature [30,31], in a homogeneously aligned cell filled with pristine E7, the relaxation frequencies of the cell without and with voltage (40 V) supplied were observed at ~1 MHz and ~105 Hz, respectively. The relaxation frequency at 1 MHz was attributed to the LC reorientation along the long axis, and that at 105 Hz was mainly attributed to the LC reorientation along the short axis. Once the supplied voltage was higher than 40 V, or the pristine E7 was placed in a vertically-aligned cell, the relaxation frequency decreased further. As shown in Figure 5, it was obtained that the relaxation frequency of the homogeneously aligned cell occurred at ~1 MHz, whereas that of the vertically aligned cell occurred at 7.6 ×10⁴ Hz. Notably, the relaxation frequency was significantly dependent on the temperature [32].
As shown in Figure 5b, near the frequency of 105 Hz, the peak frequency fp of the vertically aligned cell increases with increasing GNP concentrations. This relaxation mode is consequently related to the LC reorientation along the short axis. The relaxation time τ of LCs is related to the peak frequency fp of the dielectric loss of the LC mixture, as shown in Equation (6).
The addition of GNPs significantly increases the peak frequency of the dielectric loss of the LC mixture, and hence decreases the relaxation time of LCs. Further, Meier and Saupe indicate that the relaxation time τ is related to the potential barrier parameter η in the vertically aligned cell [33]:
where b is the rotation barrier height of the flip-flops around the axis, R is the gas constant, and T is the temperature. The barrier height b impedes the molecular rotations, therefore the relaxation time τ has been slow down in comparison with the situation when the potential b = 0. They also introduce the retardation factor g, in which the potential barrier parameter η is proportional to the dielectric relaxation time τ [34],
where τ0 corresponds to a hypothetical state with b = 0. In Figure 5b, GNP addition significantly decreases the relaxation time of the LC cell, decreases the rotation barrier height b around the short axes of the LCs and the associated rotational viscosity γ of LC mixture [35]. The decreased rotational viscosity accelerates the response time of the LC cell with GNP doping. It is worth mentioning that the accurate relaxation frequencies of LC medium should be higher than those of the measured cells in this experiment, because of the cell relaxation [28,29]. The cell relaxation also causes the measured real part of permittivity to be below the vacuum permittivity at high frequencies. Because of the lack of accurate ITO resistance and inductance of the wire, the exact relaxation frequencies of LCs are not estimated further. However, the effects of GNPs on LC materials can still be observed and explained. At 1 kHz, the dielectric losses of the LC mixtures are similar when the GNP concentrations are below 0.07 wt %. Once the GNP concentration reaches 0.1 wt %, the dielectric loss of the LC mixture increases significantly, because the excess GNP dopant contaminates the LC host with mobile charge carriers, increases the conductivity of the LC mixture [16]. Simultaneously, GNP dopant does not significantly change the measured permittivity, indicating that the trapping of ion impurities on the surfaces of GNPs is negligible under tiny GNP dopant, as shown in Figure 5. Consequently, the reduction of threshold voltage mainly originates from the increase in dielectric anisotropy and the decrease in the elastic constant of the LC mixture. To observe the change in relaxation frequency of LC mixture in the splay deformation with GNP doping, the dielectric spectra of the pristine E7 and 0.07 wt % GNP-doped LC cells are measured with the supplied voltage of 1 V. The peak frequencies of the dielectric loss of the pristine E7 and 0.07 wt % GNP-doped LC cells occur at 2.4 × 10⁶ Hz and 3.1 × 10⁶ Hz, respectively. Notably, GNP doping increases the peak frequency, and hence decreases the rotational viscosity of the LC mixture in the splay deformation, further confirming that GNP doping decreases rotational viscosity and the associated response time of the cell.
In [19], the grains of NP aggregation are observed when Ti NP concentration exceeds 1 wt %. The pretilt angle and fall time decreases with Ti NP addition. This is because the ion impurities near the alignment layers are trapped on the surfaces of metallic NPs, and therefore enhance the van der Waals dispersion interactions between the LCs and alignment layers. Furthermore, the decreased threshold voltage and rise time with Ti NP dopant are caused by two factors: the increased electric field strength in the LC bulk near the metallic NPs by the focused electric flux; and the decreased screening effect by the ion impurities trapped on the surfaces of the metallic NPs. In this study, however, the networks of NP aggregation are observed at a relatively low GNP concentration (0.1 wt %), and the directions of the connected networks are oriented along the rubbing direction of the LC cell. The pretilt angles of the GNP-doped LC cells at various GNP concentrations are kept almost constant. In addition, the permittivity of the GNP-doped LC cells has not changed significantly at 1 kHz, indicating that the effect of ion impurities trapped on the surfaces of GNPs is negligible under tiny GNP dopant. Consequently, the decreased threshold voltage and response time of the LC cell are mainly related to changes in physical parameters of NLCs, such as elastic constant, dielectric anisotropy, and rotational viscosity.
4. Conclusions
The electro-optical properties of GNP-doped LC cells are demonstrated in this experiment. The obtained results indicate that the optimal GNP concentration is ~0.07 wt %. At this concentration, the response time and threshold voltage of the LC cell decrease by 28% and 21%, respectively, compared with those of the pristine LC cell. The reduction of threshold voltage is caused by the decreased elastic constant and increased dielectric anisotropy of LC mixture. On the other hand, the doped GNPs decrease rotational viscosity of LC-GNP mixture and also shorten the LC reorientation angle during voltage switching, accelerating the response time of GNP-doped LC cell. The applications of the GNP-NLC composite on electro-optic devices are underway.
Acknowledgments
The work was supported by Ministry of Science and Technology, Taiwan (Most 101-2112-M-018-002-MY3, Most 103-2622-E-018-007-CC3, Most 104-2811-M-018-001, and Most 105-2811-M-018-003).
Author Contributions
Che-Ju Hsu conceived and designed the experiments; Li-Jyuan Lin performed the experiments; Che-Ju Hsu, Mao-Kun Huang, and Chi-Yen Huang analyzed the data; Chi-Yen Huang contributed reagents/materials/analysis tools; Che-Ju Hsu and Chi-Yen Huang wrote the paper.
Conflicts of Interest
The authors declare no conflict of interest. The founding sponsors had no role in the design of the study.
Abbreviations
The following abbreviations are used in this manuscript:
| NLC | nematic liquid crystal |
| GNP | gold nanoparticle |
| LC | liquid crystal |
| NP | nanoparticle |
| PDLC | polymer-dispersed liquid crystal |
| POM | polarized optical microscope |
| ITO | indium–tin–oxide |
| PI | polyimide |
| T-V | transmission versus voltage |
References
- Park, H.-G.; Lee, J.-J.; Dong, K.-Y.; Oh, B.-Y.; Kim, Y.-H.; Jeong, H.-Y.; Ju, B.-K.; Seo, D.-S. Homeotropic alignment of liquid crystals on a nano-patterned polyimide surface using nanoimprint lithography. Soft Matter 2011, 7, 5610–5614. [Google Scholar] [CrossRef]
- Fumiaki, H.; Kei-ichi, I.; Naoki, T.; Shunsuke, K.; Kohki, T. Reduction of the threshold voltages of nematic liquid crystal electrooptical devices by doping inorganic nanoparticles. Jpn. J. Appl. Phys. 2007, 46, L796. [Google Scholar]
- Huang, C.-Y.; Lai, C.-C.; Tseng, Y.-H.; Yang, Y.-T.; Tien, C.-J.; Lo, K.-Y. Silica-nanoparticle-doped nematic display with multistable and dynamic modes. Appl. Phys. Lett. 2008, 92, 221908. [Google Scholar] [CrossRef]
- Kurochkin, O.; Buchnev, O.; Iljin, A.; Park, S.K.; Kwon, S.B.; Grabar, O.; Yu, R. A colloid of ferroelectric nanoparticles in a cholesteric liquid crystal. J. Opt. A Pure Appl. Opt. 2009, 11, 024003. [Google Scholar] [CrossRef]
- Podoliak, N.; Buchnev, O.; Herrington, M.; Mavrona, E.; Kaczmarek, M.; Kanaras, A.G.; Stratakis, E.; Blach, J.-F.; Henninot, J.-F.; Warenghem, M. Elastic constants, viscosity and response time in nematic liquid crystals doped with ferroelectric nanoparticles. RSC Adv. 2014, 4, 46068–46074. [Google Scholar] [CrossRef]
- Kim, H.-J.; Kang, Y.-G.; Park, H.-G.; Lee, K.-M.; Yang, S.; Jung, H.-Y.; Seo, D.-S. Effects of the dispersion of zirconium dioxide nanoparticles on high performance electro-optic properties in liquid crystal devices. Liq. Cryst. 2011, 38, 871–875. [Google Scholar] [CrossRef]
- Zhang, G.; Chen, X.; Zhao, J.; Chai, Y.; Zhuang, W.; Wang, L. Electrophoretic deposition of silver nanoparticles in lamellar lyotropic liquid crystal. Mater. Lett. 2006, 60, 2889–2892. [Google Scholar] [CrossRef]
- Lu, S.-Y.; Chien, L.-C. Carbon nanotube doped liquid crystal ocb cells: Physical and electro-optical properties. Opt. Express 2008, 16, 12777–12785. [Google Scholar] [CrossRef] [PubMed]
- Podgornov, F.V.; Ryzhkova, A.V.; Haase, W. Influence of gold nanorods size on electro-optical and dielectric properties of ferroelectric liquid crystals. Appl. Phys. Lett. 2010, 97, 212903. [Google Scholar] [CrossRef]
- Yannopapas, V.; Fytas, N.; Kyrimi, V.; Kallos, E.; Vanakaras, A.G.; Photinos, D.J. Light scattering by a metallic nanoparticle coated with a nematic liquid crystal. Phys. Status Solidi (a) 2013, 210, 335–340. [Google Scholar] [CrossRef]
- Peroukidis, S.D.; Yannopapas, V.; Vanakaras, A.G.; Droulias, S.; Photinos, D.J. Plasmonic response of ordered arrays of gold nanorods immersed within a nematic liquid crystal. Liq. Cryst. 2014, 41, 1430–1435. [Google Scholar] [CrossRef]
- Yannopapas, V.; Klapp, S.H.L.; Peroukidis, S.D. Magneto-optical properties of liquid-crystalline ferrofluids. Opt. Mater. Express 2016, 6, 2681–2688. [Google Scholar] [CrossRef]
- Prasad, S.K.; Kumar, M.V.; Shilpa, T.; Yelamaggad, C. Enhancement of electrical conductivity, dielectric anisotropy and director relaxation frequency in composites of gold nanoparticle and a weakly polar nematic liquid crystal. RSC Adv. 2014, 4, 4453–4462. [Google Scholar] [CrossRef]
- Krishna Prasad, S.; Sandhya, K.; Nair, G.G.; Hiremath, U.S.; Yelamaggad, C.; Sampath, S. Electrical conductivity and dielectric constant measurements of liquid crystal–gold nanoparticle composites. Liq. cryst. 2006, 33, 1121–1125. [Google Scholar] [CrossRef]
- Podoliak, N.; Bartczak, D.; Buchnev, O.; Kanaras, A.G.; Kaczmarek, M. High optical nonlinearity of nematic liquid crystals doped with gold nanoparticles. J. Phys. Chem. C. 2012, 116, 12934–12939. [Google Scholar] [CrossRef]
- Urbanski, M.; Lagerwall, J.P. Nanoparticles dispersed in liquid crystals: Impact on conductivity, low-frequency relaxation and electro-optical performance. J. Mater. Chem. C 2016, 4, 3485–3491. [Google Scholar] [CrossRef]
- Kobayashi, S.; Miyama, T.; Nishida, N.; Sakai, Y.; Shiraki, H.; Shiraishi, Y.; Toshima, N. Dielectric spectroscopy of metal nanoparticle doped liquid crystal displays exhibitingfrequency modulation response. J. Display Technol. 2006, 2, 121–129. [Google Scholar] [CrossRef]
- Miyamoto, K.; Saito, S.; Takahashi, T.; Toko, Y.; Yokoyama, S.; Takigawa, S.; Toshima, N.; Kobayashi, S. Characteristics of nanoparticle doped nematic liquid crystals in low temperature. Mol. Cryst. Liq. Cryst. 2009, 507, 108–113. [Google Scholar] [CrossRef]
- Ha, Y.-S.; Kim, H.-J.; Park, H.-G.; Seo, D.-S. Enhancement of electro-optic properties in liquid crystal devices via titanium nanoparticle doping. Opt. Express 2012, 20, 6448–6455. [Google Scholar] [CrossRef] [PubMed]
- Lee, W.-K.; Choi, J.-H.; Na, H.-J.; Lim, J.-H.; Han, J.-M.; Hwang, J.-Y.; Seo, D.-S. Low-power operation of vertically aligned liquid-crystal system via anatase-TiO 2 nanoparticle dispersion. Opt. Lett. 2009, 34, 3653–3655. [Google Scholar] [CrossRef] [PubMed]
- Shiraishi, Y.; Toshima, N.; Maeda, K.; Yoshikawa, H.; Xu, J.; Kobayashi, S. Frequency modulation response of a liquid-crystal electro-optic device doped with nanoparticles. Appl. Phys. Lett. 2002, 81, 2845–2847. [Google Scholar] [CrossRef]
- Lee, W.; Wang, C.-Y.; Shih, Y.-C. Effects of carbon nanosolids on the electro-optical properties of a twisted nematic liquid-crystal host. Appl. Phys. Lett. 2004, 85, 513–515. [Google Scholar] [CrossRef]
- Kwan-Young, H.; Tetsuya, M.; Tatsuo, U. Accurate determination and measurement error of pretilt angle in liquid crystal cell. Jpn. J. Appl. Phys. 1993, 32, L277. [Google Scholar]
- Loudet, J.C. Colloidal inclusions in liquid crystals: Phase separation mechanisms and some dynamical aspects. Liq. Cryst. Today 2005, 14, 1–14. [Google Scholar] [CrossRef]
- Schadt, M. The twisted nematic effect: Liquid crystal displays and liquid crystal materials. Mol. Cryst. Liq. Cryst. Inc. Nonlinear Opt. 1988, 165, 405–438. [Google Scholar] [CrossRef]
- Blinov, L.M.; Chigrinov, V. Electrooptic Effects in Liquid Crystal Materials; Springer: New York, NY, USA, 2012. [Google Scholar]
- Jakeman, E.; Raynes, E.P. Electro-optic response times in liquid crystals. Phys. Lett. A 1972, 39, 69–70. [Google Scholar] [CrossRef]
- Perkowski, P. Dielectric spectroscopy of liquid crystals. Theoretical model of ito electrodes influence on dielectric measurements. Opto-Electron. Rev. 2009, 17, 180–186. [Google Scholar] [CrossRef]
- Perkowski, P. Dielectric spectroscopy of liquid crystals. Electrodes resistivity and connecting wires inductance influence on dielectric measurements. Opto-Electron. Rev. 2012, 20, 79–86. [Google Scholar] [CrossRef]
- Rahman, M.; Hsieh, C.-W.; Wang, C.-T.; Jian, B.-R.; Lee, W. Dielectric relaxation dynamics in liquid—dye composites. Dyes Pigm. 2010, 84, 128–133. [Google Scholar] [CrossRef]
- Okutan, M.; Yakuphanoglu, F.; Köysal, O.; Durmuş, M.; Ahsen, V. Dielectric spectroscopy analysis in employing liquid crystal phthalonitrile derivative in nematic liquid crystals. Spectrochim. Acta Part A: Mol. Biomol. Spectrosc. 2007, 67, 531–535. [Google Scholar] [CrossRef] [PubMed]
- Brás, A.R.; Dionísio, M.; Huth, H.; Schick, C.; Schönhals, A. Origin of glassy dynamics in a liquid crystal studied by broadband dielectric and specific heat spectroscopy. Phys. Rev. E 2007, 75, 061708. [Google Scholar] [CrossRef] [PubMed]
- Shin, H.K.; Seo, J.-H.; Yoon, T.-H.; Kim, J.C.; Woo, H.S.; Shin, S.T. Effects of pentacene on the properties of negative anisotropy nematic liquid crystal in vertical alignment cell. Jpn. J. Appl. Phys. 2009, 48, 111502. [Google Scholar] [CrossRef]
- Haase, W.; Wróbel, S. Relaxation Phenomena: Liquid Crystals, Magnetic Systems, Polymers, High-Tc Superconductors, Metallic Glasses; Springer: Berlin/Heidelberg, Germany, 2013. [Google Scholar]
- Liao, S.-W.; Hsieh, C.-T.; Kuo, C.-C.; Huang, C.-Y. Voltage-assisted ion reduction in liquid crystal-silica nanoparticle dispersions. Appl. Phys. Lett. 2012, 101, 161906. [Google Scholar] [CrossRef]
Figure 1.
POM photographs of LC cells doped with GNP concentrations of (a) 0 wt %, (b) 0.05 wt %, (c) 0.07 wt %, (d) 0.1 wt %, and (e) 0.3 wt %.
Figure 1.
POM photographs of LC cells doped with GNP concentrations of (a) 0 wt %, (b) 0.05 wt %, (c) 0.07 wt %, (d) 0.1 wt %, and (e) 0.3 wt %.
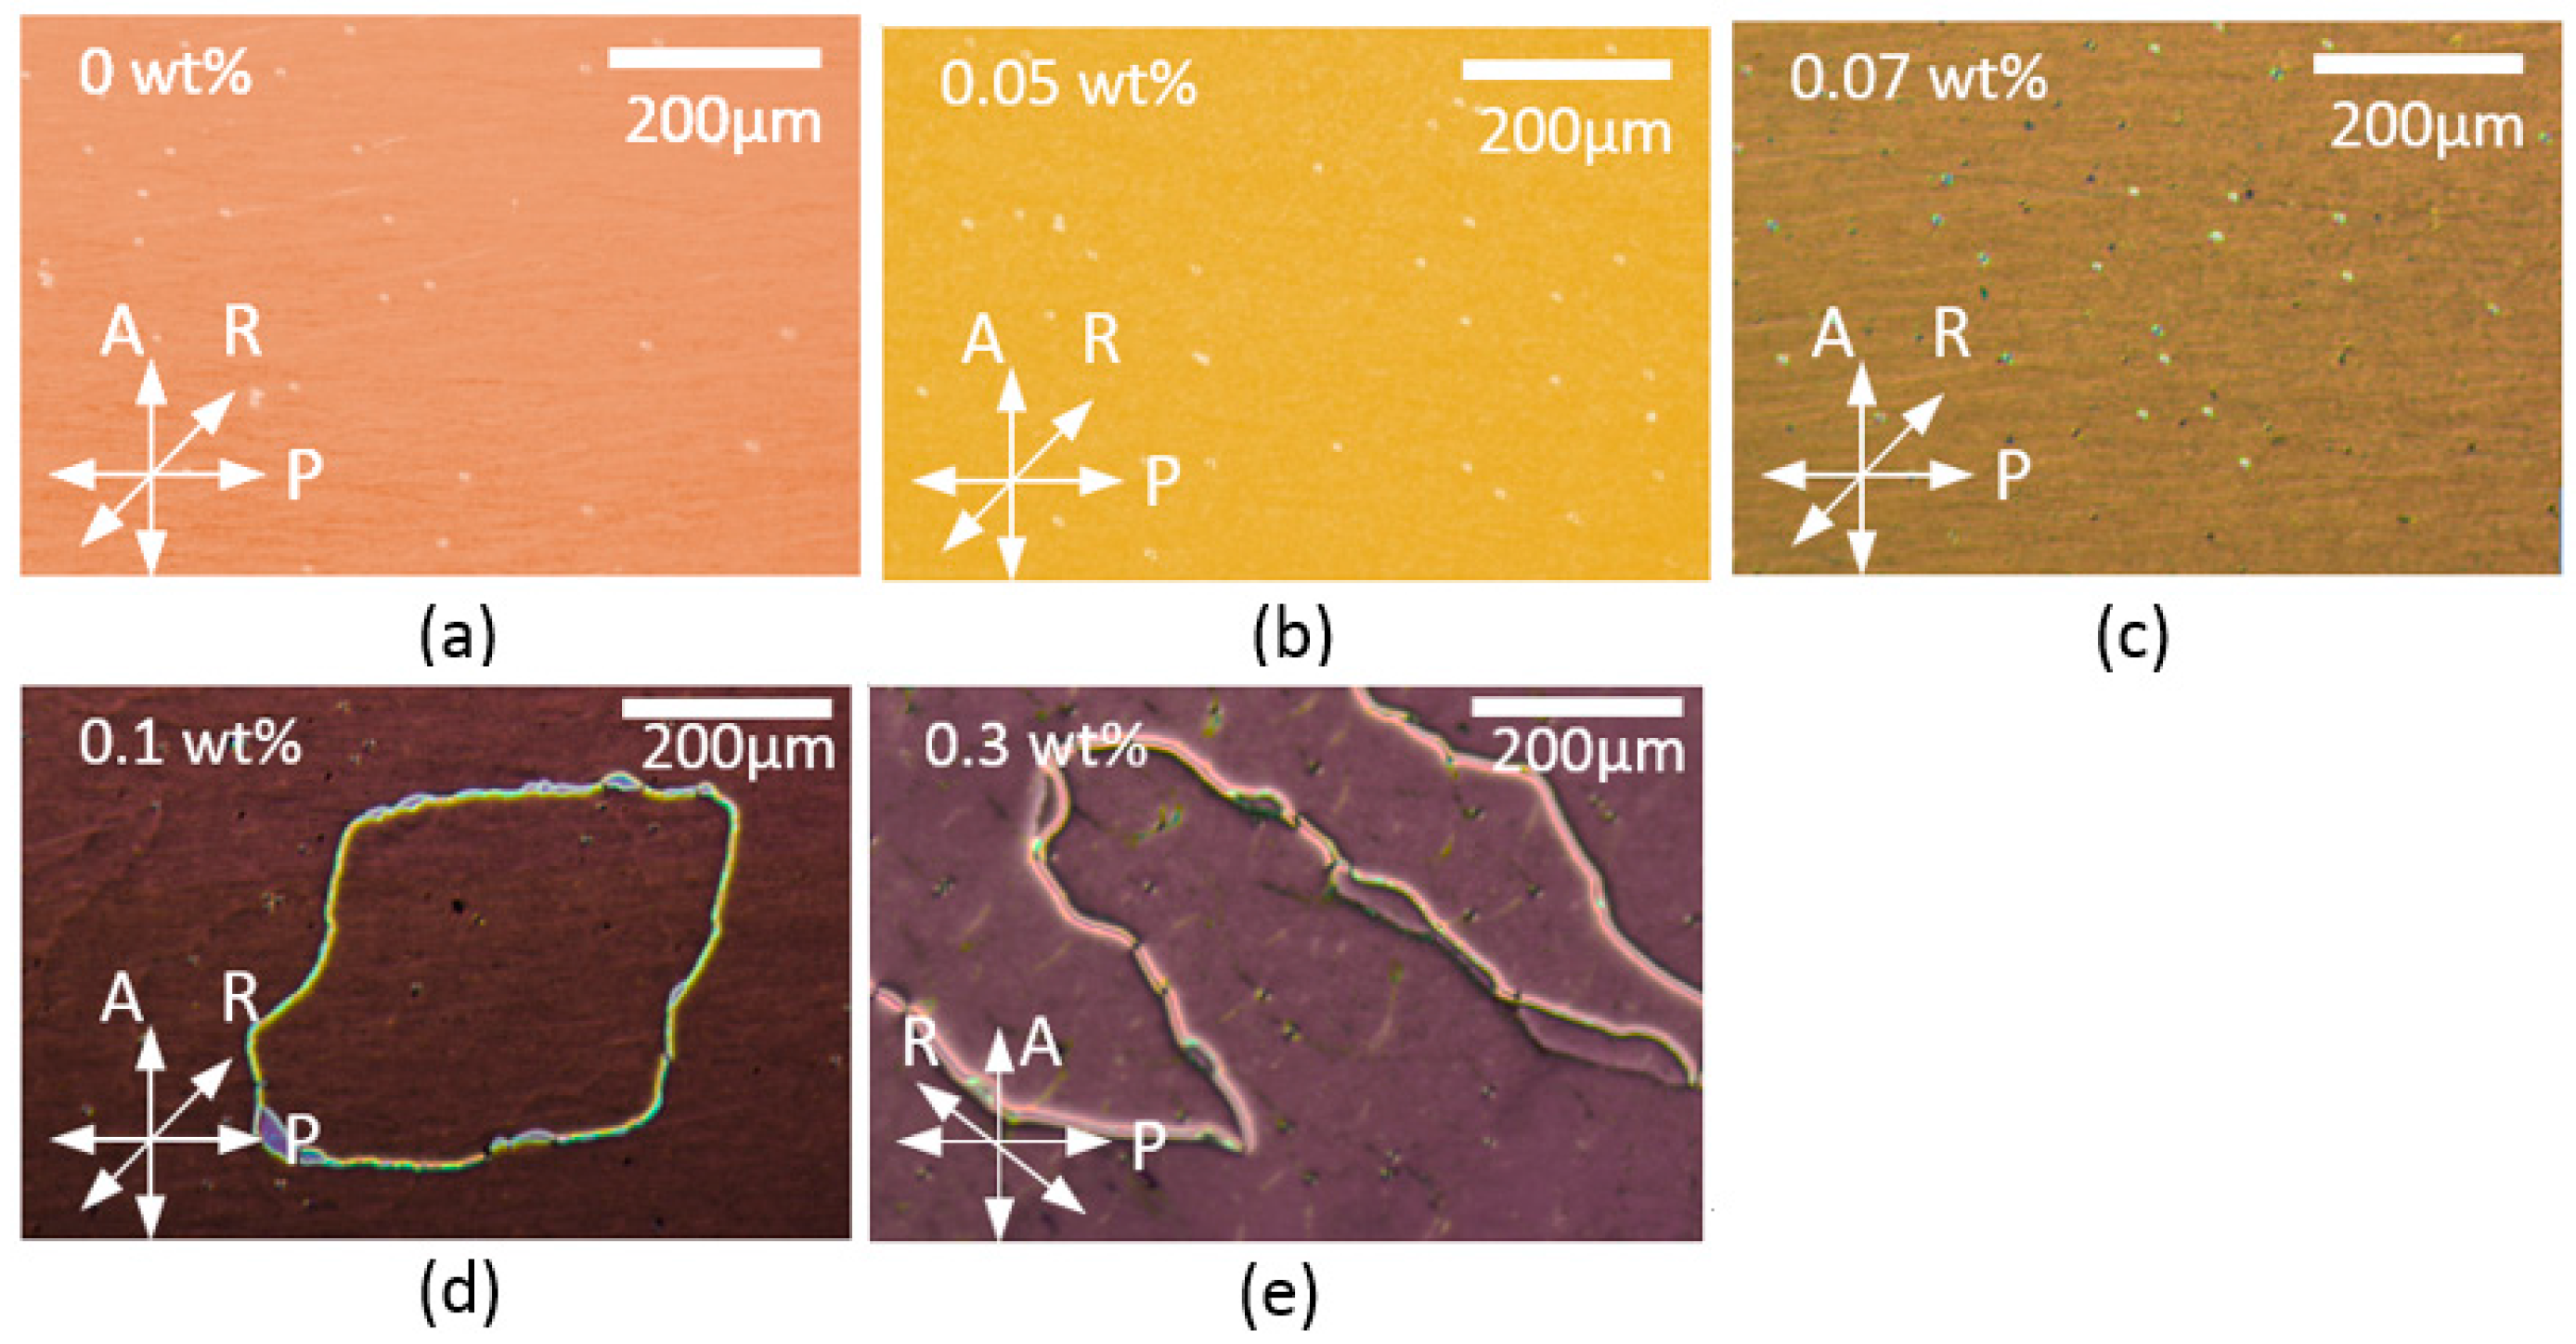
Figure 2.
T–V curves for the pristine E7 and GNP-doped LC cells. The inset shows the threshold voltages of the pristine E7 and GNP-doped LC cells.
Figure 2.
T–V curves for the pristine E7 and GNP-doped LC cells. The inset shows the threshold voltages of the pristine E7 and GNP-doped LC cells.
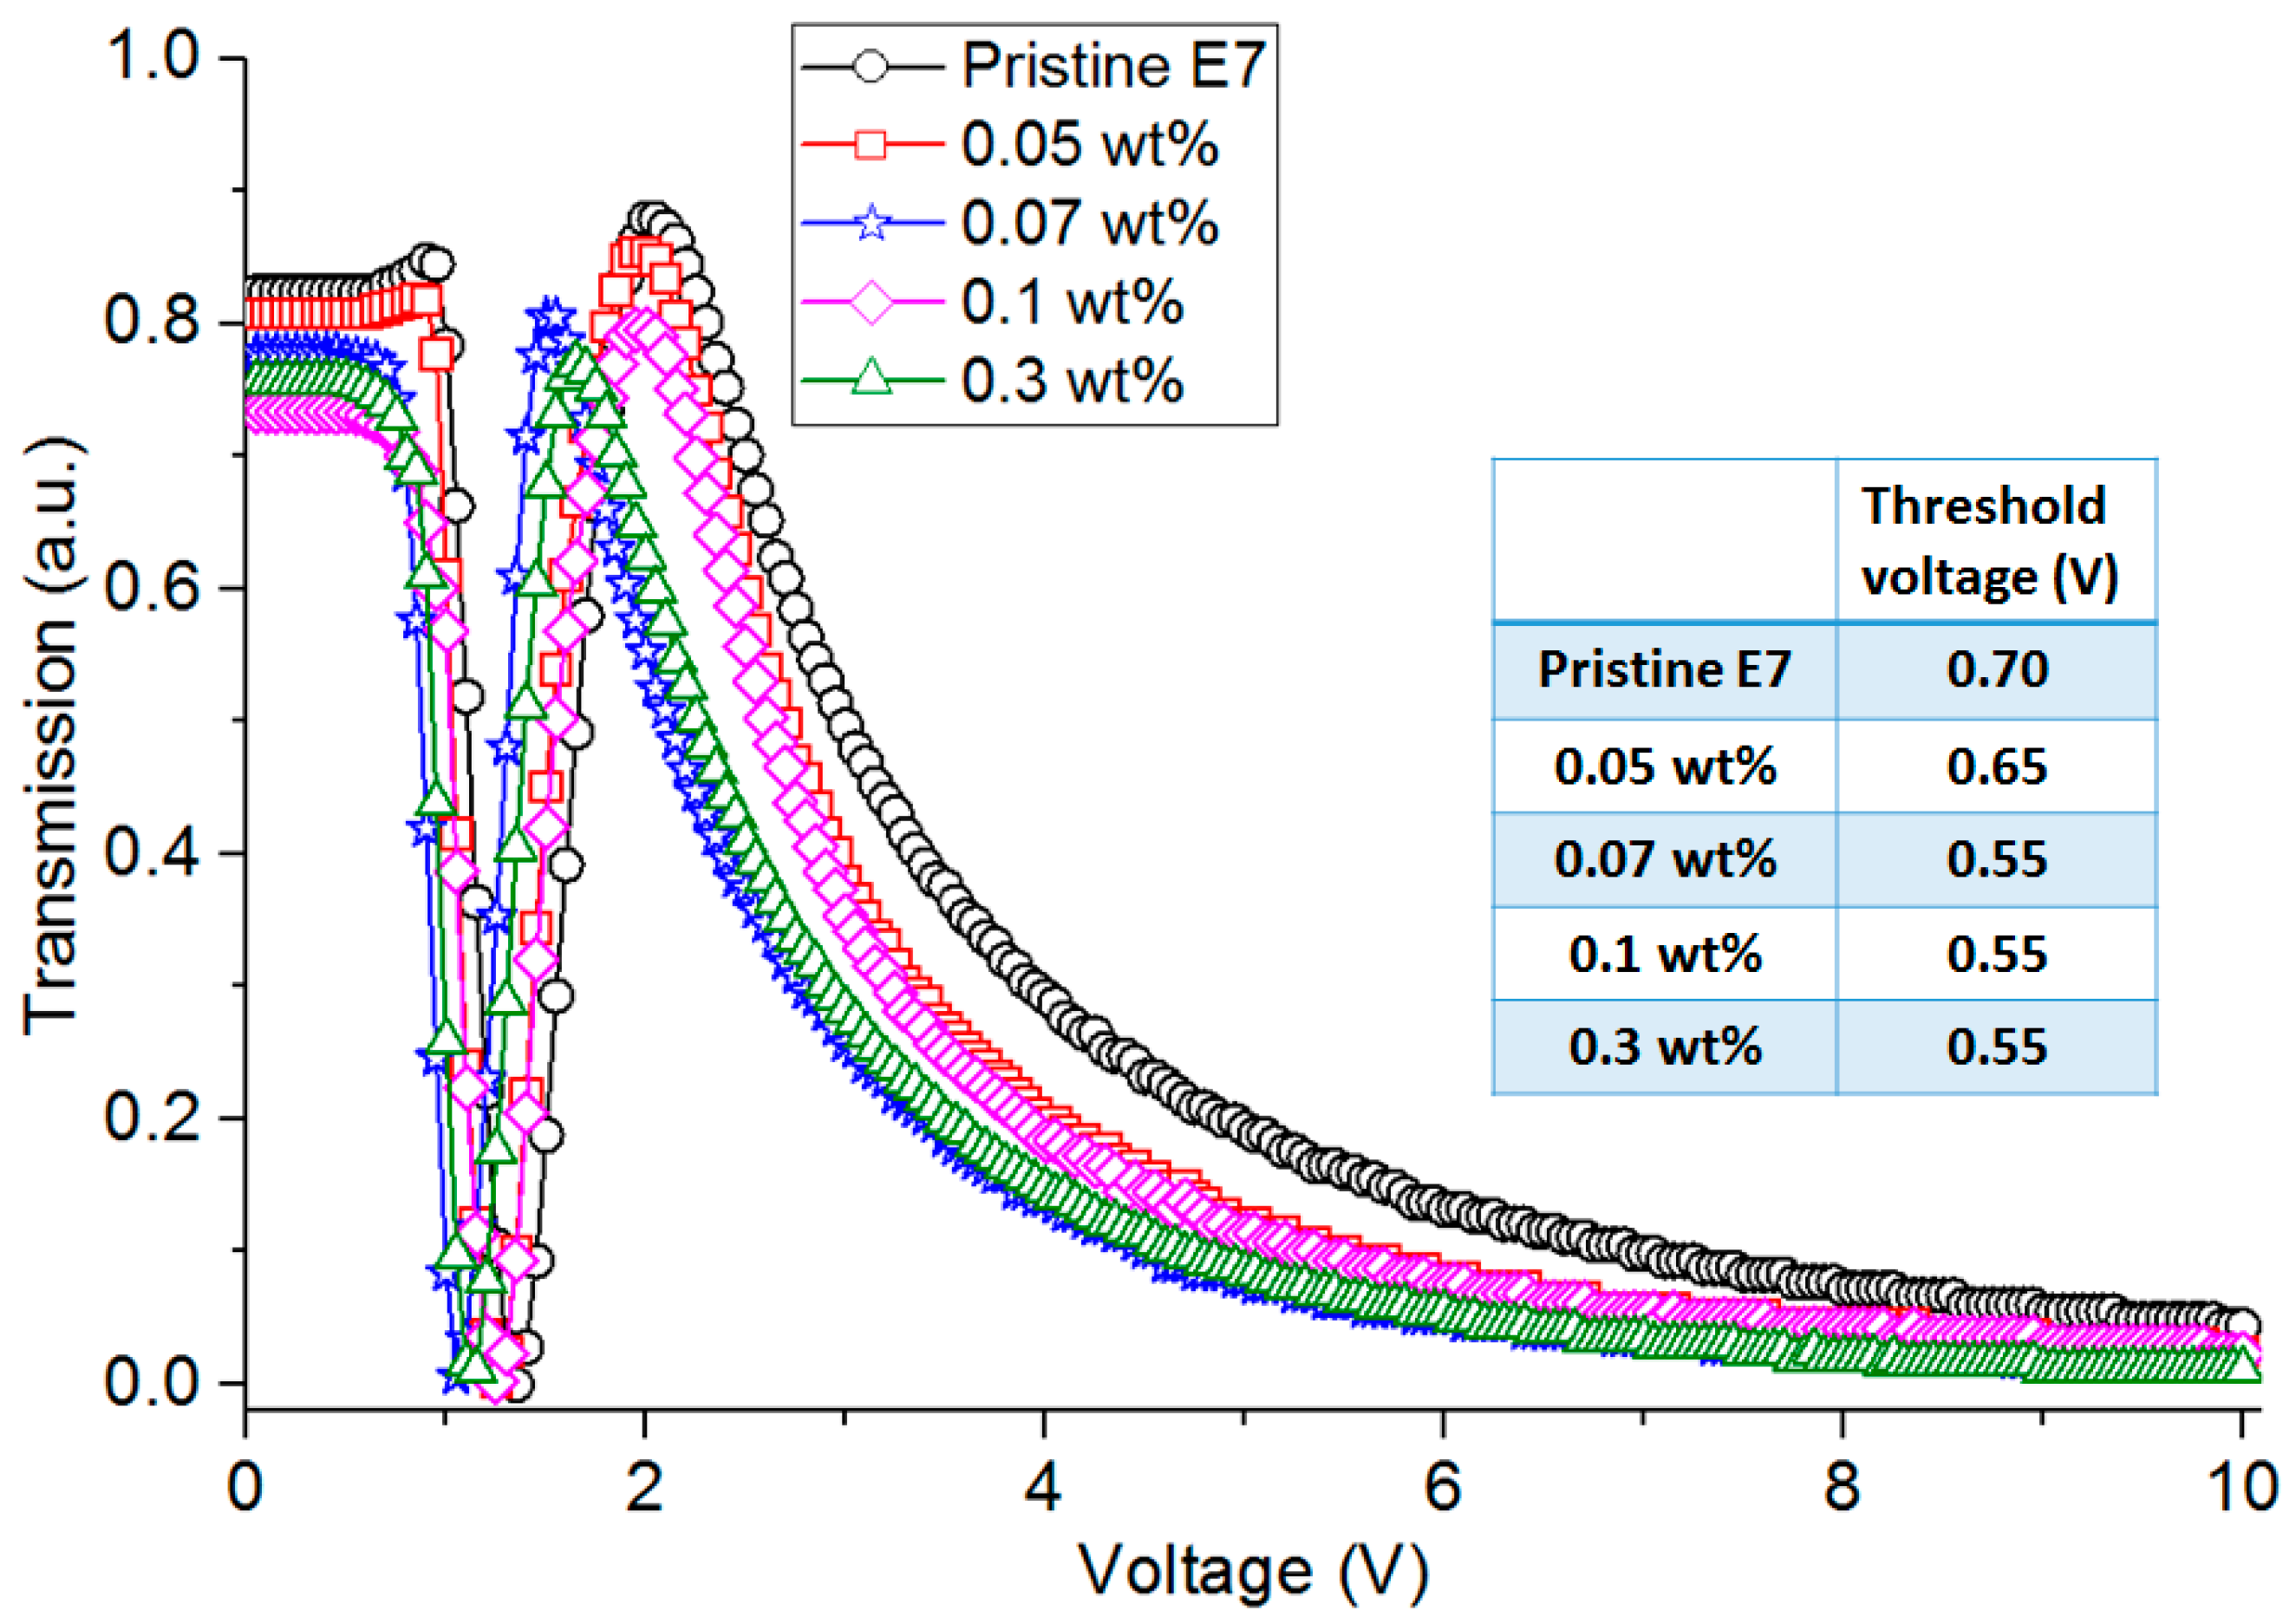
Figure 3.
(a) Transmission spectra of the pristine E7 and GNP-doped LC cells. (b) Transmission spectra of the 0.3 wt % GNP-doped LC cell with incident light at the polarization directions of 0° (rubbing direction), 45°, 90° and 135°, respectively.
Figure 3.
(a) Transmission spectra of the pristine E7 and GNP-doped LC cells. (b) Transmission spectra of the 0.3 wt % GNP-doped LC cell with incident light at the polarization directions of 0° (rubbing direction), 45°, 90° and 135°, respectively.

Figure 4.
Rise and fall times of LC cells doped with various GNP concentrations.
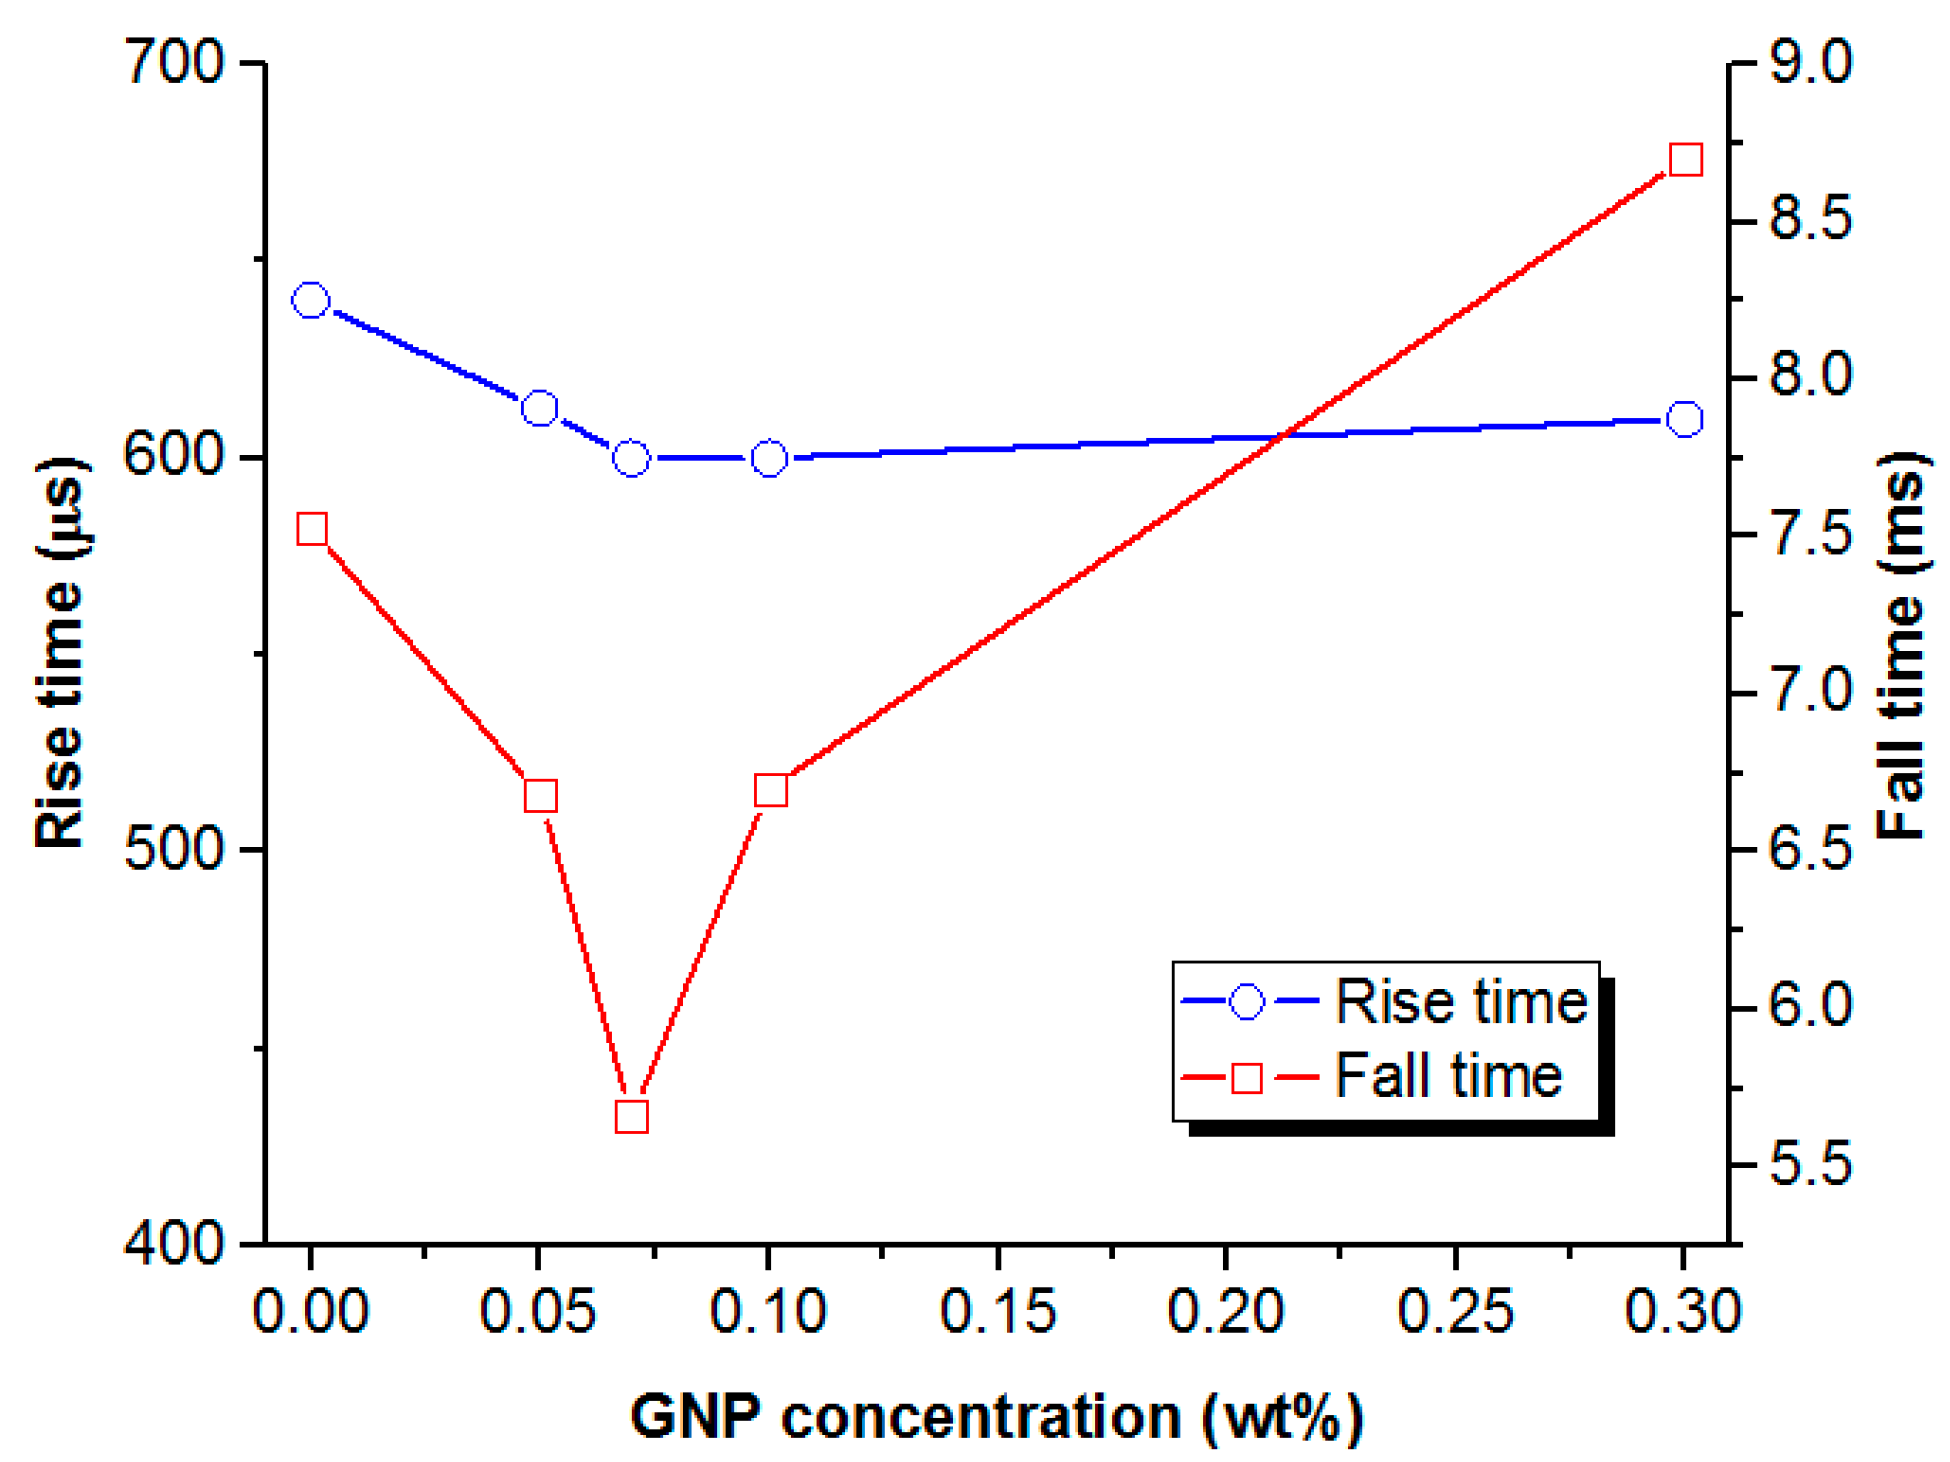
Figure 5.
Dielectric spectra of (a) homogeneously aligned and (b) vertically aligned LC cells doped with various GNP concentrations. The solid and hollow symbols indicate the real part and imaginary part of permittivity, respectively.
Figure 5.
Dielectric spectra of (a) homogeneously aligned and (b) vertically aligned LC cells doped with various GNP concentrations. The solid and hollow symbols indicate the real part and imaginary part of permittivity, respectively.

© 2017 by the authors. Licensee MDPI, Basel, Switzerland. This article is an open access article distributed under the terms and conditions of the Creative Commons Attribution (CC BY) license (http://creativecommons.org/licenses/by/4.0/).
Share and Cite
MDPI and ACS Style
Hsu, C.-J.; Lin, L.-J.; Huang, M.-K.; Huang, C.-Y. Electro-optical Effect of Gold Nanoparticle Dispersed in Nematic Liquid Crystals. Crystals 2017, 7, 287. https://doi.org/10.3390/cryst7100287
AMA Style
Hsu C-J, Lin L-J, Huang M-K, Huang C-Y. Electro-optical Effect of Gold Nanoparticle Dispersed in Nematic Liquid Crystals. Crystals. 2017; 7(10):287. https://doi.org/10.3390/cryst7100287
Chicago/Turabian StyleHsu, Che-Ju, Li-Jyuan Lin, Mao-Kun Huang, and Chi-Yen Huang. 2017. "Electro-optical Effect of Gold Nanoparticle Dispersed in Nematic Liquid Crystals" Crystals 7, no. 10: 287. https://doi.org/10.3390/cryst7100287
Note that from the first issue of 2016, this journal uses article numbers instead of page numbers. See further details here.