Communication

Electrohydrodynamics-Induced Abnormal Electro-Optic Characteristics in a Polymer-Dispersed Liquid Crystal Film

1
Department of Photonics and Advanced Optoelectronics Technology Center, National Cheng Kung University, Tainan 701, Taiwan
2
Department of Electro-Optical Engineering, Kun Shan University of Technology, Tainan 710, Taiwan
3
Department of Optometry, Chung Shan Medical University, Taichung 402, Taiwan
4
Department of Ophthalmology, Chung Shan Medical University Hospital, Taichung 402, Taiwan
5
Department of Physics, Tunghai University, Taichung 407, Taiwan
6
Graduate Institute of Electrical Engineering, National Kaohsiung First University of Science and Technology, Kaohsiung 824, Taiwan
*
Authors to whom correspondence should be addressed.
Crystals 2017, 7(7), 227; https://doi.org/10.3390/cryst7070227
Submission received: 14 June 2017 / Revised: 17 July 2017 / Accepted: 18 July 2017 / Published: 21 July 2017

Abstract

:
This study demonstrates for the first time abnormal electro-optic (EO) characteristics induced by electrohydrodynamics (EHD) in a polymer-dispersed liquid crystal (PDLC) film in the presence of a low-frequency (1 kHz) AC voltage. Large LC droplets (20−40 µm) buried in the film can be obtained after the illumination of one UV light with a weak intensity (~0.96 mW/cm2) for 12 h. This film exhibits abnormal EO features, including the transmittance’s decay at a high voltage regime at normal incidence and the conversion between polarization independence and polarization dependence for the transmittance-voltage curve at normal and oblique incidences, respectively, of which properties are different from those shown in traditional PDLC films with small droplets. The abnormal EO characteristics of the large-droplet PDLC at the high voltage regime are attributed to a strong scattering effect associated with the formation of the foggy LC droplets in the cell. This effect is induced by a vortex-like LC director field with a rotational axis normal to the cell substrates in each dome-like droplet of the cell at the high voltage regime. The vortex-like director field is induced by a vortex-like turbulence of charged impurity generated by the EHD effect under the action of the AC electric field along the cell normal and the confinement of the dome-like boundary of the droplet on the charged impurities in each droplet. The scattering is decided by the degrees of mismatch between the refractive indices of the LC droplet and polymer, and the local fluctuation of the vortex-like director field in the droplet, resulting in the abnormal EO behaviors of the large-droplet PDLC. This investigation provides novel insight into the EHD effect in three dimensional (3D) microdroplets with anisotropic fluid. Such a large-droplet PDLC has potential in photonic applications, such as electrically controlled polarization-based optical components or optical converters between polarization independence and polarization dependence.

1. Introduction

Polymer-dispersed liquid crystals (PDLCs) are an interesting and attractive system comprising homogeneous, randomly oriented LC droplets distributed in a polymer thin film. PDLC has attracted wide attention and led to studies on its fundamental characteristics and applications due to the presence of isotropic polymer and anisotropic LCs and electrically controlled electro-optic (EO) ability. In 1969, Meyer et al. first proposed a bipolar structure in LC orientation [1]. After several years, Taylor patented a fabrication method for PDLC thin film using phase separation, which significantly facilitates fabrication [2]. A method for controlling the LC molecular orientation using an external electric field was individually proposed by Craighead et al. in 1982 [3] and Doane in 1986 [4]. This method uses an electric field to drive the LC director of the droplets in PDLC films, by which the refractive index matching between LC droplets and polymer can be adjusted to result in scattering (opaque) to transmission states. The typical EO feature for a traditional PDLC is the increase in transmittance with increasing applied voltage. This property can be applied in several applications, such as display, optical switch, and smart window. In contrast to abundant research in traditional small-droplet PDLC systems, only a few studies have contributed to the investigation of large-droplet PDLC systems. Amundson et al. fabricated large-droplet PDLC films based on LC-monomer mixtures with high concentrations of LCs [5]. They explored relationships between conditions of phase separation, morphology, and EO properties of PDLCs and demonstrated strong dependence of EO properties on LC fraction in films, as explained by consideration of phase separation. Marinov et al. focused on surface-orienting effect of rubbed Teflon nanolayers on morphology and EO response of PDLC of large nematic droplets [6]. Experimental results showed that modulated EO responses by dielectric oscillations of the nematic director displays a temperature- or voltage-controllable amplitude-frequency modulation, which is related to LC droplet size.
A well-known effect, electrohydrodynamics (EHD), generally occurs both in isotropic and anisotropic fluids [7]. EHD can result in certain kinds of steady or unsteady flowing fluids that are either electrically charged or contain charged droplets when an appropriate electric field is applied to the fluid. Many studies have focused on EHD because it plays a crucial role in multiple engineering technologies, such as electrokinetic assays [8], electrospray [9], electrostatic printing, and electro-coalescence [10]. In particular, EHD can induce unique optical phenomena in anisotropic fluid, such as the well-known Kapustin–Williams domains generated in the presence of a low-frequency AC electric field [11] and other patterns [12].
In the abovementioned studies on PDLCs, the dynamic EHD phenomenon in PDLC systems (that is, in the LC droplets of the PDLC systems) has not yet been discovered and investigated. This study is the first to discover and investigate the anomalous EO features of a PDLC with large LC droplets. Experimental results show that the transmission for the present PDLC significantly decays at a high voltage regime at normal incidence. Moreover, the T-V curve can change from polarization independence to polarization dependence from normal to oblique incidences. The proposed PDLC exhibits abnormal EO characteristics compared with the traditional PDLC with small droplets. Experimental results show that the abnormal EO characteristics of the present PDLC are attributed to the strong scattering related to the generation of foggy LC droplets in the cell at high voltage regimes. Each foggy droplet is induced by the vortex-like LC director field due to the driving of a vortex-like turbulence of charged impurity with an axis of rotation roughly along the cell normal. The vortex of charged impurity is formed by the EHD effect under the action of the electric field along the cell normal and the confinement of the dome-like boundary of the droplet. The scattering is decided by the degrees of mismatch of the refractive indices for LC droplet and polymer and the local fluctuation of the vortex-like director field in the droplet. This effect results in the abnormal EO characteristics of the large-droplet PDLC. Such a PDLC film with large LC droplets has a potential for use in photonic applications, such as electrically controllable polarization-associated optical component or optical converter between polarization independence and polarization dependence.

2. Sample Preparation and Experimental Setup

The materials used in this work to fabricate the PDLC contain the mixture of 60 wt% monomer, NOA65 (Norland Products, Cranbury, NJ, USA), and 40 wt% LC, E7 (Merck, Darmstadt, Germany). The mixture was oscillated using an ultrasonic oscillator for homogeneity and then filled into two identical empty cells. The cells were then exposed to non-polarized UV light for inducing phase separation between the polymer and LC via photopolymerization of monomer and the formation of LC droplets in the polymer matrix. Each empty cell was fabricated by merging two identical indium–tin–oxide (ITO) slides with no alignment treatment, with two spacer stripes that had identical 12-μm-thickness between them.
In this work, high and low intensities (12.3 and 0.96 mW/cm2, respectively) of UV sources (PHILIPS HPA 400 S: Philips, Turnhout, Belgium; FML-27Ex-N: Hitachi, Tokyo, Japan) were used to fabricate two types of PDLC film with small and large LC droplets, respectively. The temperature of each cell was maintained at room temperature (~25 °C) when cells were exposed to UV irradiation during cell fabrication. Thus, LC was in a nematic state during the formation of PDLC films. Transmittance-voltage (T-V) measurement using a He-Ne laser beam to probe was then conducted on the two samples in the presence of an external AC voltage with 1 kHz between the gap of the cell. Meanwhile, the images for the PDLC samples were also observed under a polarizing optical microscope (POM) (IX-71: Olympus, Taichung, Taiwan) with crossed polarizers or without analyzer for examining the LC structure of the droplets.

3. Results and Discussion

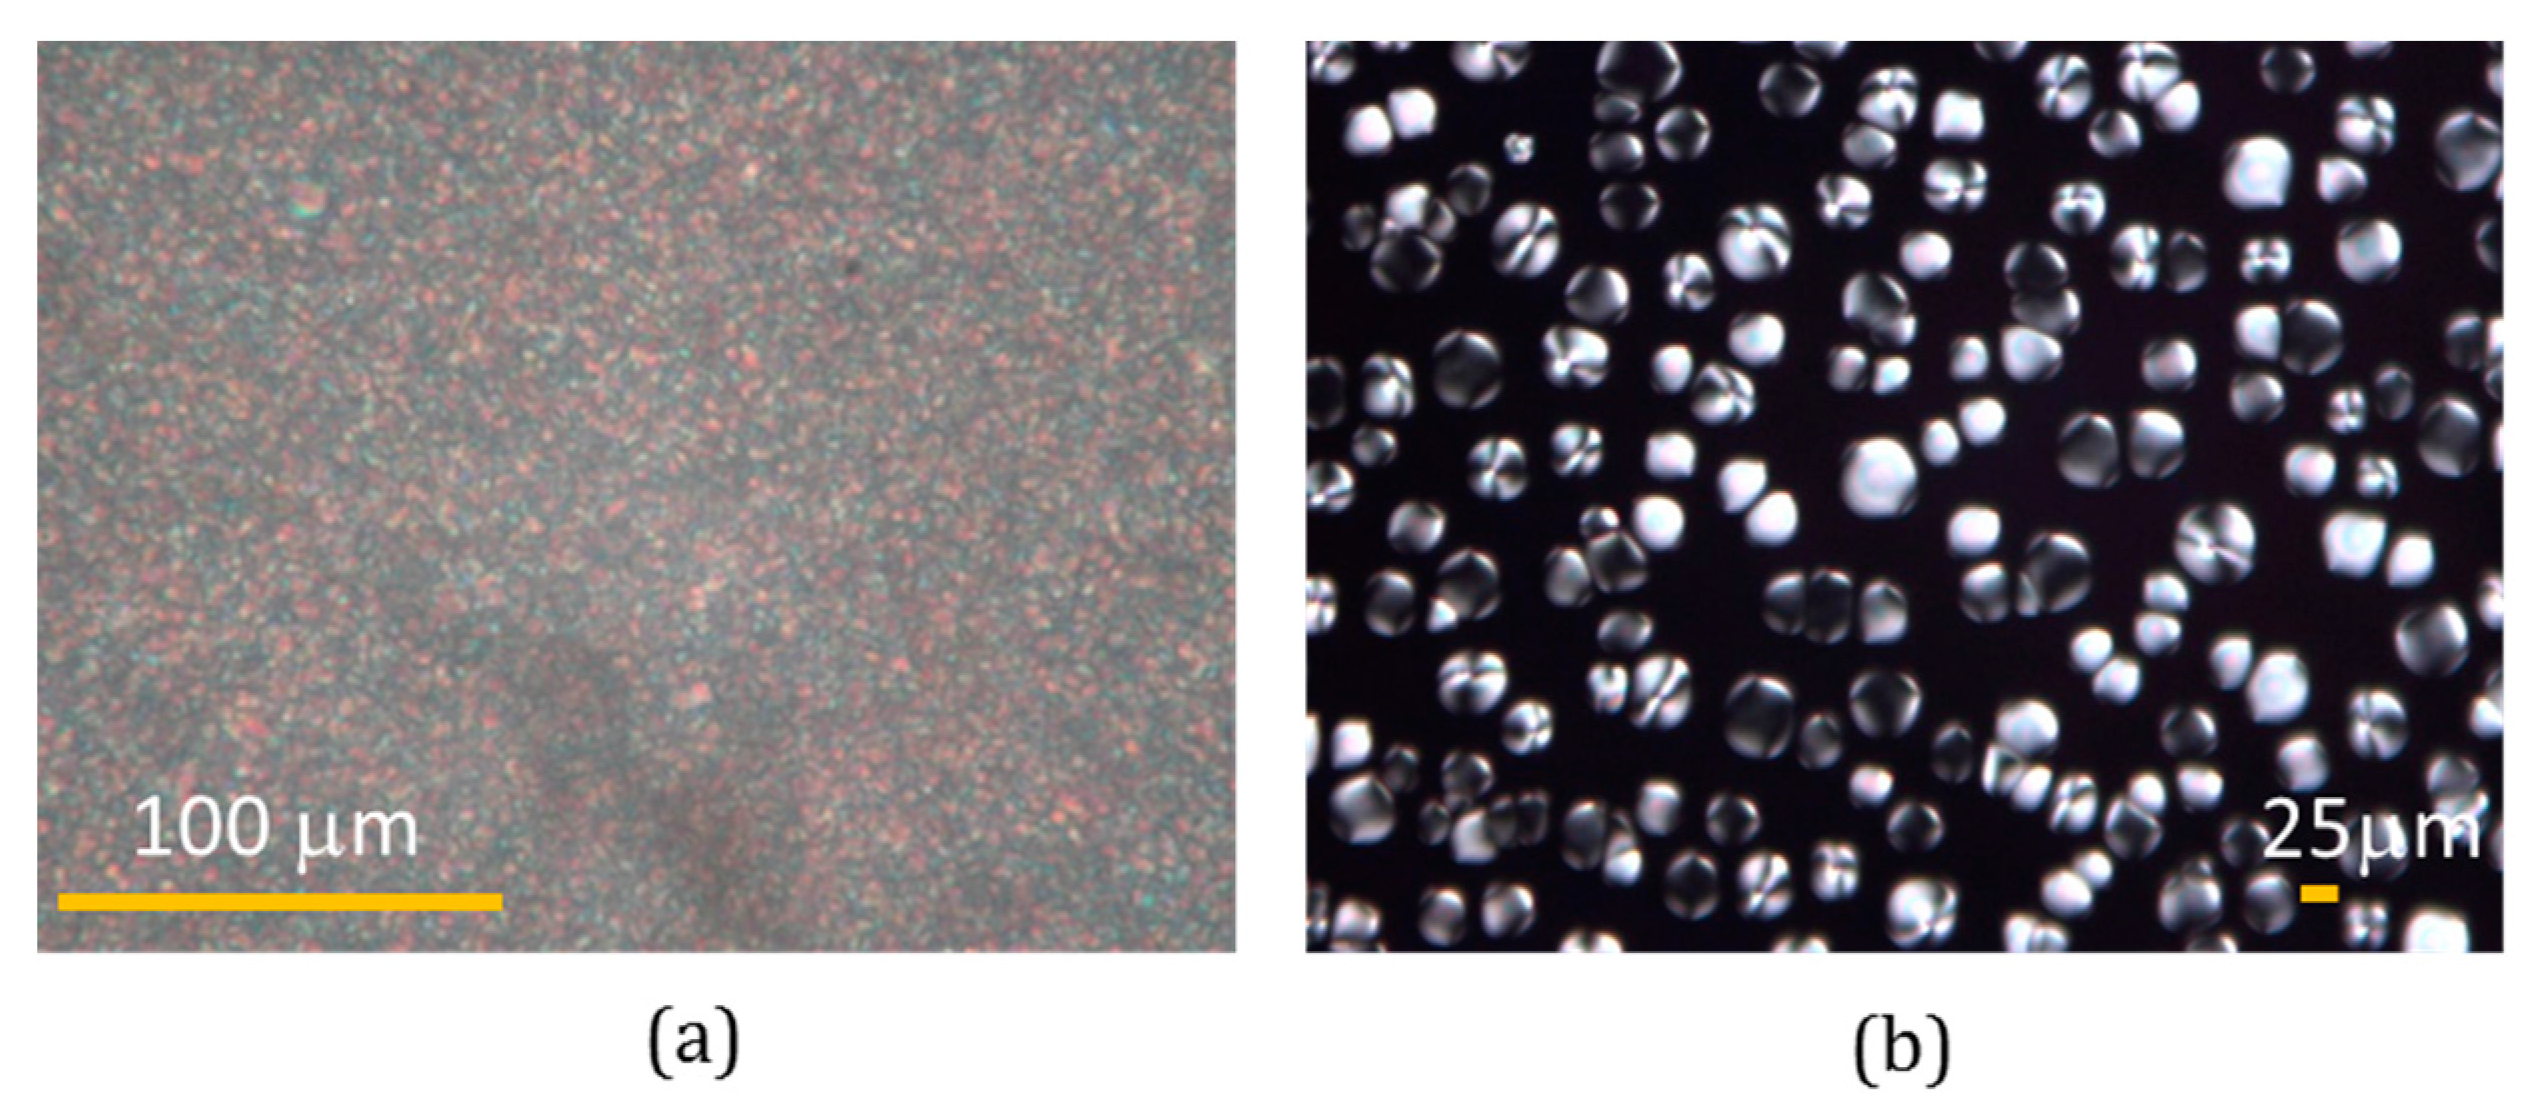
Figure 1a shows the image of the formed PDLC film observed under POM with crossed polarizers after high-intensity exposure of UV light for 10 min. The LC droplets obtained by high-intensity exposure show a droplet distribution of high density and small size (sub micrometers) in the polymer matrix. The corresponding 
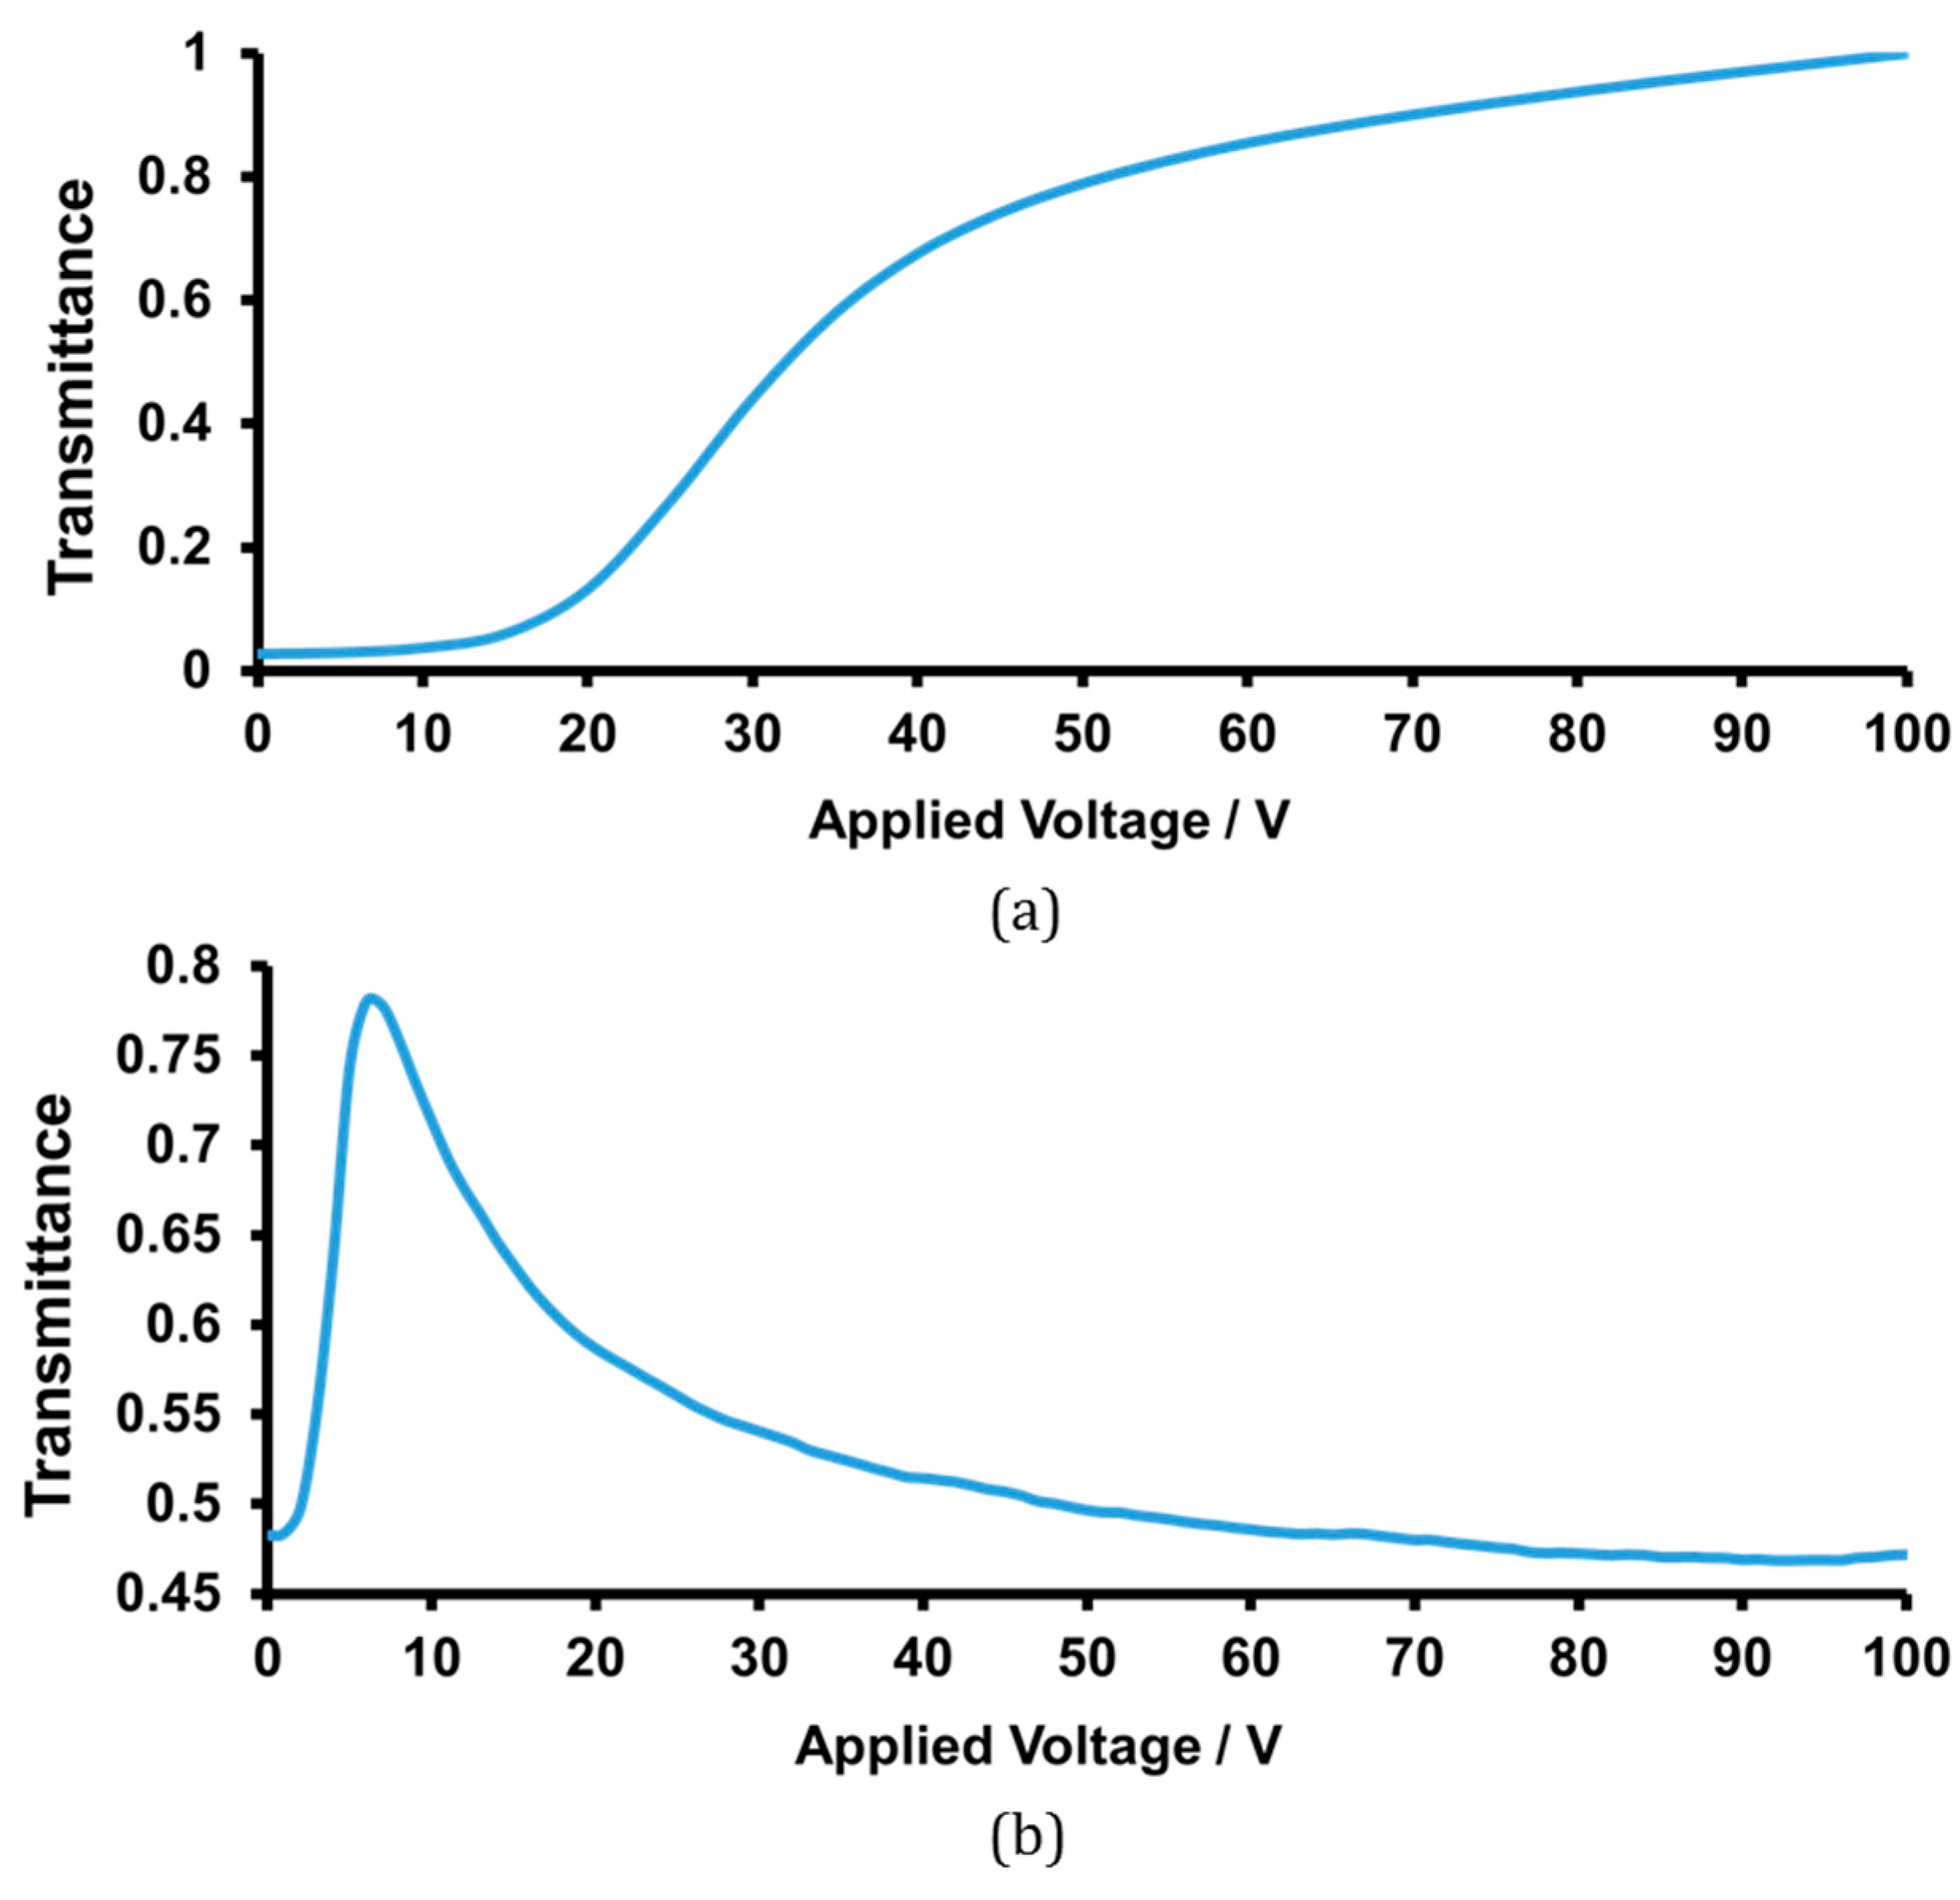
T-V curve of the small-droplet PDLC film measured at normal incidence of the non-polarized probe beam is displayed in Figure 2a. The transmittance of the sample increases from a very low value of off-state (~2%) to a very high value (~100%) of on-state with slowly increasing voltage to 100 V. A high contrast of transmission between on/off state can be achieved. The strong (less) scattering is induced from many interfaces between the LC droplets and the polymer matrix in which their refractive indices are strongly mismatched (matched) at 0 V (100 V) in an off- (on-) state. Such a typical EO feature in the traditional PDLC allows a wide range of applications, such as displays [4].
Large LC droplets with sizes of 20–40 μm in the PDLC film can be obtained by the low-intensity UV exposure for 12 h, as displayed in Figure 1b. The corresponding T-V curve of the large-droplet PDLC film measured at normal incidence of the probe beam is displayed in Figure 2b. The T-V curve exhibits a concave-downward variation in the transmittance with increasing voltage from 0 V to 100 V. The transmittance initially increases from 48% at V = 0 V to nearly a maxima of 78% at 7 V and then decreases slowly to 47% at V = 100 V. The trend of the EO feature at voltages ranging lower than 7 V is similar to that shown in traditional PDLC. The droplet image observed under POM with crossed polarizers, as shown in Figure 1b, shows bipolar LC configuration in droplets, thus reflecting homogeneous alignment of LCs by the polymer wall of droplets in the present PDLC. According to the information stated in Ref. [
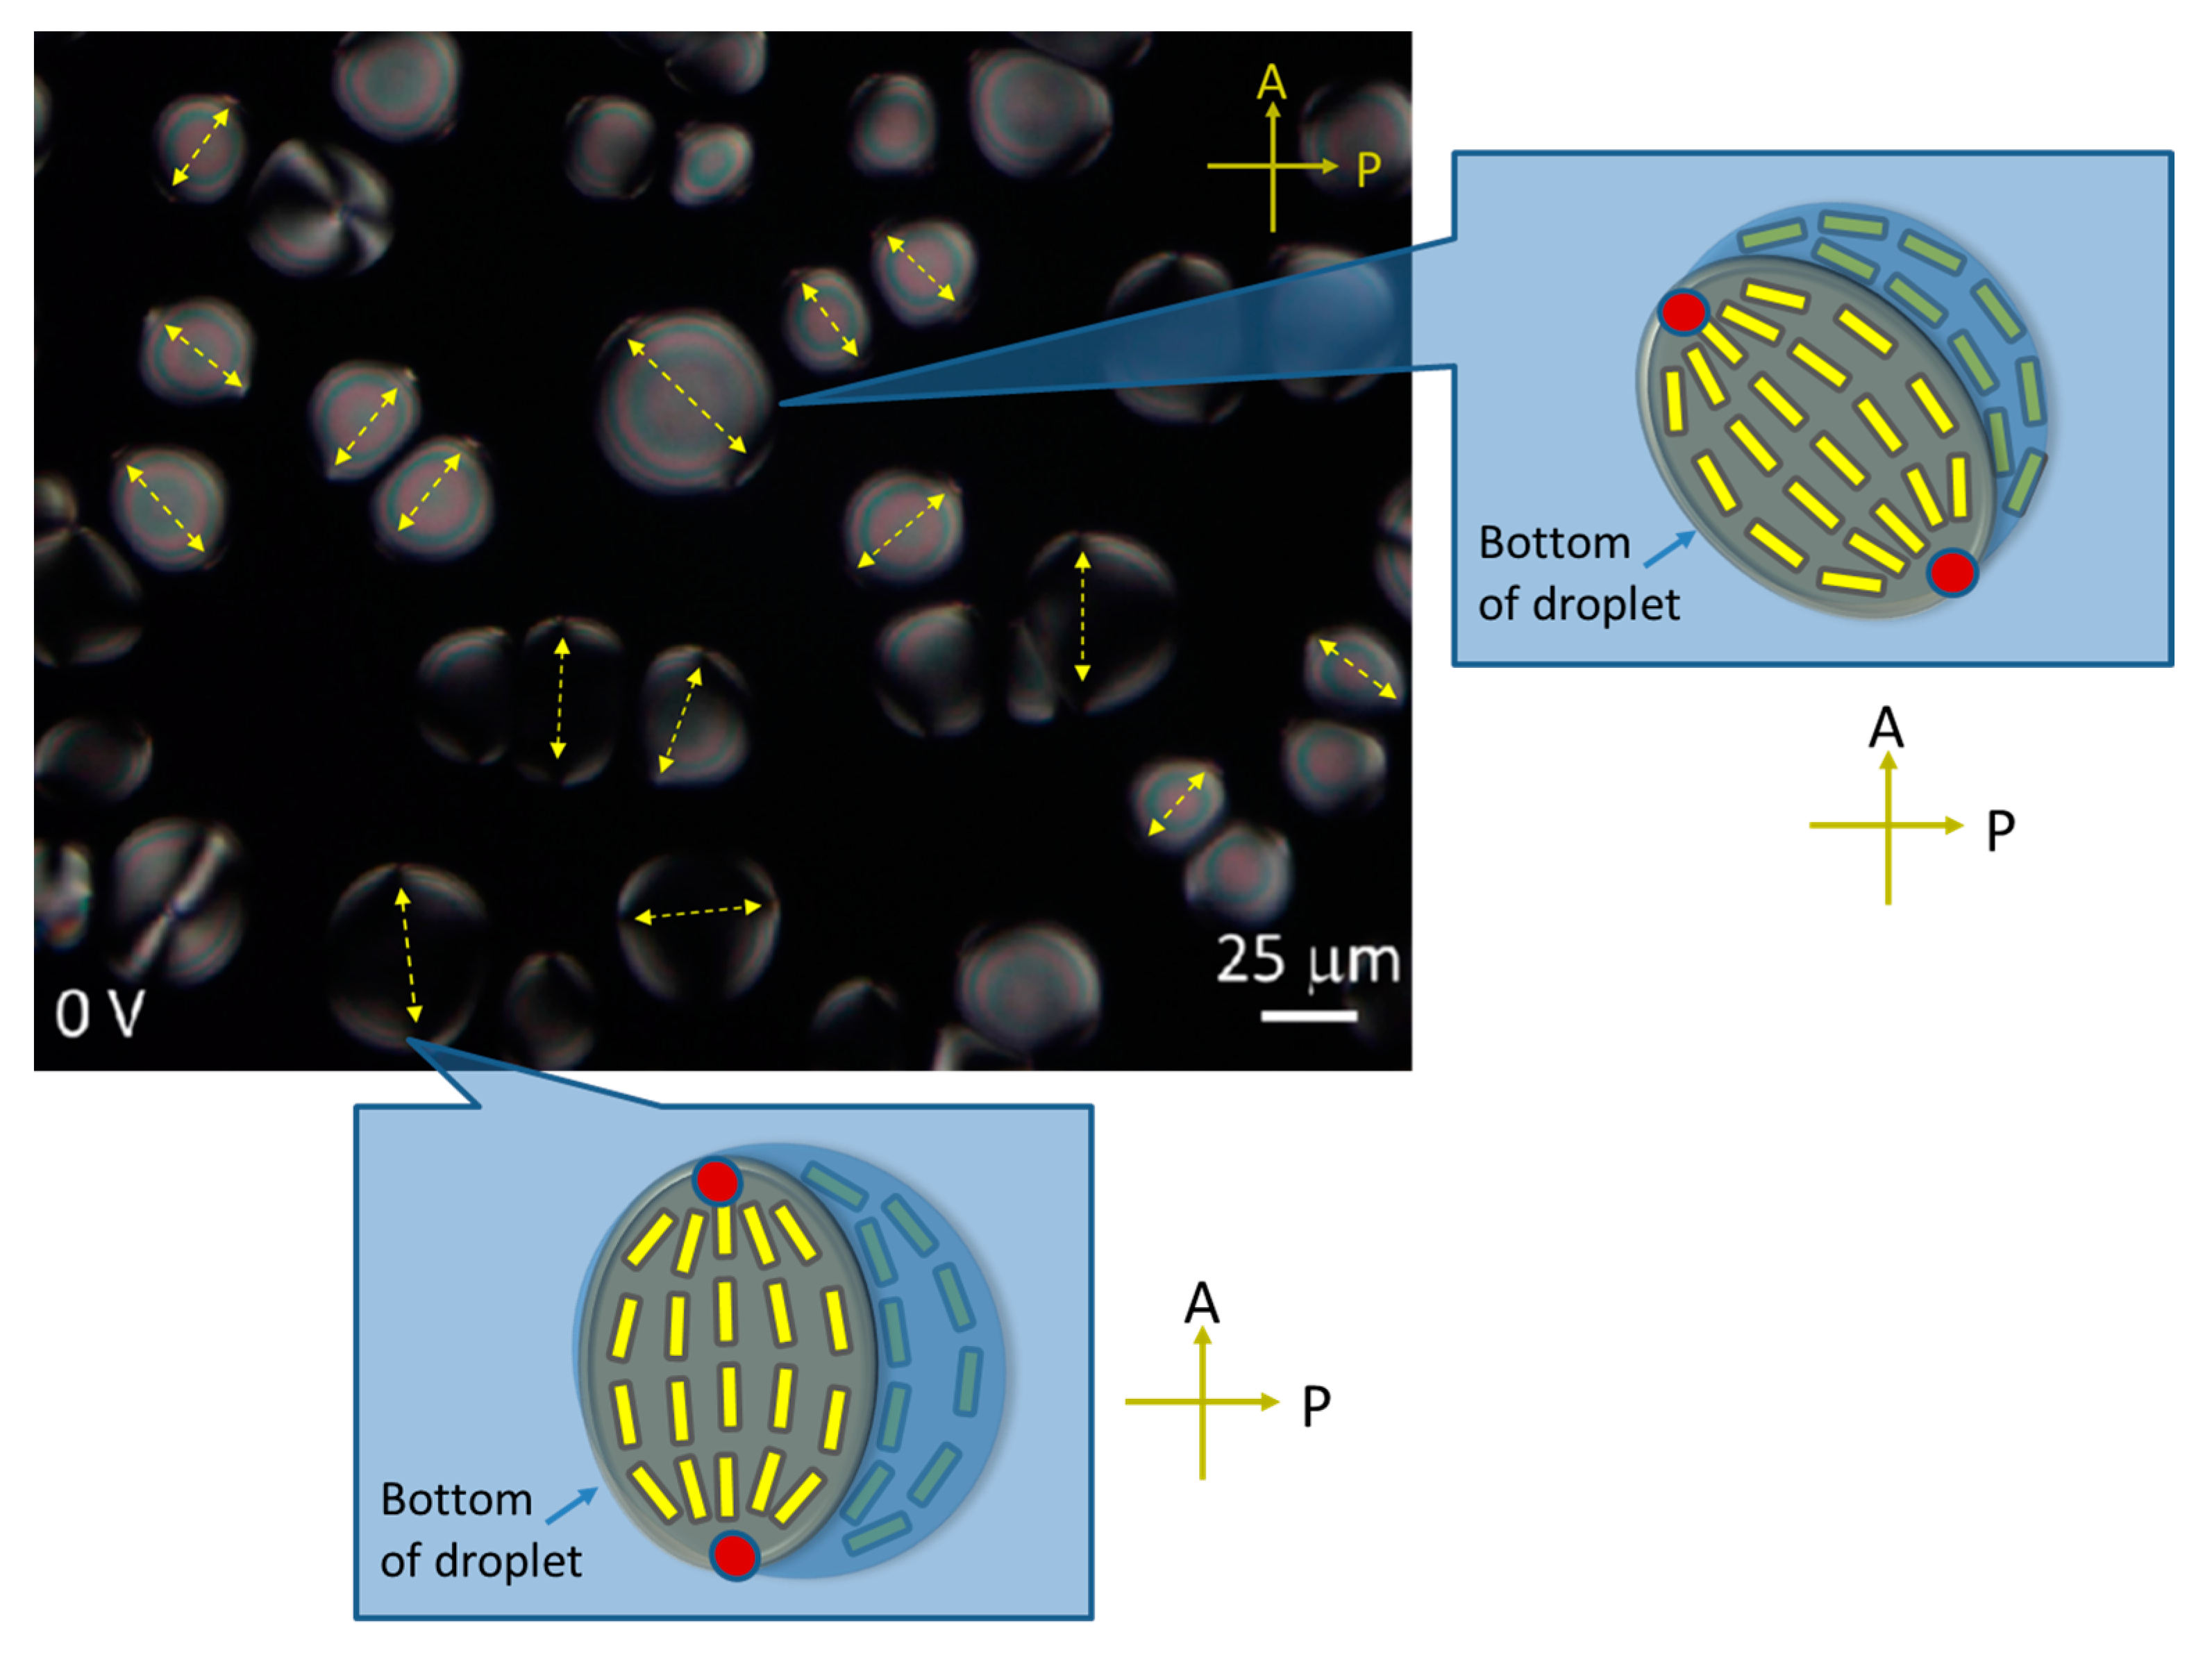
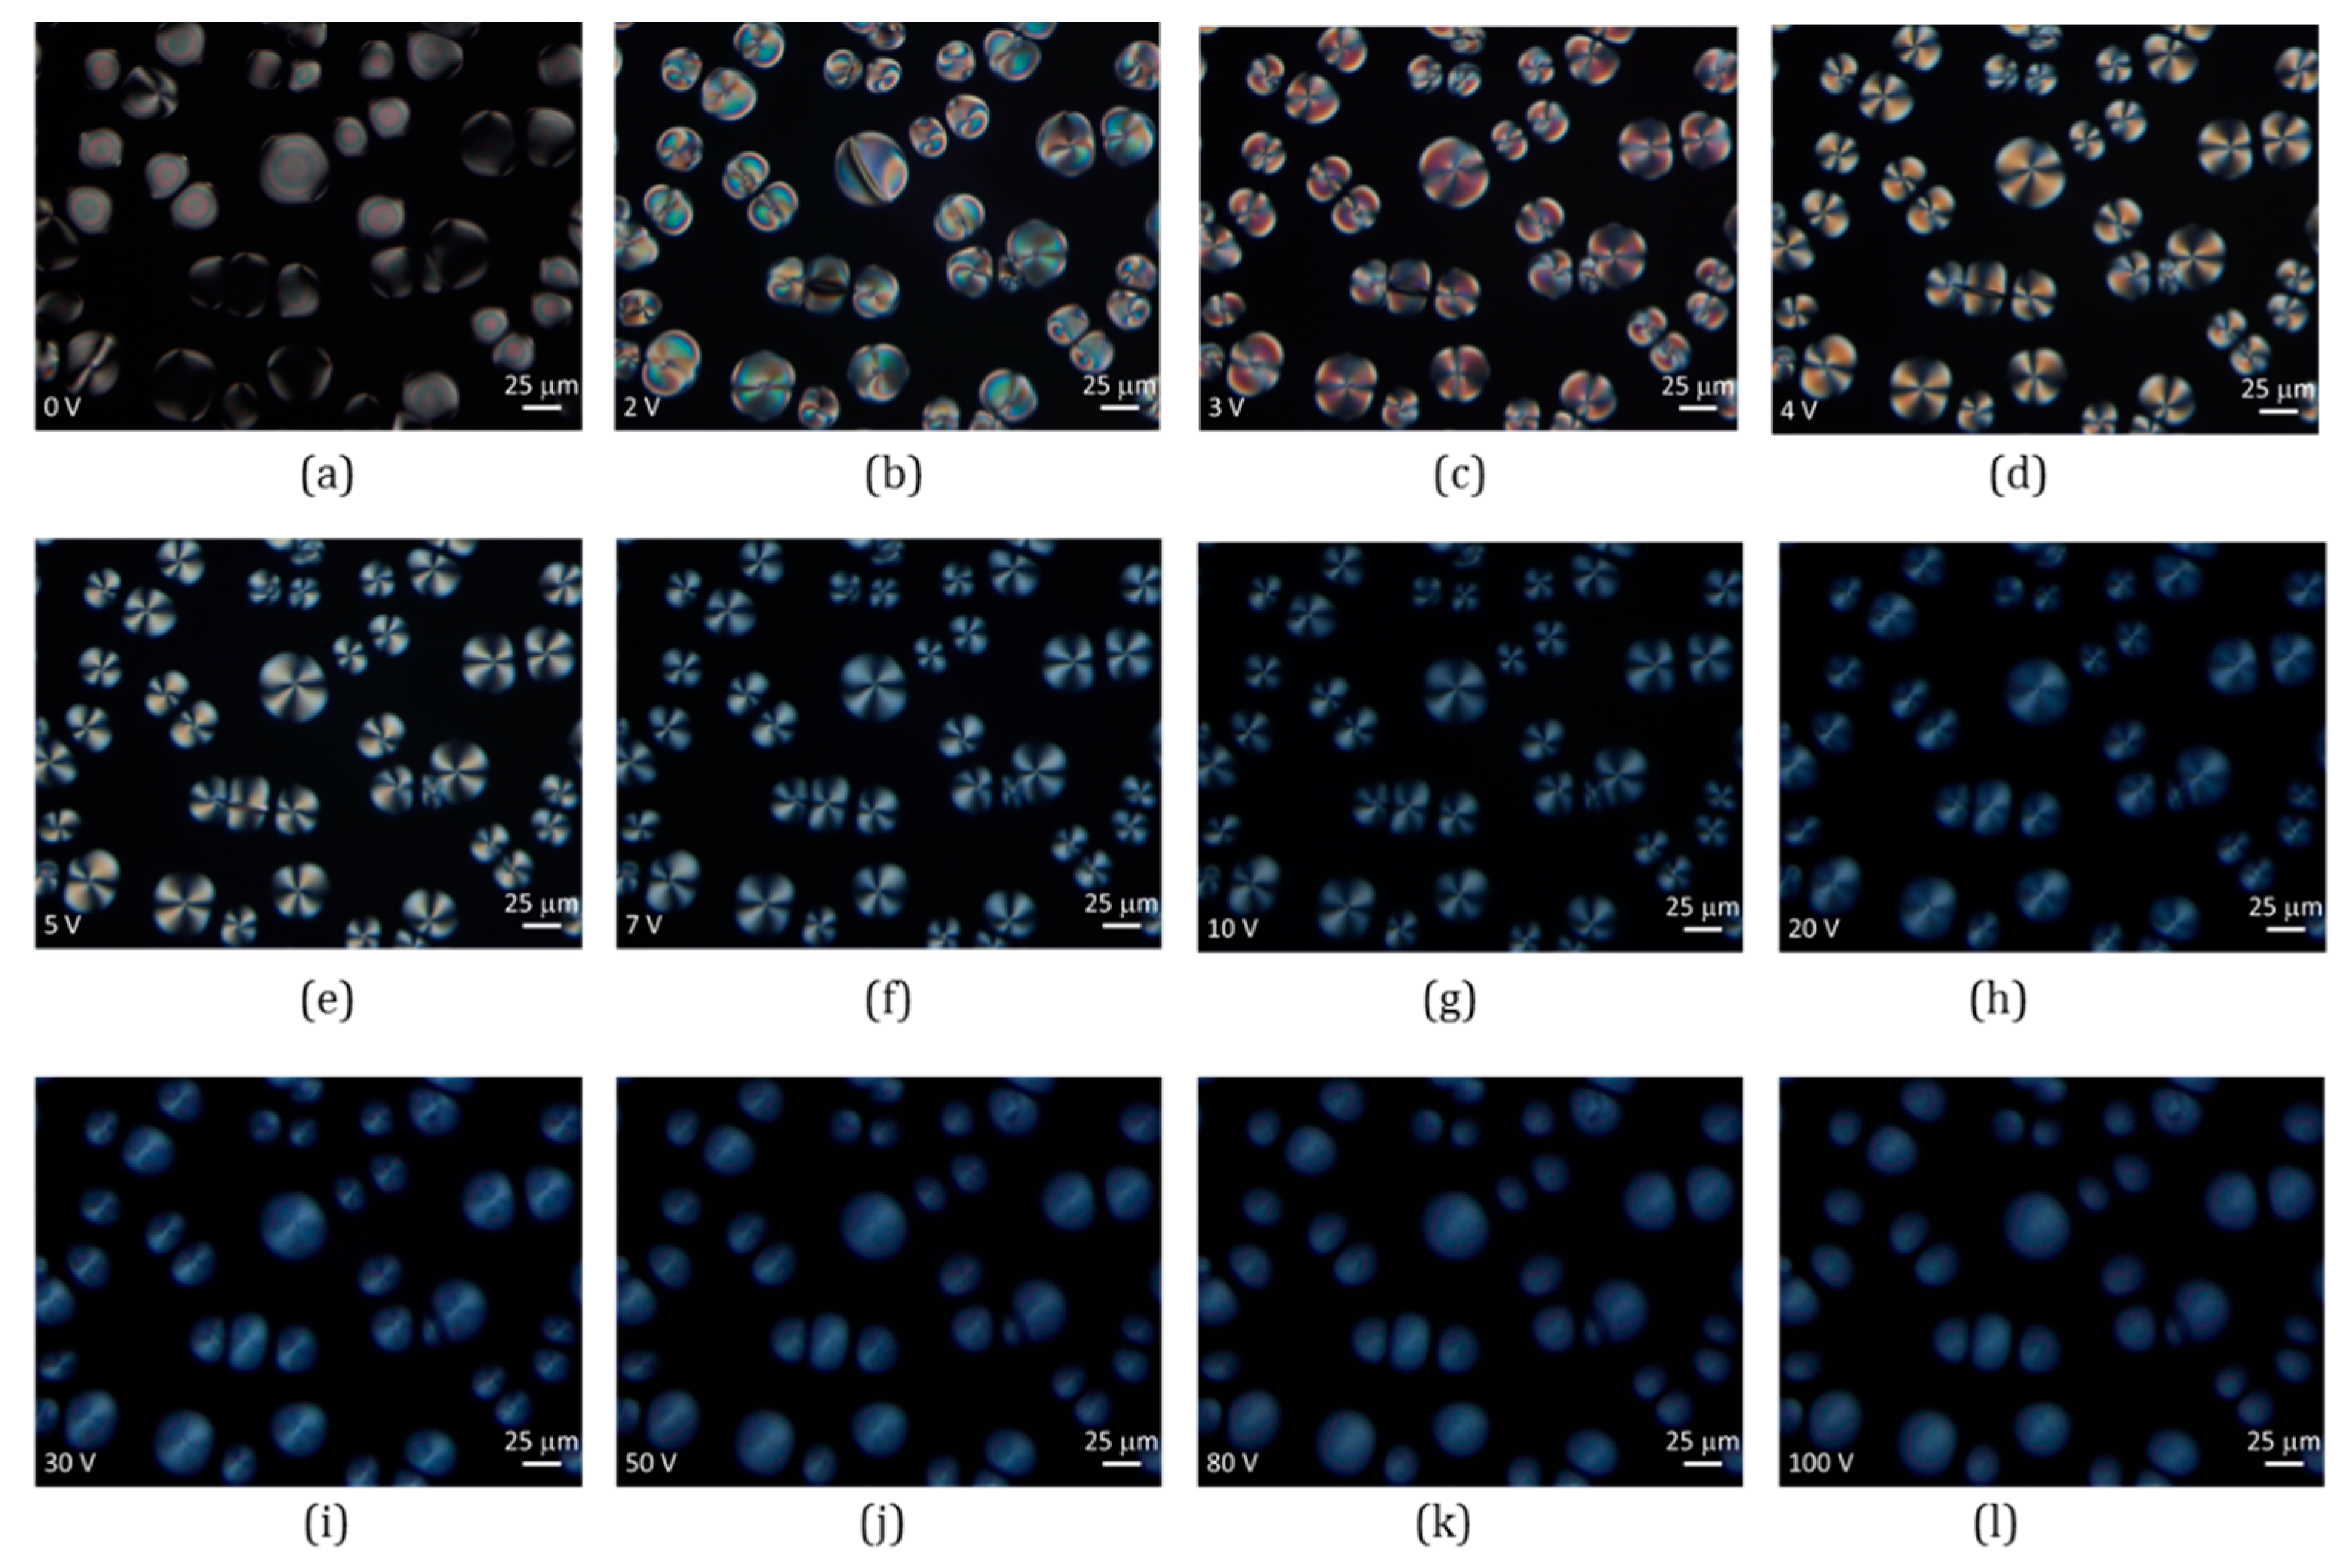
11], the polymer wall features weak anchoring on LCs in droplets. In comparison with small-droplet PDLC systems, larger size of LC droplets in large-droplet PDLC can lead to weaker anchoring of LCs by the polymer wall in the middle of droplets, such that low threshold voltage (~1 V) and a sharp slope at 1 V to 7 V can be obtained. The weak scattering due to there being relatively few scattered droplets present in the PDLC can lead to relatively high transmittance at 0 V. At voltages ranging from 7 V to 100 V, the present PDLC exhibits an abnormal EO feature. The transmittance decreases from its maxima at voltages from 7 V to 100 V, and this result is never observed in the traditional PDLC systems. To explain the unpredictable abnormality of the large-droplet PDLC, we further observe its images at 0, 2, 3, 4, 5, 7, 10, 20, 30, 50, 80, and 100 V under POM with crossed polarizers, as shown in Figure 3a−l, respectively. At V = 0 V, the droplet image shown in 
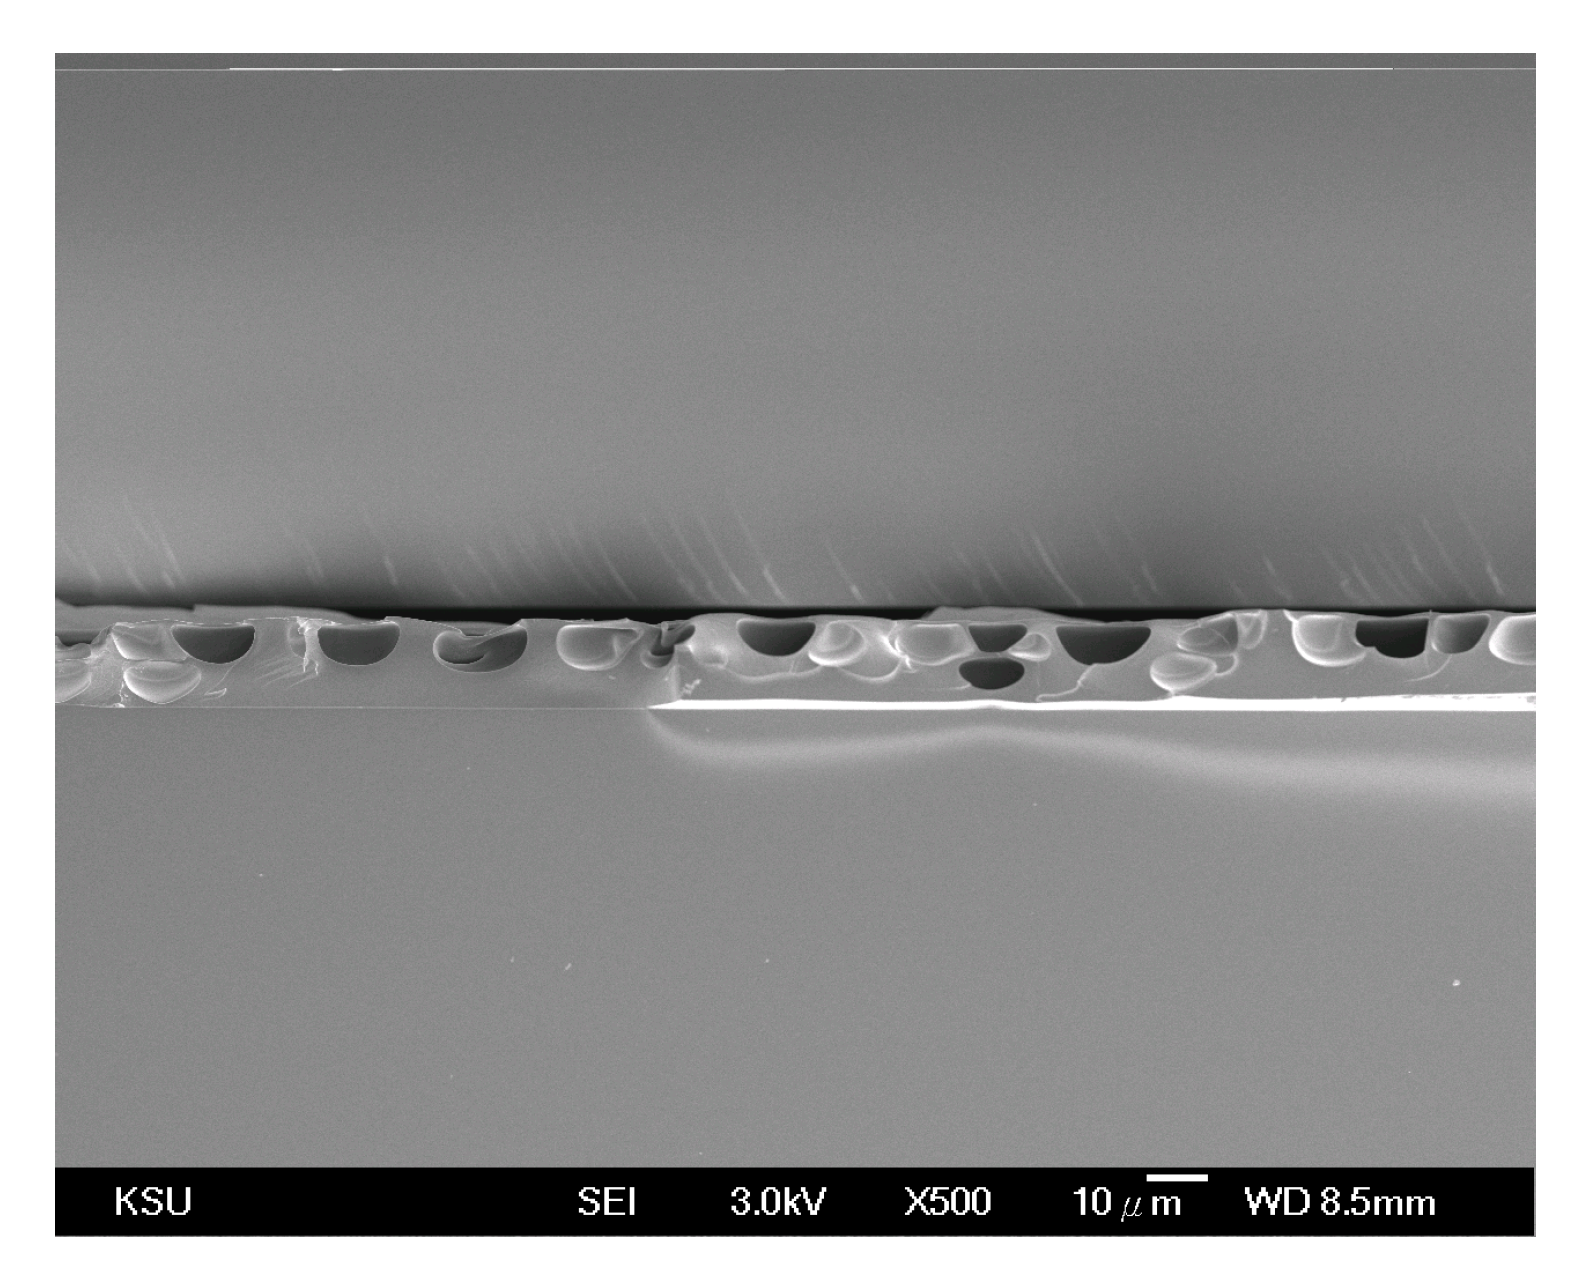
Figure 3a displays that bipolar axes for most of droplets lie on the plane parallel to the substrates, implying that LCs in droplets experience a homogenous anchoring force parallel to the substrates. To identify the origin of this force, we examine the side-view SEM image of large-droplet PDLC after removing LCs. As shown in Figure 4, each LC droplet features dome-like morphology with a bottom parallel to cell substrate after complete photopolymerization. The bottom of each droplet does not contact directly with the substrate because of the formation of a thin polymer film between them. This polymer layer may induce homogeneous anchoring force on LCs of each droplet. According to the above-mentioned information, we provide two examples of LC configuration for the dome-like bipolar droplets at V = 0 V, as displayed in Figure 5, where yellow arrows and red points represent bipolar axes and two surface point defects in droplets, respectively. When the bipolar axis of a droplet lies at nearly ±45° and 0° (or 90°), the droplet will display a brighter and darker image under POM with crossed polarizers, respectively. This phenomenon occurs due to the large and small phase retardations for optical axes (along the bipolar axes) at ±45° and 0° (or 90°), resulting in strong and weak light leakages through the analyzer, respectively. This result is similar to the case when droplets are spherical with a bipolar axis lying on cell substrate surface. At voltages from 0 V to 7 V, the PDLC image shows a similar variation to that in traditional PDLC when the voltage increases. That is, the color of each bipolar droplet changes from 0 V to 4 V, and a crossed dark fringe gradually appears from 4 V to 7 V. The result is attributed to the gradual decrease of the phase retardation through each droplet as the bipolar axis of the droplet reorients gradually from a random orientation at 0 V to the direction of the applied electric field. When the voltage continues to increase from 7 V to 100 V, the appearance of each droplet becomes increasingly hazy, and the crossed dark fringe becomes unclear. Additionally, Video S1 (in the Supplementary File) presents the corresponding time-lapse photograph (one photo per second) for observing the variation in the PDLC image in time from 0 V to 100 V. The video shows that the LC droplets gradually become foggy. The LC structure in each droplet is more strongly disturbed with a high possibility when the voltage applied exceeds 7 V. This phenomenon reflects the abnormal decay of the transmission in the T-V curve from 7 V to 100 V in the large-droplet PDLC film. In general, as the voltage applied increases, the bipolar axes of the LC droplets in a traditional PDLC (with small droplets) should be parallel to the applied field such that the crossed dark fringes become clearer as observed under the POM with crossed polarizers, resulting in a high transmittance. In contrast, the large-droplet PDLC presents the abovementioned strange EO behavior as the voltage exceeds 7 V. To investigate the physical mechanism that induces the foggy appearance of the droplets, which is associated with the abnormal EO behavior for the large-droplet PDLC, further analyses must be carried out. For examples, the transmitted patterns of the probe beam at normal incidence at specific voltages and the T-V curves for s- and p-polarized incident probe beams (s- and p-waves, respectively) at oblique incidence should be compared. The following will show the associated experimental results.
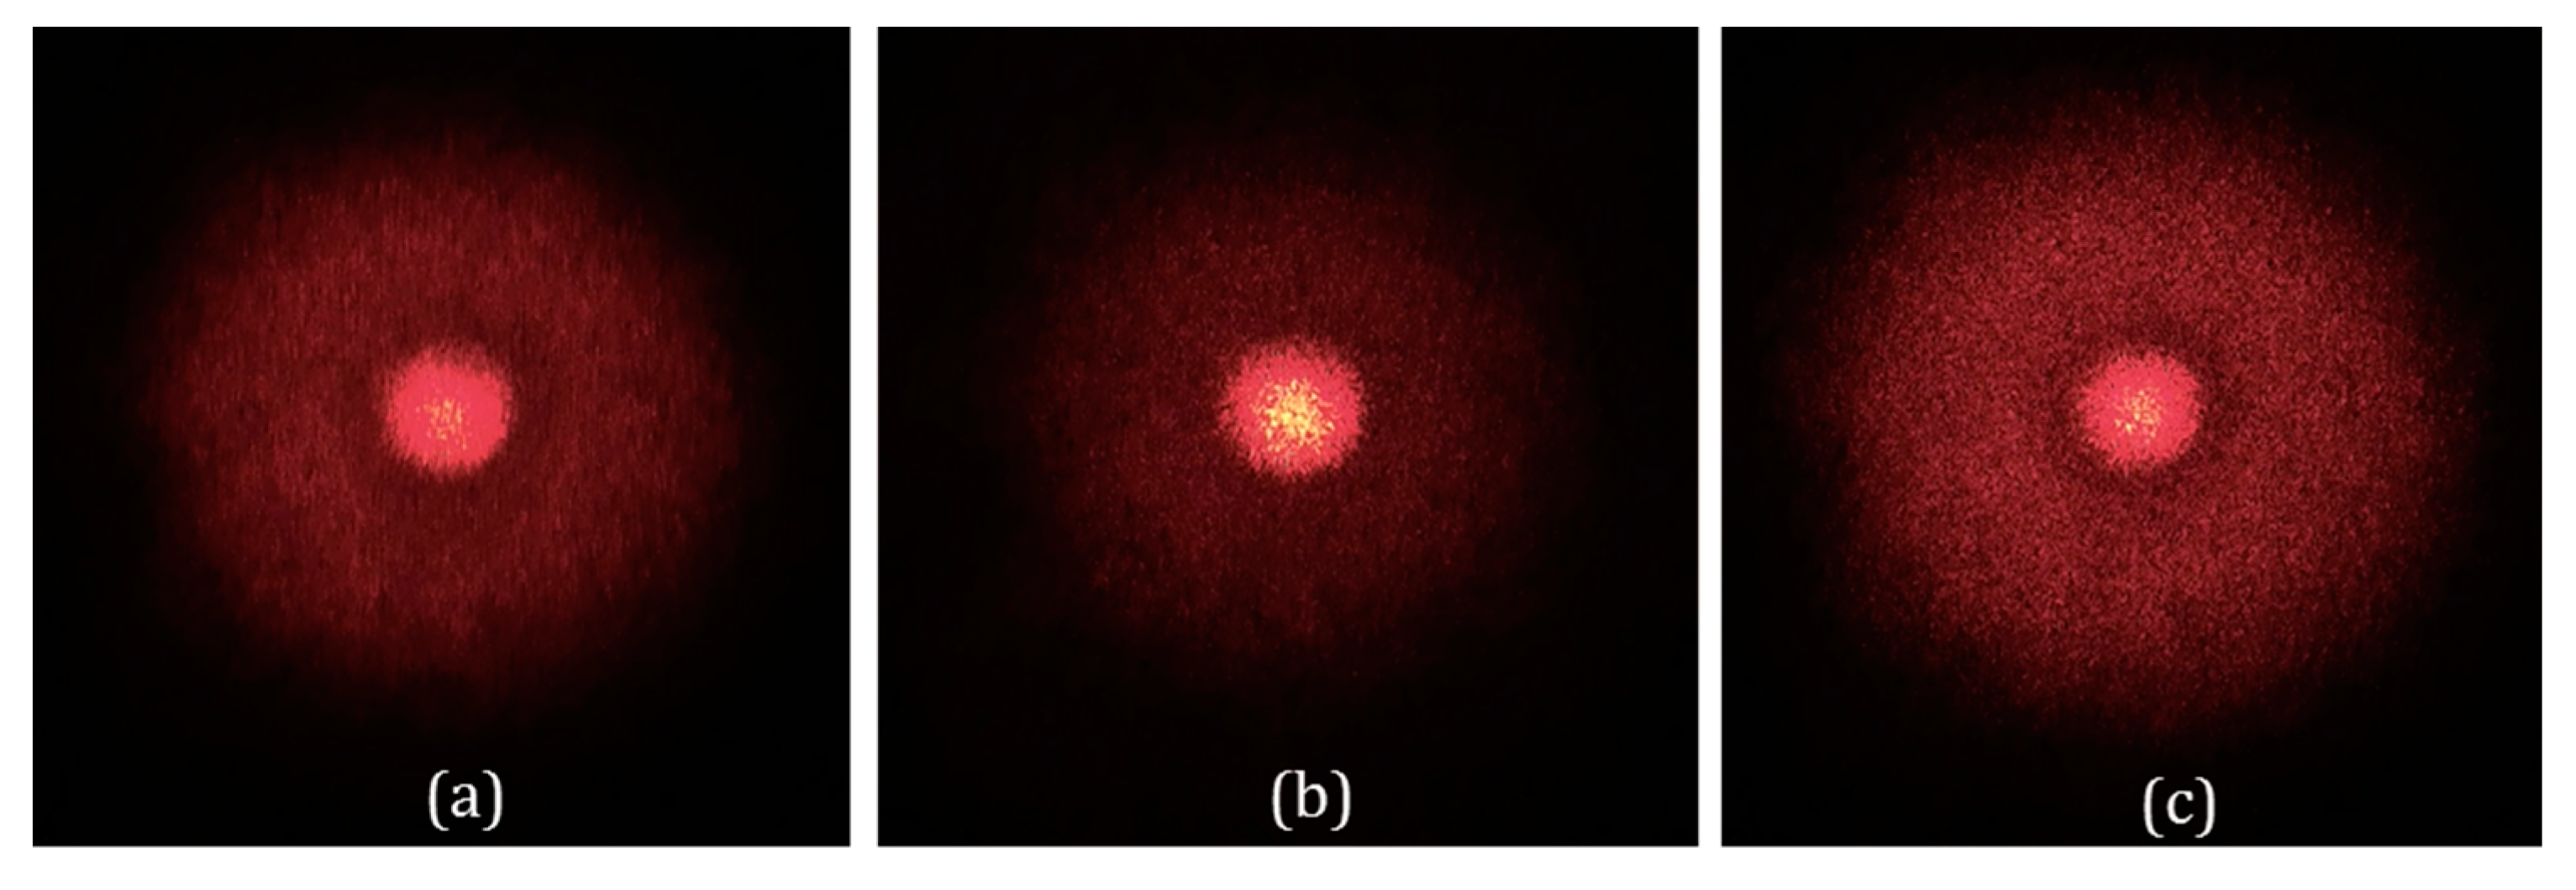
To confirm that the decay of the transmittance of the large-droplet PDLC is associated with the foggy appearance of the droplets in the PDLC, we compare the transmitted patterns of the probe beam through the PDLC at some specific voltages. Figure 6a–c show the patterns at 0, 7, and 100 V, respectively. The strong and weak scattering patterns at 0 and 7 V due to the mismatching and matching of refractive indices for the LC droplets and the polymer matrix, respectively, reflect the low and high transmittances of the PDLC shown in Figure 2b. The strong scattering pattern at 100 V through the PDLC shown in Figure 6c implies that the decay trend of the T-V curve over 7 V is certainly associated with the foggy LC droplets at the high voltage regime (i.e., 7–100 V). Given that LC is a fluid that generally buries a specific amount of charged impurities after it is manufactured, it is not difficult to associate the mechanism for inducing such foggy LC droplets with the turbulence of the charged impurities under the application of an external voltage; that is, with the EHD effect in the droplets. To further study the property of the EHD turbulence in the large droplets at the high voltage regime, we measure the T-V curves for s- and p-waves at various angles of incidence (φ) and examine the side-view SEM morphology of the large-droplet PDLC film. 
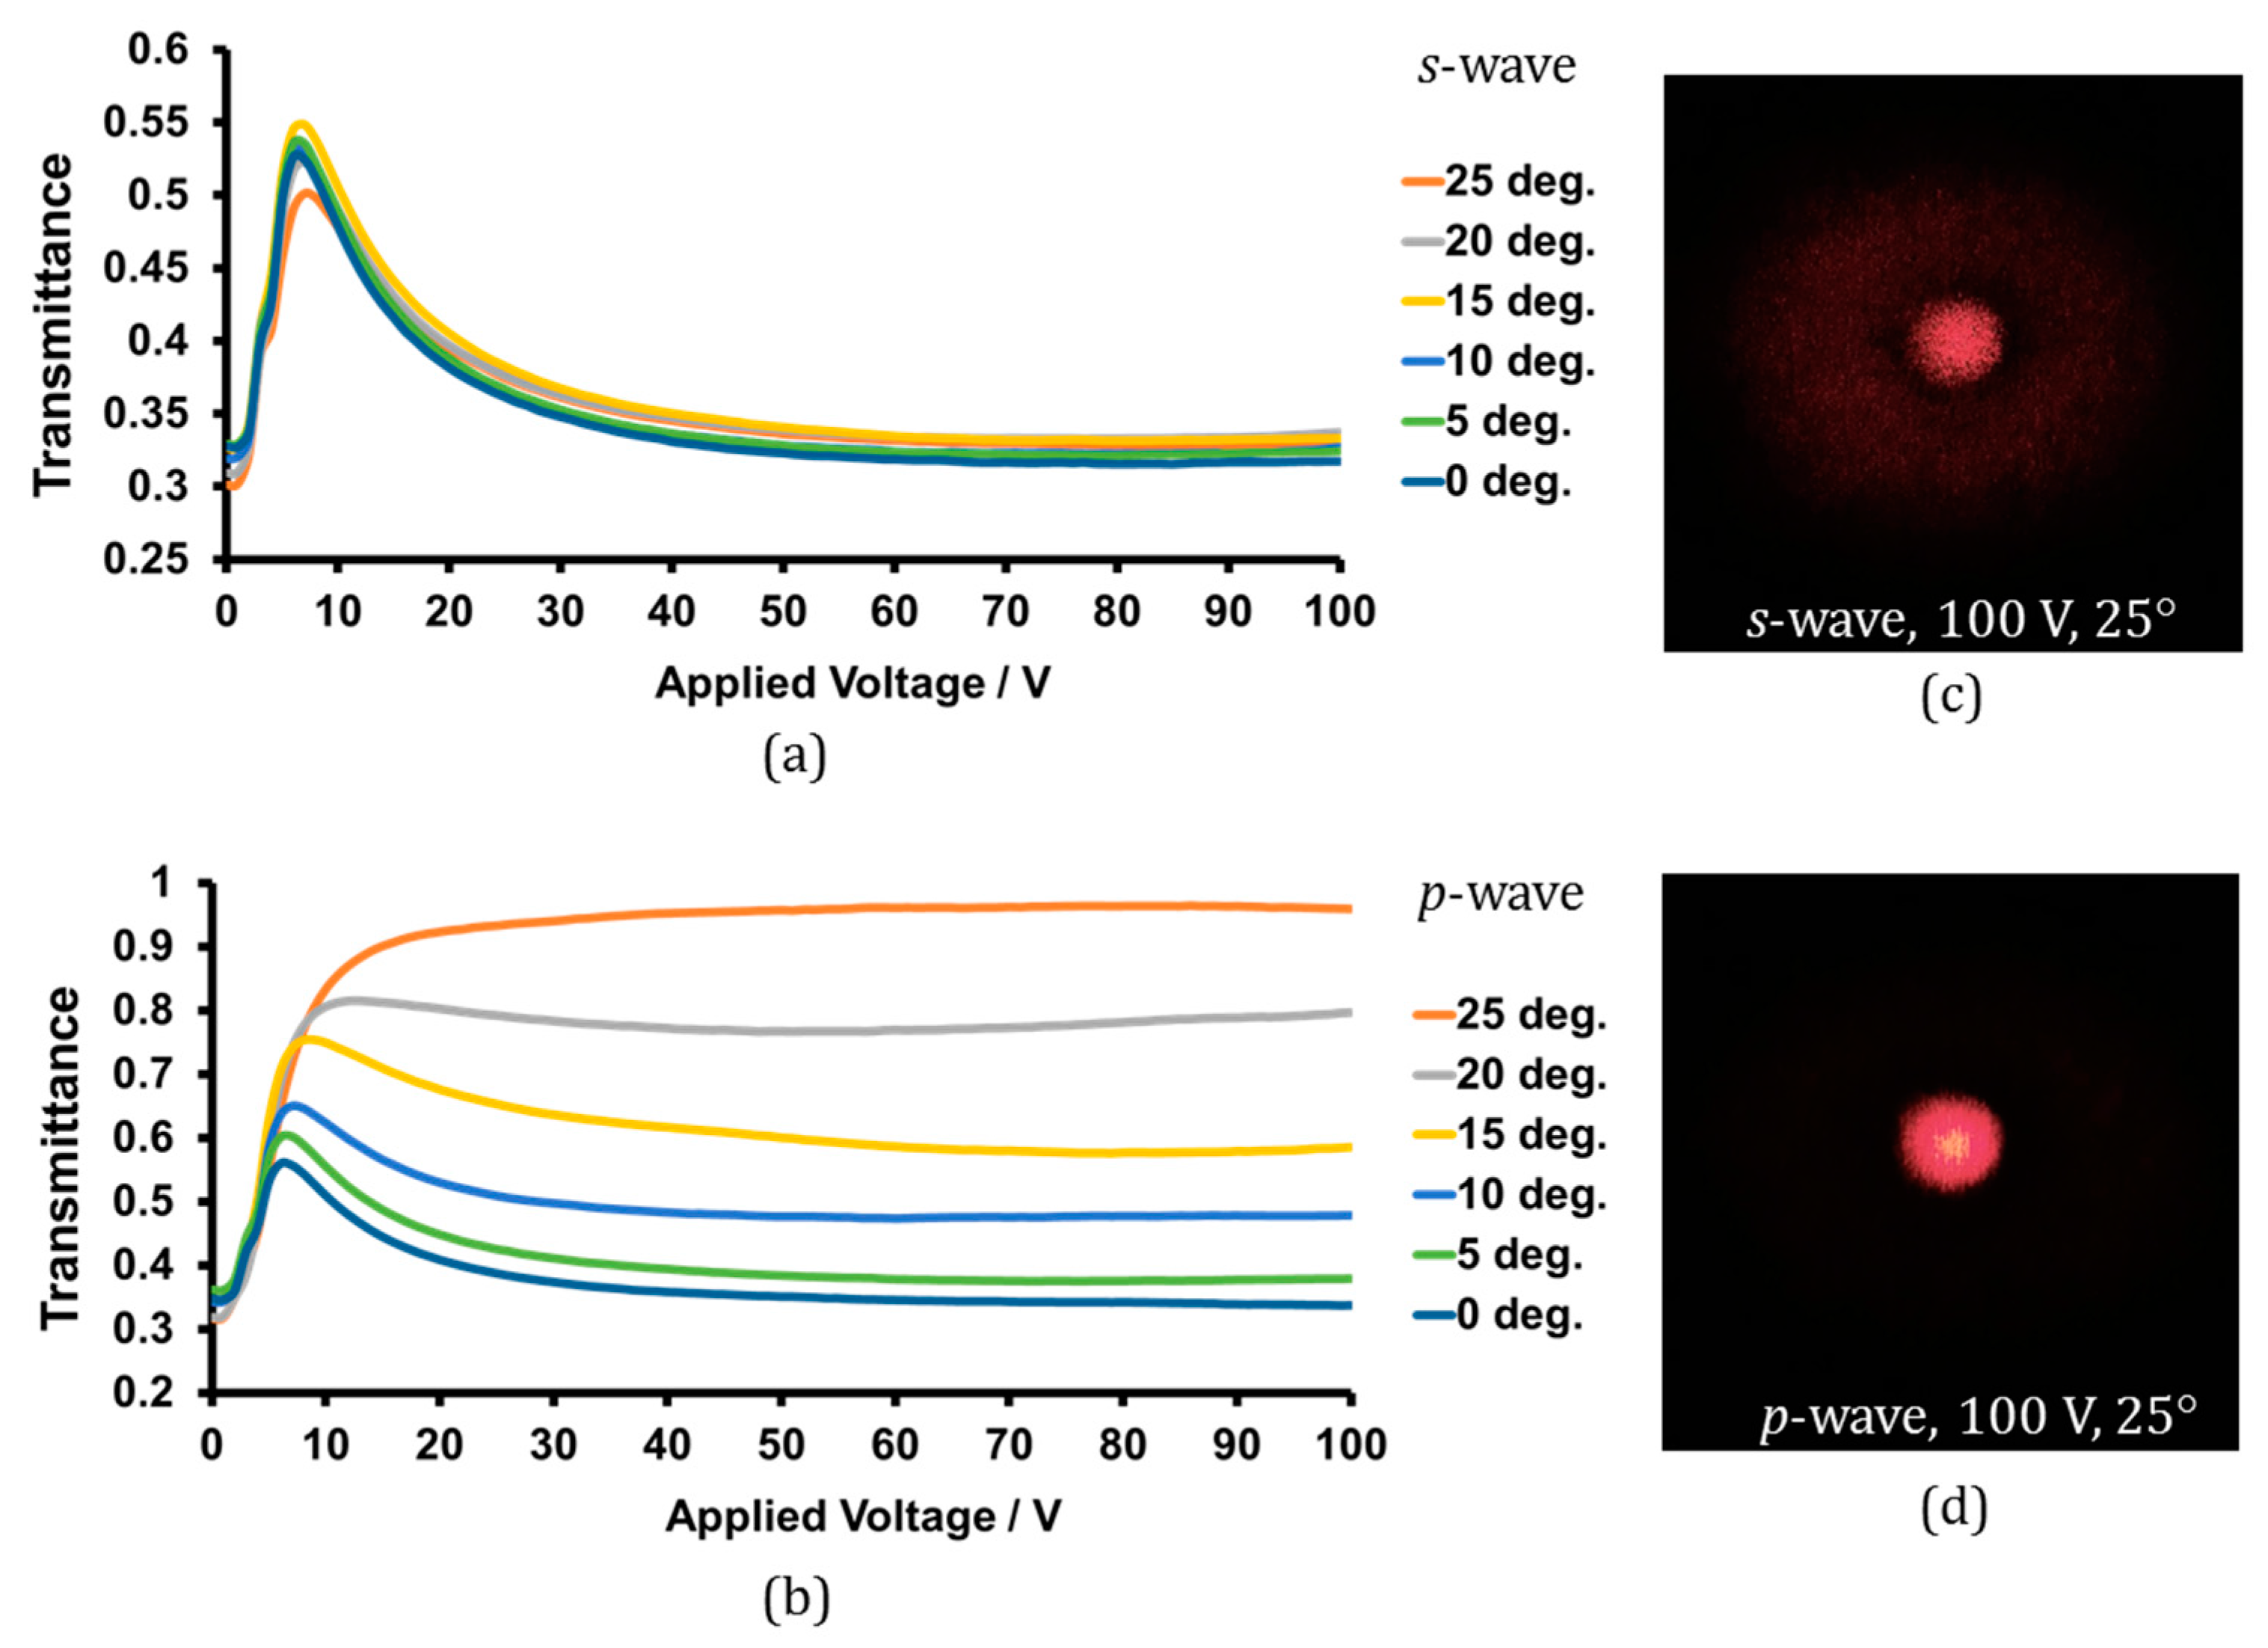
Figure 7a,b shows the T-V curves for s- and p-waves, respectively, at φ = 0°−25°. The variation in the T-V curve for s-wave is fixed as φ increases from 0° to 25°, and the transmittance at 25° slightly decays due to the Fresnel reflections at the interfaces between the cell and air. However, the T-V curves for p-wave show that the degree for the decay of the transmittance at the high voltage regime gradually reduces from φ = 0° to φ = 20°. From φ = 20° to φ = 25°, the transmittance does not decay further and even continues to increase with rising voltage. Figure 7c,d shows the transmitted patterns of s- and p-waves through the PDLC, respectively, at 25°. The scattering is strong for s-wave but not for p-wave; this result is consistent with the T-V curve displayed in Figure 7a,b. The experimental results in Figure 7 show strong polarization independence and polarization dependence in the T-V curve and in the scattering strength at the high voltage regime at normal and oblique incidence, respectively. These findings imply that the EHD turbulence does not flow isotropically.
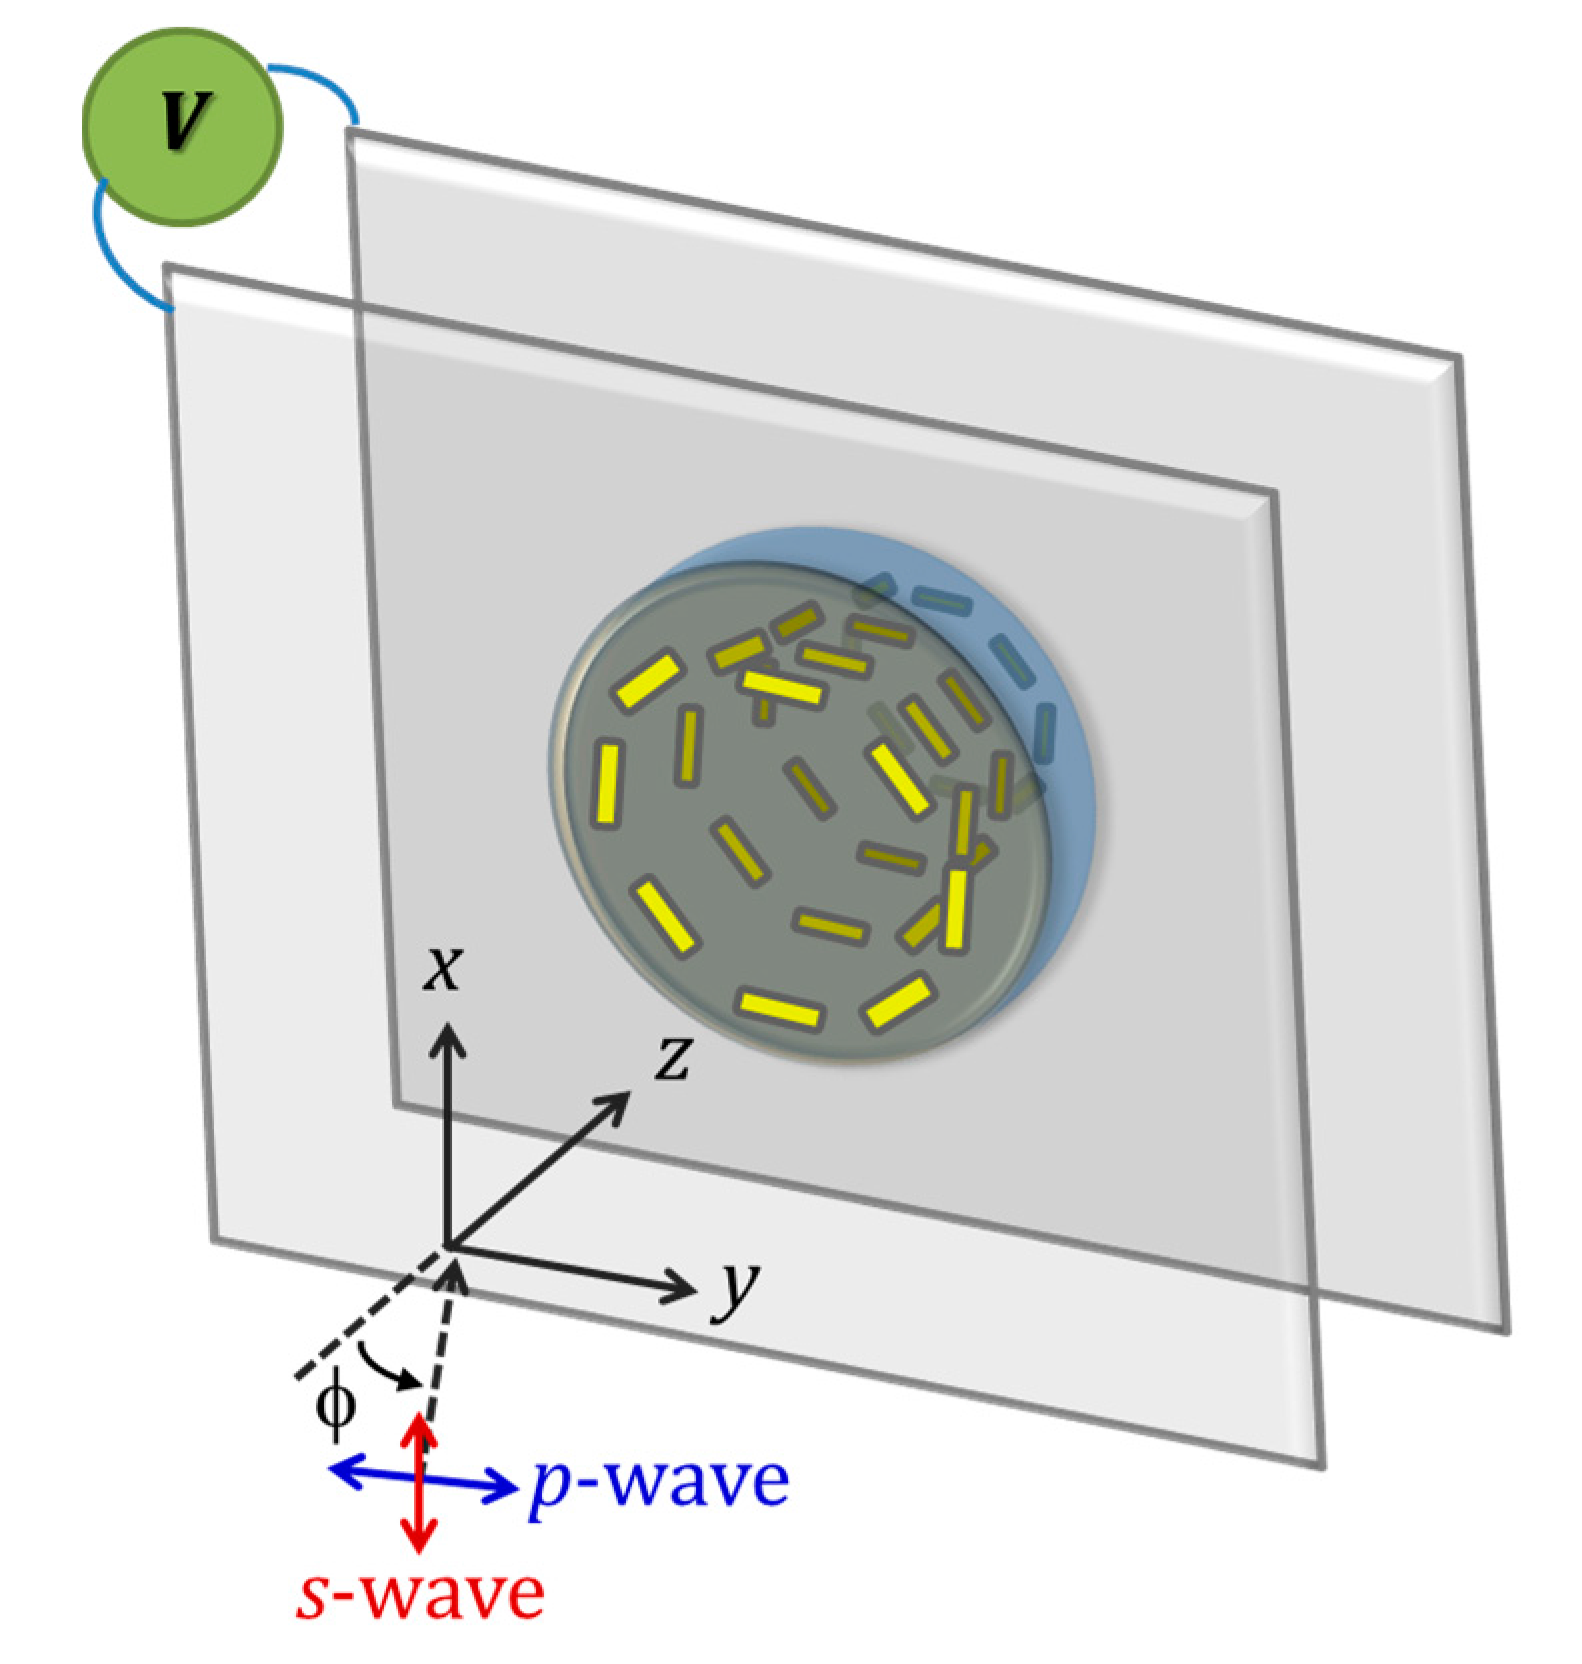
After summarizing the abovementioned experimental results and associated analyses, we first establish a physical model for describing the EHD turbulence in the large LC droplets of the present PDLC. As shown in Figure 8, a vortex-like LC director field can be induced by a vortex-like turbulence of charged impurity whose circular flowing is along the azimuthal direction projected on the xy plane, and the axis of rotation is roughly along the z direction. The vortex-like turbulence of charged impurity is generated by the EHD effect under the action of the electric field along the z axis and the confinement of the dome-like boundary of the droplets whose bottoms are parallel to the cell substrates (Figure 4).
In considering the physical model of the vortex-like LC director field, two factors can induce the polarization independence and polarization dependence for the T-V curves and the scattering for normal and oblique incidences, respectively, at the high voltage regime. One is scattering due to mismatch of the refractive indices at the interfaces between the LC droplets and the polymer (nLC and np, respectively). Another is dynamic scattering due to the local fluctuation of the director field within the droplet when the light propagates through the large LC domain (20−40 μm) in each dome-like droplet. The foggy appearance of each LC droplet is strong evidence to support the latter factor. However, given the stabilization of the electric field along the z axis, the component of the vortex-like director field projected on the xy plane can more apparently fluctuate locally than that on the z axis under the influence of the vortex-like turbulence of charged impurity in each droplet. Suppose φ is defined as the incident angle of the probe beam relative to +z direction on the yz plane, which is the plane of incidence in the model schema shown in Figure 8. At φ = 0 (along the +z direction), the incident wave with a linear polarization along the x or y directions will experience an identically large mismatch of nLC and np concomitantly with a strong local fluctuation of the director field projected on the xy plane because the incident polarization is on the xy plane, resulting in strong resultant scattering and low transmittance at the high voltage regime. As φ increases, both the mismatch of nLC and np and the local fluctuation of the vortex-like director field for the s-wave (along the x direction) are unchanged, because the polarization of the s-wave is still on the xy plane. However, both factors decrease for p-wave under increasing φ because the polarization of the p-wave deviates from being on the xy plane. Thus, a strong and low resultant scattering can be induced, causing low and high transmittance for s- and p-waves, respectively, at high voltage regimes such as, for example, 25°.
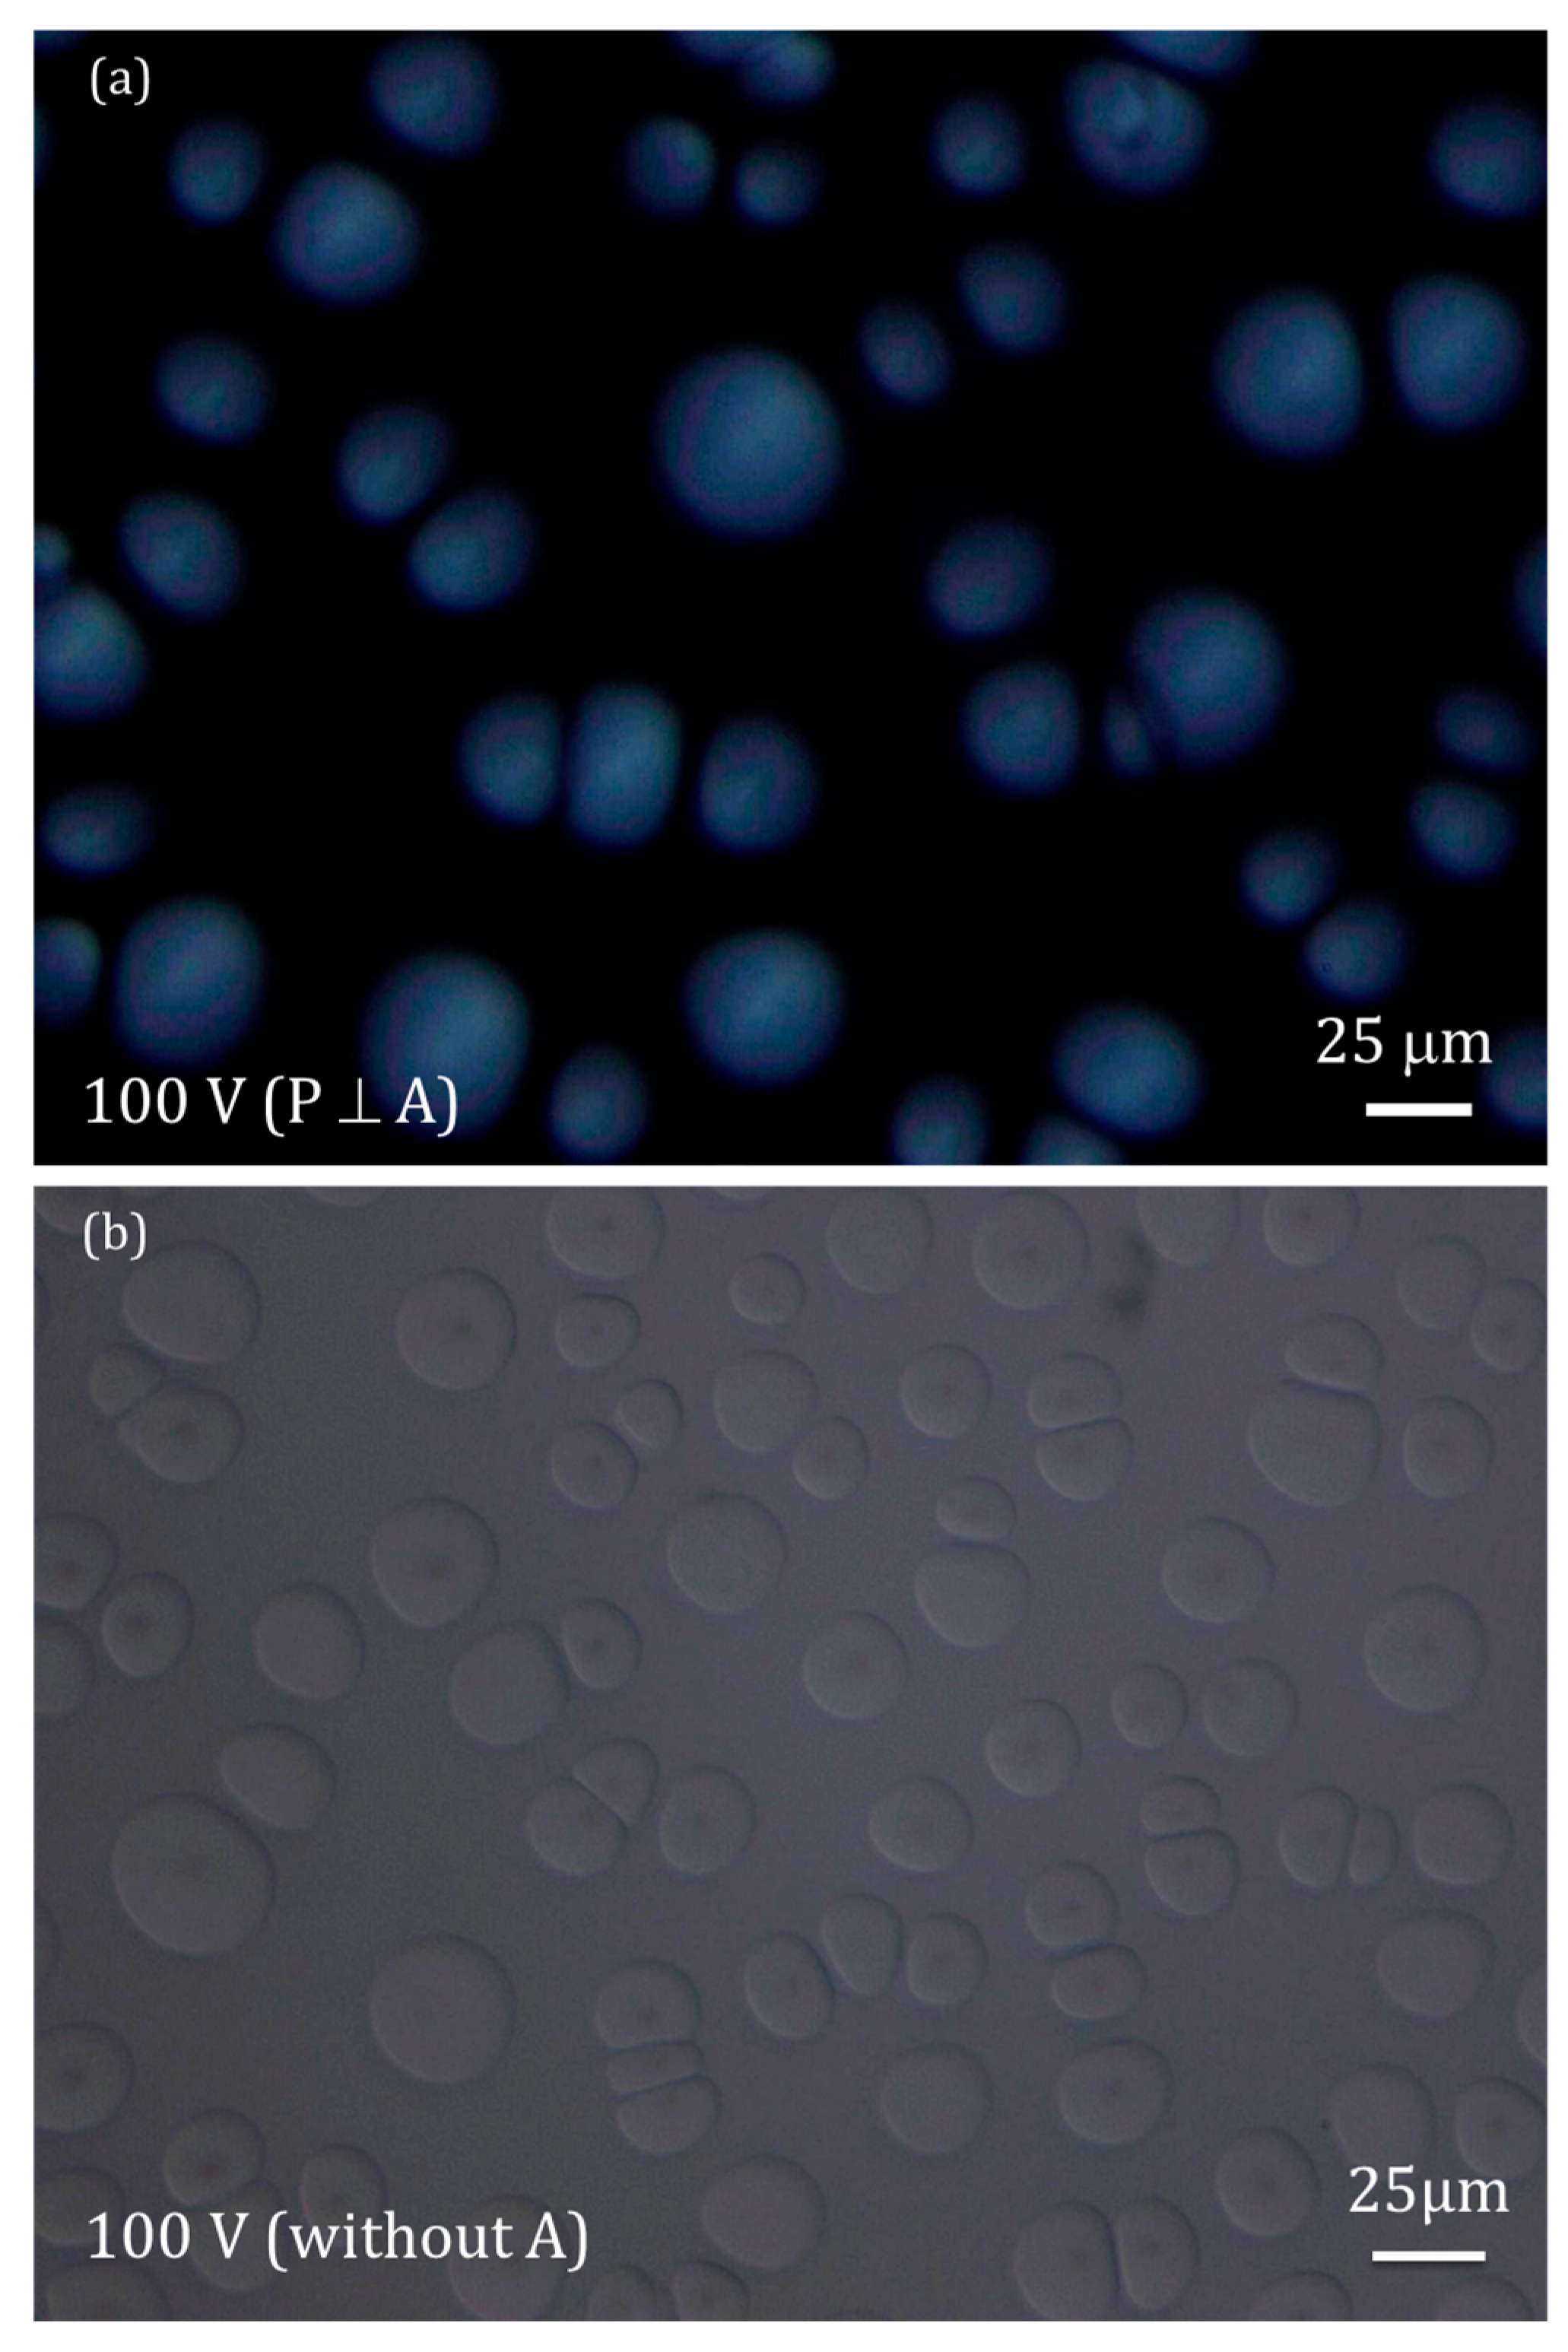
We unintentionally observe a greenery concentric circle system for each droplet under the POM with crossed polarizers. As shown in the PDLC image displayed in Figure 9, which is the magnified version of Figure 3l, greenery concentric circles appear on each LC droplet. These concentric circles are not very clear probably due to the strong scattering of each LC droplet. Given the azimuthally symmetric vortex-like director field in the dome-like LC droplet, the effective phase retardation of the incident light (green component) through each LC droplet in the POM periodically changes along the depth of the LC droplets, resulting in the greenery concentric circle system in each droplet. Additionally, Video S2 (in the Supplementary File) presents the corresponding time-lapse photograph (one photo per second) for observing the variation in the greenery concentric circle system in time at 100 V for 20 s. The greenery concentric circles circulate on the xy plane along the rotational axis normal to the xy plane. This result implies the existence of the vortex of charged impurity in the droplet, which can induce the local fluctuation of the vortex-like director field on the xy plane and lead to the dynamic circulation of the greenery concentric circles. Another piece of direct evidence for the existence of the vortex-like turbulence of the charged impurity at the high voltage regime is the formation of defect lines at the centers of the droplets of the PDLC film. Figure 9b presents the POM image without the analyzer at 100 V, in which most droplets appear as dark dots on their centers. These dots indicate the position of the rotational axis, and thus the defect line for the vortex-like director field. Videos S3 and S4 (in the Supplementary File) show the corresponding time-lapse photographs (one photo per second) for observing the variations in the PDLC image at voltages from 0 V to 100 V and in the dark-dot pattern of the droplets in time at 100 V for 20 s, respectively, under the POM without analyzer. The former video shows that the dark dot and corresponding defect line nearly at the central region of the droplet form at the high voltage regime, and the bipolar defects of the droplets simultaneously disappear. The latter video shows that the pattern of the dark dots at the central regions of the droplets slightly fluctuates with time. This result is reasonable, because the defect line is dynamic enclosed by the dynamic vortex-like turbulence of charged impurity in each droplet.
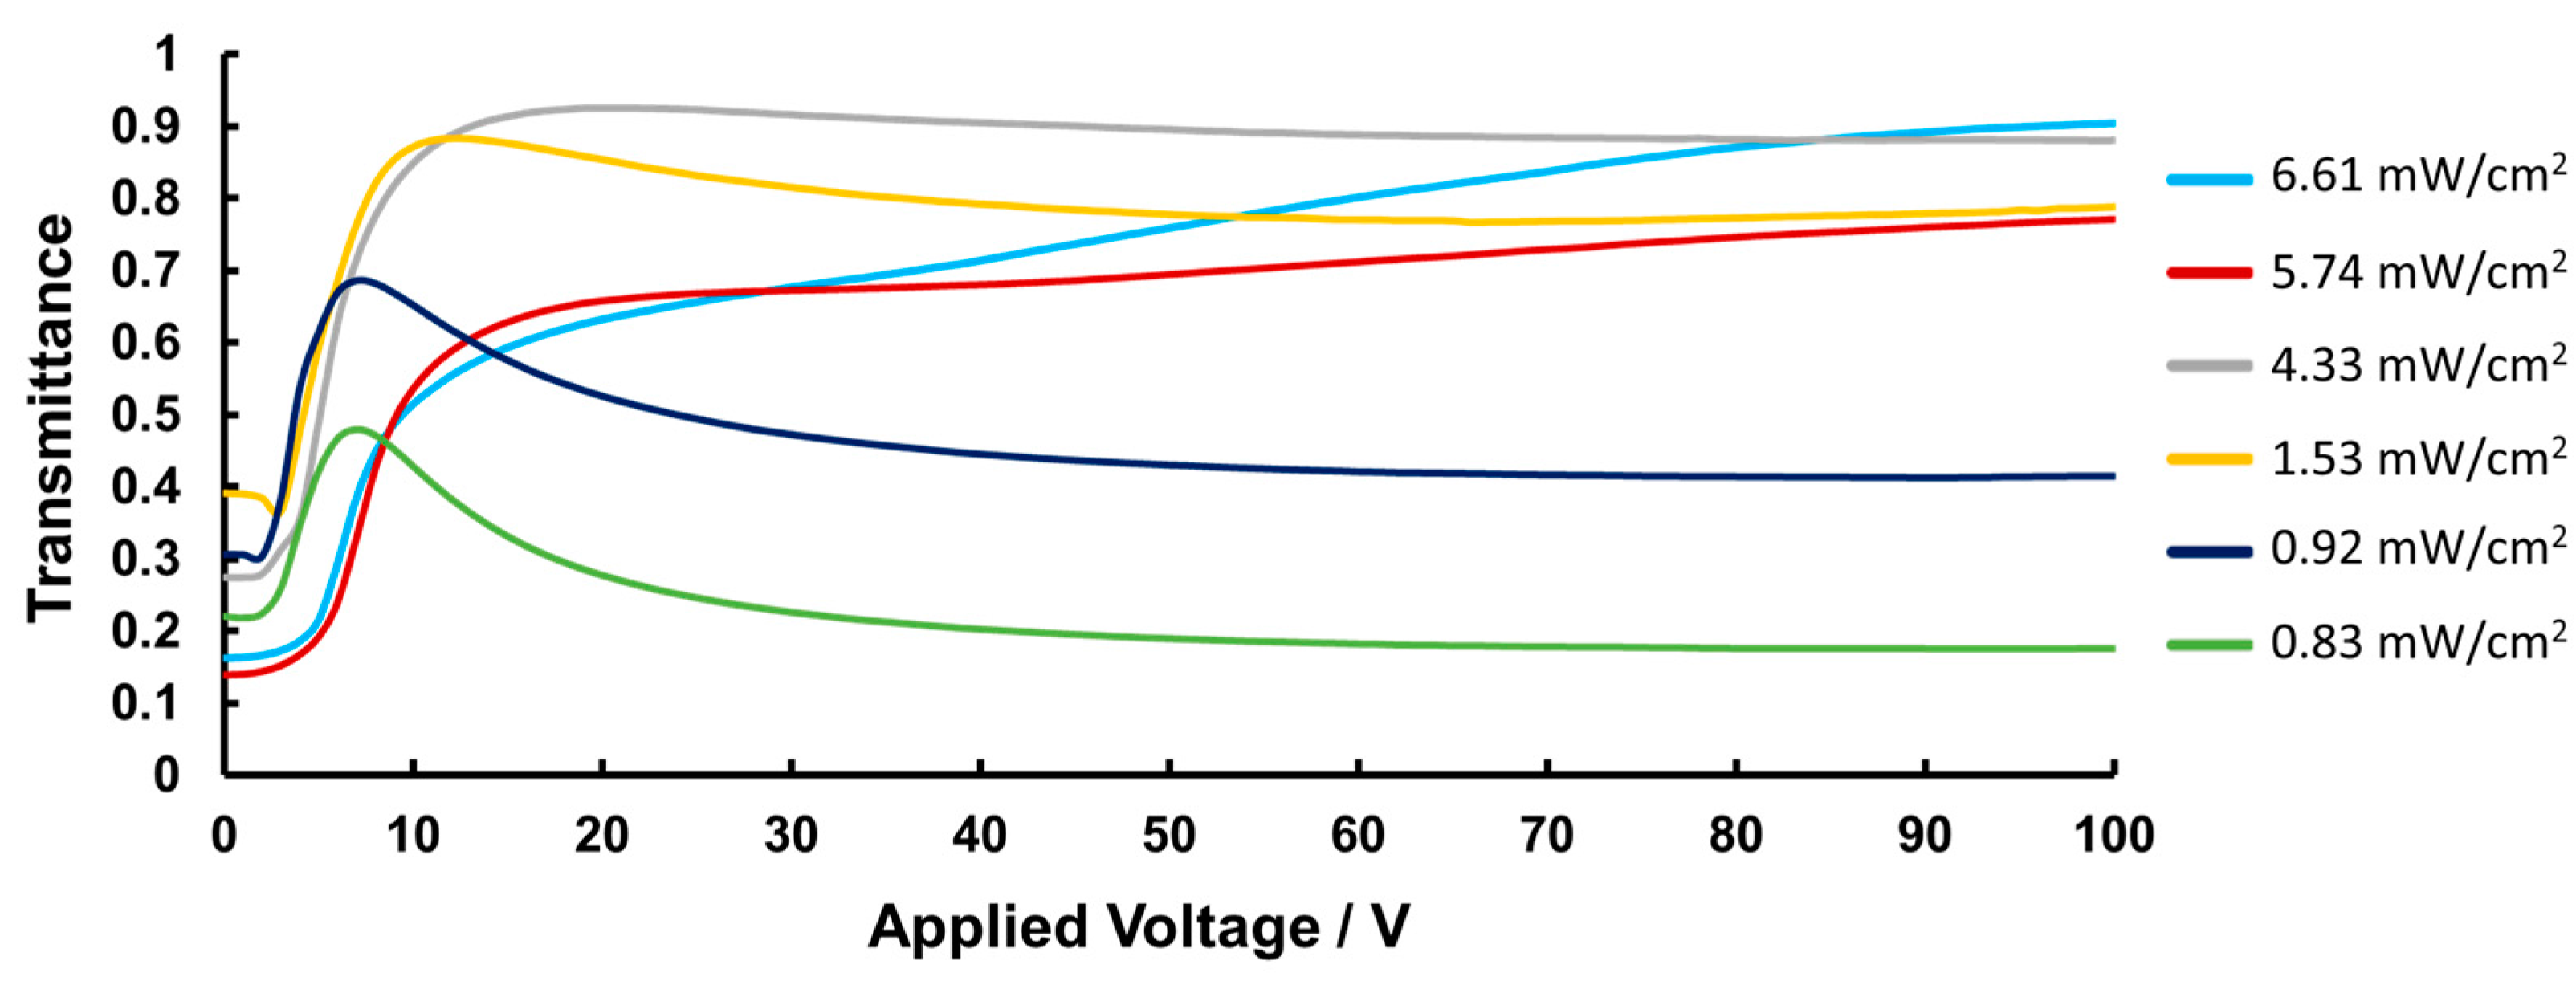
As presented in the previous experimental results, anomalous EO characteristics can only occur in large-droplet PDLC systems but not in small-droplet ones. To determine how the size of LC droplets influences abnormal EO feature of PDLC, we carry out additional experiments by preparing six PDLC cells with different droplet sizes obtained after UV curing at intensities of 6.61, 5.74, 4.33, 1.53, 0.92, and 0.83 mW/cm2 for the same time of 12 h. Except for UV intensity, all experimental conditions used in this experiment are the same with those used to fabricate large-droplet PDLC introduced in Section 2. Figures S1–S6 (in the Supplementary File) present recorded POM images of PDLC (with crossed polarizers) obtained after UV curing at intensities of 6.61, 5.74, 4.33, 1.53, 0.92, and 0.83 mW/cm2 at V = 0–100 V, respectively. Notably, POM images for the six PDLC films show that the average size of LC droplets in formed PDLC films increases from around 5 μm to around 25 μm with decreasing curing intensity of UV light from 6.61 mW/cm2 to 0.83 mW/cm2. Corresponding T-V curves of incident non-polarized probe beam at normal incidence for the six PDLC cells in Figure 10 show less difference among PDLC cells in terms of EO behavior at low-voltage regime. This result is consistent with the revolution of recorded POM images for the six PDLC films at a low-voltage regime (Figures S1–S6). However, at high-voltage regimes (e.g., at 100 V), larger droplet size causes the appearance of foggier droplets under POM with crossed polarizers. Thus, these results provide evidence that the effect of EHD-induced vortex-like director field will become weaker as droplets in PDLC become smaller. Experimental results support the notion that abnormal EO of PDLC becomes more notable when droplets of PDLC are larger at high-voltage regime; that is, decay for transmittance in the T-V curve becomes more serious when LC droplets of PDLC become larger (Figure 10). These results evidently imply that formation of EHD-induced vortex-like turbulence of charged impurities is significantly related to droplet size of PDLC. Notably, the T-V curves in Figure 10 shows that the transmittance no longer decays at the high-voltage regime once the intensity of UV irradiation to form the PDLC is as high as 4.33 mW/cm2. For the present PDLC system, thresholds of average droplet size in PDLC for inducing abnormal EO feature measures around 10 μm (Figure S3).
Although the experimental results mentioned above support the possible occurrence of the addressed vortex model of LC director field on the x-y plane, the presence of an actual director field may be more complex, and the LC director probably lies in the z direction in the middle of droplets under the action of an applied electric field, except near surfaces. To further understand the system and its mechanism, additional experiments should consider specific influencing factors, such as droplet shape and frequency of external AC voltage. Associated simulation work will be carried out in the future.

4. Conclusions

In this work, we prepare a large-droplet PDLC film using UV exposure at low intensity, and, for the first time, observe abnormal EO behaviors of the PDLC. The abnormal EO behaviors of the PDLC include the transmittance’s decay at normal incidence and the conversion between polarization independence and polarization dependence in the T-V curve at the high voltage regime at normal and oblique incidences, respectively. Experimental results in some extra measures reflect the association of the abnormal EO behaviors with the vortex-like director field of the LCs formed in each large droplet whose local fluctuation leads to the hazy appearance of the droplet at a high voltage regime. The vortex-like director field is induced by the vortex-like turbulence of charged impurity due to the EHD effect under the action of the applied field along the cell normal and the confinement of the dome-like boundary of the droplet on the charged impurities. The resultant scattering is determined by the degrees of mismatch between the refractive indices of LC droplet and polymer and the local fluctuation of the vortex-like director field, resulting in the abnormal EO phenomena of the large-droplet PDLC. This study not only provides novel insight into the EHD of anisotropic fluid in 3D micro-containers (e.g., the large LC droplets) but also demonstrates the potential of large-droplet PDLC in various engineering applications, such as electrically controllable polarization-based components or optical converters of polarization independence and polarization dependence.

Supplementary Materials

The following are available online at www.mdpi.com/2073-4352/7/7/227/s1, Video S1: Time-lapse photograph (one photo per second) for observing the variation in the PDLC image in time at voltages from 0 V to 100 V under POM with crossed polarizers; Video S2: Time-lapse photograph (one photo per second) for observing the variation in the greenery concentric circle system in time at 100 V for 20 s; Videos S3 and S4: Time-lapse photographs (one photo per second) for observing the variations in the PDLC image in time from 0 V to 100 V and in the dark-dot pattern of the droplets in time at 100 V for 20 s, respectively, under the POM without analyzer. Figures S1–S6: Recorded POM images of five PDLC films (with crossed polarizers) obtained after UV curing at intensities of 6.61, 5.74, 4.33, 1.53, 0.92, and 0.83 mW/cm2 at V = 0−100 V, respectively, for the same time of 12 h.

Acknowledgments

The authors would like to thank the Ministry of Science and Technology of Taiwan (Contract numbers: MOST 103-2112-M-006-012-MY3 and MOST 104-2628-E-006-015-MY2) and the Advanced Optoelectronic Technology Center, National Cheng Kung University, under the Top University Project from the Ministry of Education, for financially supporting this research.

Author Contributions

Sheng-Kuang Wu and Ting-Shan Mo conceived and designed the experiments; Sheng-Kuang Wu performed the experiments; Jia-De Lin, Lin-Jer Chen, and Chia-Rong Lee analyzed the data through detailed discussion; Shuan-Yu Huang, Chia-Yi Huang, and Hui-Chen Yeh contributed reagents/materials/analysis tools; Chia-Rong Lee wrote the paper.

Conflicts of Interest

The authors declare no conflict of interest. The founding sponsors had no role in the design of the study; in the collection, analyses, or interpretation of data; in the writing of the manuscript, and in the decision to publish the results.

References

  1. Meyer, R.B. Piezoelectric Effects in Liquid Crystals. Phys. Rev. Lett. 1969, 22, 918–921. [Google Scholar] [CrossRef]
  2. Taylor, L.J. Preparation of Liquid Crystal Containing Polymeric Structure. U.S. Patent 4,101,207, 18 July 1978. [Google Scholar]
  3. Craighead, H.G.; Cheng, J.; Hackwood, S. New display based on electrically induced index matching in an inhomogeneous medium. Appl. Phys. Lett. 1982, 40, 22–24. [Google Scholar] [CrossRef]
  4. Doane, J.W.; Vaz, N.A.; Wu, B.G.; Zumer, S. Field controlled light scattering from nematic microdroplets. Appl. Phys. Lett. 1986, 48, 269–271. [Google Scholar] [CrossRef]
  5. Amundson, K.; Blaaderen, A.; Wiltzius, P. Morphology and electro-optic properties of polymer-dispersed liquid-crystal films. Phys. Rev. E 1997, 55, 1646–1654. [Google Scholar] [CrossRef]
  6. Marinov, Y.G.; Hadjichristov, G.B.; Petrov, A.G.; Marino, S.; Versace, C.; Scaramuzza, N. Electro-optical response of polymer-dispersed liquid crystal single layers of large nematic droplets oriented by rubbed teflon nanolayers. J. Appl. Phys. 2013, 113, 064301. [Google Scholar] [CrossRef]
  7. Demus, D.; Goodby, J.; Gray, G.W.; Spiess, H.W.; Vill, V. Physical Properties of Liquid Crystal; Wiley-VCH: Weinheim, Germany, 1999; Chapter 9. [Google Scholar]
  8. Burt, J.P.H.; Goater, A.D.; Menachery, A.; Pethig, R.; Rizvi, N.H. Development of microtitre plates for electrokinetic assays. J. Micromech. Microeng. 2007, 17, 250–257. [Google Scholar] [CrossRef]
  9. Fenn, J.B.; Mann, M.; Meng, C.K.; Wong, S.F.; Whitehouse, C.M. Electrospray ionization–principles and practice. Mass Spectrom. Rev. 1990, 9, 37–70. [Google Scholar] [CrossRef]
  10. Mazutis, L.; Baret, J.C.; Treacy, P.; Skhiri, Y.; Araghi, A.F.; Ryckelynck, M.; Taly, V.; Griffiths, A.D. Multi-step microfluidic droplet processing: Kinetic analysis of an in vitro translated enzyme. Lab Chip 2009, 9, 2902–2908. [Google Scholar] [CrossRef] [PubMed]
  11. Williams, R. Domains in liquid crystals. J. Chem. Phys. 1963, 39, 384–388. [Google Scholar] [CrossRef]
  12. Buka, A.; Kramer, L. Pattern Formation in Liquid Crystals; Springer: Berlin, Germany, 1996. [Google Scholar]
  13. Thakur, V.K.; Kessler, M.R. Liquid Crystalline Polymers: Volume 2—Processing and Applications; Springer: Cham, Switzerland, 2015; Chapter 7. [Google Scholar]
Figure 1. Images of PDLC films with (a) small and (b) large LC droplets observed under POM with crossed polarizers obtained after high- and low-intensity UV exposure with 12.3 and 0.96 mW/cm2 for 10 min and 12 h, respectively.
Crystals 07 00227 g001
Figure 2. T-V curves measured for PDLC films with (a) small and (b) large LC droplets in the presence of an AC voltage with 1 kHz.
Crystals 07 00227 g002
Figure 3. Images of the PDLC film with large droplets observed under POM with crossed polarizers at (a) 0, (b) 2, (c) 3, (d) 4, (e) 5, (f) 7, (g) 10, (h) 20, (i) 30, (j) 50, (k) 80, and (l) 100 V. Video S1 shows the corresponding time-lapse photograph of the PDLC film (one photo per second) at various voltages from 0 V to 100 V.
Crystals 07 00227 g003
Figure 4. Side-view SEM image of the PDLC film with large droplets after removing the LCs in the droplets. Dome-like morphology with the bottom parallel to the cell substrates for the LC droplets can be clearly observed in the film.
Crystals 07 00227 g004
Figure 5. Two examples of LC configuration for dome-like bipolar droplets at V = 0. Yellow arrows and red points represent bipolar axes and two surface point defects in the droplets, respectively. “P” and “A” represent the polarizer and analyzer in POM, respectively. Droplet image is obtained by magnifying Figure 3a.
Crystals 07 00227 g005
Figure 6. Transmitted patterns of the incident He-Ne probe beam at normal incidence through the PDLC film with large droplets at (a) 0, (b) 7, and (c) 100 V. The screen is placed around 30 cm behind the sample.
Crystals 07 00227 g006
Figure 7. T-V curves of the PDLC film with large droplets probed by the (a) s-wave and (b) p-wave at different incident angles of 0°−25°. (c,d) are the transmitted patterns at an incident angle of 25° for s-wave and p-wave at 100 V, respectively.
Crystals 07 00227 g007
Figure 8. Physical model of the vortex-like director field of LCs (yellow rods: LC molecules) obtained by the driving of a vortex-like turbulence of charge impurity induced by the EHD effect under the action of the low-frequency-applied electric field along the z direction and the confinement of the dome-like boundary of the droplet at the high voltage regime. The bottom of the dome-like morphology of the LC droplet is on the xy plane and the rotational axis of the vortex-like turbulence of charge impurity is along the z axis. φ is the incident angle of probe beam relative to the z axis on the yz plane (plane of incidence).
Crystals 07 00227 g008
Figure 9. (a) Greenery concentric circles for each LC droplet can be observed under the POM with crossed polarizers at the high voltage regime (i.e., 100 V). Video S2 shows the corresponding time-lapse photograph of the LC droplet (one photo per second) at 100 V. (b) Dark dots for most LC droplets at their centers can be observed under the POM with no analyzer at the high voltage regime (i.e., 100 V). Videos S3 and S4 show two corresponding time-lapse photographs (one photo per second) of the PDLC image under the POM with no analyzer at voltages from 0 V to100 V and at 100 V for 20 s, respectively. The characters “P” and “A” in the photos represent the polarizer and analyzer in the POM, respectively.
Crystals 07 00227 g009
Figure 10. Corresponding T-V curves of incident non-polarized probe beam at normal incidence for five PDLC cells after UV curing with intensities of 6.61, 5.74, 4.33, 1.53, 0.92, and 0.83 mW/cm2.
Crystals 07 00227 g010

