Photoinduced Phase Transitions in α-, θ-, and κ-type ET Salts: Ultrafast Melting of the Electronic Ordering

Abstract
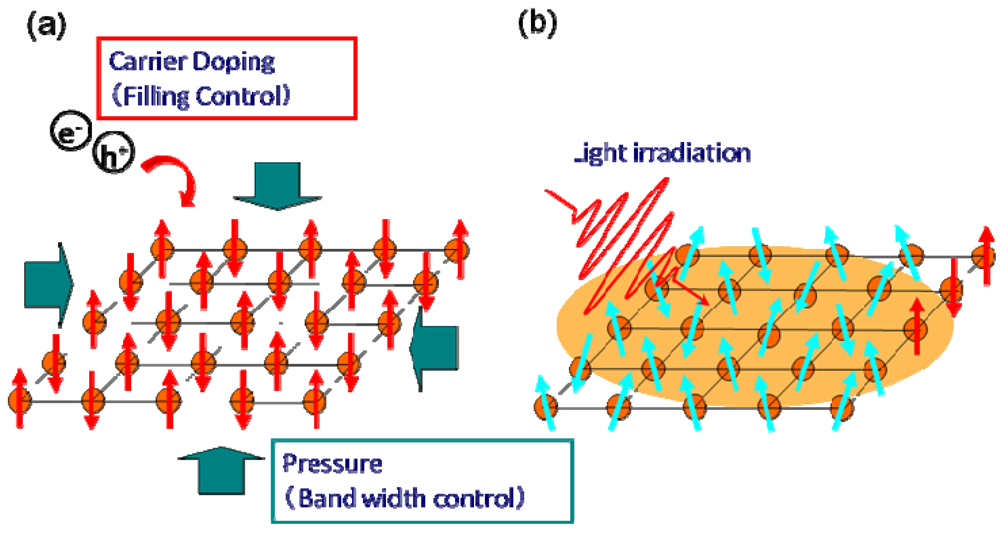
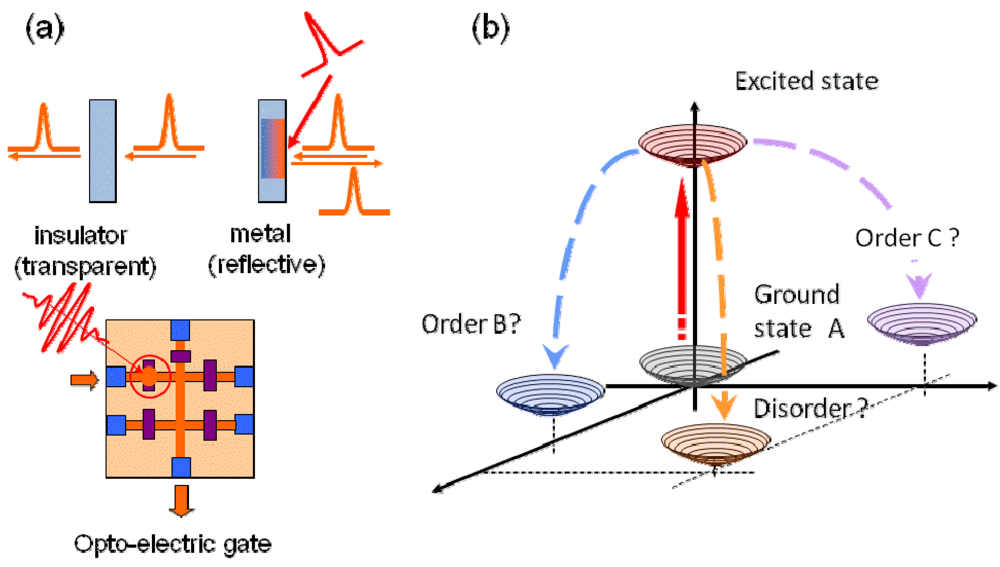
:1. Introduction

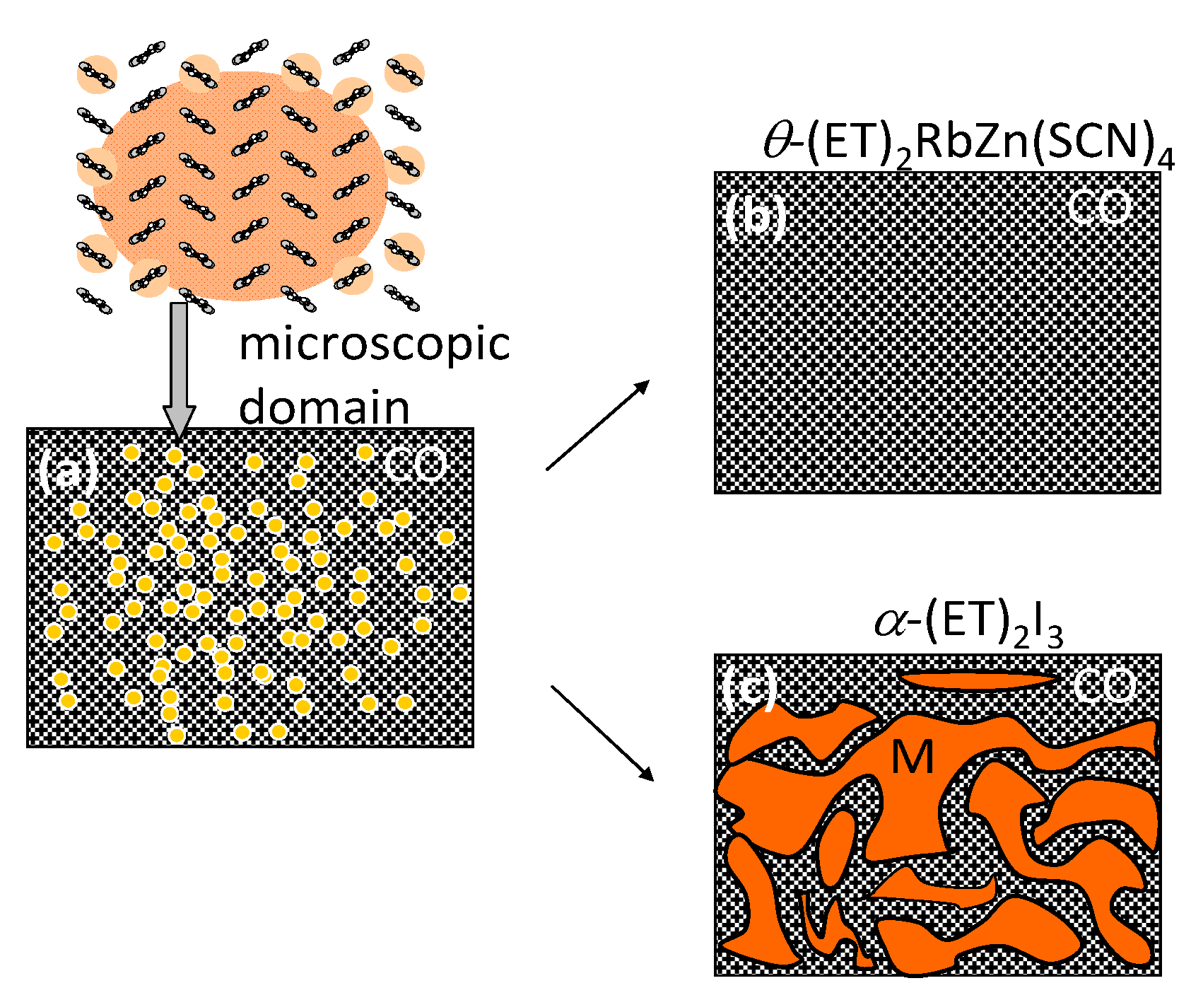
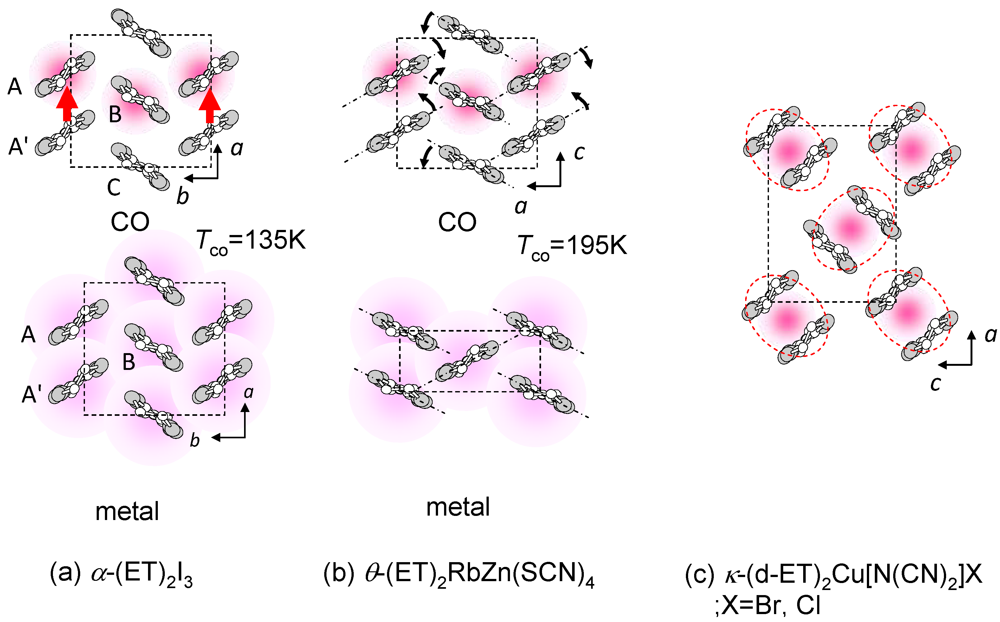
 (-) (metal)]. However, the I–M transition in another CO compound, θ-(ET)2RbZn(SCN)4 (Figure 5b, Tco = 195 K) [23,24,25], shows the large symmetry breaking of the molecular arrangement upon the I–M transition (C2(CO), I222(metal)), which is induced by changes of the intermolecular dihedral angle. An interesting aspect of the CO is ferroelectricity. Our recent results reveal that a CO state in α-(ET)2I3 shows ferroelectricity, which is attributable to the breaking of the inversion symmetry as a result of charge disproportionation, not by a structural deformation [26]. Such ferroelectricity induced by the electronic origin (electronic ferroelectricity [27,28,29]) is advantageous for high speed switching or modulation of dielectric properties.
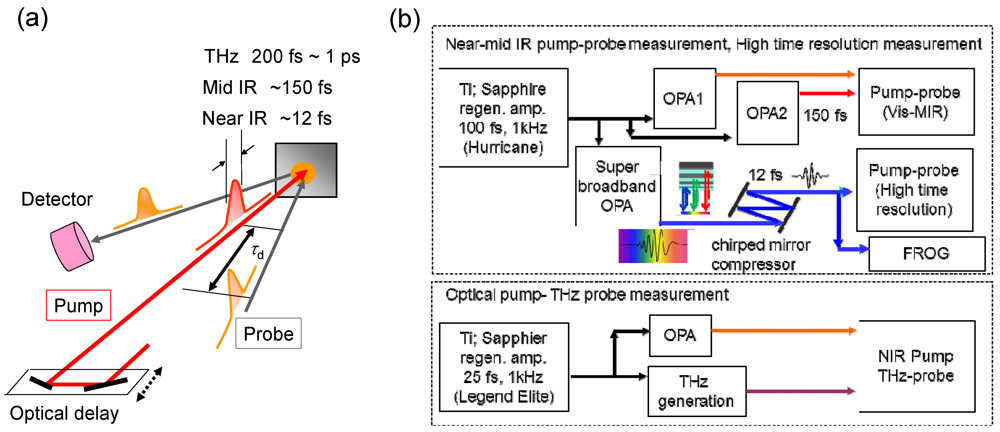
2. Experimental Section
3. Photoinduced Melting of CO and Metallic Domain Formation in α-(ET)2I3 and θ-(ET)2RbZn(SCN)4 [15,36,37,38,39]
3.1. Mid-IR Response Reflecting the Photoinduced I–M Transition [15,36]

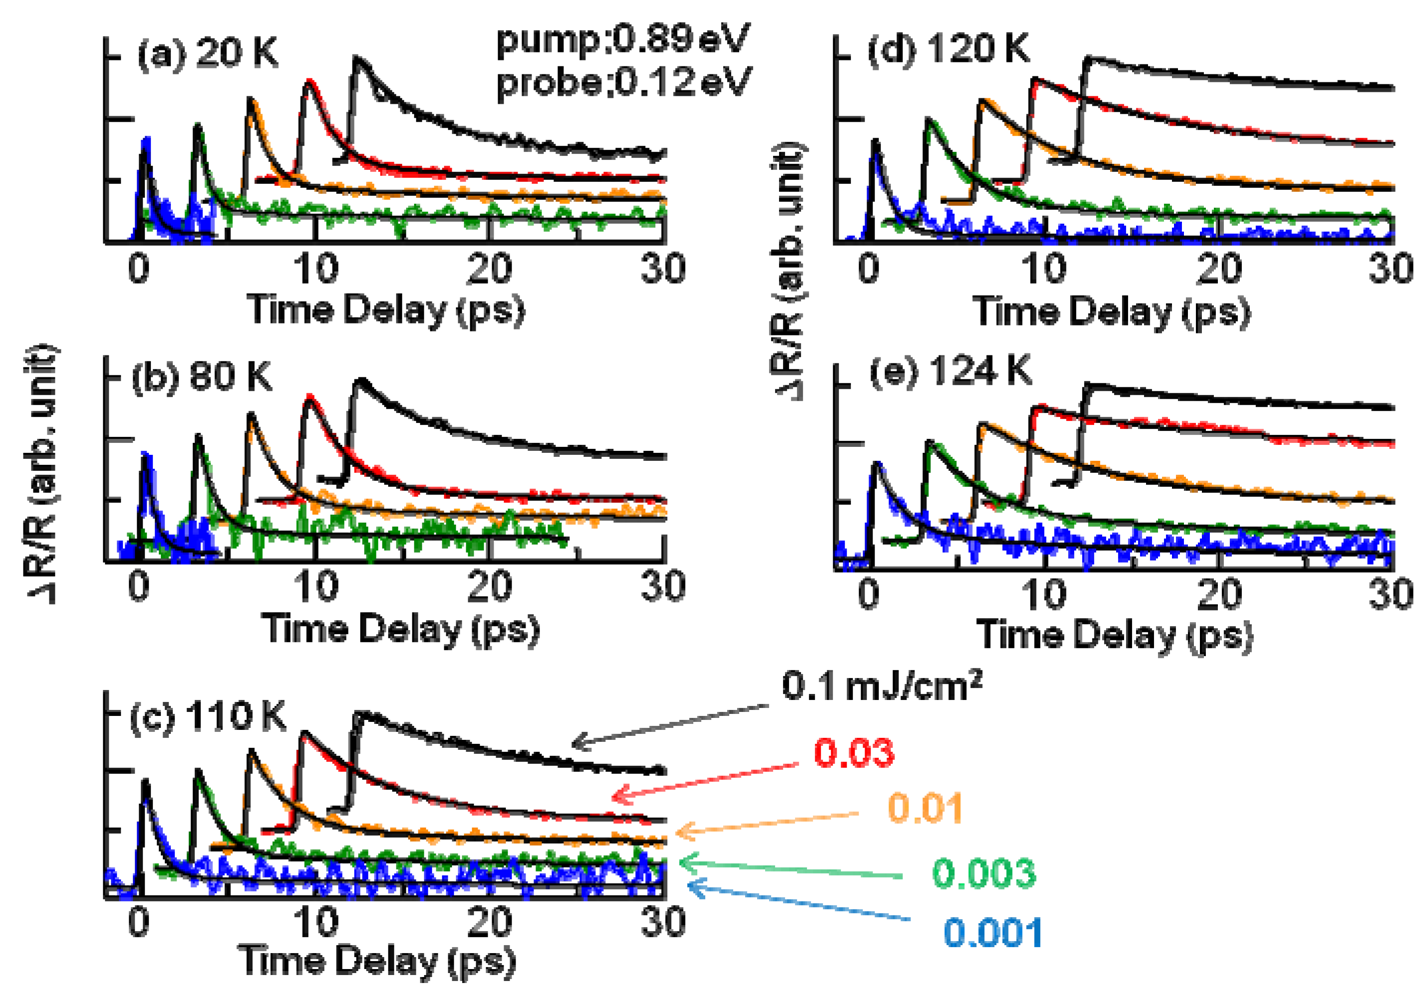
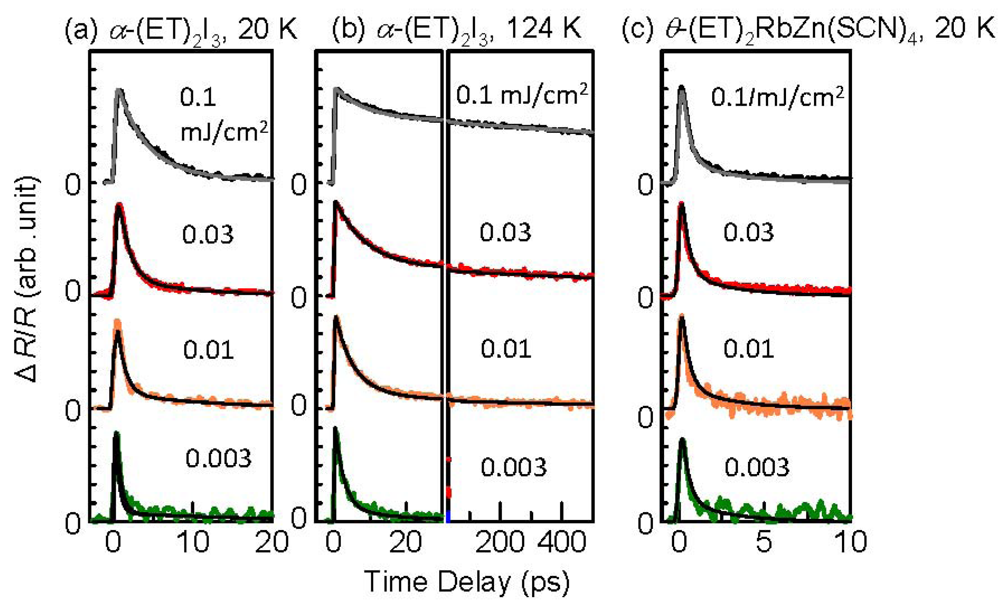
3.2. Recovery Dynamics of the Photoinduced Metallic State

3.3. Thermodynamic Nature of the Photoinduced I–M Transition Critical Slowing Down in α-(ET)2I3. [15,36]
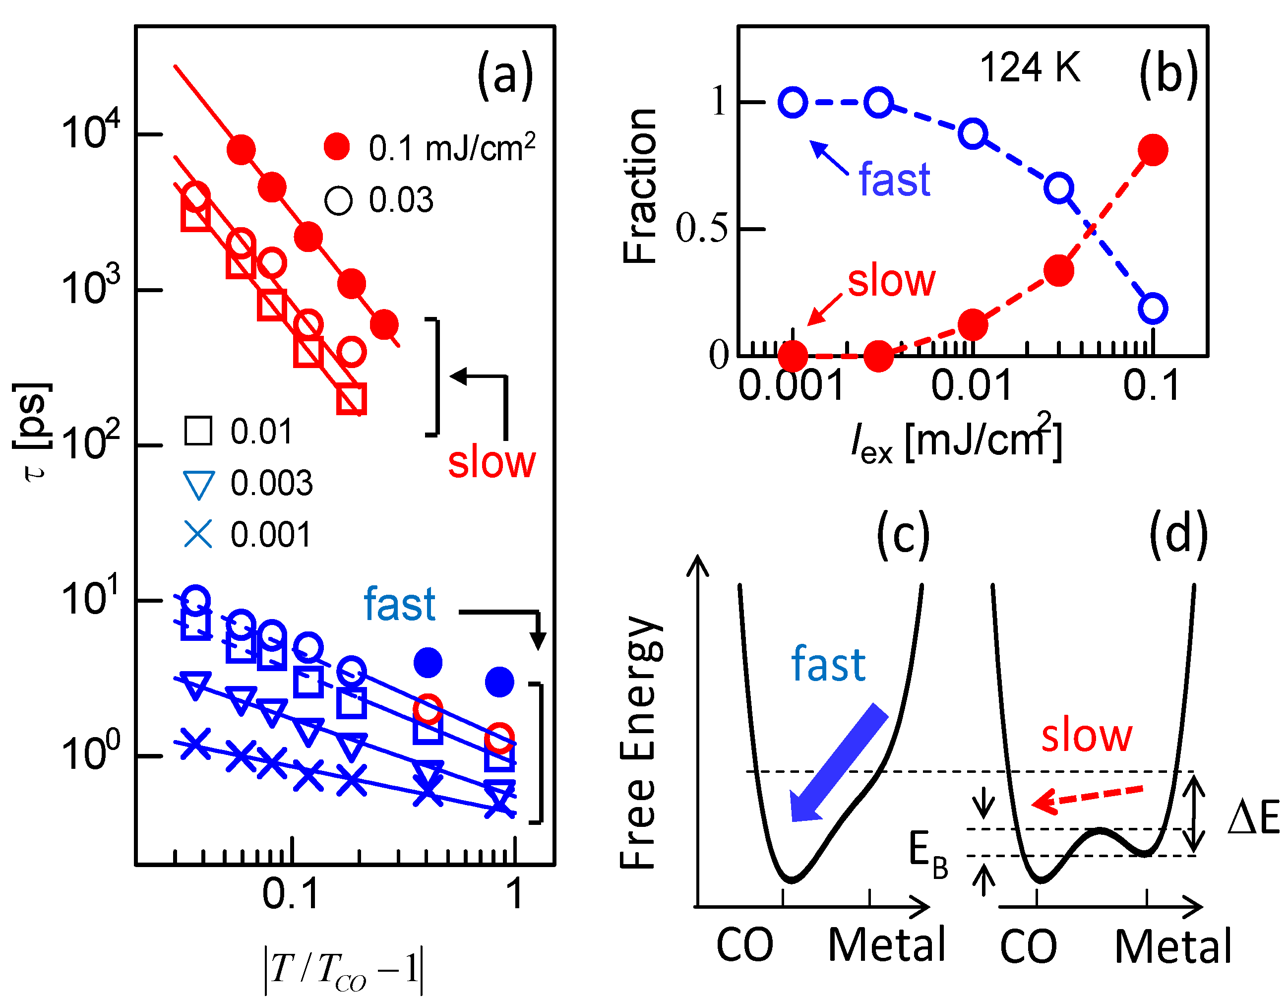
 |T/Tco − 1|−vz, where ν and z respectively signify critical exponents of the correlation length ξ and the dynamic critical exponent. For Iex > 0.01 mJ cm−2, τslow shows νz = 1.8, which is close to the calculated value (=2.1665), as evaluated by Monte Carlo simulation within the framework of the 2-D Ising model [47]. The slow component is therefore attributable to the macroscopic metallic domain. These results underscore that the thermodynamic characteristics of the microscopic domain differ from those of the macroscopic domain.
3.4. THz Spectroscopy of Photoinduced Phase Transition Electronic State of Photoinduced Metallic State [37]
3.5. Ultrafast Snapshot of Correlated Electron Dynamics 10 fs Spectroscopy of Photoinduced Phase Transition [38,41]
 creates an electron with spin σ at site i,
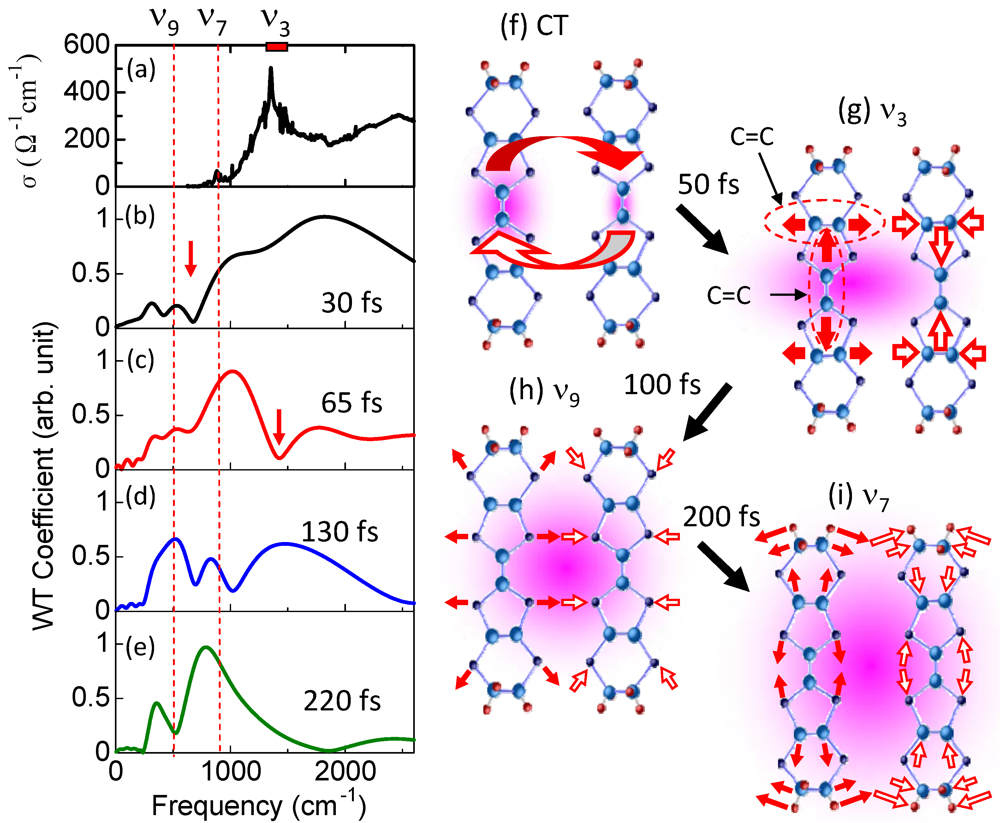
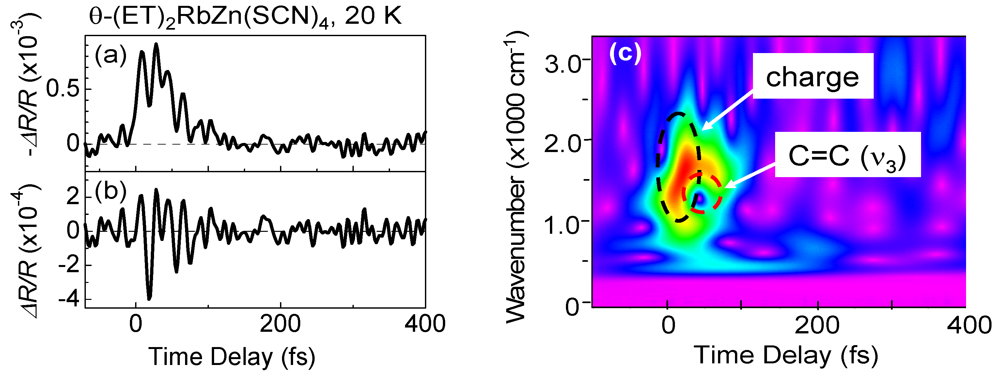
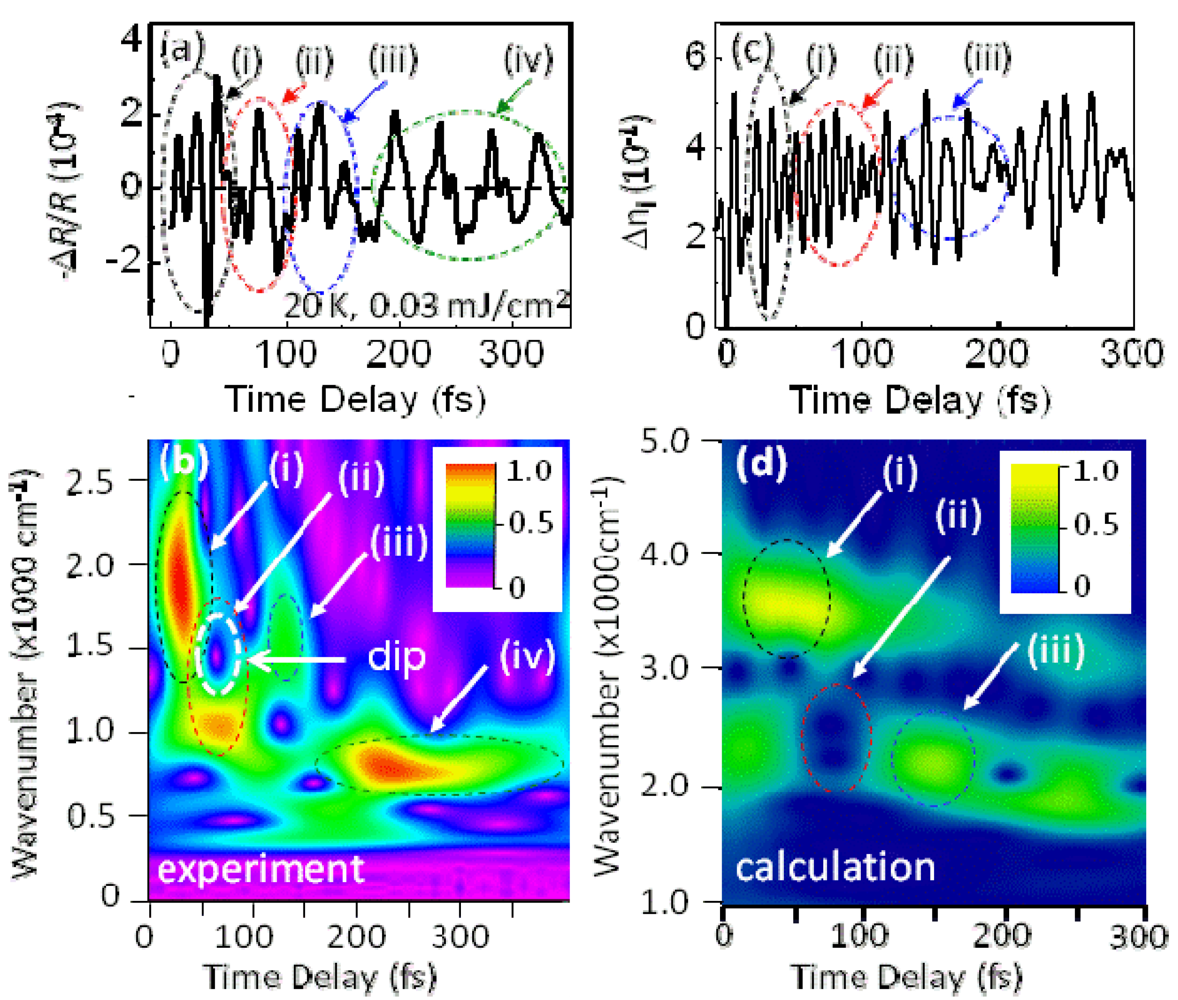
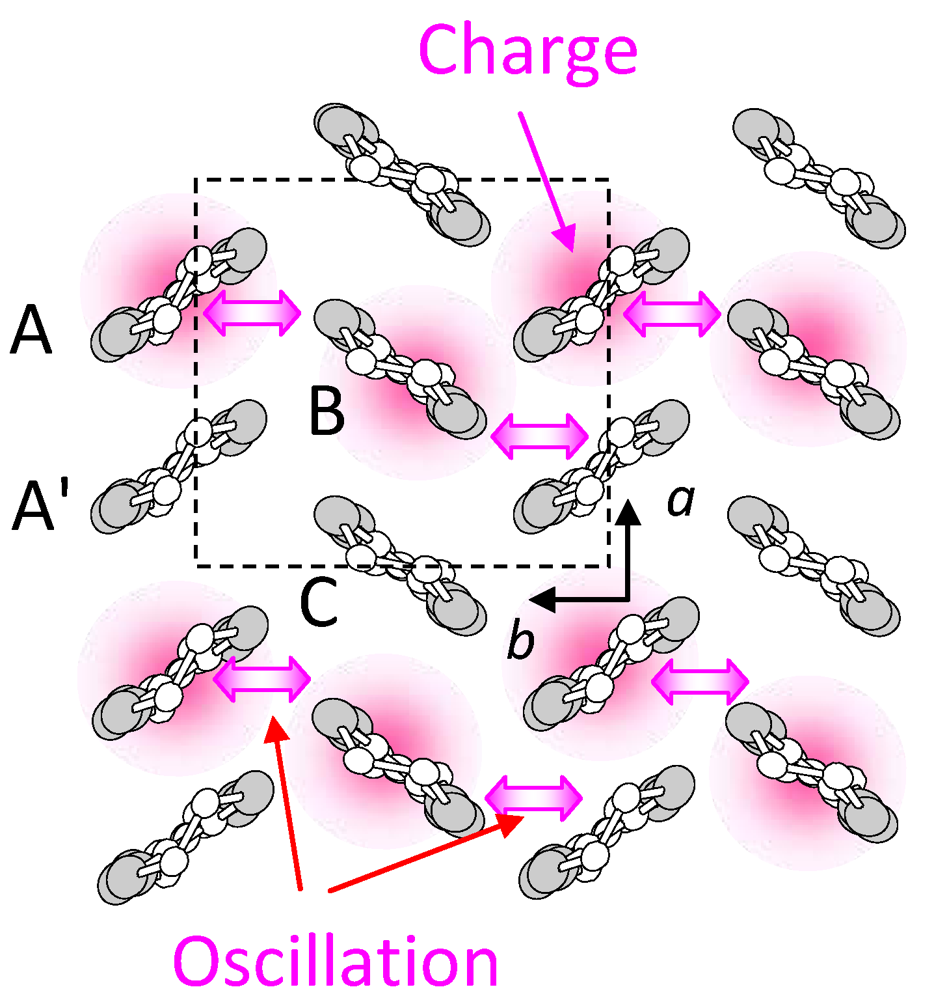
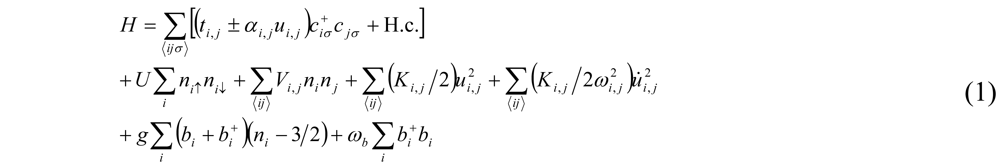
 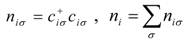 , ui,j denotes the intermolecular phonon’s displacement, bi+ creates a quantum phonon of energy ωb, and g is the EMV coupling strength. The other notation is standard, as introduced in an earlier report [41]. Using an eight-site periodic cluster and the same model parameters as those described in that report (ωb = 0.36 eV, g = 0.0625 eV, and an oscillating electric field along the b-axis having a Gaussian profile of duration 5 fs and center frequency ωb = 0.35 eV), we calculated the time evolution of ni at molecule A (Figure 16) for td < 300 fs (Figure 14c) and conducted WL analysis (Figure 14d). The broad peak from 3000 to 4000 cm-1 at around td = 30 fs corresponds to that of the calculated conductivity spectrum in that earlier report [41], indicating that the peak is attributable to the electron oscillation presented in Figure 16 [(i) in Figure 14c,d]. The difference between the experimental and calculated values of the conductivity peak (experiment, 1000–2000 cm−1; calculation, 3000–4000 cm−1) can be attributed to the small cluster size.

4. Photoinduced I–M Transition in Dimer–Mott Insulator κ-(d-ET)2Cu[N(CN)2]Br [35]
4.1. Bandwidth Control Mott Transition in κ-Type ET Salts

4.2. Mid-Infrared Pump-Probe Spectroscopy of κ-(d-ET)2Cu[N(CN)2]Br (d-Br) and κ-(d-ET)2Cu[N(CN)2]Cl (d-Cl)
4.3. Dynamics of Charge and Lattice in the Dimer–Mott Insulator
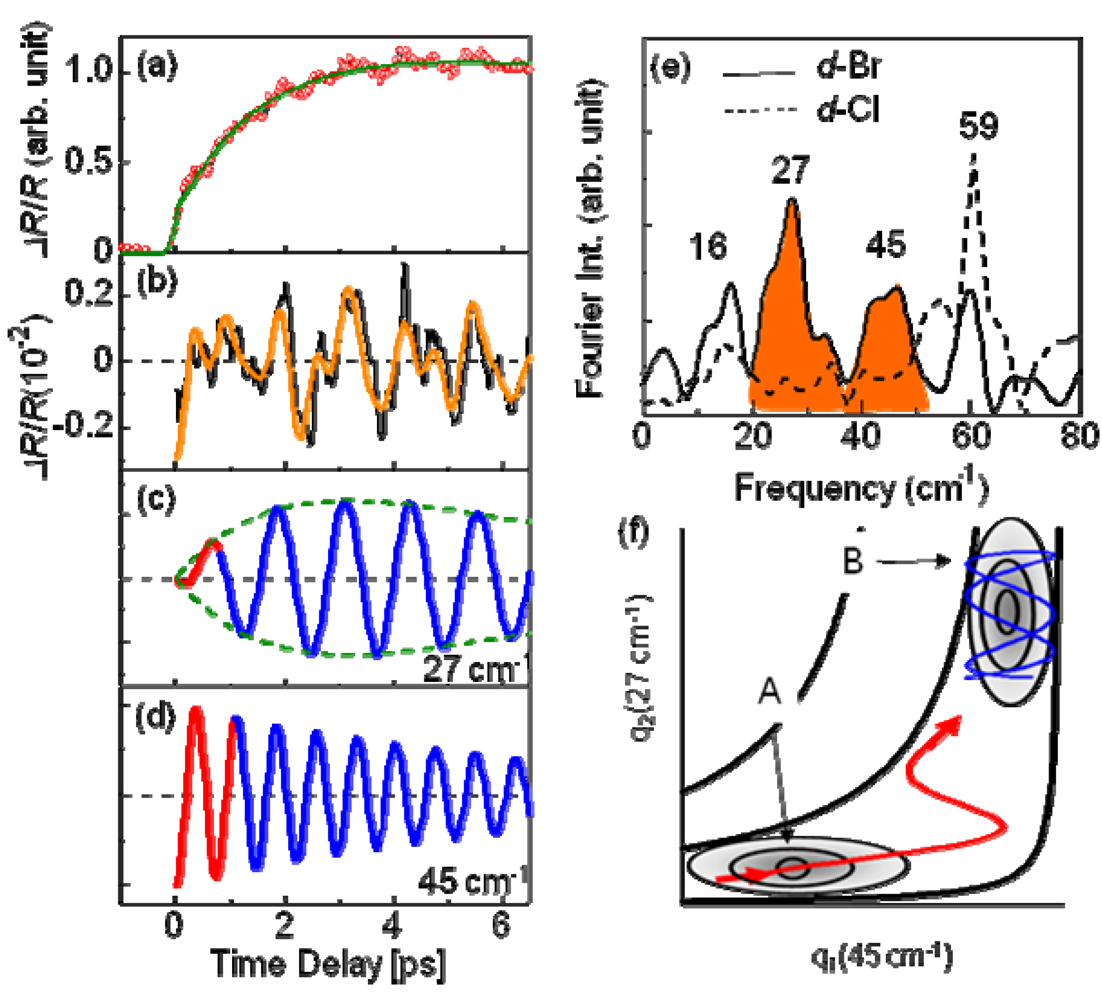
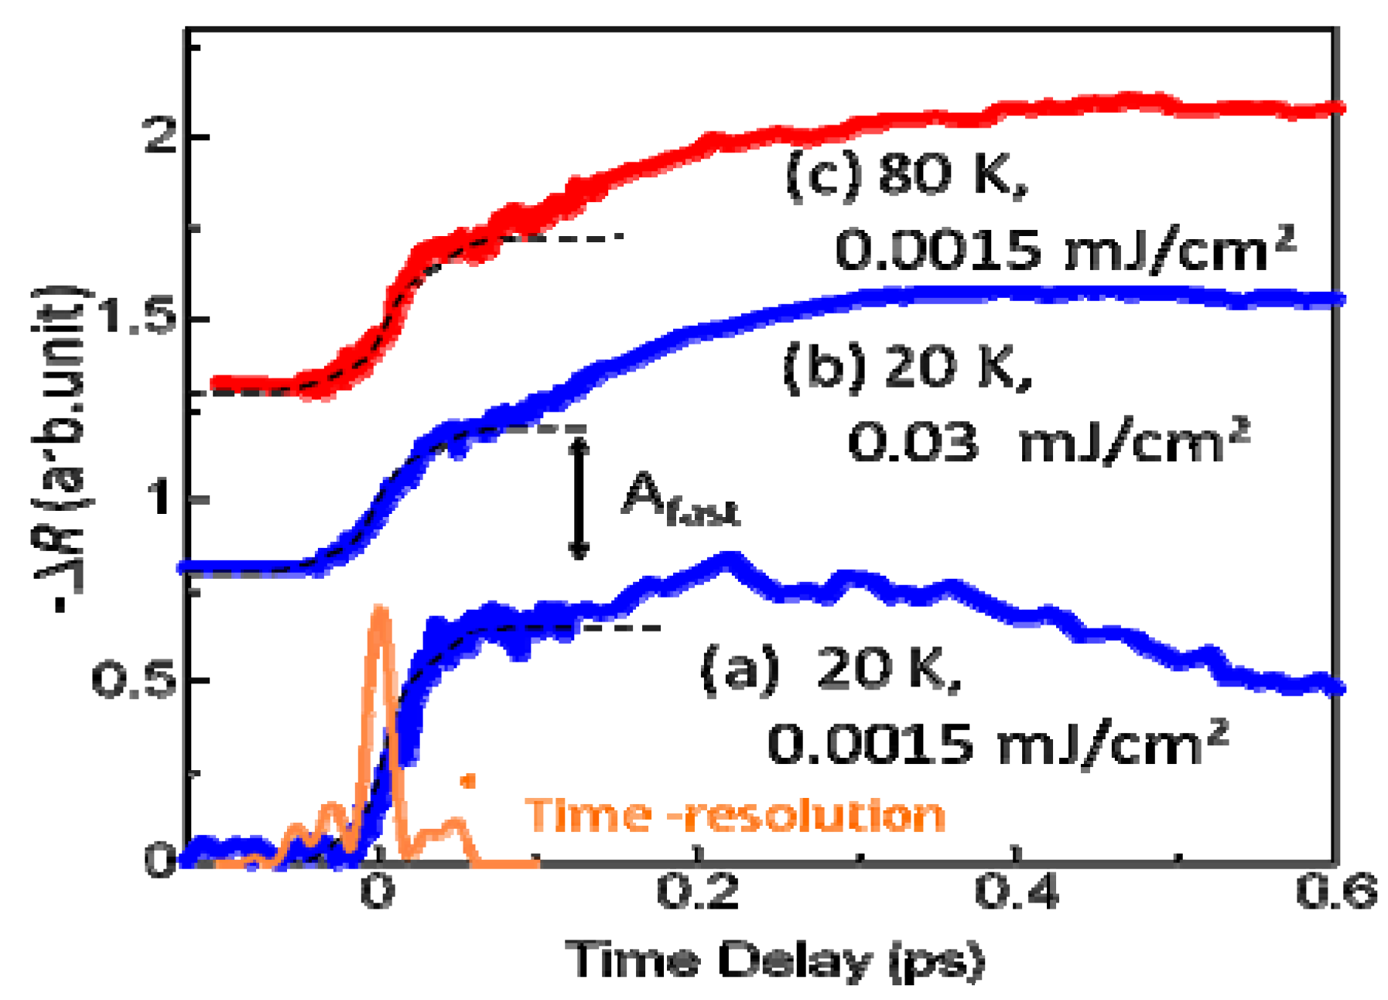
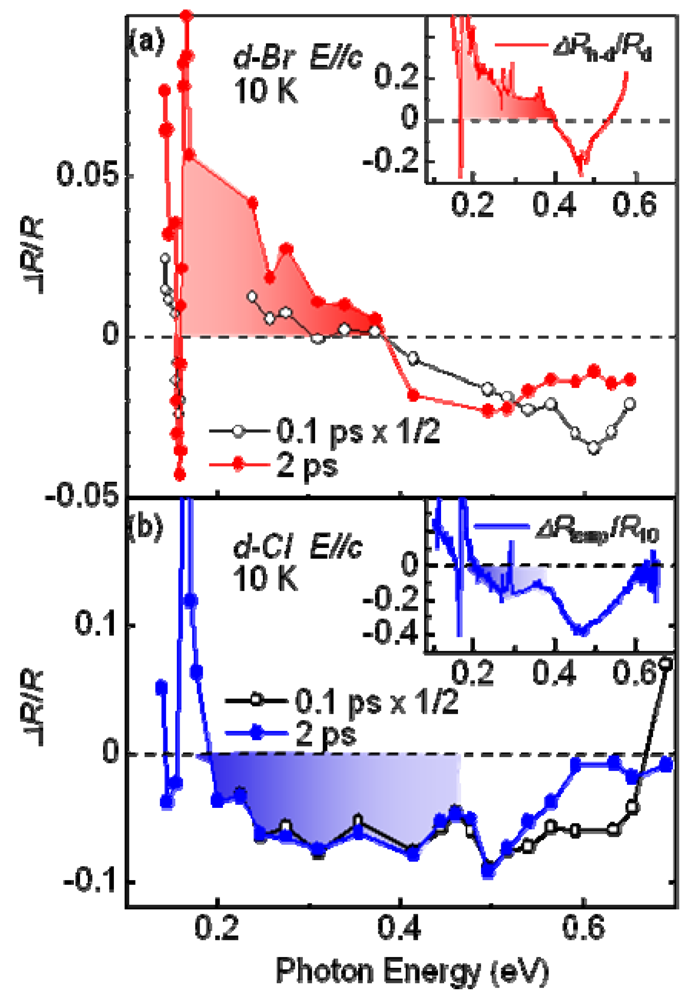
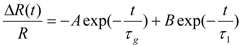 , as shown by the solid green curve, where A = –1.44, τg = 1.1 ps, B = 2.44, and τ1 = 70 ps. It is worth noting that the generation time of the metallic state τg is considerably longer than the timescale (ca. 40 fs) of the inter-site charge transfer, suggesting that the I–M transition occurs because of the intermolecular motion and not the electronic process.
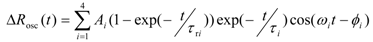 , and the oscillating frequencies ωi (i = 1–4) were estimated as 16, 27, 45, and 59 cm–1. Here, τri, τI, and ϕi respectively present the rise and decay time constant and the initial phase for each oscillation. Actually, ϕi is smaller than 0.1 π, indicating a cosine-like oscillation, which is detected in the photoinduced phase transition, and is attributable to the displacive excitation of the coherent phonon in the photoexcited state or the photoinduced metallic state [53], and not in the ground state. Among these oscillations, the 27 cm–1 and 45 cm–1 modes are not detected in d-Cl, as shown by the dashed curve in Figure 20e. Accordingly, these two modes are related to the PIMT. It is worth noting that the 27 cm–1 mode shows a finite rise time of τr2 = 1 ps (Figure 20c), which is identical to the timescale of metallization tg, whereas the 45 cm−1 mode appears instantaneously (Figure 20d). Therefore, as shown by the classical trajectories in the q1(45 cm–1)–q2(27 cm–1) potential surface (Figure 20f), the 45 cm–1 mode phonon is regarded as induced along the q1 axes (red curve) immediately after generation in the photoexcited insulator state (A). Then, the 27 cm–1 mode oscillates along the q2 axis (blue curve) in the metallic state (B). Observation of the 27 cm–1 mode in the Raman spectrum of metallic h-Br [54] supports the consideration presented above. Possible candidates for such coherent low-frequency phonons are intradimer molecular motions that effectively modulate the tdimer, i.e., the intradimer molecular displacements such as stretching and libration, which are triggered by bonding to the anti-bonding excitation, causing a decrease in tdimer and Udimer/2; this results in metallization.
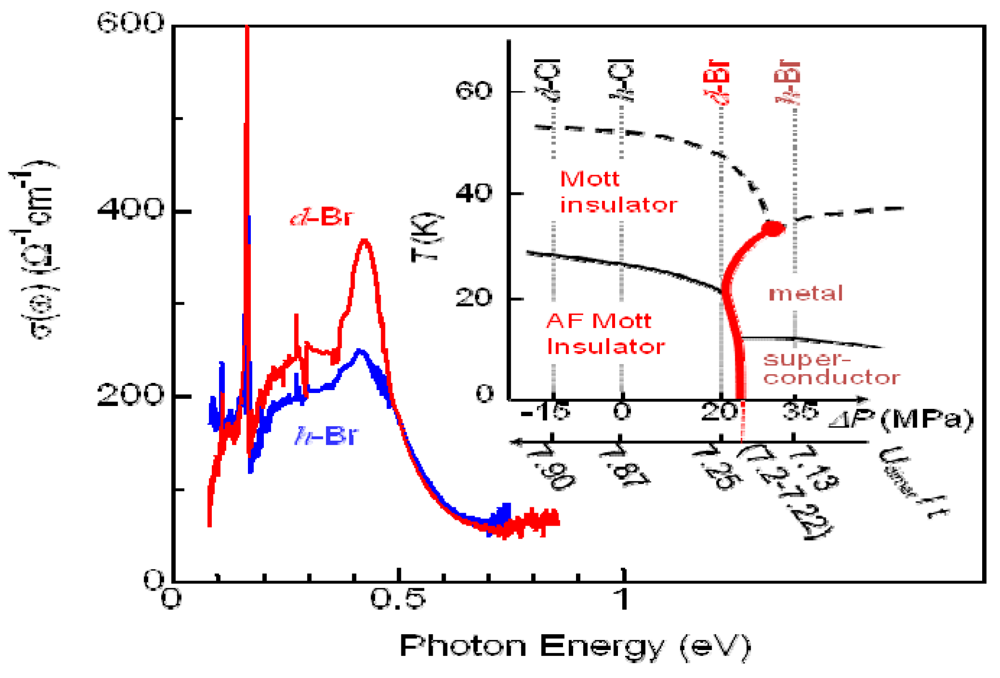
 , where tp and tq are anisotropic interdimer transfer integrals calculated using the extended Huckel method with structural data [55,56], although a more precise formula for Udimer is presented [57,58]. In the past, Udimer/t for the phase boundary was also estimated from precise studies of the phase diagram of κ-[(h-ET)1−x(d-ET)x]2Cu[N(CN)2]Br [31]. Considering that Udimer/t values for d-Br and the I–M boundary are calculated as 7.25 and 7.2–7.22, respectively, as presented in Figure 18, observation of the PIMT reveals that the change of Udimer/t upon PIMT is approximately 0.4–0.7%. Therefore, ΔUdimer is estimated as approximately 0.4%–0.7% because the photoinduced change in Udimer/t is mainly attributable to the ΔUdimer. Such a small change of Udimer is indicative of small molecular displacements. If we simply assume that the intradimer relative molecular distances are changed for reducing tdimer to ca. Udimer/2, then the magnitude of the displacement is as small as 0.05% of the molecular distance in the dimer. Furthermore, Udimer/t for d-Cl is 7.87. Therefore, ΔUdimer must be greater than 9% to induce the PIMT. A very large displacement of 0.5% is necessary to obtain such a large ΔUdimer value, which might be the reason why the PIMT is not detected in d-Cl. These results and discussion demonstrate the optical modulation of Udimer and the resultant PIMT in the DM insulator κ-(d-ET)2Cu[N(CN)2]Br. Under intradimer excitation, the PIMT is driven by the intradimer molecular displacements, which decrease Udimer by approximately 0.4%–0.7%. Moreover, the mechanism of the PIMT strongly depends on the excitation photon energy [39], i.e., the excitation of the Hubbard band (~0.3 eV) shows FC type I–M transition. That was also analyzed theoretically [57,58].
 4.4. Slower Dynamics of the Photoinduced Metallic State
5. Summary
Acknowledgments
References
- Mott, N.F. Metal–Insulator Transitions, 2nd ed; Taylor & Francis: New York, NY, USA, 1990. [Google Scholar]
- Imada, M.; Fujimori, A.; Tokura, Y. Metal-insulatortransitions. Rev. Mod. Phys. 1998, 70, 1039–1263. [Google Scholar] [CrossRef]
- Batail, P. Molecular conductors. Chem. Rev. 2004, 104, 4887–4890. [Google Scholar] [CrossRef]
- Kagoshima, S.; Kanoda, K.; Mori, T. Special topic on organic conductors. J. Phys. Soc. Jpn. 2006, 75, 051001–051016. [Google Scholar] [CrossRef]
- Gonokami, M.; Koshihara, S. Special topic on photoinduced phase transition and their dynamics. J. Phys. Soc. Jpn. 2006, 75, 011001–051005. [Google Scholar] [CrossRef]
- Yonemitsu, K.; Nasu, K. Theory of photoinduced phase transitions in itinerant electron systems. Phys. Rep. 2008, 465, 1–60. [Google Scholar] [CrossRef]
- Basov, D.N.; Averitt, R.D.; van der Marel, D.; Martin, D.; Hauel, K. Electrodynamics of correlated electron materials. Rev. Mod. Phys. 2011, 83, 471–541. [Google Scholar] [CrossRef]
- Miyano, K.; Tanaka, T.; Tomioka, Y.; Tokura, Y. Photoinduced insulator-to-metal transition in a perovskitemanganite. Phys. Rev. Lett. 1997, 78, 4257–4260. [Google Scholar]
- Cavalleri, A.; Toth, Cs.; Siders, C.W.; Squir, J.A.; Raksi, F.; Forget, P.; Kieffer, J.C.V. Femtosecond structural dynamics in VO2 during an ultrafast solid-solid phase transition. Phys. Rev. Lett. 2001, 87. [Google Scholar]
- Iwai, S.; Ono, M.; Maeda, A.; Matsuzaki, H.; Kishida, H.; Okamoto, H.; Tokura, Y. Ultrafast optical switching to a metallic state by photoinduced mott transition in a halogen-bridged nickel-chain compound. Phys. Rev. Lett. 2003, 91, 057401:1–057401:4. [Google Scholar]
- Perfetti, L.; Loukakos, P.A.; Lisowski, M.; Bovensiepen, U.; Berger, H.; Biermann, S.; Cornaglia, P.S.; Georges, A.; Wolf, M. Time evolution of the electronic structure of 1T-TaS2 through the insulator-metal transition. Phys. Rev. Lett. 2006, 97, 067402:1–067402:4. [Google Scholar]
- Polli, D.; Rini, M.; Wall, S.; Schoenlein, R.W.; Tomioka, Y.; Tokura, Y.; Cerullo, G.; Cavalleri, A. Coherent orbital waves in the photo-induced insulator-metal dynamics of a magnetoresistive manganite. Nature Mat. 2007, 6, 643–647. [Google Scholar]
- Chollet, M.; Guerien, L.; Uchida, N.; Fukaya, S.; Shimoda, H.; Ishikawa, T.; Matsuda, K.; Hasegawa, T.; Ota, A.; Yamochi, H.; et al. Gigantic photoresponse in ¼-filled-band organic salt (EDO-TTF)2PF6. Science 2005, 7, 86–89. [Google Scholar]
- Tajima, N.; Fujisawa, J.; Naka, N.; Ishihara, T.; Kato, R.; Nishio, Y.; Kajita, K. Photo-induced insulator-metal transition in an organic conductor α-(BEDT-TTF)2I3. J. Phys. Soc. Jpn. 2005, 74, 511–514. [Google Scholar]
- Iwai, S.; Yamamoto, K.; Kashiwazaki, A.; Hiramatsu, F.; Nakaya, H.; Kawakami, Y.; Yakushi, K.; Okamoto, H.; Mori, H.; Nishio, Y. Photoinduced melting of a stripe-type charge-order and metallic domain formation in a layered BEDT-TTF-based organic salt. Phys. Rev. Lett. 2007, 98, 097402:1–097402:4. [Google Scholar]
- Okamoto, H.; Matsuzaki, H.; Wakabayashi, T.; Takahashi, Y.; Hasegawa, T. Photoinduced metallic state mediated by spin-charge separation in a one-dimensional organic Mott insulator. Phys. Rev. Lett. 2006, 98, 037401:1–037401:4. [Google Scholar]
- Bender, K.; Henning, I.; Schweitzer, D.; Dietz, K.; Endre, H.; Keller, H.J. Synthesis, structure and physical properties of a two-dimensional organic metal, Di[bis(ethylenedithiolo)tetrathiofulvalene] triiodide, (BEDT-TTF)+2 I−3. Mol. Cryst. Liq. Cryst. 1984, 108, 359–371. [Google Scholar] [CrossRef]
- Kakiuchi, T.; Wakabayashi, Y.; Sawa, H.; Takahashi, T.; Nakamura, T. Charge ordering in α-(BEDT-TTF)2I3 by synchrotron X-ray diffraction. J. Phys. Soc. Jpn. 2007, 76, 113702:1–113702:4. [Google Scholar]
- Tanaka, Y.; Yonemitsu, K. Charge order with structural distortion in organic conductors: Comparison between θ-(ET)2RbZn(SCN)4 and α-(ET)2I3. J. Phys. Soc. Jpn. 2008, 77. [Google Scholar]
- Ivek, T.; Korin-Hamzic, B.; Milat, O.; Tomic, S.; Clauss, C.; Drichiko, N.; Schweitzer, D.; Dressel, M. Collective excitations in the charge-ordered phase of α-(BEDT-TTF)2I3. Phys. Rev. Lett. 2010, 104, 206406:1–206406:4. [Google Scholar]
- Ivek, T.; Korin-Hamzic, B.; Milat, O.; Tomic, S.; Clauss, C.; Drichiko, N.; Schweitzer, D.; Dressel, M. Electrodynamic response of the charge ordering phase: Dielectric and optical studies of α-(BEDT-TTF)2I3. Phys. Rev. B 2011, 83, 165128:1–165128:13. [Google Scholar]
- Girlando, A. Chrage sensitive vibrations and electron-molecular vibration coupling in Bis(ethylenedithio)-tetrathiafulvalene(BEDT-TTF). J. Phys. Chem. C 2011, 115, 19371–19378. [Google Scholar] [CrossRef]
- Mori, H.; Tanaka, S.; Mori, T. Systematic study of the electronic state in theta-type BEDT-TTF organic conductors by changing the electronic correlation. Phys. Rev. B 1998, 57, 12023–12029. [Google Scholar]
- Watanabe, M.; Noda, Y.; Nogami, Y.; Mori, H. Transfer integrals and the spatial pattern of charge ordering in θ-(BEDT-TTF)2RbZn(SCN)4 at 90 K. J. Phys. Soc. Jpn. 2004, 73, 116–122. [Google Scholar] [CrossRef]
- Miyashita, S.; Yonemitsu, K. Charge ordering in θ-(BEDT-TTF)2RbZn(SCN)4: Cooperative effects of electron correlations and lattice distortions. Phys. Rev. B 2007, 75, 245112. [Google Scholar] [CrossRef]
- Yamamoto, K.; Iwai, S.; Boyko, S.; Kashiwazaki, A.; Hiramatsu, F.; Okabe, C.; Nishi, N.; Yakushi, K. Strong optical nonlinearity and its ultrafast response associated with electron ferroelectricity in an organic conductor. J. Phys. Soc. Jpn. 2008, 77, 74709:1–74709:6. [Google Scholar]
- Monceu, P.; Nad, F.Y.; Brazovskii, S. Ferroelectric Mott-hubbard phase of organic (TMTTF)2X conductors. Phys. Rev. Lett. 2001, 86, 4080–4083. [Google Scholar] [CrossRef]
- van der Brink, J.; Khomskii, D.I. Multiferroicity due to charge ordering. J. Phys.: Condens. Matter. 2008, 20. [Google Scholar]
- Ishihara, S. Electronic ferroelectricity and frustration. J. Phys. Soc. Jpn. 2010, 9, 011010:1–011010:4. [Google Scholar]
- Kanoda, K. Metal-insulator transition in κ-(ET)2X and (DCNQI)2M: Two contrasting manifestation of electron correlation. J. Phys. Soc. Jpn. 2006, 75. [Google Scholar]
- Yoneyama, N.; Sasaki, T.; Kobayashi, T. Substitution effect by deuterated donors on superconductivity in κ-(BEDT-TTF)2Cu[N(CN)2]Br. J. Phys. Soc. Jpn. 2004, 73, 1434–1437. [Google Scholar] [CrossRef]
- Kagawa, F.; Miyagawa, K.; Kanoda, K. Unconventional critical behaviour in a quasi-two-dimensional organic conductor. Nature 2005, 436, 534–537. [Google Scholar]
- de Souza, M.; Bruhl, A.; Strack, C.H.; Wolf, B.; Scweitzer, D.; Lang, M. Anomalous lattice response at the Mott transition in a quasi-2D organic conductor. Phys. Rev. Lett. 2007, 99, 037003:1–037003:4. [Google Scholar]
- Faltermeier, D.; Barz, J.; Dumm, M.; Dressel, M.; Drichko, N.; Petrov, B.; Semkin, V.; Vlasova, R.; Meźière, C.; Batail, P. Bandwidth-controlled Mott transition in κ-(BEDT-TTF)2Cu[N(CN)2]BrxCl1−x: optical studies of localized charge excitations. Phys. Rev. B 2007, 76, 165113:1–165113:12. [Google Scholar]
- Dumm, M.; Faltermeier, D.; Drichko, N.; Dressel, M. Bandwidth-controlled Mott transition in ê-(BEDT-TTF)2Cu[N(CN)2]BrxCl1−x: Optical studies of correlated carriers. Phys. Rev. B. 2009, 79, 195106:1–195106:11. [Google Scholar]
- Iwai, S.; Yamamoto, K.; Hiramatsu, F.; Nakaya, H.; Kawakami, Y.; Yakushi, K. Hydrostatic pressure effect on photoinduced insulator-to-metal transition in the layered organic salt α-(BEDT-TTF)2I3. Phys. Rev. B 2008, 77, 125131:1–125131:5. [Google Scholar]
- Nakaya, H.; Itoh, K.; Takahashi, Y.; Itoh, H.; Iwai, S.; Saito, A.; Yamamoto, K.; Yakushi, K. Terahertz responses of the high-temperature metallic phase and photoinduced metallic state in the ferroelectric charge-ordered organic salt α-(ET)2I3. Phys. Rev. B 2010, 81, 155111:1–155111:6. [Google Scholar]
- Kawakami, Y.; Fukatsu, T.; Sakurai, Y.; Unno, H.; Itoh, H.; Iwai, S.; Sasaki, T.; Yamamoto, K.; Yakushi, K.; Yonemitsu, K. Early-stage dynamics of light-matter interaction leading to the insulator-to-metal transition in a charge ordered organic crystal. Phys. Rev. Lett. 2010, 105, 246402:1–246402:4. [Google Scholar]
- Kawakami, Y.; Iwai, S.; Fukatsu, T.; Yoneyama, N.; Sasaki, T.; Kobayashi, N. Optical modulation of effective on-site coulomb energy for the mott transition in an organic dimer insulator. Phys. Rev. Lett. 2009, 103, 066403:1–066403:4. [Google Scholar]
- Brida, D.; Cirmi, G.; Manzone, C.; Bonora, S.; Villoresi, P.; de Silvestri, S.; Cerullo, G. Sub-two-cycle light pulses at 1.6 μm from an optical parametric amplifier. Opt. Lett. 2008, 33, 741–743. [Google Scholar]
- Miyashita, S.; Tanaka, Y.; Iwai, S.; Yonemitsu, K. Charge, lattice, and spin dynamics in photoinduced phase transitions from charge-ordered insulator to metal in quasi-two-dimensional organic conductors. J. Phys. Soc. Jpn. 2010, 79. [Google Scholar]
- Tanaka, Y.; Yonemitsu, K. Growth dynamics of photoinduced domains in two-dimensional charge-ordered conductors depending on stabilization mechanisms. J. Phys. Soc. Jpn. 2010, 79, 024712:1–024712:8. [Google Scholar]
- Gomi, H.; Takahashi, A.; Tastumi, T.; Kobayashi, S.; Miyamoto, K.; Lee, J.D.; Aihara, M.J. Photogenerated metallic states in charge-ordered insulators in (BEDT-TTF)2X. Phys. Soc. Jpn. 2011, 80, 034709:1–034709:10. [Google Scholar]
- Hohenberg, P.C.; Halperin, B.I. Theory of dynamic critical phenomena. Rev. Mod. Phys. 1977, 49, 435–479. [Google Scholar] [CrossRef]
- Kise, T.; Ogasawara, T.; Ashida, M.; Tomioka, Y.; Tokura, Y.; Kuwata-Gonokami, M. Ultrafast spin dynamics and critical behavior in half-metallic ferromagnet: Sr2FeMoO6. Phys. Rev. Lett. 2000, 85, 1986–1989. [Google Scholar] [CrossRef]
- Liu, X.J.; Moritomo, Y.; Nakamura, A.; Tanaka, H.; Kawai, T. Critical behavior of a photodisordered spin system in doped manganite. Phys. Rev. B 2001, 64, 100401R:1–100401R:4. [Google Scholar]
- Nightingale, M.P.; Blote, H.W. Dynamic exponent of the two-dimensional ising model and montecarlo computation of the subdominant eigenvalue of the stochastic matrix. J. Phys. Rev. lett. 1996, 76, 4548–4551. [Google Scholar] [CrossRef]
- Wall, S.; Brida, D.; Clark, S.R.; Ehrke, H.P.; Jaksch, D.; Ardavan, A.; Bonora, S.; Uemura, H.; Takahashi, Y.; Hasegawa, T.; et al. Quantum interference between charge excitation paths in a solid-state Mott insulator. Nat. Phys. 2011, 7, 114–118. [Google Scholar] [CrossRef]
- Yue, Y.; Yamamoto, K.; Uruichi, M.; Nakano, C.; Yakaushi, K.; Yamada, S.; Hiejima, T.; Kawamoto, A. Nonuniform site-charge distribution and fluctuations of charge order in the metallic state of α-(BEDT-TTF)2I3. Phys. Rev. B 2010, 82, 075134:1–075134:8. [Google Scholar]
- Yamamoto, K.; Kowalska, A.A.; Yue, Y.; Yakushi, K. Vibronic activation of molecular vibrational overtones in the infrared spectra of charge-ordered organic conductors. Phys. Rev B 2011, 84, 064306:1–064306:13. [Google Scholar]
- Kozlov, M.E.; Pokhodina, K.I.; Yurchenko, A.A. Electron molecular vibration coupling in vibrational spectra of BEDT-TTF based radical cation salts. SpectrochmicaActa. 1989, 45, 437–444. [Google Scholar]
- Hase, M.; Kitajima, M.; Constantinescu, A.M.; Petek, H. The birth of a quasiparticle in silicon observed in time-requency space. Nature 2003, 426, 51–54. [Google Scholar]
- Zeiger, H.J.; Vidal, J.; Cheng, T.K.; Ippen, E.P.; Dresselhaus, G.; Dresselhaus, M.S. Theory for displacive excitation of coherent phonons. Phys. Rev. B 1992, 45, 768–778. [Google Scholar]
- Sekine, T.; Ohmamiuda, A.; Tanokura, Y.; Saito, G.; Ikeda, K.; Nakamura, T.; Takahashi, T. Low-frequency Raman spectra in κ-(BEDT-TTF)2Cu(NCS)2 and κ-(BEDT-TTF)2Cu[N(CN)2]Br. Synth. Met. 1995, 70, 981–982. [Google Scholar] [CrossRef]
- Watanabe, M. Low temperature structure and insulating phase of 2-dimensional organic conductors with 3/4 filled band. Available online: http://ousar.lib.okayama-u.ac.jp/file/8246/20111122120654/K001886_honbun.pdf (accessed on 22 December 2011). Ph.D. Thesis, Okayama University, March 1999..
- Mori, T.; Kobayashi, A.; Sasaki, Y.; Kobayashi, H.; Saito, G.; Inokuchi, H. The Intermolecular interaction of tetrathiafulvalene and bis(ethylenedithio)-tetrathiafulvalene in organic metals. calculation of orbital overlaps and models of energy-band structures. Bull. Chem. Soc. Jpn. 1984, 57, 627–633. [Google Scholar] [CrossRef]
- Yonemitsu, K.; Miyashita, S.; Maeshima, N. Phoexcitation-energy dependent transient pathways from a dimer Mott insulator to a metal. J. Phys. Soc. Jpn. 2011, 80, 084710:1–084710:5. [Google Scholar]
- Tatsumi, T.; Gomi, H.; Takahashi, A.; Hirao, Y.; Aihara, M. Photoexcited states in dimer Mott insulators κ -(BEDT-TTF)2X. J. Phys. Soc. Jpn. 2012, 81, 034712:1–034712:12. [Google Scholar]
- Iwai, S.; Tanaka, S.; Fujinuma, K.; Kishida, H.; Okamoto, H.; Tokura, Y. Ultrafast optical switching from an ionic to a neutral state in tetrathiafulvalene-p-Chloranil(TTf-CA) observed in femtosecond reflection spectroscopy. Phys. Rev. Lett. 2002, 88, 057402:1–057402:4. [Google Scholar]
- Sasaki, T.; Yoneyama, N.; Kobayashi, N.; Ikemoto, Y.; Kimura, H. Imaging phase separation near the Mott boundary of the correlated organic superconductors κ-(BEDT-TTF)2X. Phys. Rev. Lett. 2004, 92, 227001:1–227001:4. [Google Scholar]
- Onda, K.; Ogihara, S.; Yonemitsu, K.; Maeshima, N.; Ishikawa, T.; Okimoto, Y.; Shao, X.; Nakano, Y.; Yamochi, H.; Saito, G.; et al. Photoinduced change in the charge order pattern in the quarter-filled organic conductor (EDO-TTF)2PF6 with a strong electron-phonon interaction. Phys. Rev. Lett. 2009, 103, 027402:1–027402:4. [Google Scholar]
© 2012 by the authors; licensee MDPI, Basel, Switzerland. This article is an open-access article distributed under the terms and conditions of the Creative Commons Attribution license (http://creativecommons.org/licenses/by/3.0/).
Share and Cite
Iwai, S. Photoinduced Phase Transitions in α-, θ-, and κ-type ET Salts: Ultrafast Melting of the Electronic Ordering. Crystals 2012, 2, 590-617. https://doi.org/10.3390/cryst2020590
Iwai S. Photoinduced Phase Transitions in α-, θ-, and κ-type ET Salts: Ultrafast Melting of the Electronic Ordering. Crystals. 2012; 2(2):590-617. https://doi.org/10.3390/cryst2020590
Chicago/Turabian StyleIwai, Shinichiro. 2012. "Photoinduced Phase Transitions in α-, θ-, and κ-type ET Salts: Ultrafast Melting of the Electronic Ordering" Crystals 2, no. 2: 590-617. https://doi.org/10.3390/cryst2020590
APA StyleIwai, S. (2012). Photoinduced Phase Transitions in α-, θ-, and κ-type ET Salts: Ultrafast Melting of the Electronic Ordering. Crystals, 2(2), 590-617. https://doi.org/10.3390/cryst2020590