1. Introduction
Colloidal semiconductor nanocrystals (or quantum dots, QDs) have attracted prominent attention in the last three decades since their physical and chemical properties, which can be tuned in size and morphology by controlling the synthesis, differ from those of their corresponding bulk materials [
1]. These properties render semiconductor nanocrystals suitable for numerous applications such as solar cell materials [
2], optical sensors, [
3] and bio-imaging [
4]. Particularly interesting for biomedical applications, are the nanocrystals prepared in aqueous media [
5,
6,
7].
The success of the preparation methods and thus the achievement of the designed properties, rely on the ability to prevent new nucleation events immediately after the crystal growth has begun and to control the growth process. It has been demonstrated that semiconductor nanocrystals prepared by thermolysis of the precursors in highly coordinating solvents (trioctylphosphine oxide and/or trioctylphosphine) undergo a size distribution focusing process upon slowing the growth and making the growth diffusion controlled [
8]. Various methods have been used to control the semiconductor nanocrystal growth in water such as using specific capping agents such as thioglycerol [
5,
6], alcohols [
9] and surfactants [
10]. Furthermore, the compartmentalization afforded by the aqueous domains of a water-in-oil microemulsion has shown to be effective [
11,
12].
It has been recently reported that the degree of crystallinity and the nanocrystal surface properties and, hence, their luminescence behavior are strongly affected by the reagent nature [
13,
14] and by the growth mechanism [
5]. Indeed, it has been shown that CdS in water can grow via a diffusion controlled mechanism leading to a narrower size distribution when working with a large excess of capping agent compared to the precursor concentrations.
The synthetic procedures were most of the times optimized in terms of medium nature and reactant concentrations and temperature, but not enough attention has been paid to control the reaction time and the effects of its prolongation on the nanocrystals’ dimensions and structural properties. The effects of reaction time on the colloid properties can give valuable information about the growth mechanism under different conditions.
It has been demonstrated that water-in-oil microemulsion based synthetic procedures are particularly efficient in promoting a fast nanoparticle nucleation since it is determined by the rate constant with which droplets exchange their content (10
6–10
8 M
−1 s
−1) [
12].
In the present work, CdS nanocrystals have been prepared in aqueous media by use of a water-in-oil microemulsion mixing method in order to investigate the effect of reaction time on nanocrystal properties and to obtain information on their growth mechanism. In particular, heptane or nonane was used as the organic phase of the microemulsions with the aim to investigate the effects of microemulsion dynamics and/or stability on the nanocrystal properties. Heptane is a solvent widely used in the literature for AOT-microemulsions while nonane was chosen because it has a higher boiling point and density compared to heptane.
2. Results and Discussion
The water-in-oil microemulsion based methods for the preparation of nanocrystals have been shown to be very efficient in the nucleation step since they allow supersaturation conditions to easily be reached. Indeed upon mixing the two microemulsions, each solubilizing one of the two precursors (Cd
2+ and S
2−) in the water pockets, the suspensions turned a yellowish color which became stable and persisted after a few minutes.
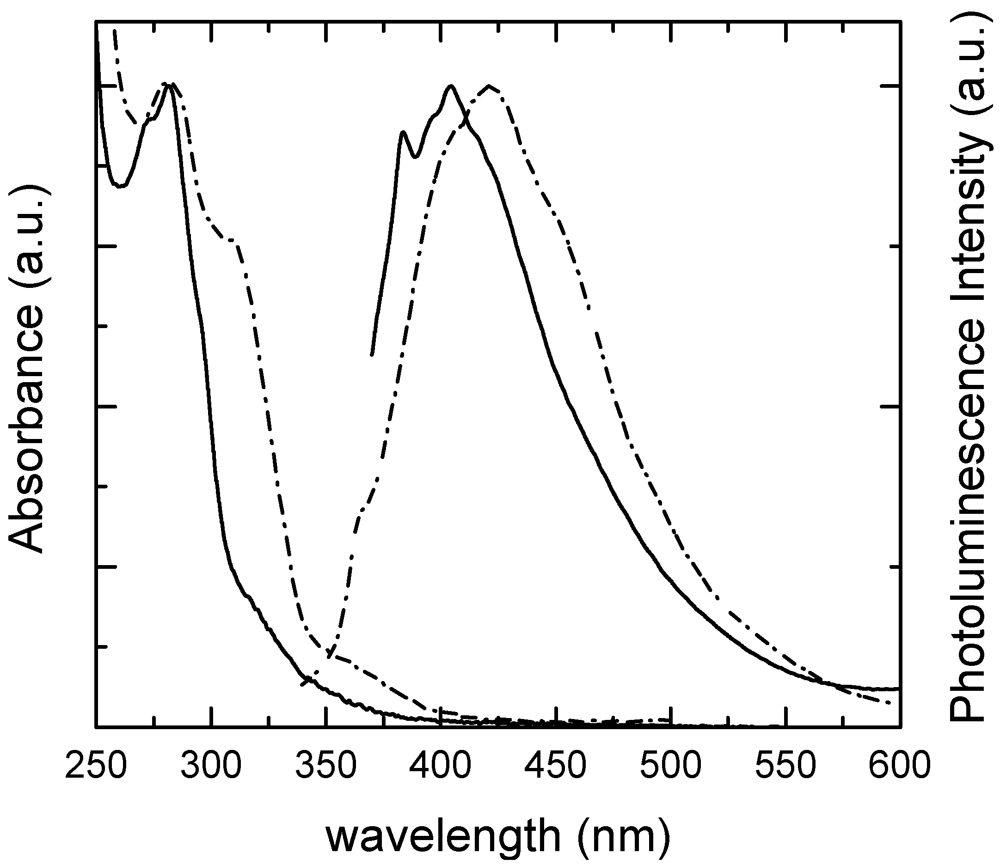
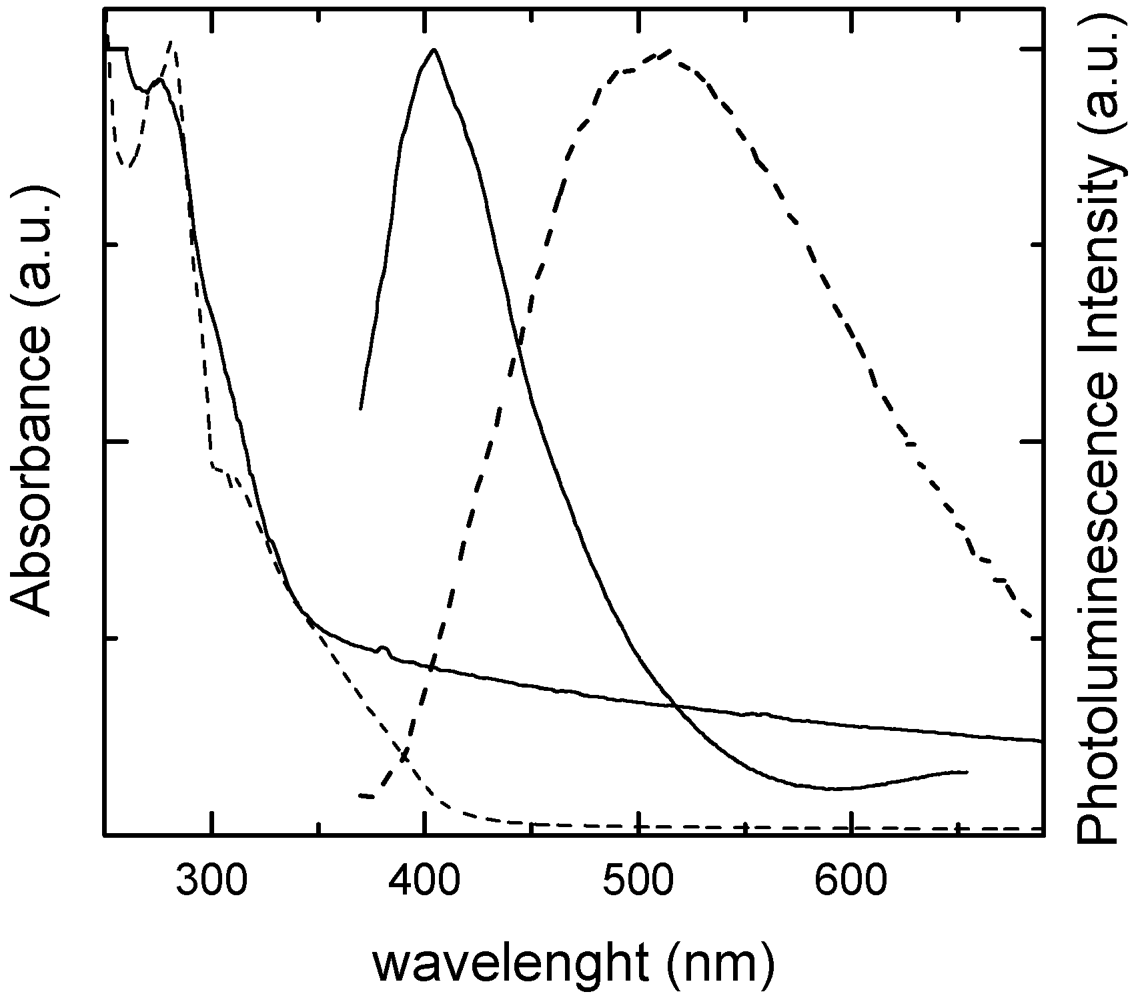
Figure 1 presents the absorption and luminescence spectra of the suspension obtained in heptane by aging the mixed microemulsions for 10’ and 60’. The spectra confirm that the formation of the nanocrystals occurred, in agreement with literature data [
10,
12]. In particular, the spectrum of the sample obtained 10’ after the mixing presented the main maximum at 285 nm and a pronounced shoulder at 330 nm, while the luminescence spectrum is centered at 400 nm; with an increase in the reaction time the absorption spectrum became broader and a red-shift of 20 nm of the luminescence spectrum was observed. The spectral shifts occur together with a decrease of the absolute luminescence quantum efficiency, which goes from 0.023 to 0.010 on increasing the reaction time from 10 to 60’. This data suggests that a prolongation of the reaction time leads to a modification of the nanocrystal populations.
Figure 1.
Absorption (left) and luminescence (right, λexc = 300 nm) normalized spectra of CdS nanocrystals in heptane microemulsions recorded 10’ (solid line) and 60’ (dashed line) after the mixing.
Figure 1.
Absorption (left) and luminescence (right, λexc = 300 nm) normalized spectra of CdS nanocrystals in heptane microemulsions recorded 10’ (solid line) and 60’ (dashed line) after the mixing.
The size distribution in the samples was monitored by TEM measurements. In
Figure 2, TEM images recorded on samples taken at early reaction times (10’) and after 60’ from the mixing are reported, which confirm the formation of spherical nanocrystals, whose size dispersion was analyzed by building up diameter distribution histograms (
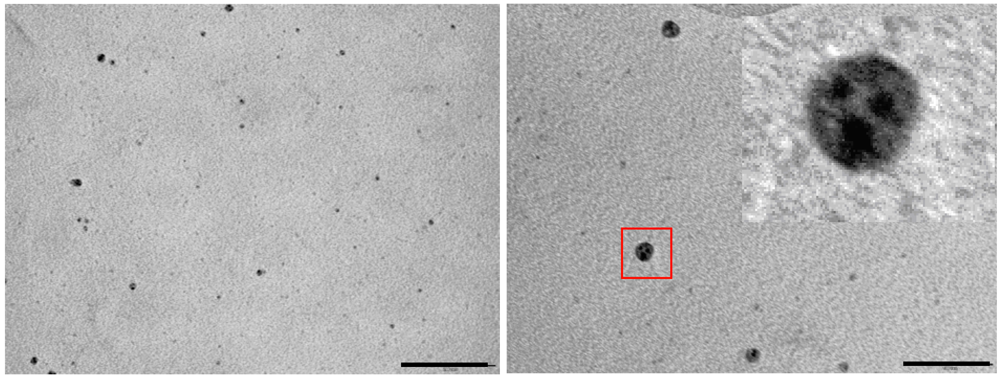
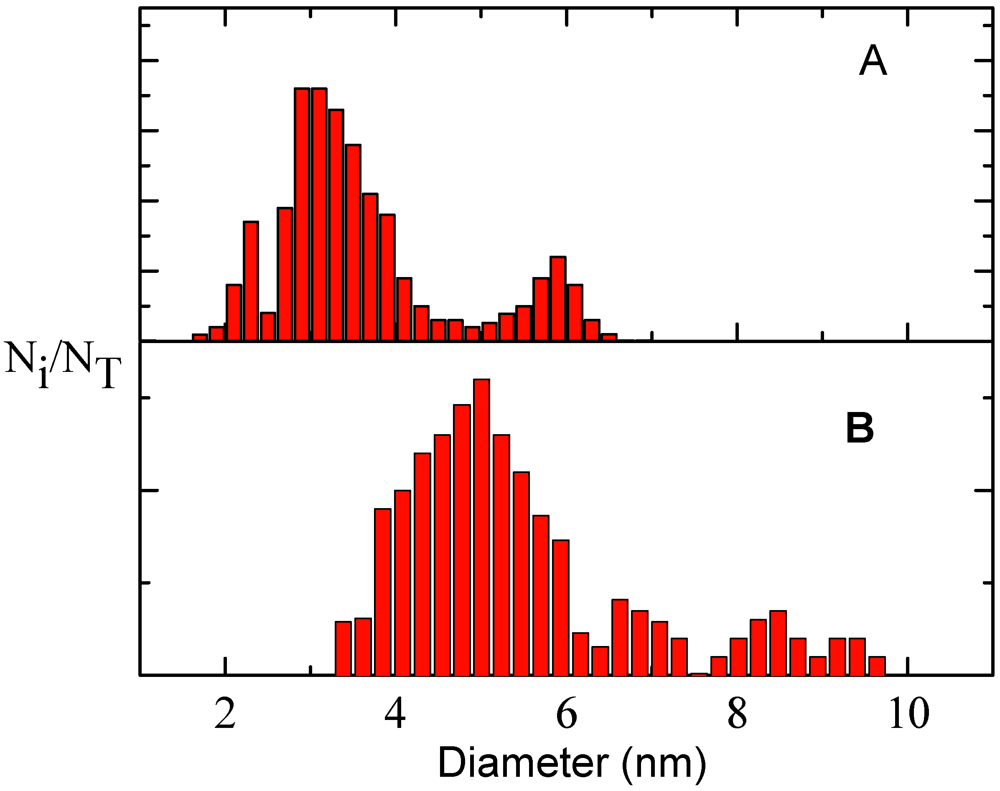
Figure 3). After 10’ of precursor reaction, the sample presented two populations, having average sizes of 3.0 ± 0.1 and 5.8 ± 0.1 nm; while for the sample obtained after longer reaction times, the size distribution appeared more complex and showed a major population with a mean diameter of 5.0 ± 0.1 nm and several minor populations with higher mean diameters. This behaviour can be explained considering that the nanocrystal growth is controlled by surface processes, most likely because after the fast nucleation, microemulsion dynamics assist the exchange of stable nuclei which might form stable agglomerates in the water pool. Actually, a careful analysis of TEM images recorded on the samples where the particle formation reaction lasted for 60’, shows that in each particle the contrast distribution is not homogeneous; indeed each particle consists of different dark spots, such that the particles are constituted by multiple nanocrystals supporting the hypothesis of droplet coalescence. The difficulties to control the growth process led to the development of defects in the crystal structures as shown by the red-shift of the emission spectrum, generally assigned to the contribution of trap states. These data indicate that at longer reaction times the nanocrystal size broadens, likely due to droplet coalescence although the microemulsion composition (W = [H2O]/[AOT] = 4.3) is in a regime where the nanocrystal size is determined by water droplet dimension, which is the case at early reaction stages [
15].
Figure 2.
TEM images of CdS nanocrystals in heptane microemulsions recorded after 10’ (left panel) and 60’ (right panel) from the mixing; scale bar represents 100 nm. Inset: zoomed image of the particle within the red square.
Figure 2.
TEM images of CdS nanocrystals in heptane microemulsions recorded after 10’ (left panel) and 60’ (right panel) from the mixing; scale bar represents 100 nm. Inset: zoomed image of the particle within the red square.
Figure 3.
Size distribution histograms of CdS nanocrystals in heptane microemulsions obtained from TEM images of samples analyzed after 10’ (A) and 60’ (B) from the mixing.
Figure 3.
Size distribution histograms of CdS nanocrystals in heptane microemulsions obtained from TEM images of samples analyzed after 10’ (A) and 60’ (B) from the mixing.
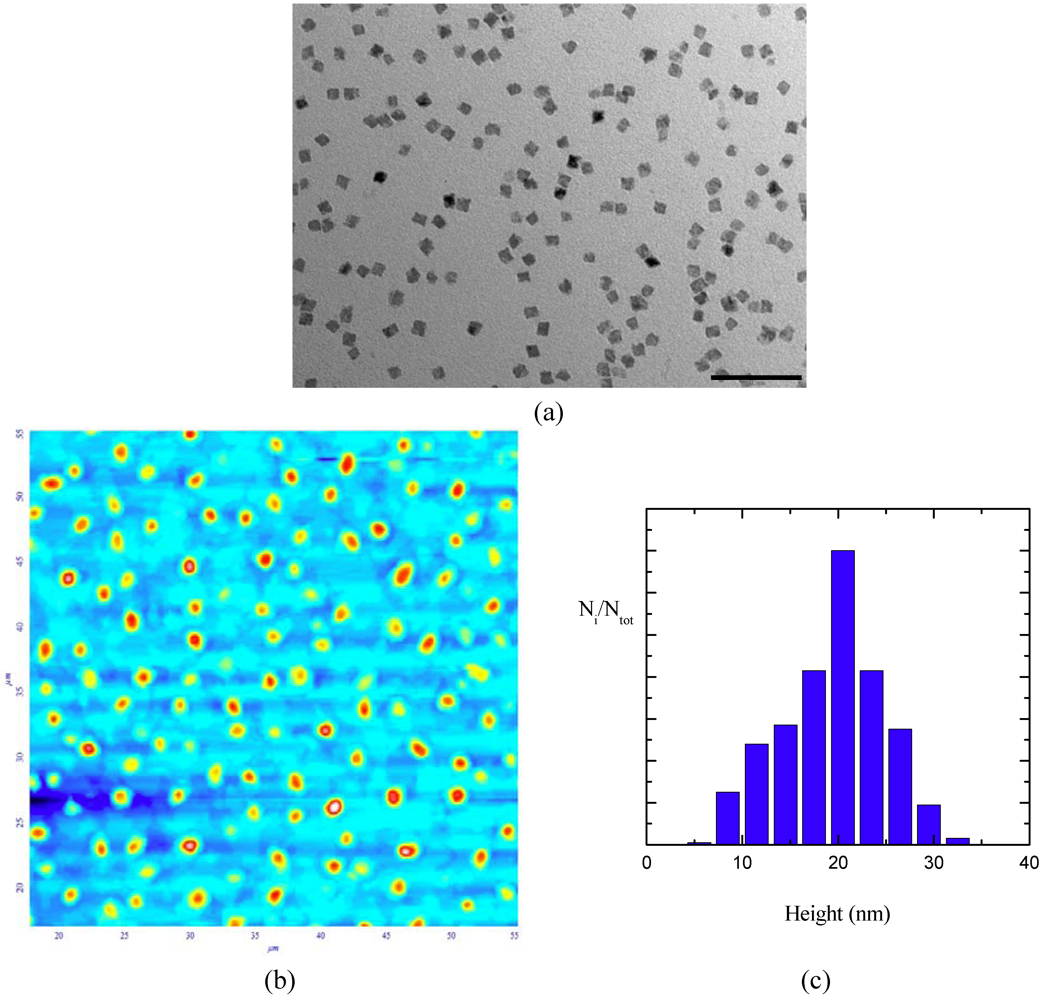
The dimension evolution is further enhanced when nanocrystals in the microemulsion underwent a reflux procedure to remove the water from the pools. The TEM images recorded on the sample put through the reflux treatment (
Figure 4) showed nanocrystals with a square shape and sharp edges with a length centered at 10 nm. Atomic force microscopy measurements (
Figure 4) allowed topographic information on the crystal morphology to be obtained and for it to be concluded that the sample was characterized by 3-D nanocrystals with a height distribution with the highest frequency at 21 nm; AFM dimensions are larger that those determined by TEM images for the AOT contribution in the topography image, since a standing configuration of nanocrystals is unprobable.
Figure 4.
TEM image (panel a, scale bar equals 100 nm) and AFM image (panel b, scan area 55 × 55 µm2) together with height distribution diagram (c) of CdS nanocrystals in heptane recorded after reflux treatments.
Figure 4.
TEM image (panel a, scale bar equals 100 nm) and AFM image (panel b, scan area 55 × 55 µm2) together with height distribution diagram (c) of CdS nanocrystals in heptane recorded after reflux treatments.
In order to check the effects of the phase on the microemulsion dynamics and/or stability and hence on the nanocrystal growth process, CdS nanocrystals were prepared in water-in-nonane microemulsions, using the same amounts of solvents and AOT as used for the heptane microemulsions.
Nonane was chosen since it has a higher boiling point (151 °C) and density (0.718 g/cm
3) compared to heptane (98 °C and 0.68 g/cm
3), thus reducing the rate of diffusion processes and making changes in the microemulsion composition during synthesis negligible. The nanocrystals prepared in nonane microemulsions and analyzed 10’ after reactant mixing presented a structureless absorption spectrum and a luminescence spectrum centered at 400 nm (
Figure 5) from which a luminescence efficiency of 0.020 has been determined. With longer reaction times the absorption spectrum showed a shoulder at 310 nm while bigger changes were observed in the luminescence properties. Indeed, the emission spectrum broadened and shifted to the red (maximum at 500 nm). The prolongation of reaction times also induced a decrease in luminescence efficiency since a value of 0.005 was measured. These observations suggest that after 60’ reaction time, different CdS nanocrystal populations are actually contributing to the optical properties of the suspension. TEM images recorded at early stages of the reaction process (
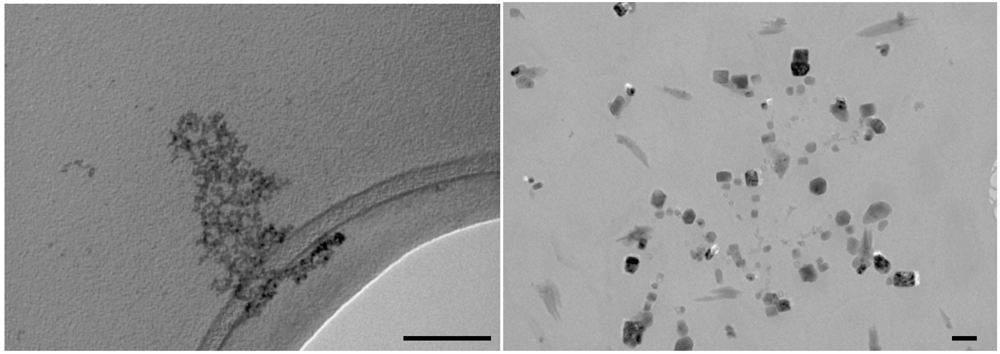
Figure 6, left panel) showed that very small nanocrystals are formed in these conditions. Due to the resolution limits of the instrumentation at disposal, no size distribution analysis could be carried out; however an average diameter of 2.5 nm could be estimated for the nanocrystals obtained in these experimental conditions. This information indicates that in nonane the rate of the nucleation process is decreased compared to hexane, likely reducing the droplet exchange rate, but this achievement is counterbalanced by a lower control in defect development. Furthermore, by prolonging the reaction time in nonane microemulsion up to 60’ after mixing, an evident change in nanocrystal morphology was observed (
Figure 6, right panel) since again CdS nanocrystals with square shapes were observed. These observations lead to the hypothesis that in nonane microemulsions the droplet coalescence is even more efficient than in the heptane system.
Figure 5.
Absorption (left) and luminescence (right, λexc = 300 nm) normalized spectra of CdS nanocrystals in nonane microemulsions recorded after 10’ (solid line) and 60’(dashed line) from the mixing.
Figure 5.
Absorption (left) and luminescence (right, λexc = 300 nm) normalized spectra of CdS nanocrystals in nonane microemulsions recorded after 10’ (solid line) and 60’(dashed line) from the mixing.
Figure 6.
TEM images of CdS nanocrystals in nonane microemulsion recorded after 10’ (left panel) and 60’ (right panel) from the mixing; scale bars represent 100 nm.
Figure 6.
TEM images of CdS nanocrystals in nonane microemulsion recorded after 10’ (left panel) and 60’ (right panel) from the mixing; scale bars represent 100 nm.
The obtained results can give valuable information to tune the size and shape of semiconductor nanocrystals in aqueous environments and without the use of highly coordinating ligands which can be difficult to handle when further surface processing is necessary.
