Integrated Au/TiO2 Nanostructured Photoanodes for Photoelectrochemical Organics Degradation

 ,
,  , , , , , ,
Abstract
:1. Introduction
2. Results
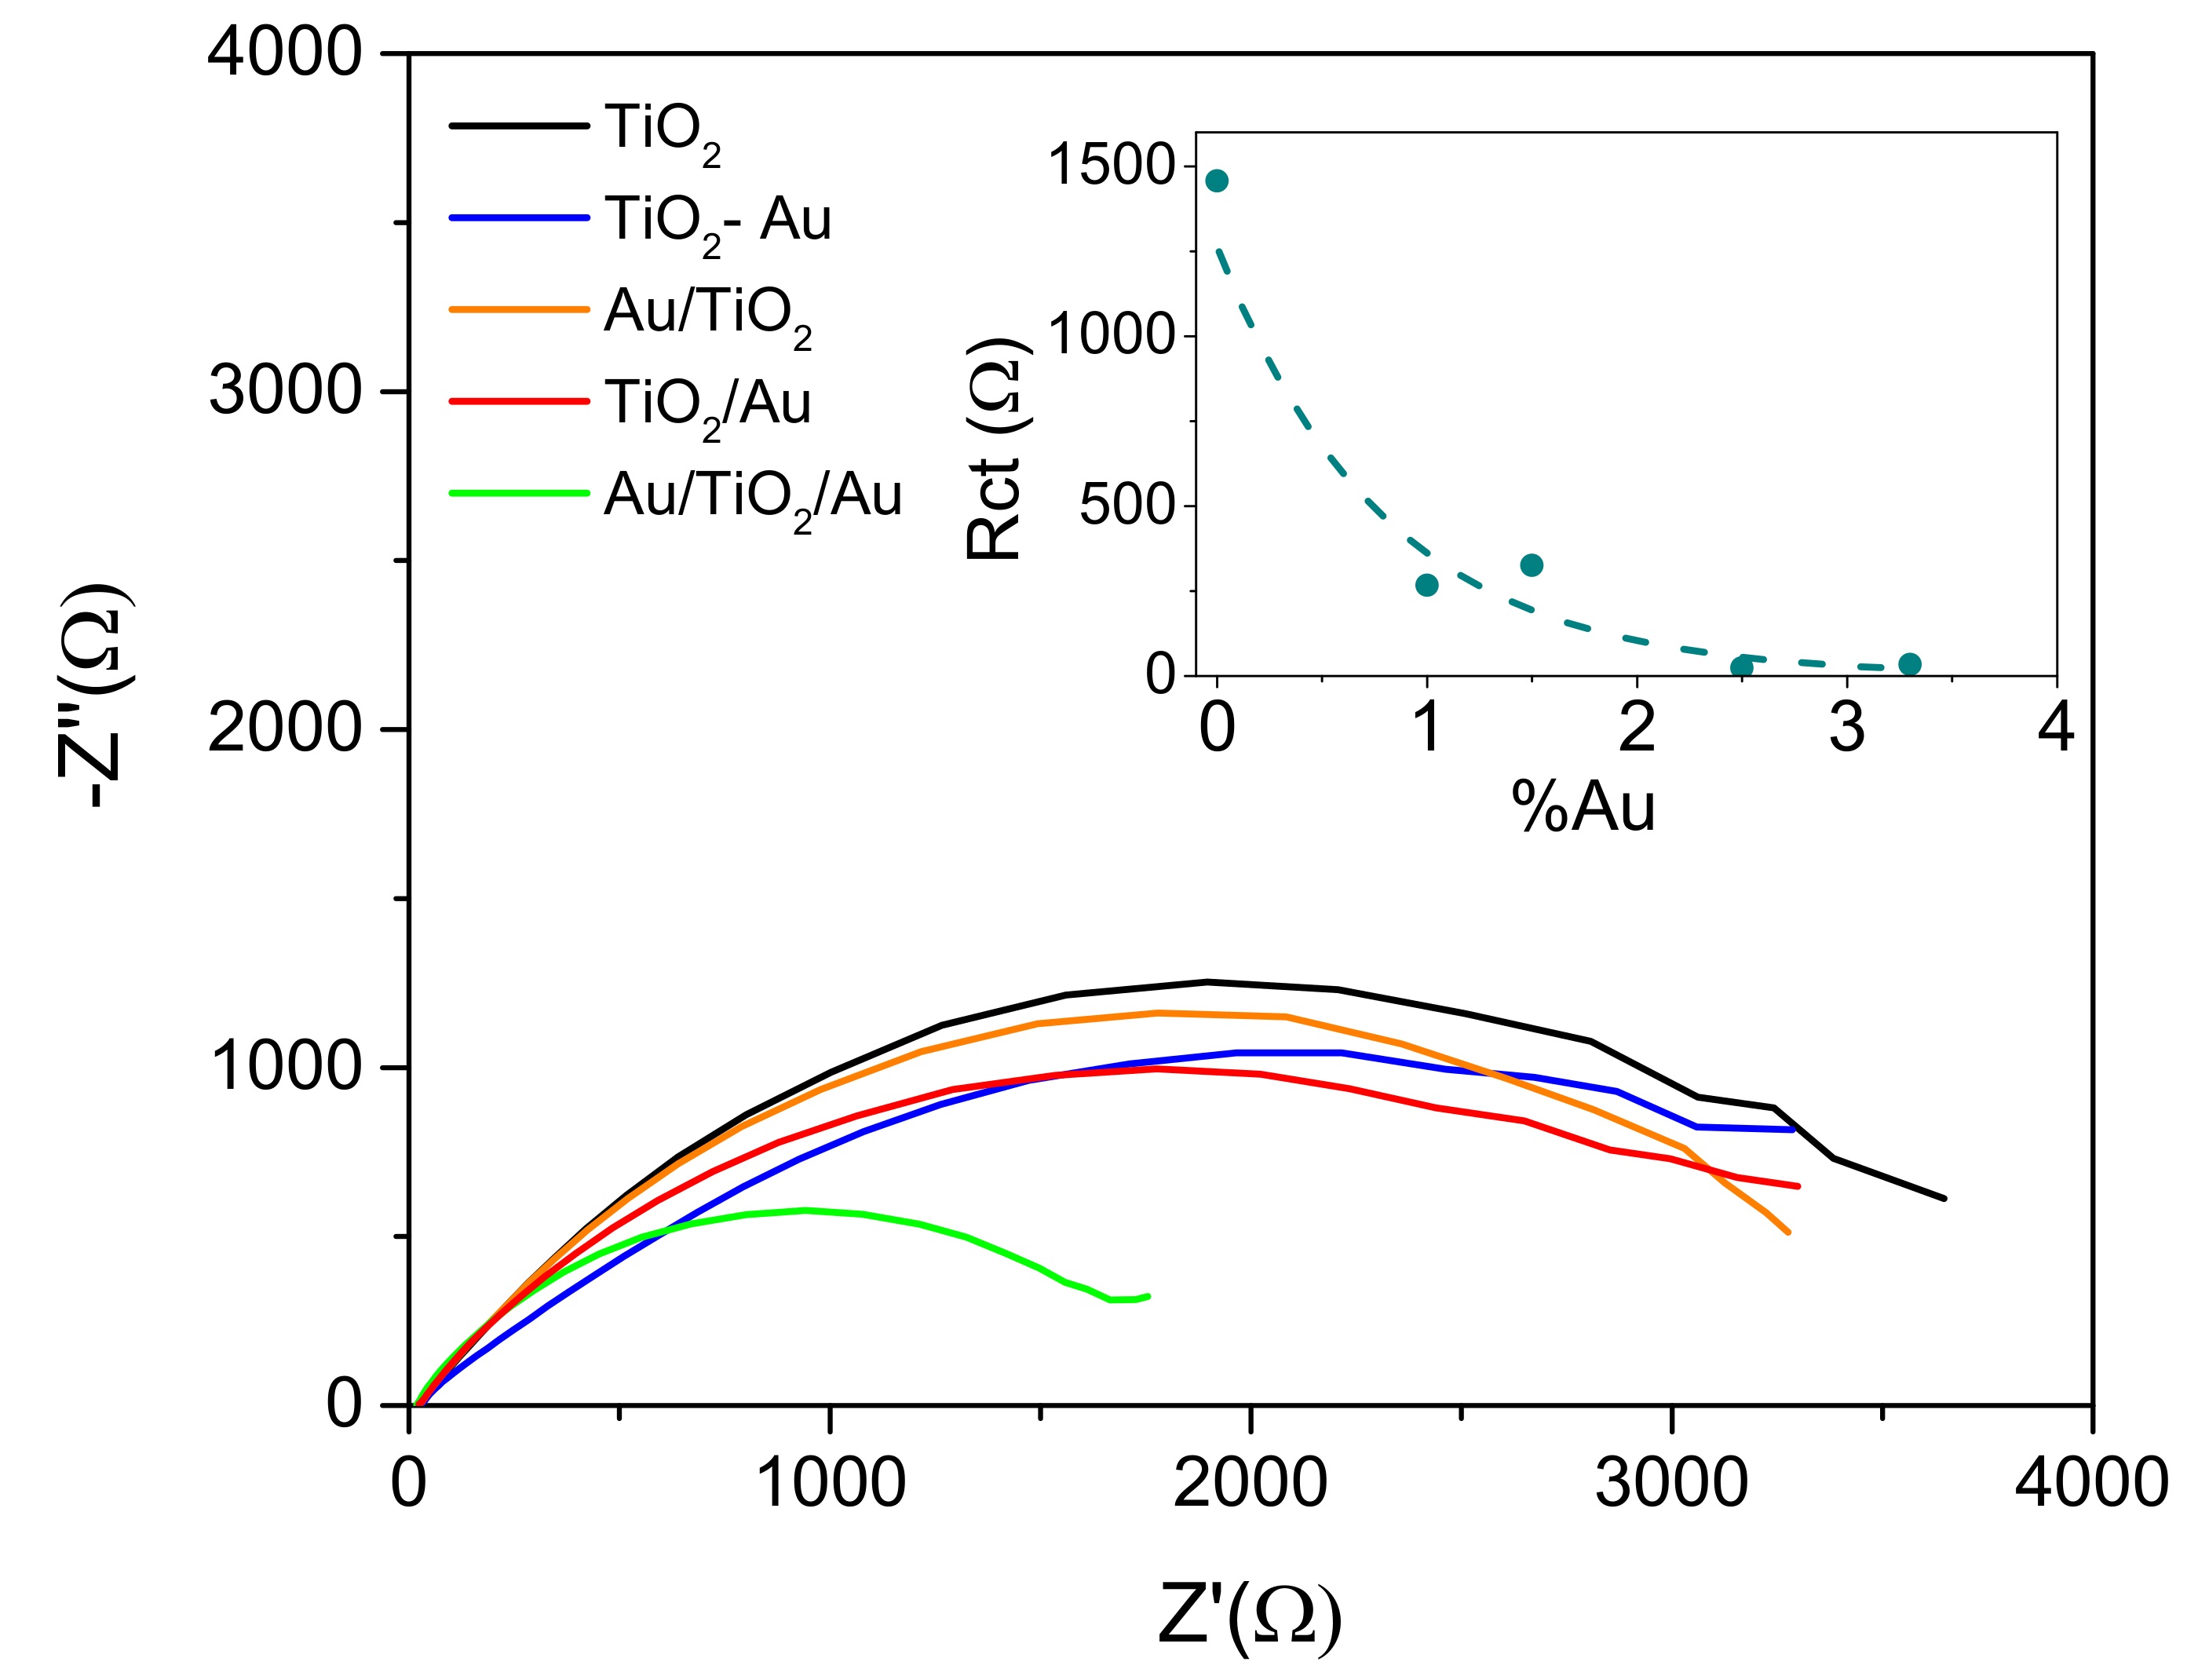
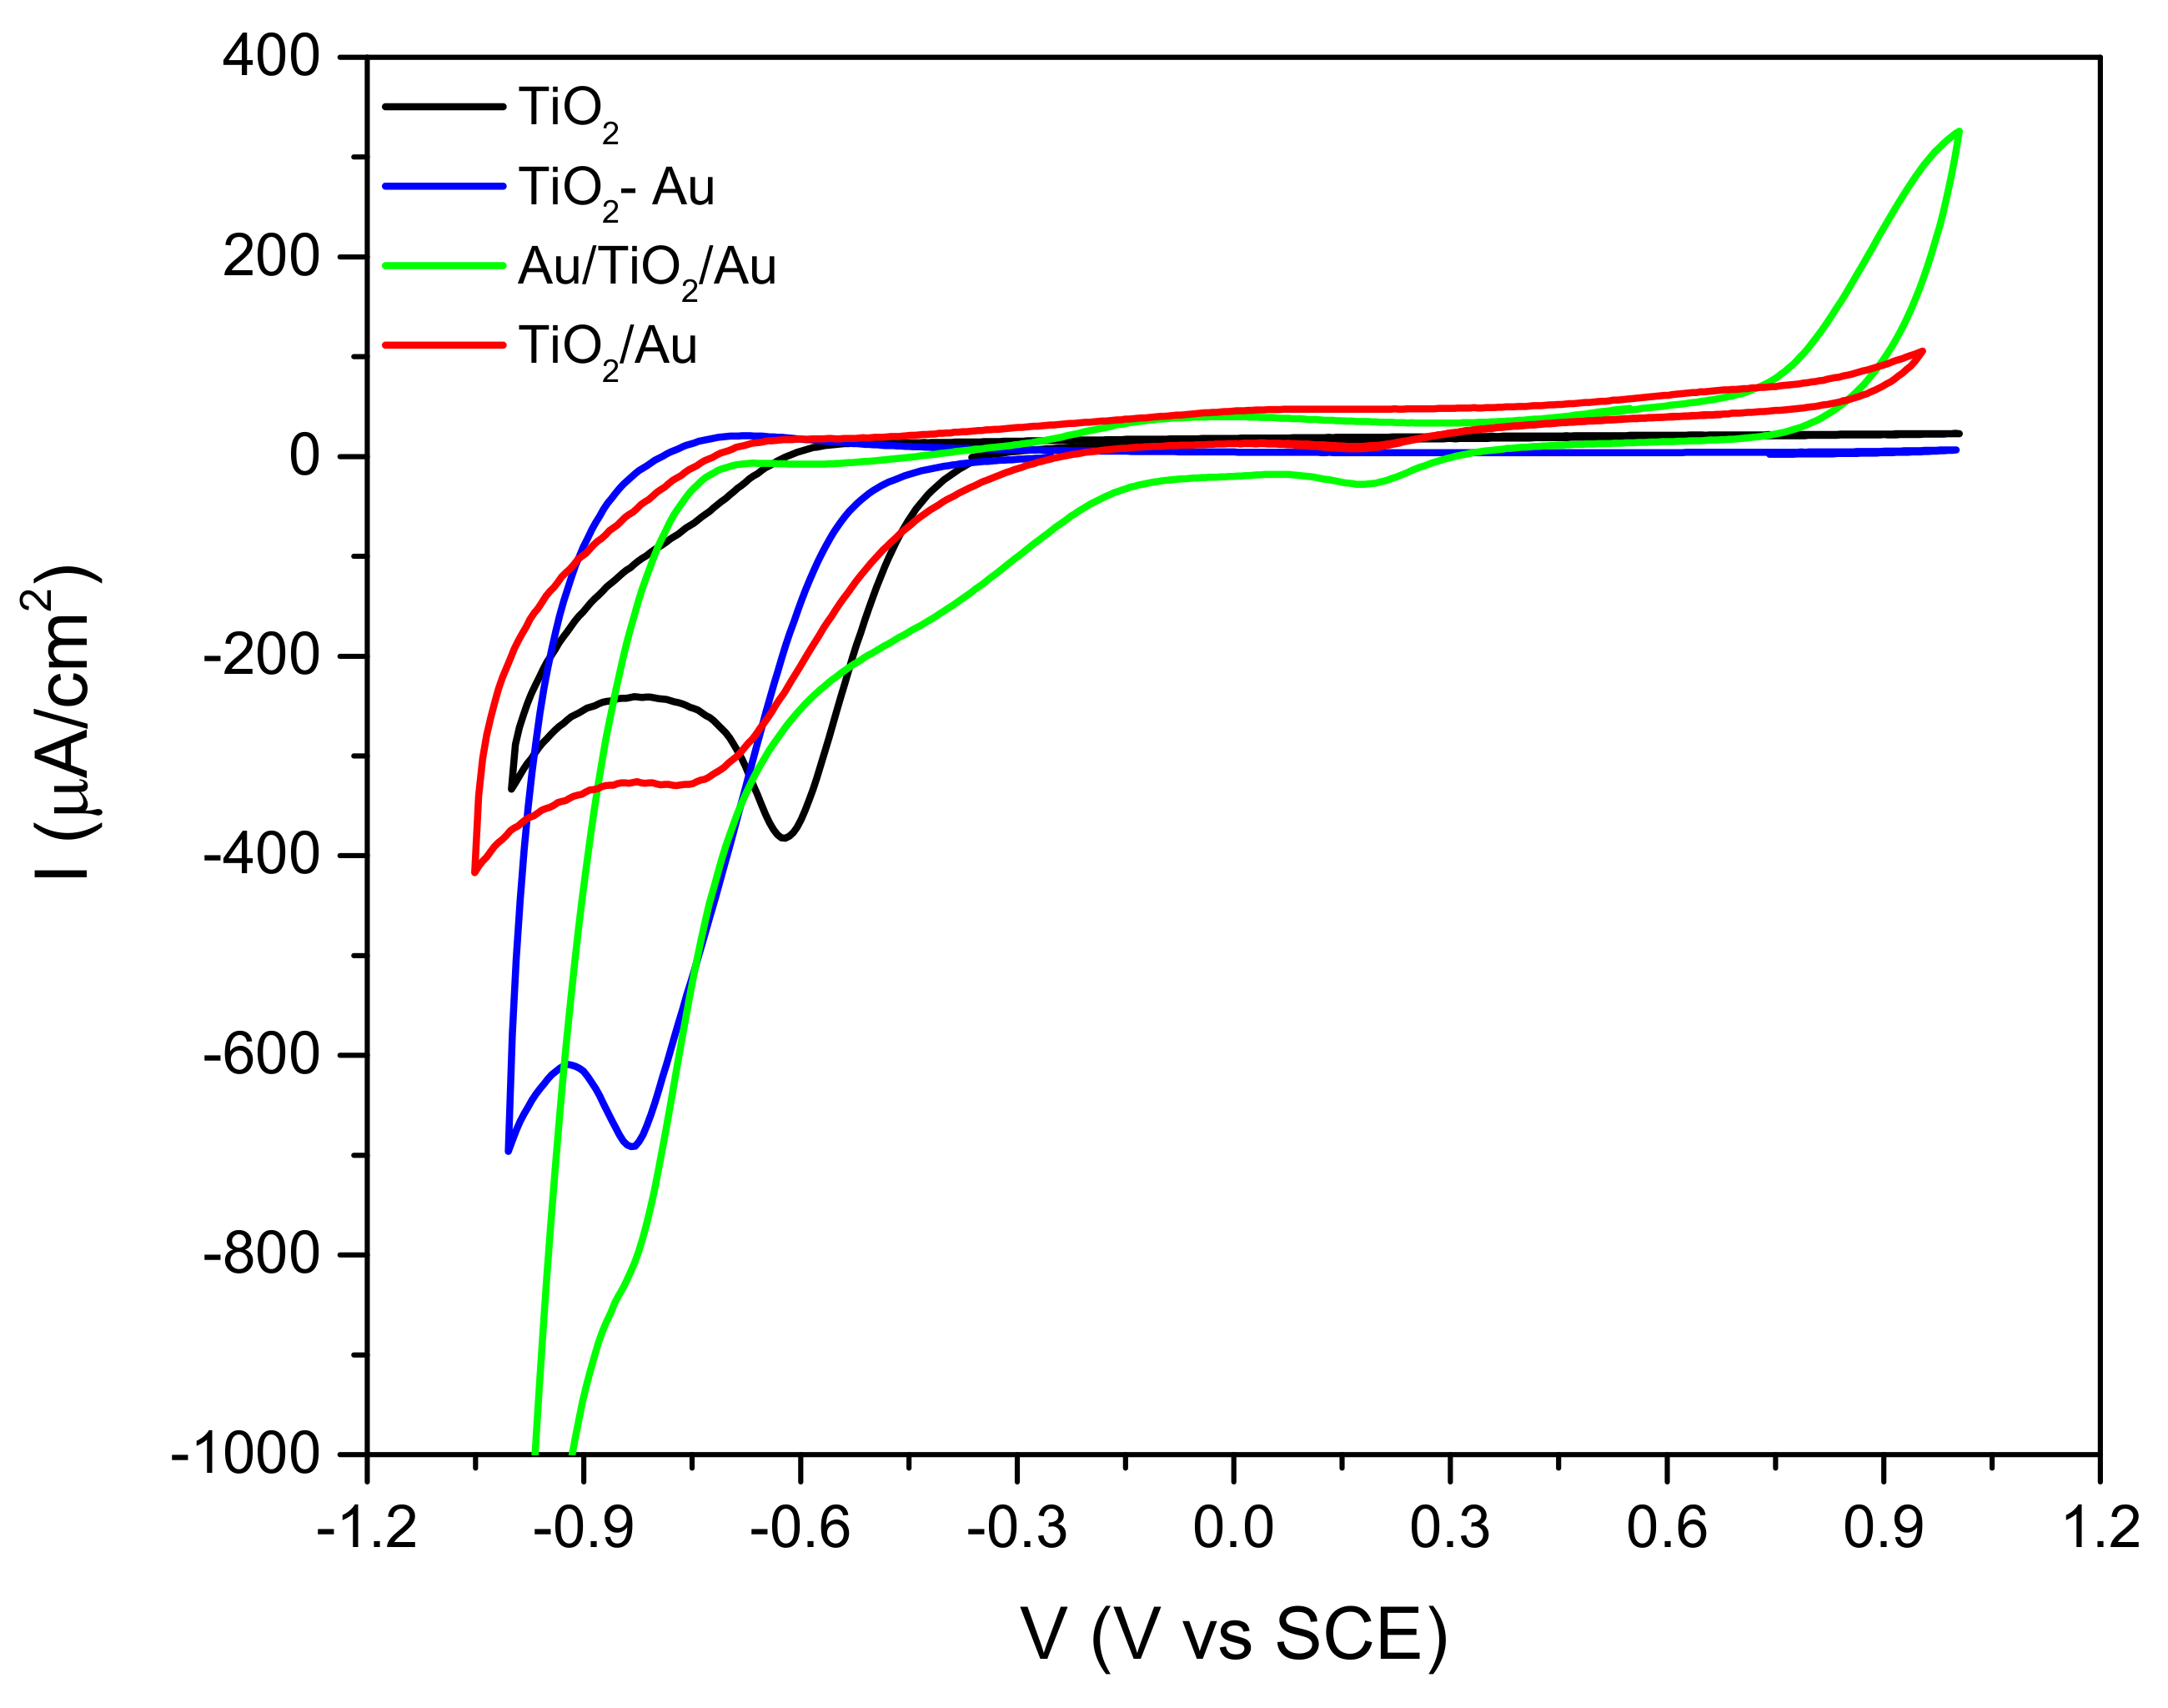
2.1. Structural, Optical, and Electrochemiecal Properties
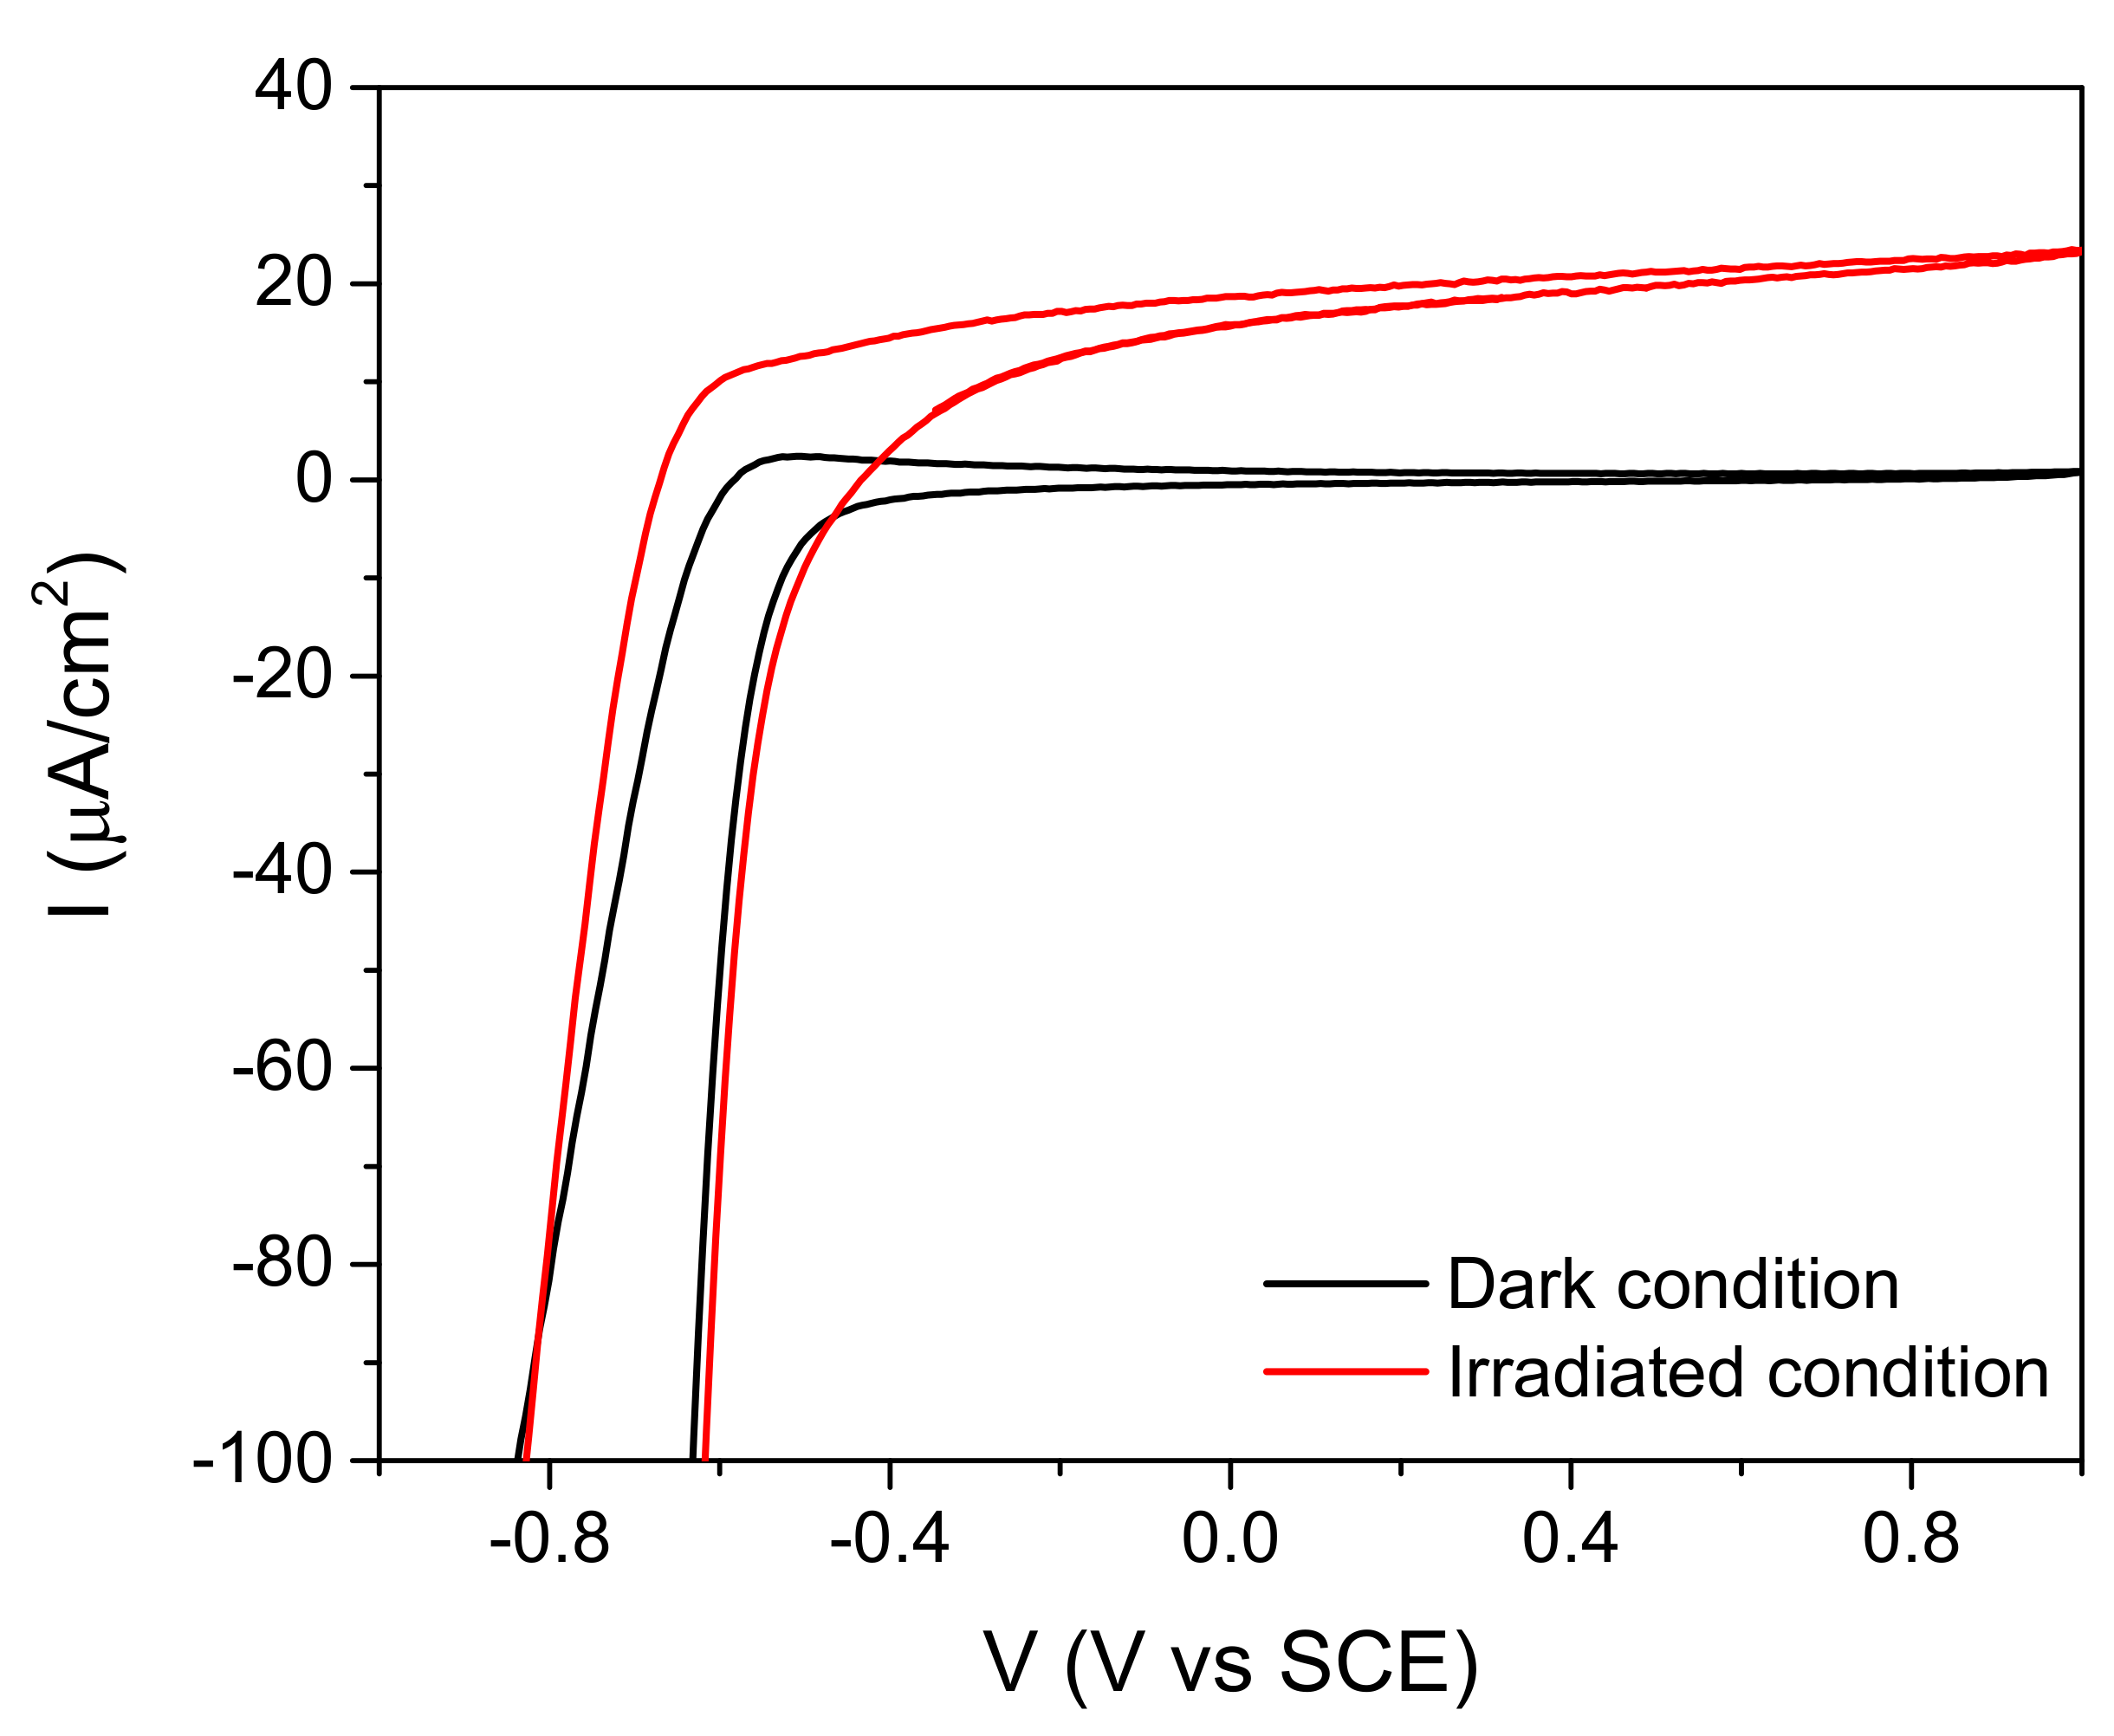
2.2. Behavior of the Irradiated Samples
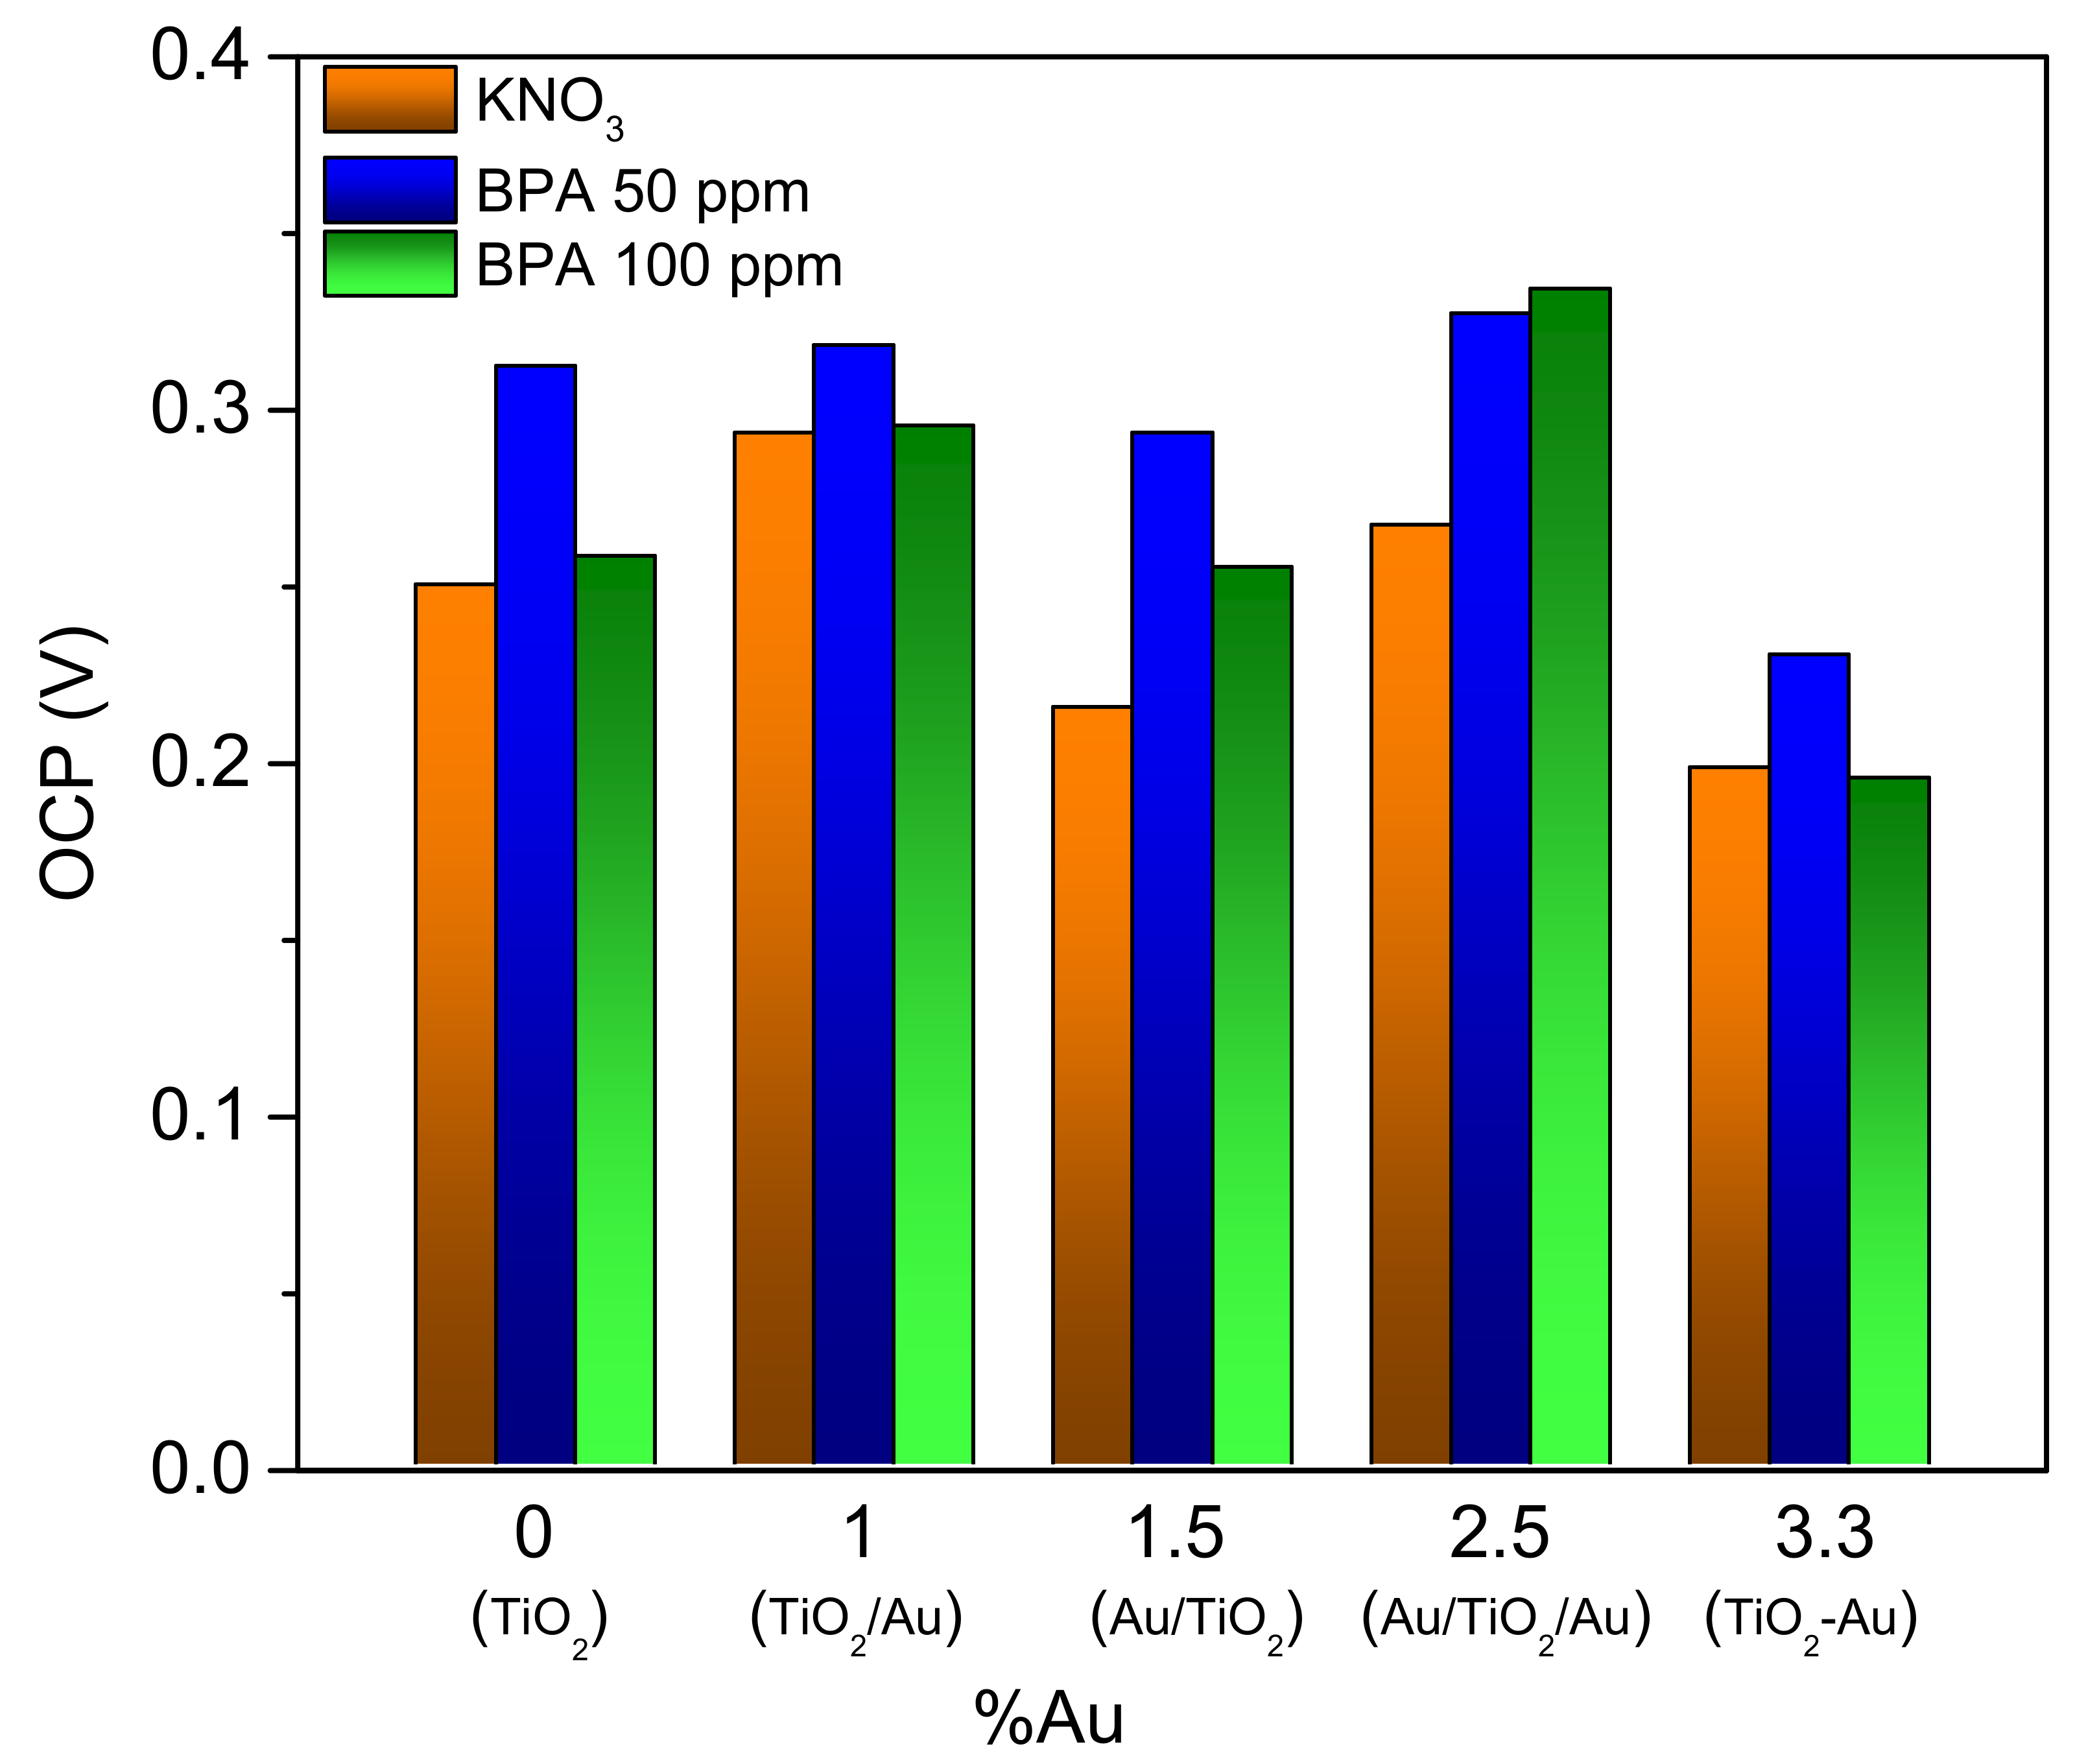
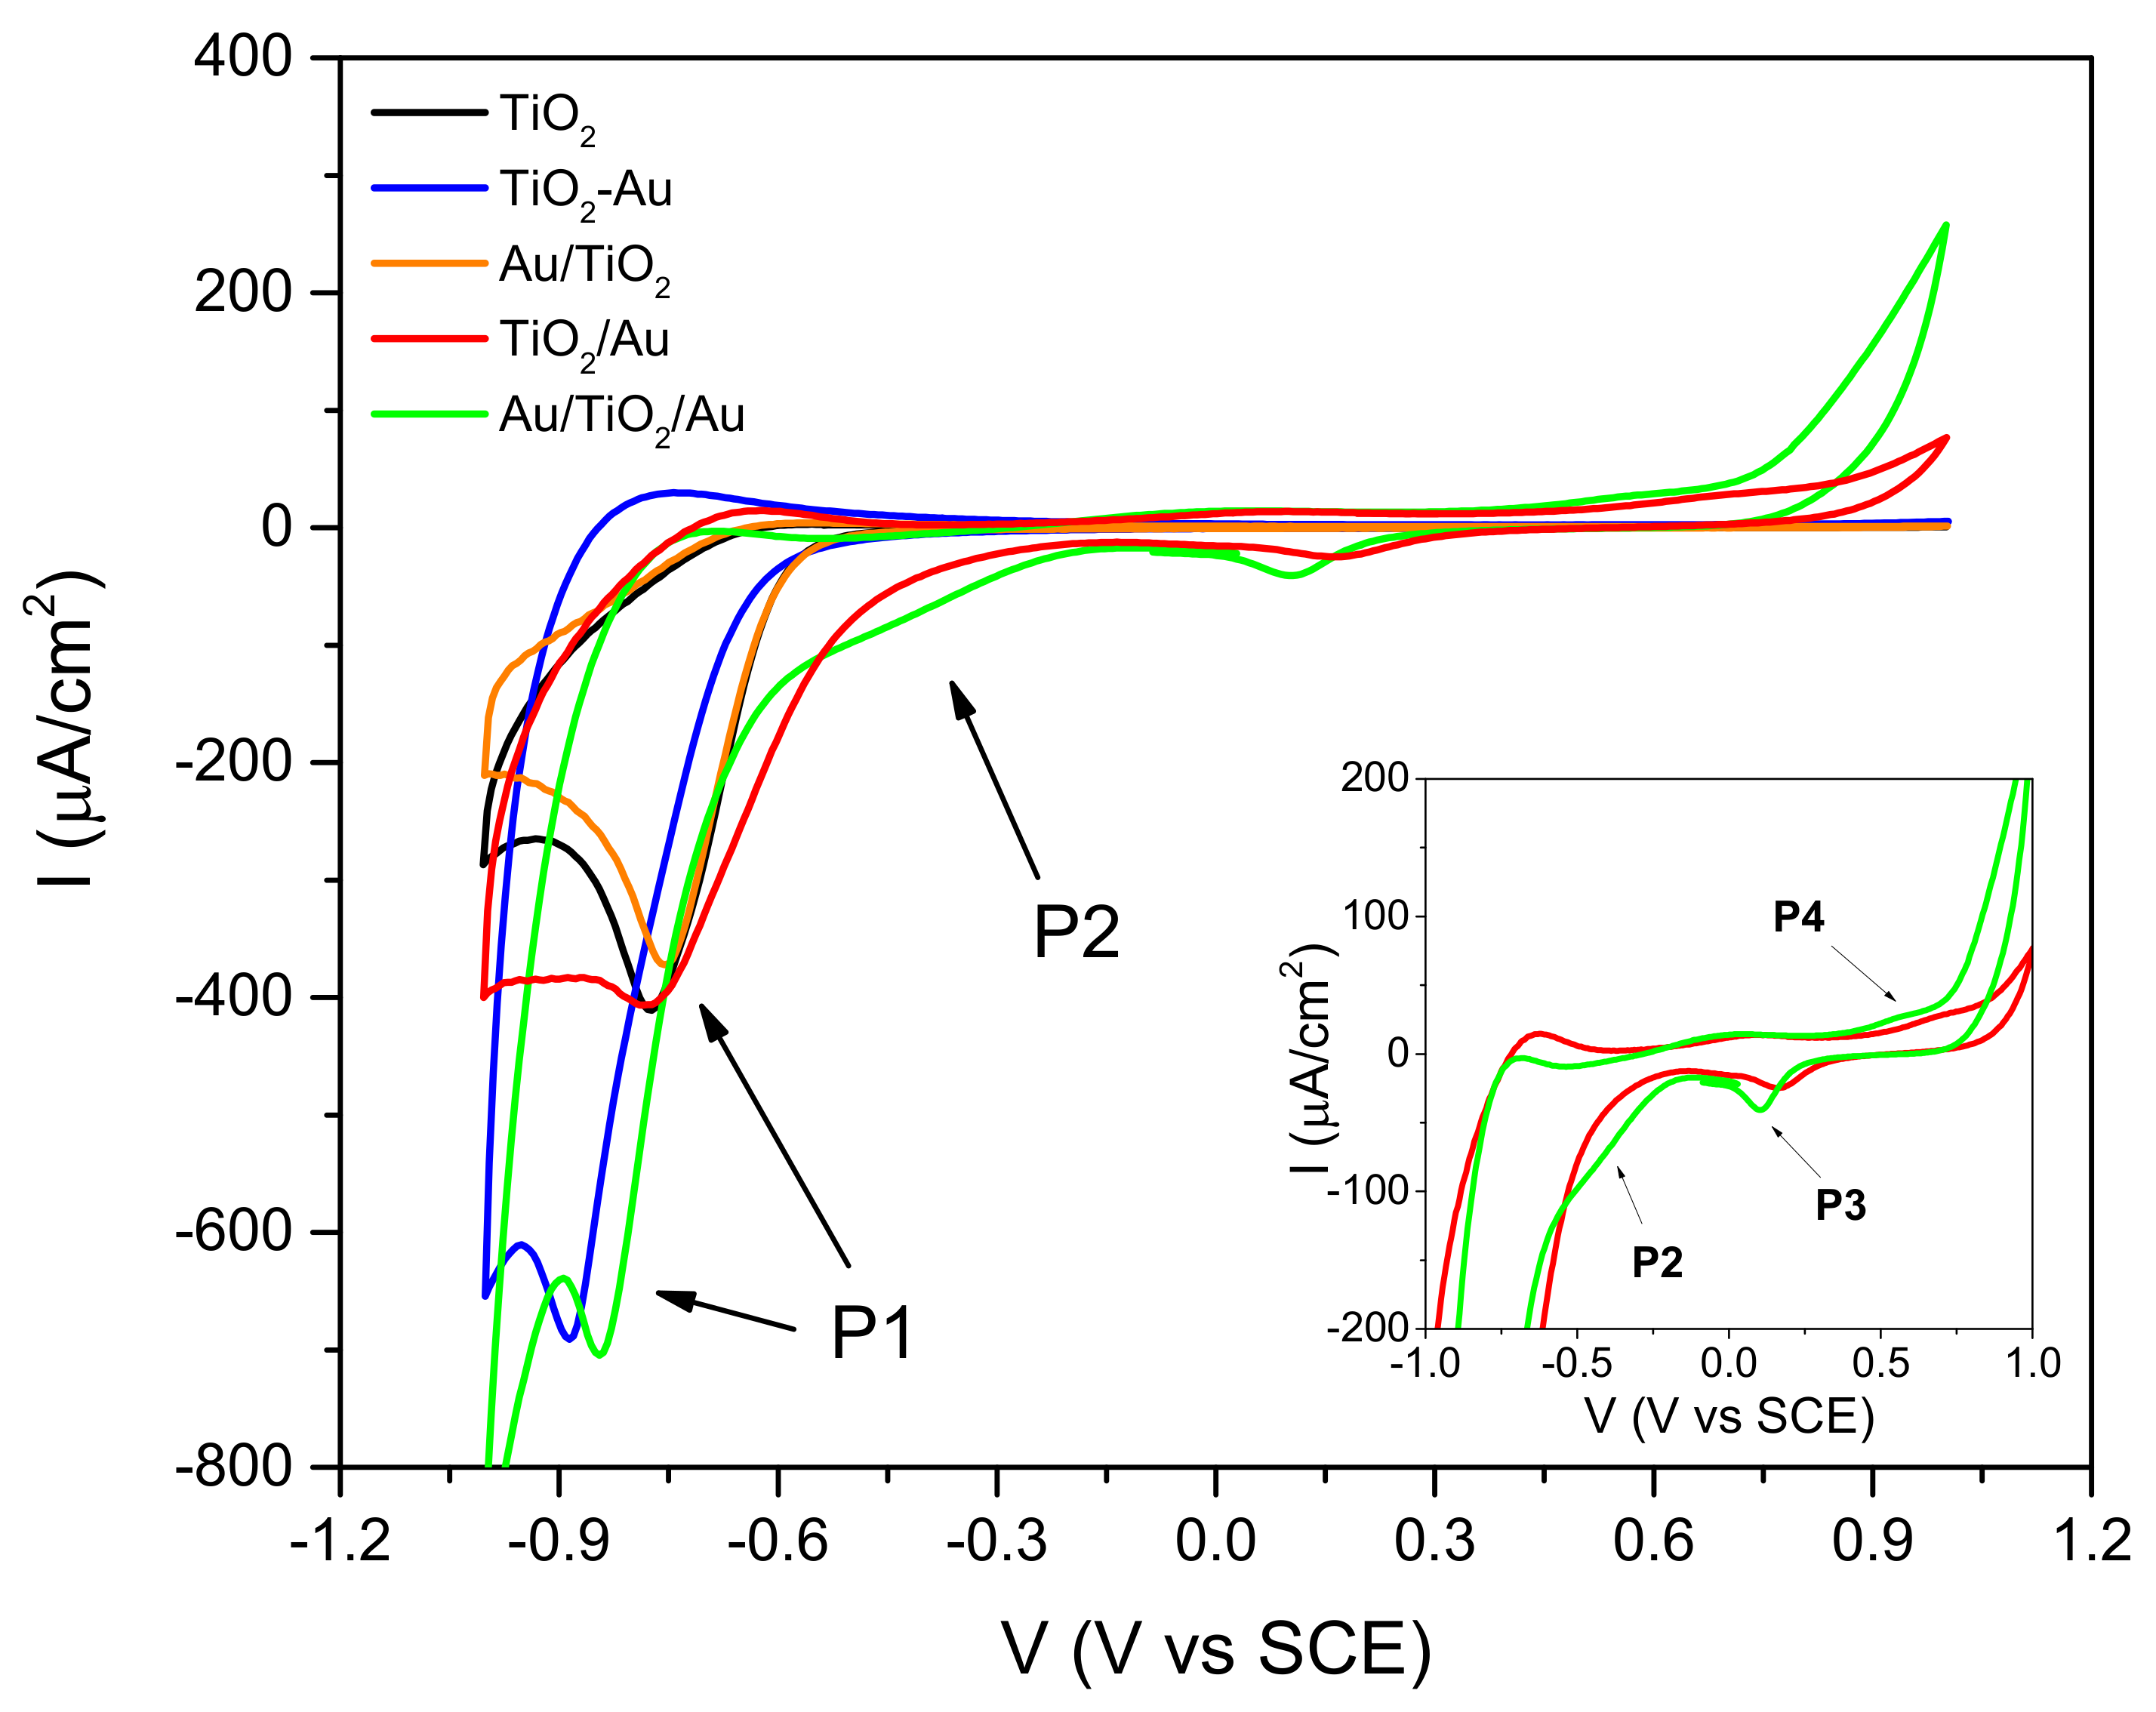
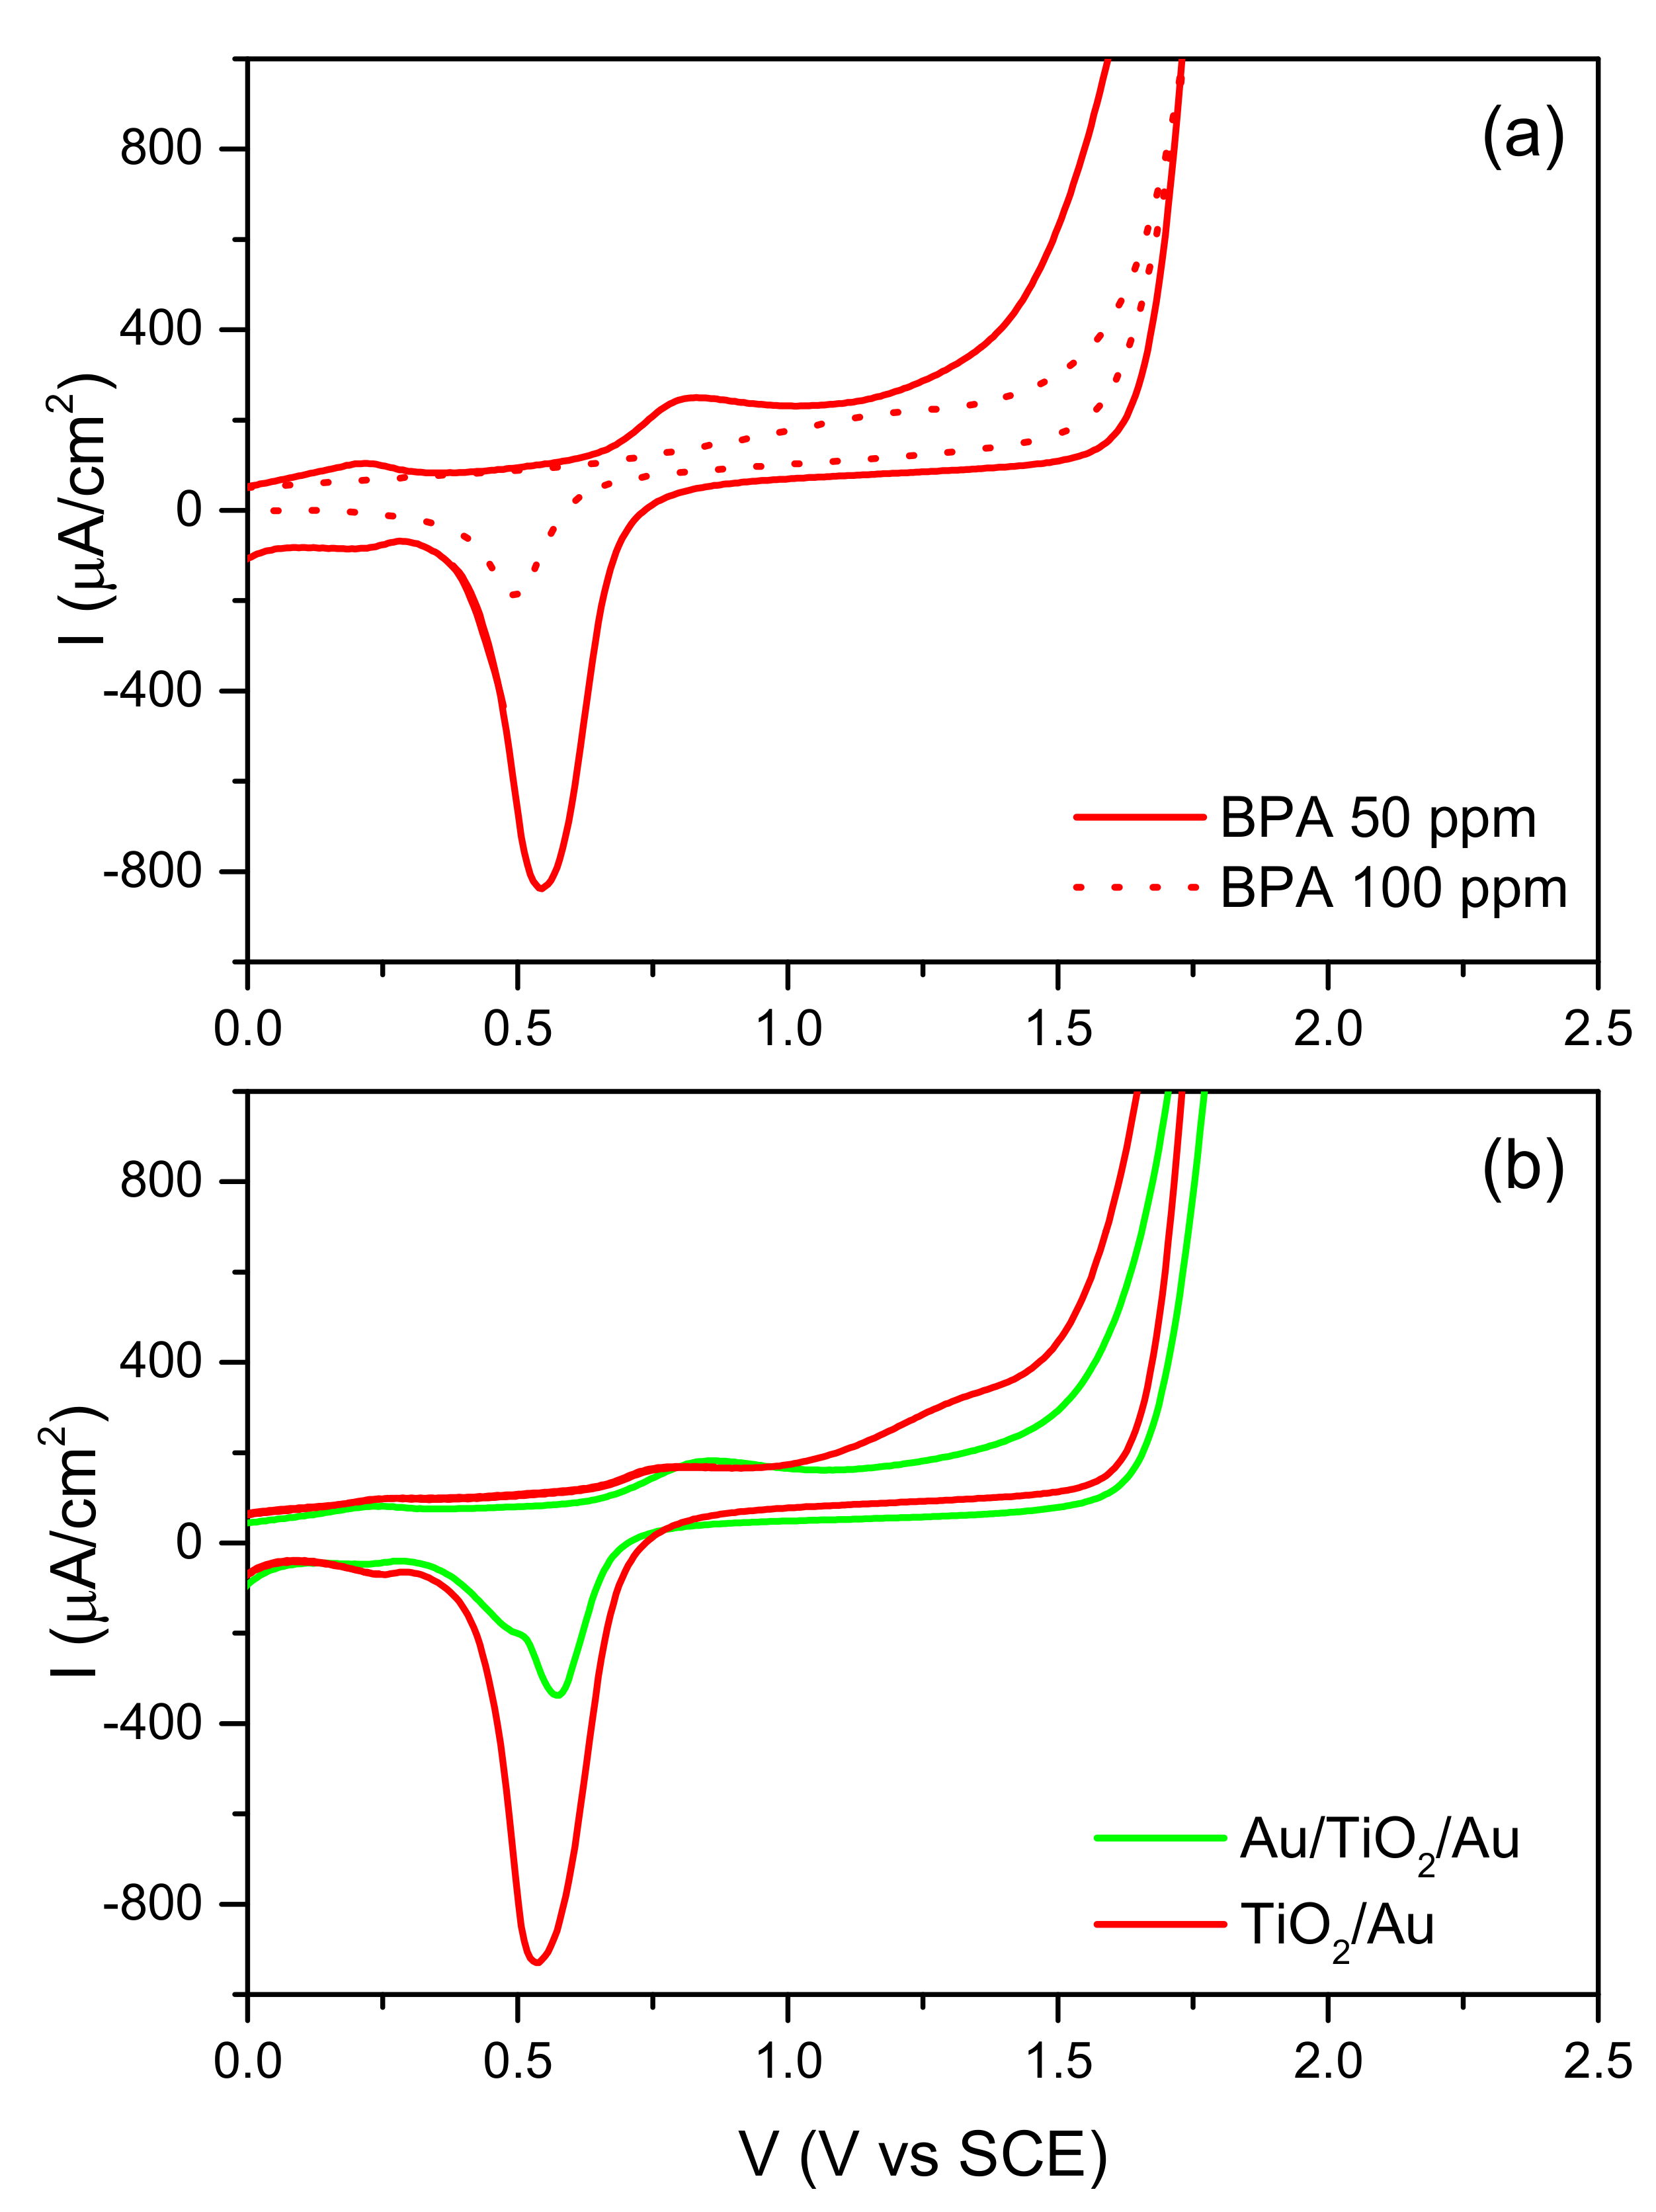
2.3. Effect of the Organic Compound on the CV
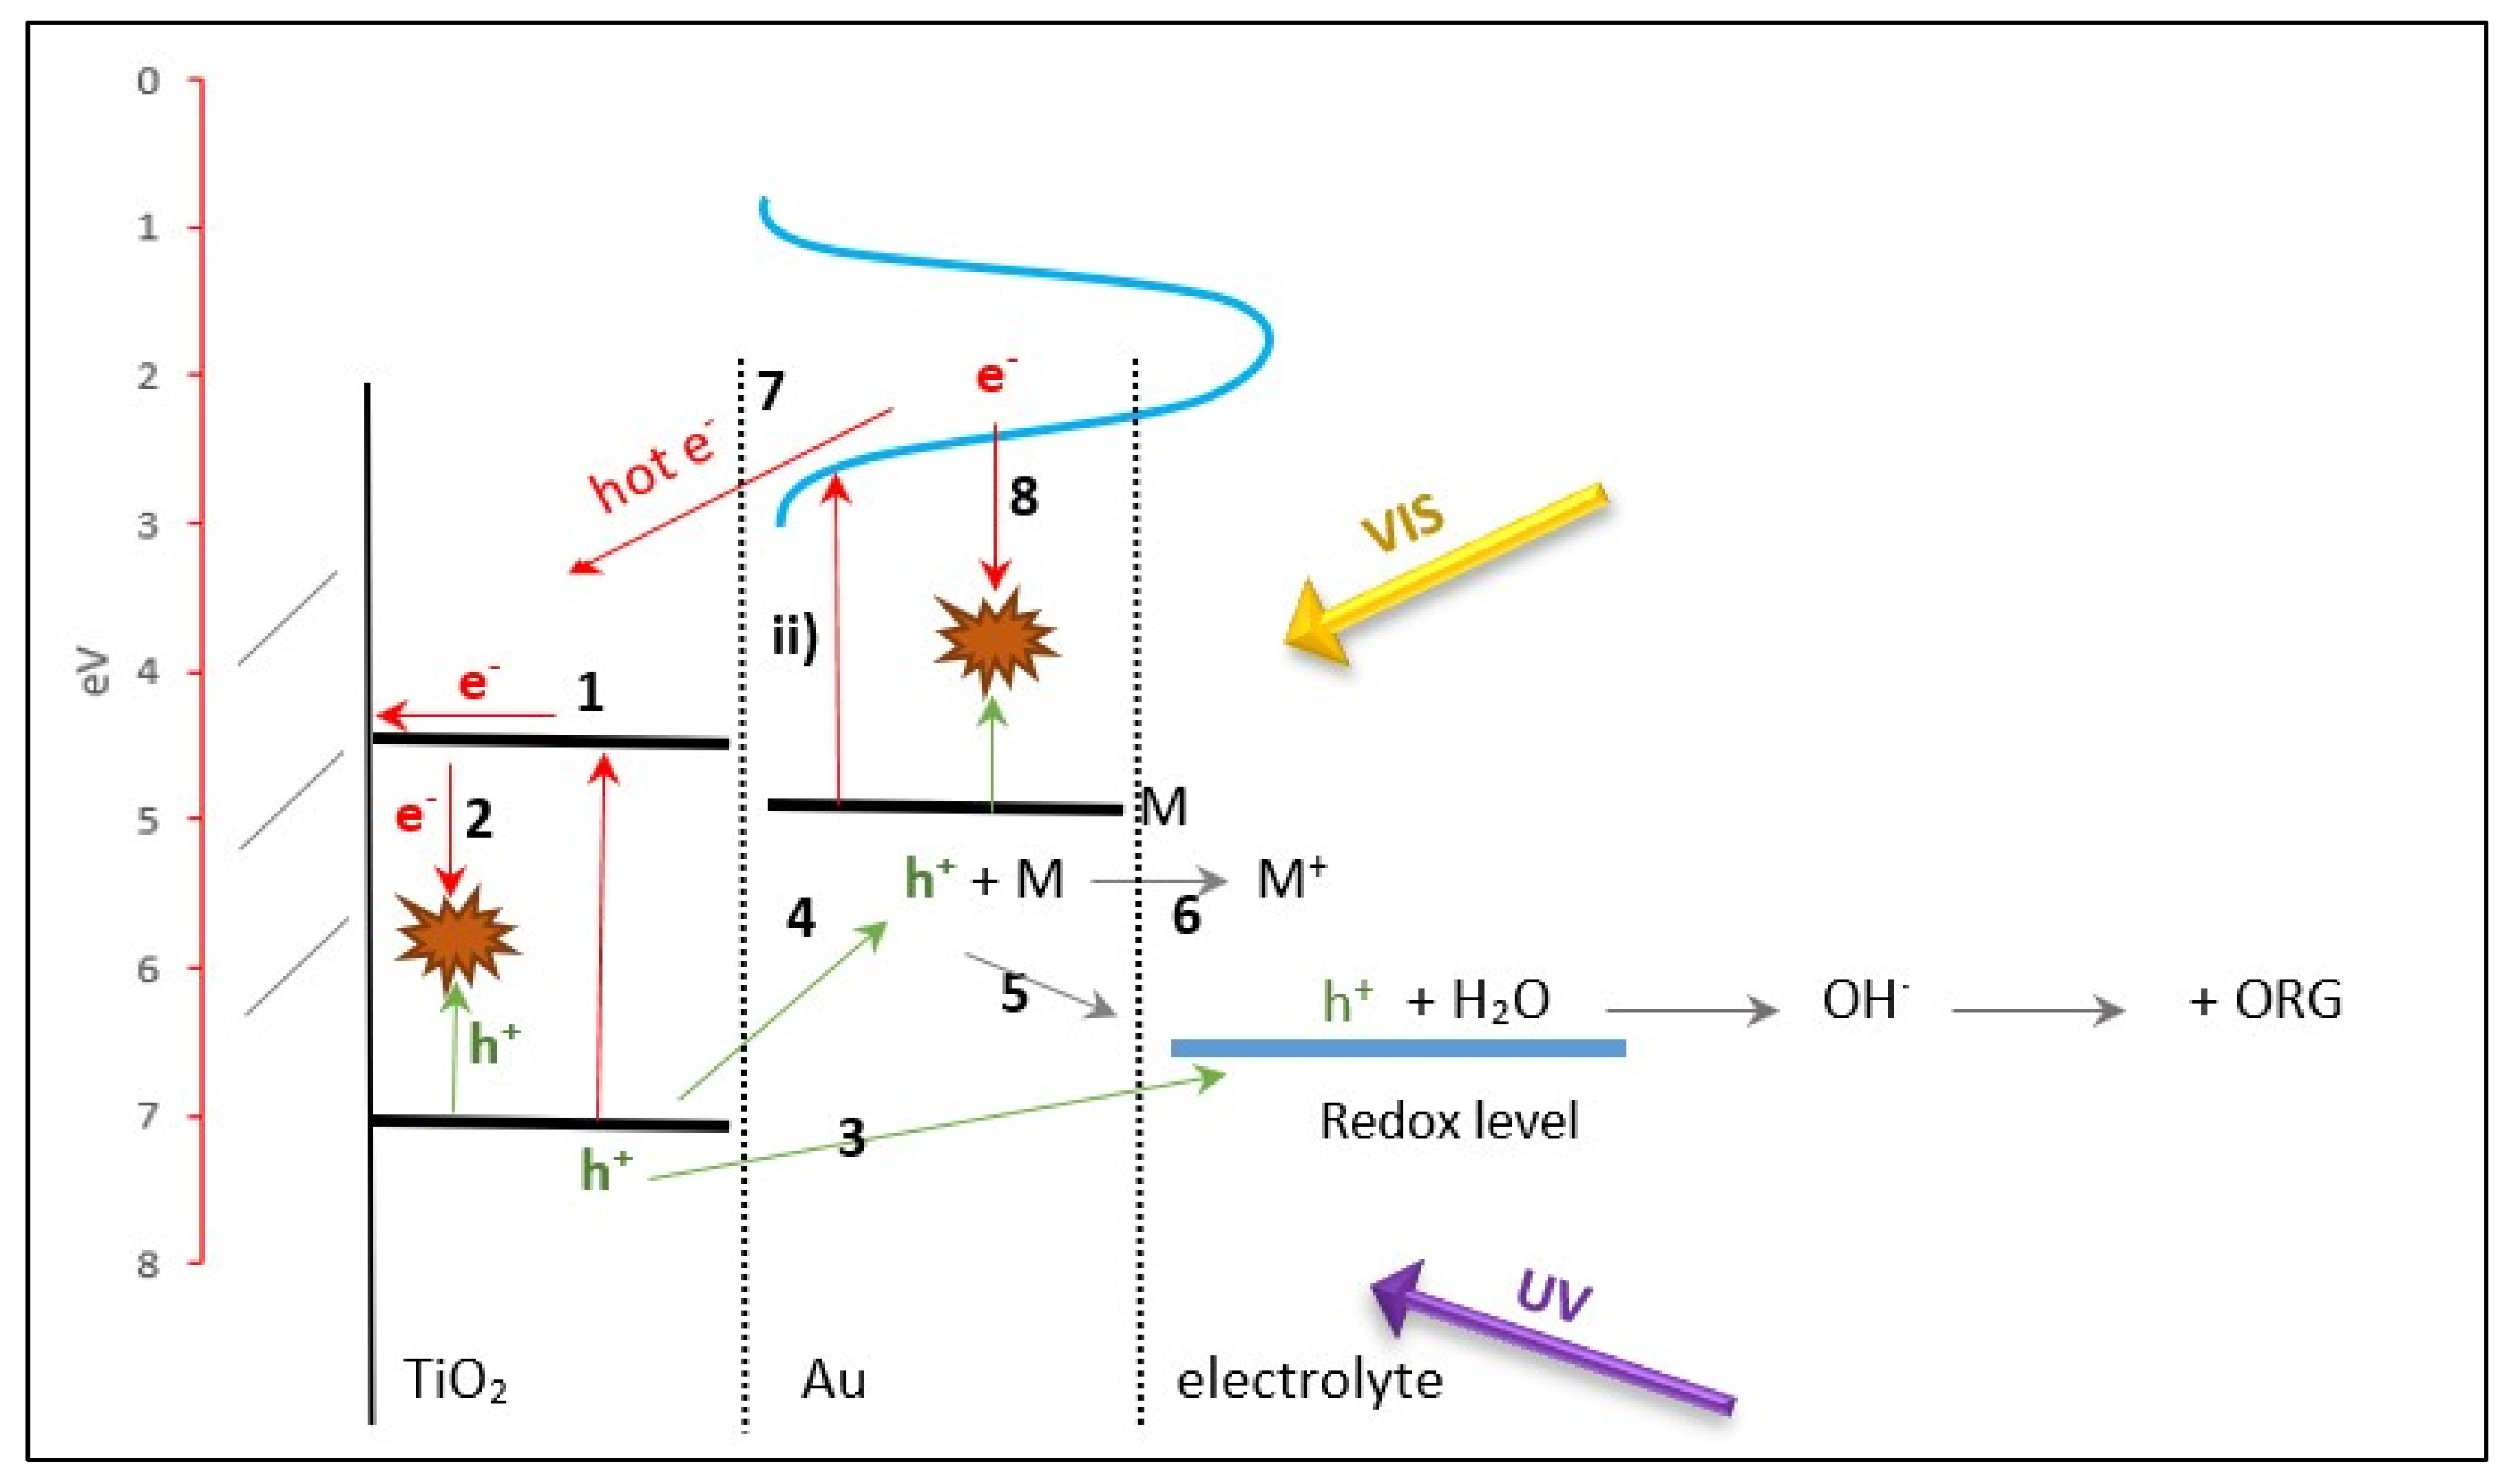
2.4. Analysis of the Working Mechanism of the Structures
- e− are excited in CB and, assisted by the applied potential, they may:
- (1)
- go to the cathode (and react with dissolved O2, or with H2O to give H2)
- (2)
- recombine with h+
- holes that do not recombine are displaced on the surface and they may:
- (3)
- react with the electrolyte (oxidising it)
- (4)
- be transferred to the M (depending on the WF)
- holes arriving at the M may:
- (5)
- be transferred to the electrolyte (in this case, not compatible with the redox level)
- (6)
- oxidise the M (corrosion).
- (i)
- scattering effects, able to redistribute radiation in the whole film thickness thus favoring light interaction with the photoanode (this effect is dominated by NPs of great dimensions, not indicated in the scheme),
- (ii)
- resonant absorption by the localized surface plasmon resonance of the NP (centered in the visible light (VIS) range) with subsequent generation of hot electrons which may:
- (7)
- be injected into the CB of the SC (then paths 1, 2)
- (8)
- decay and thermalize through electron–electron and electron–phonon scattering.
3. Materials and Methods
4. Conclusions
Author Contributions
Funding
Conflicts of Interest
References
- Careghini, A.; Mastorgio, A.F.; Saponaro, S.; Sezenna, E. Bisphenol A, nonylphenols, benzophenones, and benzotriazoles in soils, groundwater, surface water, sediments, and food: A review. Environ. Sci. Pollut. Res. 2015, 22, 5711–5741. [Google Scholar] [CrossRef] [PubMed]
- Industry Experts. Bisphenol A—A global market overview. 2016. Available online: http://industry-experts.com/verticals/files/articles/cp021-bisphenol-a-a-global-market-overview.pdf (accessed on 3 April 2019).
- Petrie, B.; Lopardo, L.; Proctor, K.; Youdan, J.; Barden, R.; Kasprzyk-Hordern, B. Assessment of bisphenol-A in the urban water cycle. Sci. Total Environ. 2019, 650, 900–907. [Google Scholar] [CrossRef] [PubMed]
- Guerra, P.; Kim, M.; Teslic, S.; Alaee, M.; Smyth, S.A. Bisphenol-A removal in various wastewater treatment processes: Operational conditions, mass balance, and optimization. J. Environ. Manag. 2015, 152, 192–200. [Google Scholar] [CrossRef] [PubMed]
- Flint, S.; Markle, T.; Thompson, S.; Wallace, E. Bisphenol A exposure, effects, and policy: A wildlife perspective. J. Environ. Manag. 2012, 104, 19–34. [Google Scholar] [CrossRef] [PubMed]
- Zhan, M.; Yang, X.; Xian, Q.; Kong, L. Photosensitized degradation of bisphenol A involving reactive oxygen species in the presence of humic substances. Chemosphere 2006, 63, 378–386. [Google Scholar] [CrossRef]
- Zhang, C.; Zeng, G.; Yuan, L.; Yu, J.; Li, J.; Huang, G.; Xi, B.; Liu, H. Aerobic degradation of bisphenol A by Achromobacter xylosoxidans strain B-16 isolated from compost leachate of municipal solid waste. Chemosphere 2007, 68, 181–190. [Google Scholar] [CrossRef]
- Žerjav, G.; Kaplan, R.; Pintar, A. Catalytic wet air oxidation of bisphenol A aqueous solution in trickle-bed reactor over single TiO2 polymorphs and their mixtures. J. Environ. Chem. Eng. 2018, 6, 2148–2158. [Google Scholar] [CrossRef]
- Davididou, K.; Nelson, R.; Monteagudo, J.M.; Durán, A.; Expósito, A.J.; Chatzisymeon, E. Photocatalytic degradation of bisphenol-A under UV-LED, blacklight and solar irradiation. J. Clean. Prod. 2018, 203, 13–21. [Google Scholar] [CrossRef]
- Blanco-Vega, M.P.; Guzmán-Mar, J.L.; Villanueva-Rodríguez, M.; Maya-Treviño, L.; Garza-Tovar, L.L.; Hernández-Ramírez, A.; Hinojosa-Reyes, L. Photocatalytic elimination of bisphenol A under visible light using Ni-doped TiO2 synthesized by microwave assisted sol-gel method. Mater. Sci. Semicond. Process. 2017, 71, 275–282. [Google Scholar] [CrossRef]
- Repousi, V.; Petala, A.; Frontistis, Z.; Antonopoulou, M.; Konstantinou, I.; Kondarides, D.I.; Mantzavinos, D. Photocatalytic degradation of bisphenol A over Rh/TiO2 suspensions in different water matrices. Catal. Today 2017, 284, 59–66. [Google Scholar] [CrossRef]
- Frontistis, Z.; Daskalaki, V.M.; Katsaounis, A.; Poulios, I.; Mantzavinos, D. Electrochemical enhancement of solar photocatalysis: Degradation of endocrine disruptor bisphenol-A on Ti/TiO2 films. Water Res. 2011, 45, 2996–3004. [Google Scholar] [CrossRef] [PubMed]
- Brugnera, M.F.; Rajeshwar, K.; Cardoso, J.C.; Zanoni, M.V.B. Bisphenol A removal from wastewater using self-organized TiO2 nanotubular array electrodes. Chemosphere 2010, 78, 569–575. [Google Scholar] [CrossRef] [PubMed]
- Serra-Pérez, E.; Álvarez-Torrellas, S.; Águeda, V.I.; Delgado, J.A.; Ovejero, G.; García, J. Insights into the removal of bisphenol A by catalytic wet air oxidation upon carbon nanospheres-based catalysts: Key operating parameters, degradation intermediates and reaction pathway. Appl. Surf. Sci. 2019, 473, 726–737. [Google Scholar] [CrossRef]
- Nguyen, T.B.; Huang, C.P.; Doong, R. Photocatalytic degradation of bisphenol A over a ZnFe2O4/TiO2 nanocomposite under visible light. Sci. Total Environ. 2019, 646, 745–756. [Google Scholar] [CrossRef] [PubMed]
- Xu, L.; Yang, L.; Johansson, E.M.J.; Wang, Y.; Jin, P. Photocatalytic activity and mechanism of bisphenol a removal over TiO2-x/rGo nanocomposite driven by visible light. Chem. Eng. J. 2018, 350, 1043–1055. [Google Scholar] [CrossRef]
- Abdelraheem, W.H.M.; Patil, M.K.; Nadagouda, M.N.; Dionysiou, D.D. Hydrothermal synthesis of photoactive nitrogen- and boron- codoped TiO2 nanoparticles for the treatment of bisphenol A in wastewater: Synthesis, photocatalytic activity, degradation byproducts and reaction pathways. Appl. Catal. B 2019, 241, 598–611. [Google Scholar] [CrossRef]
- Mais, L.; Mascia, M.; Palmas, S.; Vacca, A. Photoelectrochemical oxidation of phenol with nanostructured TiO2 -PANI electrodes under solar light irradiation. Sep. Purif. Technol. 2019, 208, 153–159. [Google Scholar] [CrossRef]
- Palmas, S.; Castresana, P.A.; Mais, L.; Vacca, A.; Mascia, M.; Ricci, P.C. TiO2 -WO3 nanostructured systems for photoelectrochemical applications. RSC Adv. 2016, 6, 101671–101682. [Google Scholar] [CrossRef]
- Palmas, S.; Mascia, M.; Vacca, A.; Llanos, J.; Mena, E. Analysis of photocurrent and capacitance of TiO2 nanotube–Polyaniline hybrid composites synthesized through electroreduction of an aryldiazonium salt. RSC Adv. 2014, 4, 23957–23965. [Google Scholar] [CrossRef]
- Matarrese, R.; Nova, I.; Li Bassi, A.; Casari, C.S.; Russo, V.; Palmas, S. Preparation and optimization of TiO2 photoanodes fabricated by pulsed laser deposition for photoelectrochemical water splitting. J. Solid State Electrochem. 2017, 21, 3139–3154. [Google Scholar] [CrossRef]
- Ghidelli, M.; Mascaretti, L.; Bricchi, B.R.; Zapelli, A.; Russo, V.; Casari, C.S.; Li Bassi, A. Engineering plasmonic nanostructured surfaces by pulsed laser deposition. Appl. Surf. Sci. 2018, 434, 1064–1073. [Google Scholar] [CrossRef]
- Bricchi, B.R.; Ghidelli, M.; Mascaretti, L.; Zapelli, A.; Russo, V.; Casari, C.S.; Terraneo, G.; Alessandri, I.; Ducati, C.; Li Bassi, A. Integration of plasmonic Au nanoparticles in TiO2 hierarchical structures in a single-step pulsed laser co-deposition. Mater. Des. 2018, 156, 311–319. [Google Scholar] [CrossRef]
- Atwater, H.A.; Polman, A. Plasmonics for improved photovoltaic devices. Nat. Mater. 2010, 9, 205–213. [Google Scholar] [CrossRef] [PubMed]
- Mascaretti, L.; Dutta, A.; Kment, S.; Shalaev, V.M.; Boltasseva, A.; Zboril, R.; Naldoni, A. Plasmon-Enhanced Photoelectrochemical Water Splitting for Efficient Renewable Energy Storage. Adv. Mater. 2019. [Google Scholar] [CrossRef] [PubMed]
- Pu, Y.; Wang, G.; Chang, K.; Ling, Y.; Lin, Y.; Fitzmorris, B.C.; Liu, C.; Lu, X.; Tong, Y.; Zhang, J.Z.; Hsu, Y.; et al. Au Nanostructure-Decorated TiO2 Nanowires Exhibiting Photoactivity Across Entire UV-visible Region for Photoelectrochemical Water Splitting. Nano Lett. 2013, 13, 3817–3823. [Google Scholar] [CrossRef] [PubMed]
- Naseri, N.; Sangpour, P.; Mousavi, S.H. Applying alloyed metal nanoparticles to enhance solar assisted water splitting. RSC Adv. 2014, 4, 46697–46703. [Google Scholar] [CrossRef]
- Cojocaru, B.; Andrei, V.; Tudorache, M.; Lin, F.; Cadigan, C.; Richards, R.; Parvulescu, V.I. Enhanced photo-degradation of bisphenol pollutants onto gold-modified photocatalysts. Catal. Today 2017, 284, 153–159. [Google Scholar] [CrossRef]
- Fu, P.; Zhang, P. Uniform dispersion of Au nanoparticles on TiO2 film via electrostatic self-assembly for photocatalytic degradation of bisphenol A. Appl. Catal. B 2010, 96, 176–184. [Google Scholar] [CrossRef]
- Li, X.Z.; He, C.; Graham, N.; Xiong, Y. Photoelectrocatalytic degradation of bisphenol A in aqueous solution using a Au-TiO2/ITO film. J. Appl. Electrochem. 2005, 35, 741–750. [Google Scholar] [CrossRef]
- Sreedhar, A.; Reddy, I.N.; Kwon, J.H.; Yi, J.; Sohn, Y.; Gwag, J.S.; Noh, J.-S. Charge carrier generation and control on plasmonic Au clusters functionalized TiO2 thin films for enhanced visible light water splitting activity. Ceram. Int. 2018, 44, 18978–18986. [Google Scholar] [CrossRef]
- Morfa, A.J.; Rowlen, K.L.; Reilly, T.H.; Romero, M.J.; van de Lagemaat, J. Plasmon-enhanced solar energy conversion in organic bulk heterojunction photovoltaics. Appl. Phys. Lett. 2008, 92, 013504. [Google Scholar] [CrossRef]
- Stuart, H.R.; Hall, D.G. Island size effects in nanoparticle-enhanced photodetectors. Appl. Phys. Lett. 1998, 73, 3815. [Google Scholar] [CrossRef]
- Schaadt, D.M.; Feng, B.; Yu, E.T. Enhanced semiconductor optical absorption via surface plasmon excitation in metal nanoparticles. Appl. Phys. Lett. 2005, 86, 063106. [Google Scholar] [CrossRef]
- Di Fonzo, F.; Casari, C.S.; Russo, V.; Brunella, M.F.; Li Bassi, A.; Bottani, C.E. Hierarchically organized nanostructured TiO2 for photocatalysis applications. Nanotechnology 2009, 20, 015604. [Google Scholar] [CrossRef] [PubMed]
- Passoni, L.; Ghods, F.; Docampo, P.; Abrusci, A.; Martí-Rujas, J.; Ghidelli, M.; Divitini, G.; Ducati, C.; Binda, M.; Guarnera, S.; et al. Hyperbranched Quasi-1D Nanostructures for Solid-State Dye-Sensitized Solar Cells. ACS Nano 2013, 7, 10023–10031. [Google Scholar] [CrossRef] [PubMed]
- Palmas, S.; Polcaro, A.M.; Rodriguez Ruiz, J.; Da Pozzo, A.; Vacca, A.; Mascia, M.; Delogu, F.; Ricci, P.C. Effect of the mechanical activation on the photoelectrochemical properties of anatase powders. Int. J. Hydrogen Energy 2009, 34, 9662–9670. [Google Scholar] [CrossRef]
- Kavan, L.; Grätzel, M. Highly efficient semiconducting TiO2 photoelectrodes prepared by aerosol pyrolysis. Electrochim. Acta 1995, 40, 643–652. [Google Scholar] [CrossRef]
- Van de Krol, R.; Grätzel, M. Photoelectrochemical Hydrogen Production; Springer: New York, NY, USA, 2012; p. 324. Available online: https://www.springer.com/us/book/9781461413790 (accessed on 3 April 2019).
- Nakato, Y.; Tsubomura, H. The Photoelectrochemical Behavior of an n-TiO2 Electrode Coated with a Thin Metal Film, as Revealed by Measurements of the Potential of the Metal Film. Isr. J. Chem. 1982, 22, 180–183. [Google Scholar] [CrossRef]
- Nakato, Y.; Ueda, K.; Yano, H.; Tsubomura, H. Effect of Microscopic Discontinuity of Metal Overlayers on the Photovoltages in Metal-Coated Semiconductor-Liquid Junction Photoelectrochemical Cells for Efficient Solar Energy Conversion. J. Phys. Chem. 1988, 92, 2316–2324. [Google Scholar] [CrossRef]
- Fan, Z.; Fan, L.; Shuang, S.; Dong, C. Highly sensitive photoelectrochemical sensing of bisphenol A based on zinc phthalocyanine/TiO2 nanorod arrays. Talanta 2012, 189, 16–23. [Google Scholar] [CrossRef]
- Palmas, S.; Da Pozzo, A.; Mascia, M.; Vacca, A.; Ricci, P.C.; Matarrese, R. On the redox behaviour of glycerol at TiO2 electrodes. J. Solid State Electrochem. 2012, 16, 2493–2502. [Google Scholar] [CrossRef]
- Rodriguez, P.; Plana, D.; Fermin, D.J.; Koper, M.T.M. New insights into the catalytic activity of gold nanoparticles for CO oxidation in electrochemical media. J. Catal. 2014, 311, 182–189. [Google Scholar] [CrossRef] [Green Version]
- Naldoni, A.; Altomare, M.; Zoppellaro, G.; Liu, N.; Kment, S.; Zboril, R.; Schmuki, P. Photocatalysis with Reduced TiO2: From Black TiO2 to Cocatalyst-Free Hydrogen Production. ACS Catal. 2019, 9, 354–364. [Google Scholar] [CrossRef] [PubMed]
- Radecka, M.; Wierzbicka, M.; Komornicki, S.; Rekas, M. Influence of Cr on photoelectrochemical properties of TiO2 thin films. Phys. B 2004, 348, 160–168. [Google Scholar] [CrossRef]
- Hagfeldt, A.; Lindström, H.; Södergren, S.; Lindquist, S.-E. Photoelectrochemical studies of colloidal TiO2 films: The effect of oxygen studied by photocurrent transients. J. Electroanal. Chem. 1995, 381, 39–46. [Google Scholar] [CrossRef]
- Rhoderick, E.H.; Willams, R.H. Metal-Semiconductor Contacts, 2nd ed.; Oxford University Press: Oxford, UK, 1988; p. 252. [Google Scholar]
- Scanlon, M.D.; Peljo, P.; Méndez, M.A.; Smirnov, E.; Girault, H.H. Charging and discharging at the nanoscale: Fermi level equilibration of metallic nanoparticles. Chem. Sci. 2015, 6, 2705–2720. [Google Scholar] [CrossRef] [PubMed] [Green Version]
- Liu, H.; Tang, J.; Kramer, I.J.; Debnath, R.; Koleilat, G.I.; Wang, X.; Fisher, A.; Li, R.; Brzozowski, L.; Levina, L.; et al. Electron acceptor materials engineering in colloidal quantum dot solar cells. Adv. Mater. 2011, 23, 3832–3837. [Google Scholar] [CrossRef] [PubMed]
- Awazu, K.; Fujimaki, M.; Rockstuhl, C.; Tominaga, J.; Murakami, H.; Ohki, Y.; Yoshida, N.; Watanabe, T. A Plasmonic Photocatalyst Consisting of Silver Nanoparticles Embedded in Titanium Dioxide. J. Am. Chem. Soc. 2008, 130, 1676–1680. [Google Scholar] [CrossRef]


| Sample | Description | Au% Vol. | |
|---|---|---|---|
| TiO2 | TiO2 film on Ti substrate (Reference) |  | 0 |
| TiO2/Au | Au nanoparticles (NPs) at the bottom of the TiO2 film |  | 1 |
| Au/TiO2 | Au NPs on the top of the TiO2 film |  | 1.5 |
| Au/TiO2/Au | Au NPs both at the bottom and on top of the TiO2 film |  | 2.5 |
| TiO2–Au | Au-integrated TiO2 films |  | ~3.3 |
| Sample | Haze Factor (%) 400–800 nm Range | Haze Factor (%) 800–2000 nm Range |
|---|---|---|
| Au/TiO2/Au | 80 | 32 |
| TiO2/Au | 58 | 22 |
| TiO2 | 23 | Negligible (< 10%) |
| Au/TiO2 | 16 | Negligible (< 10%) |
| TiO2–Au | 11 | Negligible (< 10%) |
| Sample | OCV KNO3 V/vs SCE | OCV pH 13 V/vs SCE | OCV pH 13 Nernstian V/vs SCE |
|---|---|---|---|
| TiO2 | −0.14 | −0.42 | −0.49 |
| TiO2/Au | 0.033 | −0.11 | −0.32 |
| Au/TiO2 | −0.115 | −0.26 | −0.47 |
| Au/TiO2/Au | 0.022 | −0.12 | −0.33 |
| TiO2–Au | −0.001 | −0.13 | −0.35 |
| 0.1 M KNO3 | 25 ppm BPA | 50 ppm BPA | 100 ppm BPA | |
|---|---|---|---|---|
| TiO2 | 18 | 36 | 50 | 36 |
| TiO2/Au | 32 | 40 | 55 | 36 |
| Au/TiO2 | 25 | 34 | 27 | 39 |
| Au/TiO2/Au | 48 | 44 | 58 | 52 |
| TiO2–Au | 1.4 | 1.9 | 3 | 1.9 |
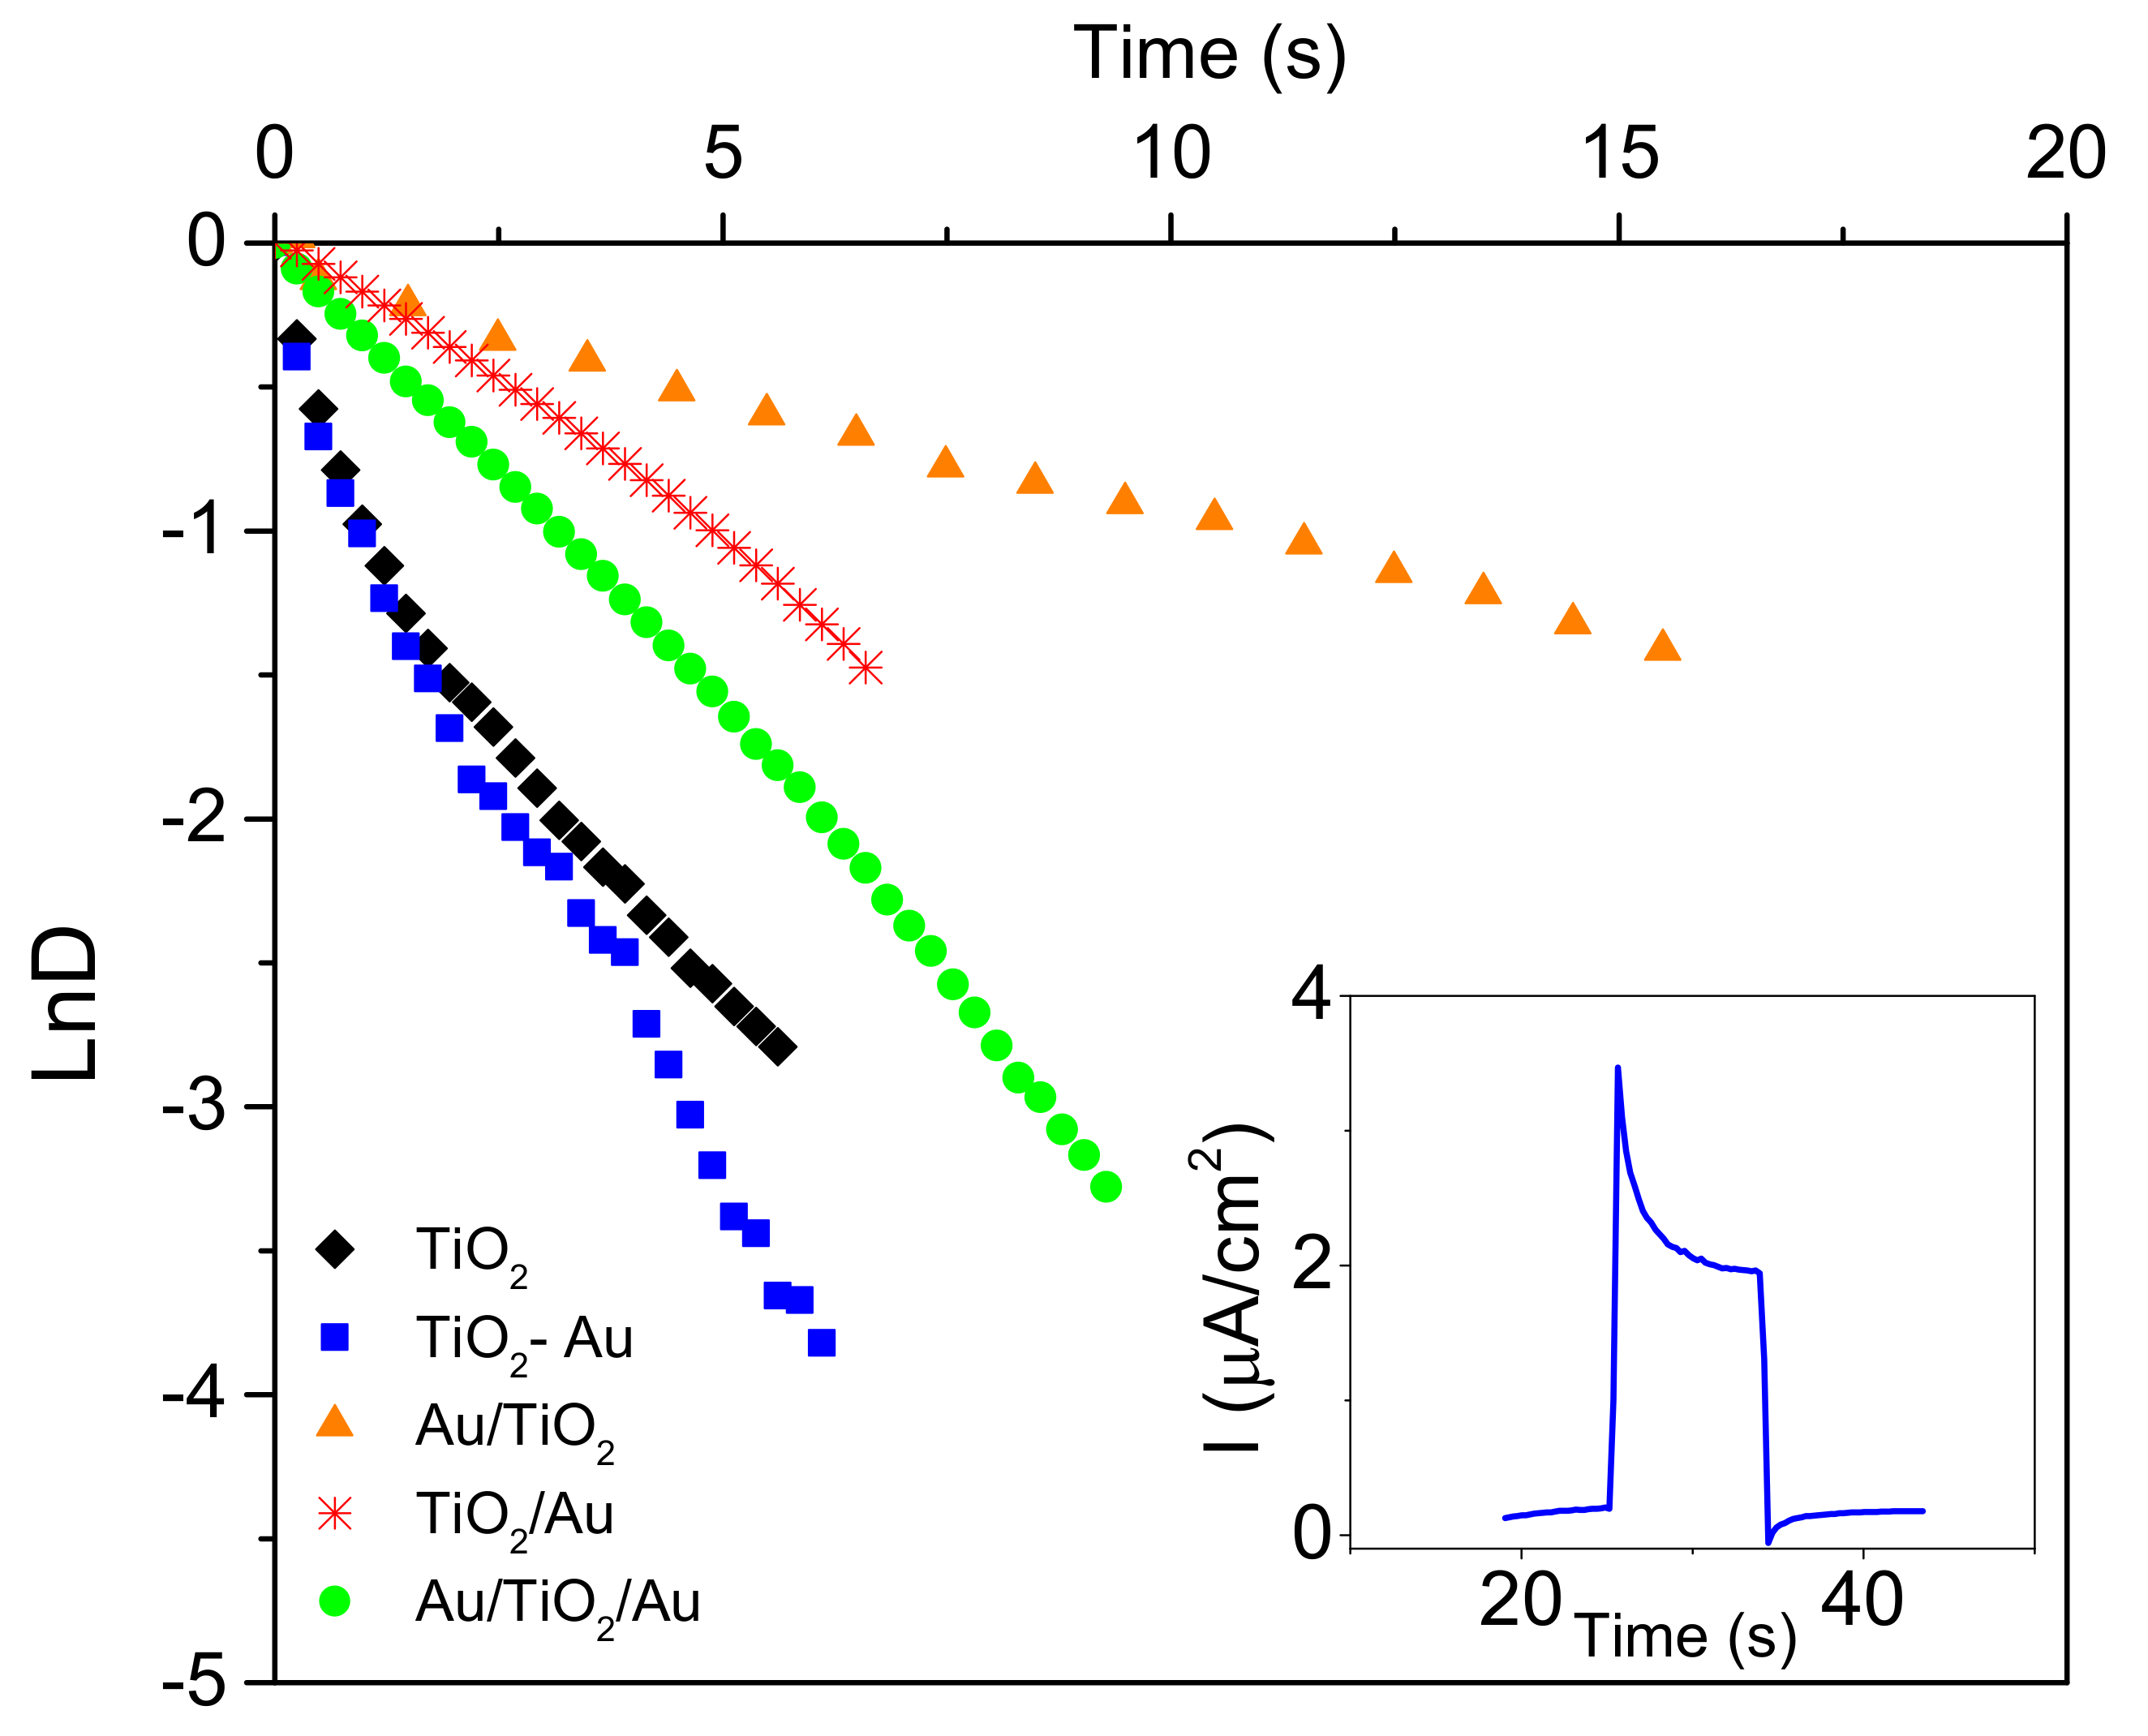
| TiO2 | TiO2/Au | Au/TiO2/Au | TiO2–Au | Au/TiO2 | |
|---|---|---|---|---|---|
| τ (s) | 0.97 | 4.88 | 3.17 | 0.97 | 10.5 |
© 2019 by the authors. Licensee MDPI, Basel, Switzerland. This article is an open access article distributed under the terms and conditions of the Creative Commons Attribution (CC BY) license (http://creativecommons.org/licenses/by/4.0/).
Share and Cite
Matarrese, R.; Mascia, M.; Vacca, A.; Mais, L.; Usai, E.M.; Ghidelli, M.; Mascaretti, L.; Bricchi, B.R.; Russo, V.; Casari, C.S.; et al. Integrated Au/TiO2 Nanostructured Photoanodes for Photoelectrochemical Organics Degradation. Catalysts 2019, 9, 340. https://doi.org/10.3390/catal9040340
Matarrese R, Mascia M, Vacca A, Mais L, Usai EM, Ghidelli M, Mascaretti L, Bricchi BR, Russo V, Casari CS, et al. Integrated Au/TiO2 Nanostructured Photoanodes for Photoelectrochemical Organics Degradation. Catalysts. 2019; 9(4):340. https://doi.org/10.3390/catal9040340
Chicago/Turabian StyleMatarrese, Roberto, Michele Mascia, Annalisa Vacca, Laura Mais, Elisabetta M. Usai, Matteo Ghidelli, Luca Mascaretti, Beatrice R. Bricchi, Valeria Russo, Carlo S. Casari, and et al. 2019. "Integrated Au/TiO2 Nanostructured Photoanodes for Photoelectrochemical Organics Degradation" Catalysts 9, no. 4: 340. https://doi.org/10.3390/catal9040340