Photocatalytic Hydrogen Production Under Near-UV Using Pd-Doped Mesoporous TiO2 and Ethanol as Organic Scavenger

Chemical Reactor Engineering Centre (CREC), Faculty of Engineering, Western University, London, ON N6A 5B9, Canada
*
Author to whom correspondence should be addressed.
Catalysts 2019, 9(1), 33; https://doi.org/10.3390/catal9010033
Submission received: 20 November 2018
/
Revised: 14 December 2018
/
Accepted: 21 December 2018
/
Published: 2 January 2019
(This article belongs to the Special Issue Emerging Trends in TiO2 Photocatalysis and Applications)
Abstract
:Photocatalysis can be used advantageously for hydrogen production using a light source (near-UV light), a noble metal-doped semiconductor and an organic scavenger (2.0 v/v% ethanol). With this end, palladium was doped on TiO2 photocatalysts at different metal loadings (0.25 to 5.00 wt%). Photocatalysts were synthetized using a sol-gel method enhancing morphological properties with a soft template precursor. Experiments were carried out in the Photo-CREC Water II reactor system developed at CREC-UWO (Chemical Reactor Engineering Centre- The University of Western Ontario) Canada. This novel unit offers hydrogen storage and symmetrical irradiation allowing precise irradiation measurements for macroscopic energy balances. Hydrogen production rates followed in all cases a zero-order reaction, with quantum yields as high as 30.8%.
1. Introduction
Hydrogen is a key energy carrier that will likely play an important role in the transportation sector by 2050 [1]. It is considered an environmentally friendly energy vector due to its zero CO2 and zero noxious gas emissions when combusted [2]. Through a photocatalytic water-splitting process, hydrogen can be produced using water and a light source as primary resources [3]. Furthermore, a sacrificial organic agent is required to allow the photocatalytic reaction to occur, forming the desired products [4].
Common sacrificial agents include methanol, triethanolamine, ethanol, acids and inorganic compounds [5]. Ethanol, as one of the most-investigated sacrificial agents, provides high quantum efficiencies and will be used in this work as scavenger. The use of ethanol as a sacrificial agent is advantageous given that it can be easily produced from renewable biomass (fermentation processes), making it available and inexpensive [6].
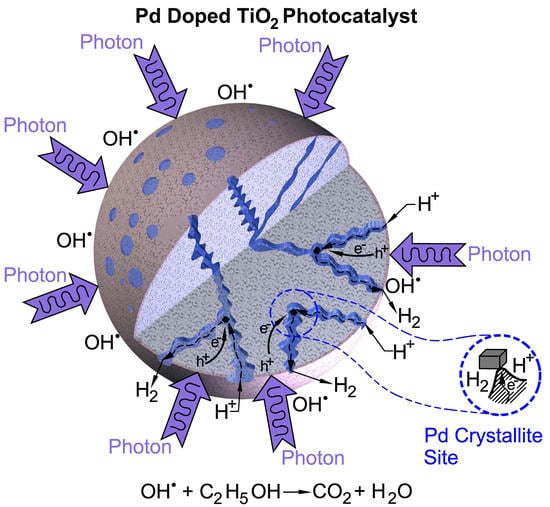
Photocatalytic hydrogen production with sacrificial organic agents proceeds as follows: (a) absorbed photons surpass the energy band gap and generate excited electron-hole pairs [7], and (b) photoexcited electron-hole pairs can be separated due to the sacrificial agent presence. This allows the formation of hydrogen with minimum electron-hole pair recombination [8] and (c) hydroxyl groups from dissociated water lead OH· radical formation and contribute to the conversion of the scavenger [9]. The “in-series-parallel” reaction network was described in detailed by our research team in [10].
Titanium dioxide (TiO2) is a well-known photocatalyst capable of absorbing light and producing electron-hole pairs to accelerate the rate of a water-splitting reaction [11]. TiO2 has been the most used material due to its stability, resistance to corrosion, cleanliness (no pollutant), availability in nature and inexpensiveness compared to other semiconductors [12]. It can be found in three allotropic phases—anatase, rutile, and brookite—where the anatase phase is the most photoactive phase reported [13]. Doping noble metals on TiO2 allows (a) increasing the efficiency of the hydrogen evolution reaction, (b) narrowing the band gaps, and (c) improving the optoelectronic semiconductor properties [14]. Furthermore, doping TiO2 with noble metals such as Pd helps to promote energy levels near the band edges or mid-gap states, which may reduce the effective bandgap energy [15]. Therefore, the effect of Pd on TiO2 can be attributed to the shift of Fermi levels in the composite material [16,17,18,19,20].
One of the most important parameters in photocatalytic reactors and photocatalysts is the quantum yield (QY). This parameter establishes the process efficiency relating the photogenerated radical rate over the absorbed photons rate [21]. Using the QY, the doped photocatalysts of the present study were evaluated.
Previous studies by our research team considered Pt doped on TiO2 obtaining modest quantum yield efficiencies in the 0.7–8.0% range when using undoped DP-25 and 1.0% Pt-impregnated DP-25, respectively [22]. However, the present work emphasizes the photocatalytic hydrogen production using doped Pd, as a much less expensive dopant on mesoporous TiO2. This semiconductor material, Pd–TiO2, is employed under near-UV light, in the Photo-CREC Water II reactor unit developed at CREC (Chemical Reactor Engineering Centre). Results obtained are of significant value due to the high quantum yields obtained in the system.
2. Results and Discussion
2.1. Photocatalyst Characterization
2.1.1. Brunauer–Emmett–Teller (BET) Surface Area
Using a BET surface area unit (Micrometrics, ASAP 2010), the photocatalysts were analyzed with nitrogen. Furthermore, the adsorption–desorption isotherms of type IV were generated and the Vp total photocatalyst pore volume was also calculated with the liquid nitrogen adsorbed at the P/Po relative pressure of 0.99 [23]. Table 1 reports the specific surface area, the average pore diameter and the specific pore volume for mesoporous TiO2 prepared using F-127 template. It is shown that when using this template, the morphological properties of TiO2 are improved as follows: (a) specific surface areas are increased, (b) average pore diameters are augmented, and (c) specific pore volumes are increased. Furthermore, one can also notice that the F-127–TiO2, displays both higher porosity and specific surface area than the TiO2 itself.
According to Table 2, the best results in specific surface area were obtained with the mesoporous TiO2 photocatalysts. These photocatalysts display a clear increment of the specific surface area and specific pore volume (Dp) when compared to Degussa P-25 (commercial titania photocatalyst that is commonly used in photocatalytic reactions). However, when using doped Pd on TiO2, there was a modest reduction in specific surface area and a mild change in pore diameter attributed to a possible and moderate blocking of the TiO2 pores with Pd [24].
The Barrett–Joyner–Halenda (BJH) method was also used to determine the pore size distribution, by utilizing N2 as an adsorbate and as a desorption isotherm. In all cases, a bimodal pore volume distribution was observed. The largest pore sizes in the 16–35 nm range were achieved with F-127–1.0 wt% Pd–TiO2-500 °C.
2.1.2. Pulse Hydrogen Chemisorption
Table 3 reports hydrogen chemisorption showing the effect of metal loading on metal dispersion. When Pd is used as a dopant, it is shown that higher metal loadings lead to reduced metal dispersion.
2.1.3. X-Ray Diffraction (XRD)
Figure 1 reports XRD diffractograms for TiO2 synthesized using the F-127 template and with varying palladium loadings. Anatase and rutile XRDs are reported as references. In this respect, one can observe that anatase peaks are at the 2θ diffraction angles of 25°, 38°, 48°, 54°, 63°, 69°, 70.5° and 75° corresponding to the planes (101), (004), (200), (105), (204), (116), (220) and (215) [JCPDS No. 73-1764]. For rutile, there are a couple of noticeable peaks at 54° and 67° corresponding to the planes (201) and (301) [JCPDS No. 34-0180].
Furthermore, Figure 1 also shows that the XRD diffractograms for Pd-doped TiO2 were consistent where a significant anatase XRD peak was observed. The nature of the desirable anatase peaks in this semiconductor was confirmed with a 99.7% anatase from Aldrich reference sample [25]. Anatase for all photocatalyst was the dominant TiO2 crystalline phase assumed as 100% with no rutile being present.
Pd peaks were also identified and recorded at 40.12° (111) and 46.66° (200) at the 2θ angles [JCPDS No. 87-0638]. One should observe that, in principle, a third peak at 2θ = 68.1° (220) might be recorded when using Pd as a dopant. However, this peak may overlap with anatase and as a result cannot be used for Pd identification [26].
On the other hand, the crystallite sizes for each photocatalyst were determined using the Scherrer equation. On this basis, the mesoporous photocatalysts displayed crystallite sizes between 9 and 14 nm. Lattice parameters of the tetragonal anatase unit cell were also calculated and are reported in Appendix B.
2.1.4. Band Gap
Figure 2 reports that increasing the Pd content slightly augments the band gap. However, and regarding the observed results, one can see in all cases a significant reduction in the band gaps for TiO2 doped with lower Pd loadings versus the band gaps for undoped TiO2. The best band gaps achieved were 2.51 for 0.25 wt% Pd and 2.55 eV for 0.50–1.00 wt% Pd–TiO2.
By applying the Kubelka–Munk (K–M) model and following the Tauc plot methodology, the band gaps were determined. Figure 3 reports the changes of the “(αhv)1/2” function versus the photon energy “hν”, with α representing the absorption coefficient, h being the Planck constant (6.34 × 1034 J s/photon) and v denoting the radiation frequency. It should also be noted that v = c/λ, where c is the speed of light under vacuum (3.00 × 10⁸ m/s2). If the straight-line methodology is applied for the band gap calculation as shown with the red line, one can see that the intersection of this line with the abscissa provides the wavelength corresponding to the semiconductor band gap. Furthermore, the Tauc plots (Figure 3) were developed for Pd-doped TiO2 photocatalysts using the F-127 template and at a 500 °C calcination temperature.
2.1.5. X-Ray Photoelectron Spectroscopy (XPS)
The 1.0 wt% Pd–TiO2 photocatalyst was analyzed using the XPS technique. Figure 4 shows the XPS for Pd(0) and PdO. In each case, one can see double peaks as follows: (a) Pd (0) 3d5/2, with 334.70 eV and 3d3/2 at 339.96 eV binding energies, (b) PdO 3d5/2 with 336.46 eV and 3d3/2 at 341.72 eV. This yields a consistent 48.6% of Pd (0) and 51.4% of PdO, at the two binding energy ranges considered.
It was also observed that titanium and oxygen were present as major components in the photocatalyst mesoporous support as TiO2 species. Titanium was detected at a binding energy position of 454.45 eV, while oxygen was identified at 525.85 eV. These bands fell outside the Pd and PdO binding energies as shown in Figure 4, avoiding any possible inadequate band assignment.
In conclusion, the XPS data of Figure 4 shows the significant Pd (0) availability, and points towards possible future improvements of the synthesized photocatalyst via enhanced Pd reduction.
2.2. Macroscopic Radiation Energy Balance (MREB)
Photocatalytic reactors operate based on emitted photons. These photons are absorbed by a circulating semiconductor slurry suspension. To be able to establish the absorbed radiation in the Photo-CREC Water II Reactor, one must develop a macroscopic radiation balance for accurate energy efficiency calculations [27].
The macroscopic balance estimates the photons absorbed as the difference between the incident photons and the combined scattered and transmitted photons [28].
where Pa is the rate of absorbed photons, for which it is desired to be as high as possible; Pi is the rate of photons reaching the reactor at the inner Pyrex glass surface and is calculated according to Equation (1) in Einstein s−1; Pbs is the rate of backscattered photons; and Pt is the rate of transmitted photons. All these variables can be expressed using the Einstein s−1 units.
Furthermore:
with P0 in Einstein s−1 being the rate of photons emitted by the lamps as per Pa-wall in Einstein s−1, which accounts for the rate of backscattered photons absorbed by the Pyrex glass walls.
In addition, P0 can be calculated as:
where q (θ, z, λ) is the radiative flux (J s−1 m−3), λ represents the wavelength (nm), r stands for the radial coordinate (m), z denotes the axial coordinate (m), h is the Planck’s constant (J s), and c represents the speed of light (m s−1). The term q (θ, z, λ) is determined using the spectrometer.
Furthermore, when photocatalytic experiments are performed in the Photo-CREC Water II (PCW-II) reactor, photons are absorbed and scattered in the reacting medium. As a result, a backscattering has to be accounted for. A possible approach to calculate backscattering is to establish the difference between Pi and the rate of photons transmitted when the catalyst concentration approaches zero (Pt|C→0+):
Equation (4) assumes that photons are backscattered on the TiO2 particle layer close to the inner surface of the transparent Pyrex walls surface. Equation (4) also assumes that no other backscattered photons contribute to Pbs.
Additionally, for Pt determination, Equation (5) considers that transmitted radiation can be defined as the addition of normal scattered photons and forward scattered photons:
One should note that (Pfs + Pns) can be measured by employing aluminum polished collimators, which capture radiation reaching the measuring point, with large view angles [28].
Thus, to assess Pa as in Equation (1), macroscopic balances using near-UV light were established at the central axial position using a 0.15 g/L photocatalyst concentration. Figure 5 reports measurements for various TiO2 photocatalysts with different metal loadings.
According to Table 4 and Figure 5, one can observe that additions of Pd on TiO2 show that (a) lower Pd levels (0.25 to 1.00 wt%) lead to an increased Pa and high absorption efficiencies compared to undoped TiO2, and (b) higher Pd levels (2.50 and 5.00 wt% Pd) give smaller Pa and reduced absorption efficiency. These findings are in line with an increased rate of transmitted photons when using low Pd loadings as well as incremental photon backscattering when using high Pd loadings.
2.3. Hydrogen Production
2.3.1. Effect of Palladium Loadings
Palladium was used as co-catalyst to dope the structure of the TiO2 photocatalyst. This metal enhances the hydrogen production, as compared to the undoped mesoporous TiO2. Nobel metal crystallites reduce the band gap and facilitate electron capture [29]. As a result, Pd reduces the recombination between holes and electrons, promoting better photocatalytic water-splitting performances [30].
Figure 6 reports the influence of Pd on TiO2 in terms of cumulative hydrogen volume.
Figure 6 shows there is a maximum volume of 140 cm3 STP (standard temperature and pressure) of hydrogen produced in six hours when using 1.00 wt% Pd on TiO2. This volume is slightly higher than the maximum volume of hydrogen produced when using 0.25 wt% and 0.50 wt% Pd–TiO2, and three times the volume of hydrogen obtained for undoped TiO2. One should also note as well that this volume is close to the 128 cm3 STP of hydrogen produced when platinum is used as a dopant under the same reaction conditions but with a much larger metal loading (5.00 wt% Pt) on TiO2 [31].
Furthermore, one should note that the 140 cm3 STP of hydrogen produced in six hours with 1.00 wt% Pd on TiO2 decreased up to 60 cm3 STP when using higher Pd loadings (2.50 wt% Pd and 5.00 wt% Pd). The macroscopic radiation energy balance provides an explanation showing that at the higher Pd loadings, there is increased irradiation backscattering, with greater irradiation being reflected and, as a consequence, light absorption being reduced. This is in contrast with the lower than 1.00 wt% Pd loadings evaluated, where the absorption efficiency, as well as the rate of transmitted photons, increases. Thus, a diminished irradiation absorption given by 2.50 wt% Pd and 5.00 wt% Pd negatively affects the photocatalyst performance [32].
In agreement with this, at the lower palladium loadings studied (0.25, 0.50 and 1.00 wt%) good metal dispersion, mildly affected specific surface area and pore structure were achieved [33]. On the other hand, for 2.50 and 5.00 wt% Pd–TiO2, poorer metal dispersion with larger metal crystallite sizes were observed, with this being in line with the lower photocatalytic activity [34].
In all cases, palladium-doped TiO2 showed a consistent steady linear trend. The hydrogen production rate displayed consistent zero-order kinetics, with no noticeable photocatalytic decay. This material is stable for extended irradiation periods and no apparent deactivation for 24 h following an “in series-parallel” reaction mechanism shown in detail in [22].
These results show that palladium at 1.00 wt% loading can produce valuable hydrogen yields, with this being an excellent replacement for platinum. As well, Pd can be considered more advantageous than Pt, given that Pd is less expensive (only 20–25% of the cost of platinum). Furthermore, and given the premise of nominal 1.00 wt% Pd–TiO2, photocatalyst X-ray fluorescence spectrometry (XRF) was used to confirm the nominal loading. The observed XRF value was 1.17 wt% Pd on mesoporous TiO2.
2.3.2. Effect of Catalyst Concentration on Hydrogen Production
Considering that 1.00 wt% Pd–TiO2 showed the best performance in terms of hydrogen production, additional experiments were carried out to determine the influence of the catalyst concentration during photoreaction.
Figure 7 displays four different slurry concentrations of the 1.00 wt% Pd-TiO2 photocatalyst: 0.15, 0.30, 0.50 and 1.00 g/L. These experiments were studied during 6 h of irradiation. One can observe that the runs with 1.00 g/L showed the highest hydrogen production. Thus, given these results, it can be considered that when higher photocatalyst slurry concentrations are used, more photocatalyst electron-holes are provided, with this promoting better hydrogen production.
As a result, it was observed that the hydrogen production rate increased 54% when photocatalyst concentration was augmented seven times from 0.15 to 1.00 g/L. However, despite this hydrogen production increase, this could be considered a modest improvement only, given that the photocatalyst needed and the related cost was significantly augmented. Therefore, a photocatalyst concentration of 0.15 g/L was considered as a best choice and was selected for further experimentation.
2.3.3. Effect of Photo-CREC Water II Atmosphere using Argon and CO2
Before starting water-splitting runs, the reactor gas chamber was purged with an inert gas to remove the oxygen from the air, avoiding combustion reactions. Argon was used initially as the inert gas given this is heavier than oxygen facilitating its displacement [35]. On the other hand, CO2 was also used in separate runs in the reactor gas chamber to determine its possible influence on water dissociation reactions.
According to Figure 8, using argon as an inert gas and utilizing 1.00 wt% Pd–TiO2, yielded 140 cm3 STP of hydrogen after six hours of irradiation. On the other hand, when a CO2 atmosphere was employed, only 80 cm3 STP of hydrogen was obtained. One should note that under a CO2 atmosphere and due to the competition of the CO2 photoreduction with the hydrogen production, a lower net hydrogen formation can be explained.
Regarding CO2 during the six h of irradiation, it was observed that it steadily augmented under an argon atmosphere reaching 0.4 cm3 STP. On the other hand, when the runs were performed under a CO2 atmosphere, the CO2 increment was limited to 0.01 cm3 STP. These findings support the view that there is competition between CO2 photoreduction and CO2 formation via ethanol OH· radical scavenging. It is assumed that these gas phase CO2 findings could be also be influenced by the enhanced CO2 solubility in water–ethanol [36].
2.3.4. Effect of Sacrificial Agent Concentration
As a scavenger, ethanol offers important advantages, such as the photogeneration of electron-holes, limiting electron-site recombination and improving photocatalytic activity. Ethanol can donate electrons to scavenge the valence holes and suppresses the reverse reaction [37].
Experiments were performed at 1.00 wt% Pd and three ethanol concentrations (1.0, 2.0, 4.0 v/v%) under an argon atmosphere and with 0.15 g/L of photocatalyst concentration. This was done to evaluate the effect of the ethanol concentration on hydrogen production. Figure 9 reports the influence of increasing ethanol from 2.0–4.0% on hydrogen production rates.
As shown in Figure 9, the highest hydrogen formation rate was obtained at the highest ethanol concentration. However, these important ethanol concentrations changes did not influence hydrogen production significantly. This was particularly true between 2.0 and 4.0 v/v% ethanol concentration. Therefore, 2.0 v/v% was considered fully adequate and was the selected concentration of the ethanol scavenger used for further studies.
2.3.5. By-Products Formation
There are several by-products generated from the water-splitting reaction in the gas phase. Detected by-products include methane, ethane, acetaldehyde and CO2. To quantify these by-products, gas samples were taken hourly from the gas port located in the storage tank. They were analyzed using a Shimadzu gas chromatograph (GC) unit. All the experiments were repeated at least three times to secure reproducibility.
One can thus see that as soon as the photo-redox reaction starts, all these by-products, together with hydrogen, increase progressively as is shown in Figure 10. In the liquid phase, ethanol was also measured using a Shimadzu HPLC. One can observe in Figure 11 a balanced consumption-formation of ethanol, with a net stable ethanol concentration. This occurs when hydrogen is being produced using the 1.00 wt% Pd–TiO2 photocatalyst.
The observed trends could be considered a promising result, showing that none or little additional scavenger is required in subsequent runs once the initial ethanol is fed to the Photo-CREC Water II reactor unit.
2.4. Quantum Yield (QY) evaluation
The quantum yield (QY) is the most important parameter to establish the energy utilization efficiency in photocatalytic reactors [38]. In terms of hydrogen production, quantum yield can be defined as the hydrogen radical production rate over the absorbed photon rate on the photocatalyst surface. According to this definition, QY can be determined as follows:
Equation (6) is equivalent to:
where represents the rate of moles of hydrogen radicals formed at any time during the photocatalyst irradiation.
To use Equation (7) the assessment of Pa or the moles of absorbed photons is required. This can be accomplished by using the macroscopic radiation energy balance (MREB) in the Photo-CREC Water II reactor as proposed by Escobedo et al. [39]. Appendix C provides a calculation sample to assess the QY.
2.4.1. Effect of Pd Addition on Quantum Yields
The quantum yield evaluation for different TiO2 photocatalysts involves rigorous macroscopic radiation energy balances. These calculations require the assessment of the Pt transmitted, the Pi incident, and the Pbs backscattered photons using the macroscopic radiation energy balance as described in Section 2.2. With this information and using Equation (1), the Pa was calculated.
Furthermore, for every experiment and once the lamp is turned on, the rate of moles of hydrogen can be established. On this basis, QY% can be calculated using Equation (7).
Table 5 and Figure 12 report QY% for the mesoporous photocatalysts doped with palladium at different metal loadings (0.25, 0.50, 1.00, 2.50 and 5.00 wt%) under the following conditions: (a) photocatalyst slurry concentrations of 0.15 g/L, (b) 2.0 v/v% ethanol, (c) pH = 4 ± 0.05 and (d) near-UV light.
There is a significant increase of QY% with 0.25, 0.50 and 1.00 wt% Pd–TiO2, whereas higher Pd loadings led to a decrease of QY%. These results are in line with the QY% of 8% reported by Escobedo when Pt addition proceeds [39].
Figure 12 reports that QY% displays consistent trends for Pd-doped TiO2 photocatalysts: (a) during the first hour of irradiation, QY% increased progressively until it reached a stable value; and (b) during the following six hours of irradiation, QY% remained unchanged, with this showing a steady performance of the photocatalysts under study.
2.4.2. Effect of Catalyst Concentration on Quantum Yields
Considering the QY% observed for the 1.00 wt% Pd–TiO2 during hydrogen production, further QY% evaluations were developed by changing the photocatalyst concentration in the slurry. Table 6 and Figure 13 report the QY% obtained, by augmenting the photocatalyst concentration, under the following conditions: (a) 2.0 v/v% ethanol as scavenger organic compound, (b) pH = 4 ± 0.05 and (c) near-UV light irradiation.
Figure 13 provides QY% for different photocatalyst concentrations. Here, it was again observed that there was a noticeable increase of the QY% in the first hour of irradiation, followed by a stable QY% in the next 5 h of irradiation. Constant QY% during the 1 to 6-h irradiation period was assigned to the steady hydrogen formation rate, linked to consistent zero-order reaction kinetics with no photocatalyst activity decay observed in all cases.
3. Experimental Methods
The photocatalysts of the present study were synthesized using the sol–gel methodology and doped with palladium. Different techniques were utilized to characterize the doped semiconductors as follows: (a) BET for specific surface area, (b) chemisorption for crystallite size, (c) x-ray diffraction for crystallographic structure and (d) UV-vis absorption for band gaps. The prepared semiconductors were evaluated in a Photo-CREC Water II reactor unit.
3.1. Photocatalyst Synthesis
The sol–gel method can be used for photocatalyst synthesis by converting monomers into colloids (sol phase), and thus promoting a gel structure formation [40]. The sol–gel method for TiO2 synthesis can be modified, leading to improvements in photocatalyst structural properties such as particle diameter and surface area. Therefore, this also leads to improved photocatalytic activity [41].
Some copolymers, such as Pluronic® F-127 and Pluronic® P-123, formed by chains of ethylene oxide and propylene oxide, can be used for TiO2 synthesis as soft templates. These templates optimize the pore structure network during semiconductor preparation, enhancing pore size distribution, enlarging the surface area, controlling the purity, homogeneity, and morphology of mesoporous materials [42].
Rusinque shows that the Pluronic F-127 template has a greater impact than the Pluronic P-123 template on TiO2 photoactivity, increasing the hydrogen production up to 86% [31]. Thus, considering the Pluronic F-127 advantage over Pluronic P-123 for hydrogen production, further experiments were carried out using only copolymer Pluronic F-127.
The sol–gel method adopted used the following reagents: (a) ethanol USP (C2H5OH) from commercial alcohols, (b) hydrochloric acid (HCl, 37% purity), (c) Pluronic F-127, (d) anhydrous citric acid, (e) titanium (IV) isopropoxide, and (f) palladium (II) chloride (PdCl2, 99.9% purity). All the reagents were obtained from Sigma Aldrich, with photocatalyst preparation effected according to the methodology proposed by Guayaquil et al. [43].
Figure 14 describes the sol–gel synthesis as follows: (a) Step 1: In 400 mL of ethanol, 33 g of hydrochloric acid and 20 g of Pluronic F-127 were added until dissolution, under continuous stirring for 1 h. (b) Step 2: 6.30 g of citric acid were dissolved in 20 mL of water for posterior addition to the initial suspension to mix them together for 1 h in order to set the pH at 0.75. (c) Step 3: 28.5 g of titanium (IV) isopropoxide was dissolved in ethanol and added dropwise to the mixture. Finally, palladium (II) chloride was incorporated at different loadings (0.25 to 5.00 wt% Pd). (d) Step 4: The resulting sol–gel suspension was stirred for 24 h and then calcined at 500 °C for 6 hours under an air atmosphere. The copolymer was evaporated during the thermal treatment and an ordered mesoporous titanium framework was formed [23].
3.2. Equipment
The Photo-CREC Water II (PCW-II) reactor is a novel unit used for water splitting reactions and therefore, hydrogen production. It is a 5.7 L slurry batch reactor configured with two concentric tubes: (a) an inner tube made from transparent borosilicate (Pyrex) and (b) an outer tube made from opaque polyethylene. The fluorescent lamp is placed inside this inner Pyrex tube. Furthermore, the suspended photocatalyst flows in the annular space between the outer polyethylene tube and the inner Pyrex transparent tube which only absorbs 5%) of the near-UV light emitted by the lamp [44]. See Appendix A for a detailed lamp characterization.
The PCW-II unit is equipped with a storage feed tank where the photocatalyst suspension is always kept sealed under agitation. This tank has 2 ports for periodic liquid and gas phase sampling. Figure 15 describes the main components of PCW-II: (a) the Photo-CREC Water II Reactor, (b) the centrifugal pump, (c) the sealed storage tank, and (d) the electrical circuit powering the near-UV light lamp.
The emitted radiation spectra of the lamp used inside the Photo-CREC Water II was established using a Stellar Net EPP2000-25 spectrometer (StellarNet Inc.). The light source is a polychromatic black light blue (BLB) Ushio UV lamp (15 W, 0.305 A, 55 V) with a spectral peak at 368 nm in the 300–420 nm emission range [45].
3.3. Photocatalyst Characterization
Photocatalyst specific surfaces areas were determined using a BET surface area analyzer (Micrometrics, ASAP 2010) at −195 °C. Each photocatalyst was degassed at 300 °C during a period of 3 h. The BET analysis was developed using nitrogen to generate the adsorption–desorption equilibrium isotherms and to establish the isotherm inflection point. The BJH (Barrett–Joyner–Halenda) method was used to determine the pore size distribution, by utilizing the desorption isotherm with N2 as an adsorbate.
By using the Micromeritics AutoChem II Analyzer for pulse chemisorption, one can calculate the fraction of dispersed metal and average active metal crystallite size [46]. Furthermore, to identify the phases of a crystalline material, X-ray diffraction (XRD) was used [47]. The XRD spectra were analyzed in a Rigaku Rotating Anode X-Ray Diffractometer (Rigaku) perated at 45 kV and 160 mA. The scans were taken between 20–80°, with a step size of 0.02° and a dwell time of 2 s/step.
In order to determine the characteristic band gap associated to each photocatalyst an UV-VIS-NIR spectrophotometer (Shimadzu UV-3600) was used [48]. BaSO4 was utilized as a reference sample. Kubelka–Munk (K–M) developed a Tauc plot methodology that was followed to establish the corresponding band gaps [49]. X-ray photoelectron spectroscopy (XPS) analysis was also used to identify the elemental composition and the chemical state of each element in the synthesized photocatalyst [50].
3.4. Hydrogen Production
Pd-doped TiO2 photocatalysts were evaluated using the Photo-CREC Water II reactor equipped with the BLB near-UV lamp for 6 hours of continuous irradiation. This lamp was turned on 30 min before initiating the photoreaction. The hydrogen storage/mixing tank was loaded with 6000 mL of water. Ethanol was used as an organic scavenger and the pH was adjusted to 4 ± 0.05 with H2SO4 [2M] keeping the photoreaction under acidic conditions, which favours available H+ for water splitting process [39].
Following this step, the photocatalyst was loaded at a specific weight concentration ensuring that most of the radiation was absorbed in the slurry medium. The photocatalyst was subjected to sonication, which reduces the formation of particle agglomerates and promotes homogeneous mixing. Argon gas was circulated to guarantee an inert atmosphere at the beginning of the reaction.
3.5. Analytical Techniques
The gas phase was analyzed with a Shimadzu GC2010 gas chromatograph using argon (Praxair 99.999%) as gas carrier. It has 2 detectors, a flame ionization detector (FID) and a thermal conductivity detector (TCD). This unit was equipped with a HayeSepD 100/120 mesh packed column (9.1 m × 2 mm × 2 μm nominal SS) used for the separation of hydrogen from air. This equipment detects hydrogen (H2), carbon monoxide (CO), carbon dioxide (CO2), methane (CH4) and other hydrocarbon organic species.
A Shimadzu HPLC model UFLC (ultra-fast liquid chromatography) system was utilized to characterize the liquid phase. This analytical technique allows the liquid mobile phase (0.1% H3PO4) to transport the sample through a column (Supelcogel C-610H 30cm × 7.8mm ID) containing a stationary phase. It selectively separates individual compounds (i.e., ethanol) from water for further detection. This quantitative analysis is performed by employing the RID (refractive index detector) 10A due to polar nature of ethanol.
Both the GC and the HPLC analytical techniques were used simultaneously. Samples were taken at different irradiation times.
4. Conclusions
- (a)
- The TiO2 mesoporous photocatalysts of the present study were prepared using a F-127 template and following a sol–gel methodology. It was found that the mesoporous prepared using a F-127 template displayed a good photocatalytic performance.
- (b)
- The prepared Pd–TiO2 photocatalysts were characterized using BET, XRD, UV-VIS and XPS. On this basis it was proven that energy band gaps were significantly affected with Pd addition, and that binding energies showed significant contribution of the Pd (0) on the doped-palladium TiO2.
- (c)
- Macroscopic radiation energy balances were successfully employed to establish photon absorption rates and radiation absorption efficiencies in the PCW-II unit. For the Pd–TiO2 semiconductors, photon absorption efficiencies were in the 45 and 60% range under near-UV light.
- (d)
- The formation of hydrogen using Pd–TiO2 photocatalysts followed, in all cases, steady zero-order kinetics with no apparent photocatalyst activity decay.
- (e)
- The prepared Pd–TiO2 photocatalysts under near UV-light were shown to be adequate for hydrogen production reaching up to 210 cm3 STP when using the 1.00 wt%-Pd on TiO2. This photocatalyst showed a best QY% of 30.8%.
Author Contributions
Conceptualization, investigation and supervision, H.d.L.; proposed methodology and supervision, S.E.; validation, formal analysis and writing, B.R.
Funding
This research was funded by Natural Sciences and Engineering Research Council of Canada (NSERC) and the University of Western Ontario, grant given to Hugo de Lasa.
Acknowledgments
We would like to gratefully thank Florencia de Lasa who assisted with the editing and the drafting of the graphical abstract of the present article.
Conflicts of Interest
The authors declare no conflict of interest.
Nomenclature
| CO2 | Carbon dioxide |
| CH4 | Methane |
| C2H6 | Ethane |
| C2H4O | Acetaldehyde |
| c | Speed of light (3.0 × 10⁸ m/s) |
| Dp | Pore diameter (cm) |
| e- | Electron |
| h+ | Hole |
| h | Planck’s constant (6.63 × 1034 J/s) |
| Ebg | Energy band gap (eV) |
| Eav | Average energy of a photon (kJ/mol photon) |
| F-127 | Poly (ethylene oxide)/poly (propylene oxide)/poly (ethylene oxide) |
| H• | Hydrogen radical |
| H2O | Water |
| I(λ) | Intensity of light (W/cm2) |
| OH- | Hydroxide ions |
| OH• | Hydroxide radicals |
| P-123 | Poly (ethylene glycol)-block-poly (propylene glycol)-block-poly (ethylene glycol) |
| P0 | Rate of photons emitted by the BLB lamp (einstein/s) |
| Pa | Rate of absorbed photons (einstein/s) |
| Pa-wall | Rate of photons absorbed by the inner pyrex glass (einstein/s) |
| Pbs | Rate of backscattered photons exiting the system (einstein/s) |
| Pd | Palladium |
| PdCl2 | Palladium II chloride |
| PEO | Poly (ethylene oxide) |
| Pfs | Rate of forward-scattered radiation (einstein/s) |
| Pi | Rate of photons reaching the reactor inner surface (einstein/s) |
| Pns | Rate of transmitted non-scattered radiation (einstein/s) |
| PPO | Poly (propylene oxide) |
| Pt | Rate of transmitted photons (einstein/s) |
| Pt | Platinum |
| q (θ, z, λ, t) | Net radiative flux over the lamp emission spectrum (μW/cm2) |
| t | Time (h) |
| TiO2 | Titanium dioxide |
| V | Total volume of the gas chamber (5716 cm3) |
| W | Weight (g) |
| Wt% | Weight percent (% m/m) |
| Greek symbols | |
| θ | Diffraction angle, also scattering angular angle (o) |
| λ | Wave length (nm) |
| φ | Quantum Yield Efficiency (%) |
| Acronyms | |
| BJH | Barrett–Joyner–Halenda model |
| BLB | Black light blue lamp |
| BET | Brunauer–Emmett–Teller Surface Area Method |
| CB | Conduction band |
| DP25 | Degussa P25 (TiO2) |
| JCPDS | International Centre for Diffraction Data |
| MIEB | Macroscopic Irradiation Energy Balance |
| PCW-II | Photo CREC Water II reactor |
| PC | Photocatalyst concentration |
| STP | Standard temperature and pressure (273 K and 1 atm) |
| UV | Ultraviolet |
| VB | Valence band |
| Bg | Band gap |
Appendix A. Lamp Characterization
Figure A1 reports the spectrum of the polychromatic BLB Ushio near-UV lamp, with an observed output power of 1.61 W and an average of 325.1 kJ/photon mole of emitted photon energy.
Figure A1.
Near-UV Lamp Irradiation Spectrum.

The average emitted photon energy was calculated using the recorded irradiation spectra as follows [51]:
where,
With h being the Planck constant (6.34 × 10⁻³⁴ J s/photon), c representing the speed of light in a vacuum (3.00 × 10⁸ m/s2) and λ denoting the wavelength expressed in nanometers (nm). I is the emitted photons intensity (W/cm2), assessed as I (λ) ≈ q (θ, z, λ, t) dλ and measured with a spectrophotoradiometer. The irradiance is represented by q (θ, z, λ, t) dλ and given by the lamps spectra as shown in Figure A2.
The average emitted photon Energy was calculated as shown in Equation (A1)
Regarding the PCW-II, the axial distribution of the radiative flux was determined. Figure A2 reports the near-UV lamp axial radiation distribution. One can observe that the radiation profile shows no significant changes in radiation levels in the central section of the PCW-II. On the other hand, significant radiation decay can be seen approaching the endpoints of the lamp [52].
Figure A2.
Near-UV Lamp Axial Distribution.

Appendix B. Semiconductor Crystallite Sizes and Lattice Parameters
The crystallite sizes were determined using the Scherrer equation as reported in the enclosed Table A1. On this basis the mesoporous photocatalysts displayed crystallite sizes between 9 and 14 nm.

Table A1.
Photocatalyst Crystallite Sizes.
| Photocatalyst | Crystallite Size (nm) |
|---|---|
| TiO2 | 9 |
| TiO2 0.25 wt% Pd 500 °C | 11 |
| TiO2 0.50 wt% Pd 500 °C | 11 |
| TiO2 1.00 wt% Pd 500 °C | 11 |
| TiO2 2.50 wt% Pd 500 °C | 13 |
| TiO2 5.00 wt% Pd 500 °C | 14 |
Furthermore, the calculated a, b and c lattice constants of the tetragonal anatase unit cell are shown in Table A2 indicating that pure anatase was successfully obtained with the phase structures maintained at α = β = γ = 90° angles. These resulting a, b, and c parameters are in closed agreement with those reported in the literature [53]. Note that lattice parameters a = b ≠ c and these were calculated for Anatase phase (h k l) = (1 0 1).
Table A2.
Lattice Parameters for TiO2 and Pd doped TiO2.
| Photocatalyst | a = b | c | 2θ (deg) | d (Å) |
|---|---|---|---|---|
| TiO2 [53] | 3.7821 | 9.5022 | 25.33 | 3.5139 |
| TiO2 500 °C (our study) | 3.7679 | 9.5002 | 25.41 | 3.5025 |
| TiO2 0.25 wt% Pd 500 °C | 3.7832 | 9.4833 | 25.33 | 3.5139 |
| TiO2 0.50 wt% Pd 500 °C | 3.7858 | 9.4737 | 25.31 | 3.5155 |
| TiO2 1.00 wt% Pd 500 °C | 3.7825 | 9.5099 | 25.32 | 3.5147 |
| TiO2 2.50 wt% Pd 500 °C | 3.7748 | 9.4713 | 25.38 | 3.5065 |
| TiO2 5.00 wt% Pd 500 °C | 3.7691 | 9.4809 | 25.41 | 3.5025 |
Appendix C. Quantum Yield Calculation
As stated in Section 2.4, QY% can be defined as the number of moles of hydrogen radical produced per absorbed photons on the photocatalyst surface:
where represents the rate of moles of hydrogen radicals formed and Pa stands for the moles of photons absorbed.
As well, and according to the Macroscopic Irradiation Energy Balances (MIEB) in the Photo-CREC Water Reactor II, Pa was calculated as follows:
where, Pi is the rate of photons reaching the reactor at the inner reactor surface, Pbs represents the rate of backscattered photons, and Pt is the rate of transmitted photons (Einstein s−1).
A sample calculation is given below considering a hydrogen production rate of 0.2494 μmol/cm3 h using: (a) 1.0 wt.% Pd-TiO2, (b) a photocatalyst concentration of 1.0 g/L, (c) ethanol at 2.0 v/v%, (d) pH = 4 ± 0.05, (e) near-UV Light, (f) gas phase volume in the reactor of 5716 cm3 and (g) Pa = 2.57 × 10⁻⁶ Einstein/s.
References
- Ramesohl, S.; Merten, F. Energy system aspects of hydrogen as an alternative fuel in transport. Energy Policy 2006, 34, 1251–1259. [Google Scholar] [CrossRef]
- Barreto, L.; Makihira, A.; Riahi, K. The hydrogen economy in the 21st century: A sustainable development scenario. Int. J. Hydrogen Energy 2003, 28, 267–284. [Google Scholar] [CrossRef]
- Maeda, K.; Teramura, K.; Lu, D.; Takata, T.; Saito, N.; Inoue, Y.; Domen, K. Photocatalyst releasing hydrogen from water. Nature 2006, 440, 295. [Google Scholar] [CrossRef] [PubMed]
- Galińska, A. Photocatalytic Water Splitting over Pt−TiO2 in the Presence of Sacrificial Reagents. Energy Fuels 2005, 19, 1143–1147. [Google Scholar] [CrossRef]
- Wang, M.; Shen, S.; Li, L.; Tang, Z.; Yang, J. Effects of sacrificial reagents on photocatalytic hydrogen evolution over different photocatalysts. J. Mater. Sci. 2017, 52, 5155–5164. [Google Scholar] [CrossRef]
- López, C.R.; Melián, E.P.; Méndez, J.A.O.; Santiago, D.E.; Rodríguez, J.M.D.; Díaz, O.G. Comparative study of alcohols as sacrificial agents in H2production by heterogeneous photocatalysis using Pt/TiO2 catalysts. J. Photochem. Photobiol. A Chem. 2015, 312, 45–54. [Google Scholar] [CrossRef]
- Mills, A. An overview of semiconductor photocatalysis. J. Photochem. Photobiol. A Chem. 1997, 108, 1–35. [Google Scholar] [CrossRef]
- Abe, R. Significant effect of iodide addition on water splitting into H2 and O2 over Pt-loaded TiO2 photocatalyst: Suppression of backward reaction. Chem. Phys. Lett. 2003, 371, 360–364. [Google Scholar] [CrossRef]
- Mills, A. Photosensitised dissociation of water using dispersed suspensions of n-type semiconductors. J. Chem. Soc. Faraday Trans. 1 Phys. Chem. Condens. Phases 1982, 12, 3659–3669. [Google Scholar] [CrossRef]
- Escobedo Salas, S. Photocatalytic Water Splitting Using a Modified Pt-TiO2. Kinetic Modeling and Hydrogen Production Efficiency. Ph.D. Thesis, The University of Western Ontario, London, ON, Canada, August 2013. [Google Scholar]
- Khan, M.M.; Adil, S.F.; Al-Mayouf, A. Metal oxides as photocatalysts. J. Saudi Chem. Soc. 2015, 19, 462–464. [Google Scholar] [CrossRef] [Green Version]
- Haider, A.J. Exploring potential Environmental applications of TiO2 Nanoparticles. Energy Procedia 2017, 119, 332–345. [Google Scholar] [CrossRef]
- Chin, W.L.; Low, F.W.; Chong, S.W.; Hamid, S.B.A. An Overview: Recent Development of Titanium Dioxide Loaded Graphene Nanocomposite Film for Solar Application. Curr. Org. Chem. 2015, 19, 1882–1895. [Google Scholar]
- Yang, J. Roles of Cocatalysts in Photocatalysis and Photoelectrocatalysis. Acc. Chem. Res. 2013, 46, 1900–1909. [Google Scholar] [CrossRef] [Green Version]
- Moslah, C.; Kandyla, M.; Mousdis, G.A.; Petropoulou, G.; Ksibi, M. Photocatalytic Properties of Titanium Dioxide Thin Films Doped with Noble Metals (Ag, Au, Pd, and Pt). Phys. Status Solidi Appl. Mater. Sci. 2018, 215, 1–7. [Google Scholar] [CrossRef]
- García-Zaleta, D.S.; Torres-Huerta, A.M.; Domínguez-Crespo, M.A.; García-Murillo, A.; Silva-Rodrigo, R.; González, R.L. Influence of Phases Content on Pt/TiO2, Pd/TiO2 Catalysts for Degradation of 4-Chlorophenol at Room Temperature. J. Nanomater. 2016, 2016, 1805169. [Google Scholar] [CrossRef]
- Subramanian, V.; Wolf, E.E.; Kamat, P.V. Catalysis with TiO2/Gold Nanocomposites. Effect of Metal Particle Size on the Fermi Level Equilibration. J. Am. Chem. Soc. 2004, 126, 4943–4950. [Google Scholar] [CrossRef]
- Santara, B.; Pal, B.; Giri, P.K. Signature of strong ferromagnetism and optical properties of Co doped TiO2 nanoparticles. J. Appl. Phys. 2011, 110, 114322. [Google Scholar] [CrossRef]
- Khairy, W.; Zakaria, M. Effect of metal-doping of TiO2 nanoparticles on their photocatalytic activities toward removal of organic dyes. Egypt. J. Pet. 2014, 23, 419–426. [Google Scholar] [CrossRef]
- Sobana, N.; Muruganadham, M.; Swaminathan, M. Nano-Ag particles doped TiO2 for efficient photodegradation of Direct azo dyes. J. Mol. Catal. A Chem. 2006, 258, 124–132. [Google Scholar] [CrossRef]
- Cassano, A.E.; Martin, C.A.; Brandi, R.J.; Alfano, O.M. Photoreactor Analysis and Design: Fundamentals and Applications. Ind. Eng. Chem. Res. 1995, 34, 2155–2201. [Google Scholar] [CrossRef]
- Escobedo, S.; Serrano, B.; Calzada, A.; Moreira, J.; de Lasa, H. Hydrogen production using a platinum modified TiO2 photocatalyst and an organic scavenger. Kinetic modeling. Fuel 2016, 181, 438–449. [Google Scholar] [CrossRef]
- Yu, J.C.; Wang, X.; Fu, X. Pore-Wall Chemistry and Photocatalytic Activity of Mesoporous Titania Molecular Sieve Films. Chem. Mater. 2004, 16, 1523–1530. [Google Scholar] [CrossRef]
- Pan, X.; Xu, Y.J. Defect-mediated growth of noble-metal (Ag, Pt, and Pd) nanoparticles on TiO2 with oxygen vacancies for photocatalytic redox reactions under visible light. J. Phys. Chem. C 2013, 117, 17996–18005. [Google Scholar] [CrossRef]
- Zhang, J.; Zhou, P.; Liu, J.; Yu, J. New understanding of the difference of photocatalytic activity among anatase, rutile and brookite TiO2. Phys. Chem. Chem. Phys. 2014, 16, 20382–20386. [Google Scholar] [CrossRef] [PubMed]
- Rodriguez-Vindas, D. Synthesis of palladium with different nanoscale structures by sputtering deposition onto fiber templates. J. Nanophotonics 2008, 2, 021925. [Google Scholar] [CrossRef]
- Moreira, J.; Serrano, B.; Ortiz, A.; de Lasa, H.; de Lasa, H. Evaluation of Photon Absorption in an Aqueous TiO2 Slurry Reactor Using Monte Carlo Simulations and Macroscopic Balance. Ind. Eng. Chem. Res. 2010, 49, 10524–10534. [Google Scholar] [CrossRef]
- Salaices, M.; Serrano, B.; de Lasa, H.I. Experimental evaluation of photon absorption in an aqueous TiO2 slurry reactor. Chem. Eng. J. 2002, 90, 219–229. [Google Scholar] [CrossRef]
- Thornton, J.M.; Raftery, D. Efficient photocatalytic hydrogen production by platinum-loaded carbon-doped cadmium indate nanoparticles. ACS Appl. Mater. Interfaces 2012, 4, 2426–2431. [Google Scholar] [CrossRef]
- Yoshida, H.; Hirao, K.; Nishimoto, J.; Shimura, K.; Kato, S.; Itoh, H.; Hattori, T. Hydrogen production from methane and water on platinum loaded titanium oxide photocatalysts. J. Phys. Chem. C 2008, 112, 5542–5551. [Google Scholar] [CrossRef]
- Rusinque, B. Hydrogen Production by Photocatalytic Water Splitting Under Near-UV and Visible Light Using Doped Pt and Pd TiO2. Master Thesis, The University of Western Ontario, London, ON, Canada, September 2018. [Google Scholar]
- Zhang, N.; Liu, S.; Fu, X.; Xu, Y.J. Synthesis of M@TiO2 (M = Au, Pd, Pt) core-shell nanocomposites with tunable photoreactivity. J. Phys. Chem. C 2011, 115, 9136–9145. [Google Scholar] [CrossRef]
- Riyapan, S.; Boonyongmaneerat, Y.; Mekasuwandumrong, O.; Yoshida, H.; Fujita, S.; Arai, M.; Panpranot, J. Improved catalytic performance of Pd/TiO2in the selective hydrogenation of acetylene by using H2-treated sol-gel TiO2. J. Mol. Catal. A Chem. 2014, 383–384, 182–187. [Google Scholar] [CrossRef]
- Akbayrak, S.; Tonbul, Y.; Özkar, S. Nanoceria supported palladium(0) nanoparticles: Superb catalyst in dehydrogenation of formic acid at room temperature. Appl. Catal. B Environ. 2017, 206, 384–392. [Google Scholar] [CrossRef]
- Borodin, V.B.; Tsygankov, A.A.; Rao, K.K.; Hall, D.O. Hydrogen production byAnabaena variabilisPK84 under simulated outdoor conditions. Biotechnol. Bioeng. 2000, 69, 478–485. [Google Scholar] [CrossRef]
- Dalmolin, I.; Skovroinski, E.; Biasi, A.; Corazza, M.L.; Dariva, C.; Oliveira, J.V. Solubility of carbon dioxide in binary and ternary mixtures with ethanol and water. Fluid Phase Equilib. 2006, 245, 193–200. [Google Scholar] [CrossRef]
- Puangpetch, T.; Sreethawong, T.; Yoshikawa, S.; Chavadej, S. Hydrogen production from photocatalytic water splitting over mesoporous-assembled SrTiO3nanocrystal-based photocatalysts. J. Mol. Catal. A Chem. 2009, 312, 97–106. [Google Scholar] [CrossRef]
- Ibrahim, H.; de Lasa, H. Novel photocatalytic reactor for the destruction of airborne pollutants reaction kinetics and quantum yields. Ind. Eng. Chem. Res. 1999, 38, 3211–3217. [Google Scholar] [CrossRef]
- Escobedo, S.; Serrano, B.; de Lasa, H. Serrano and H. de Lasa. Quantum Yield with Platinum Modified TiO2 Photocatalysts for Hydrogen Prodcution. Appl. Catal. B. Environ. 2013, 140, 523–536. [Google Scholar] [CrossRef]
- Guo, S.P.; Li, J.C.; Xu, Q.T.; Ma, Z.; Xue, H.G. Recent achievements on polyanion-type compounds for sodium-ion batteries: Syntheses, crystal chemistry and electrochemical performance. J. Power Sources 2017, 361, 285–299. [Google Scholar] [CrossRef]
- Brinker, J.; Schere, G.W. Sol-Gel Science: The Physics and Chemistry of Sol-Gel Processing; Academic Press Inc.: San Diego, CA, USA, 1990. [Google Scholar]
- He, X. Recent Progress in Fabrication of Nanostructured Carbon Monolithic Materials; Elsevier: Oxford, UK, 2017. [Google Scholar]
- Guayaquil-Sosa, J.F.; Serrano-Rosales, B.; Valadés-Pelayo, P.J.; de Lasa, H. Photocatalytic hydrogen production using mesoporous TiO2 doped with Pt. Appl. Catal. B Environ. 2017, 211, 337–348. [Google Scholar] [CrossRef]
- De Lasa, H.; Serrano, B.; Salaices, M. Photocatalytic Reaction Engineering; Springer Scicence: New York, NY, USA, 2005. [Google Scholar]
- Ushio. UV-B Blacklight & Blacklight Blue; Catalogue: Cypress, CA, USA.
- AutoChem 2920 Automated Catalyst Characterization System Operator’s Manual; AutoChem: Norcross, GA, USA, 2014.
- Warren, B.E. X-Ray Diffraction; Dover Publications: New York, NY, USA, 1990. [Google Scholar]
- UV-VIS-NIR Spectrophotometer; Shimadzu: Tokyo, Japan, 2018.
- Slav, A. Optical characterization of TiO2 -Ge nanocomposite films obtained by reactive magnetron sputtering. Dig. J. Nanomater. Biostructures 2011, 6, 915–920. [Google Scholar]
- Briggs, D. X: X-Ray Photoelectron Spectroscopy. In Handbook of Adhesion, 2nd ed.; 2005; pp. 621–622. [Google Scholar]
- Serrano, B.; Ortíz, A.; Moreira, J.; de Lasa, H.I. Energy efficiency in photocatalytic reactors for the full span of reaction times. Ind. Eng. Chem. Res. 2009, 48, 9864–9876. [Google Scholar] [CrossRef]
- Salaices, M.; Serrano, B.; De Lasa, H. Photocatalytic conversion of Organic pollutants extinction coefficients and quantum effiencies. Ind. Eng. Chem. Res. 2001, 40, 5455–5464. [Google Scholar] [CrossRef]
- Treacy, J.P.W.; Hussain, H.; Torrelles, X.; Grinter, D.C.; Cabailh, G.; Bikondoa, O.; Nicklin, C.; Selcuk, S.; Selloni, A.; Lindsay, R.; et al. Geometric structure of anatase Ti O2(101). Phys. Rev. B 2017, 95, 1–7. [Google Scholar] [CrossRef]
Figure 1.
X-ray diffraction (XRD) diffractograms of photocatalyst doped with Pd. XRDs overlapped for comparison. A = anatase, Pd = palladium.
Figure 1.
X-ray diffraction (XRD) diffractograms of photocatalyst doped with Pd. XRDs overlapped for comparison. A = anatase, Pd = palladium.

Figure 2.
Effect of Pd loading on the optical band gap.

Figure 3.
Band gap calculation using the Tauc plot methodology and the straight-line extrapolation for 1.0 wt% Pd–TiO2.
Figure 3.
Band gap calculation using the Tauc plot methodology and the straight-line extrapolation for 1.0 wt% Pd–TiO2.

Figure 4.
High-resolution X-ray photoelectron spectroscopy (XPS) spectra for 1.00 wt% Pd–TiO2. Note: Full lines represent Pd (0) at (a) 3d5/2 and (c) 3d3/2. Broken lines represent PdO at (b) 3d5/2 and (d) 3d3/2.
Figure 4.
High-resolution X-ray photoelectron spectroscopy (XPS) spectra for 1.00 wt% Pd–TiO2. Note: Full lines represent Pd (0) at (a) 3d5/2 and (c) 3d3/2. Broken lines represent PdO at (b) 3d5/2 and (d) 3d3/2.

Figure 5.
Absorption efficiency on TiO2 photocatalysts at different metal loadings under near-UV light.
Figure 5.
Absorption efficiency on TiO2 photocatalysts at different metal loadings under near-UV light.

Figure 6.
Cumulative hydrogen volume using Pd at different metal loadings (0.25, 1.50, 1.00, 2.50 and 5.00 wt%). Conditions: photocatalyst concentration 0.15 g/L, 2.0 v/v% ethanol, pH = 4 ± 0.05 and near-UV light. Standard deviation: ±3.0%.
Figure 6.
Cumulative hydrogen volume using Pd at different metal loadings (0.25, 1.50, 1.00, 2.50 and 5.00 wt%). Conditions: photocatalyst concentration 0.15 g/L, 2.0 v/v% ethanol, pH = 4 ± 0.05 and near-UV light. Standard deviation: ±3.0%.

Figure 7.
Cumulative hydrogen production using 1.0 wt% Pd–TiO2 at different catalyst concentrations (0.15, 0.30, 0.50 and 1.0 g/L). Conditions: 2.0 v/v% ethanol, pH = 4 ± 0.05 and near-UV light. Standard deviation: ±4.0%.
Figure 7.
Cumulative hydrogen production using 1.0 wt% Pd–TiO2 at different catalyst concentrations (0.15, 0.30, 0.50 and 1.0 g/L). Conditions: 2.0 v/v% ethanol, pH = 4 ± 0.05 and near-UV light. Standard deviation: ±4.0%.

Figure 8.
Cumulative hydrogen production using xPd–TiO2 (x = 1.00, 2.50 and 5.00 wt%) and under two atmospheres: (a) argon and (b) CO2. Conditions: photocatalyst concentration 0.15 g/L, 2.0 v/v% ethanol, pH = 4 ± 0.05 and near-UV light. Standard deviation: (a) ±3.0%, (b) ±3.4%.
Figure 8.
Cumulative hydrogen production using xPd–TiO2 (x = 1.00, 2.50 and 5.00 wt%) and under two atmospheres: (a) argon and (b) CO2. Conditions: photocatalyst concentration 0.15 g/L, 2.0 v/v% ethanol, pH = 4 ± 0.05 and near-UV light. Standard deviation: (a) ±3.0%, (b) ±3.4%.

Figure 9.
Hydrogen volume using 1.00 wt% Pd at 1.0, 2.0 and 4.0 v/v% ethanol. Conditions: photocatalyst concentration 0.15 g/L, argon atmosphere, pH = 4 ± 0.05 and near-UV light, R = repeat. Standard deviation: ±6.5%.
Figure 9.
Hydrogen volume using 1.00 wt% Pd at 1.0, 2.0 and 4.0 v/v% ethanol. Conditions: photocatalyst concentration 0.15 g/L, argon atmosphere, pH = 4 ± 0.05 and near-UV light, R = repeat. Standard deviation: ±6.5%.

Figure 10.
Hydrocarbon profiles of (a) carbon dioxide (CO2), (b) methane (CH4), (c) acetaldehyde (C2H4O) and (d) ethane (C2H6) at 1.00 wt% Pd. Conditions: Photocatalyst concentration 0.15 g/L, 2.0 v/v% ethanol, argon atmosphere, pH = 4 ± 0.05 and near-UV light. Standard deviation: (a) ±4.1%, (b) ±4.7%, (c) ±5.1%, (d) ±6.3%.

Figure 11.
Ethanol changes with irradiation time. Conditions: photocatalyst concentration 0.15 g/L, argon atmosphere, 2.0 v/v% ethanol, pH = 4 ± 0.05 and near-UV light. Standard deviation: ±3.0%.
Figure 11.
Ethanol changes with irradiation time. Conditions: photocatalyst concentration 0.15 g/L, argon atmosphere, 2.0 v/v% ethanol, pH = 4 ± 0.05 and near-UV light. Standard deviation: ±3.0%.

Figure 12.
QY% at various irradiation times under near-UV light and 0.15 g/L of photocatalyst concentration, and using Pd at different loadings (0.25, 0.50, 1.00, 2.50 and 5.00 wt%).
Figure 12.
QY% at various irradiation times under near-UV light and 0.15 g/L of photocatalyst concentration, and using Pd at different loadings (0.25, 0.50, 1.00, 2.50 and 5.00 wt%).

Figure 13.
QY% at various irradiation times using near-UV irradiation and 0.15, 0.30, 0.50 and 1.00 g/L photocatalyst concentrations. Note: Loading was1.00 wt% Pd on TiO2.
Figure 13.
QY% at various irradiation times using near-UV irradiation and 0.15, 0.30, 0.50 and 1.00 g/L photocatalyst concentrations. Note: Loading was1.00 wt% Pd on TiO2.

Figure 14.
Photocatalyst preparation process describing the four steps considered for Pd-doped mesoporous.
Figure 14.
Photocatalyst preparation process describing the four steps considered for Pd-doped mesoporous.

Figure 15.
Schematic representation of the Photo-CREC Water II Reactor with a H2 Mixing/Storage Tank: (A) partial longitudinal cross-section of the PCW- II unit showing the down flow circulation of the slurry in the annular channel, (B) overall view of PCW-II showing windows, near UV lamp and recirculation pump (C) hydrogen storage tank with its components, (D) detail of a photocatalyst particle.

Table 1.
Surface area and pore diameter using template Pluronic F-127.
| Photocatalyst | SBET (m2 g−1) | DpBJH (4VpBJH/SBET) (nm) | VpBJH (cm3g−1) |
|---|---|---|---|
| Degussa P-25 | 59 | 7.5 | 0.25 |
| F-127–TiO2 500 °C | 140 | 17.5 | 0.61 |
Table 2.
Surface area and pore diameter using palladium.
| Photocatalyst | SBET (m2 g−1) | Dp BJH (4VpBJH/SBET) (nm) | VpBJH (cm3g−1) |
|---|---|---|---|
| Anatase | 11 | 7.3 | 0.05 |
| Rutile | 5 | 4.7 | 0.05 |
| Degussa P-25 | 59 | 7.5 | 0.25 |
| F-127–TiO2-500 °C | 140 | 17.5 | 0.61 |
| F-127–0.25 wt% Pd–TiO2 500 °C | 131 | 16.5 | 0.53 |
| F-127–0.50 wt% Pd–TiO2 500 °C | 124 | 16.8 | 0.52 |
| F-127–1.0 wt% Pd–TiO2 500 °C | 123 | 21.2 | 0.65 |
| F-127–2.5 wt% Pd–TiO2 500 °C | 122 | 19.9 | 0.60 |
| F-127–5.0 wt% Pd–TiO2 500 °C | 119 | 18.9 | 0.56 |
Table 3.
Chemisorption analysis: metal dispersion.
| Photocatalyst | Metal Dispersion (%) |
|---|---|
| F-127–0.25 wt% Pd–TiO2 500 °C | 75 |
| F-127–0.50 wt% Pd–TiO2 500 °C | 27 |
| F-127–1.0 wt% Pd–TiO2 500 °C | 26 |
| F-127–2.5 wt% Pd–TiO2 500 °C | 12 |
| F-127–5.0 wt% Pd–TiO2 500 °C | 8 |
Table 4.
Absorbed photon rates on TiO2 photocatalysts at 0.15 g/L of photocatalyst concentration.
| Near-UV Light | Pa (Einstein/s) |
|---|---|
| TiO2 | 3.11 × 10⁶ |
| 0.25 wt% Pd | 3.18 × 10⁻⁶ |
| 0.50 wt% Pd | 3.52 × 10⁻⁶ |
| 1.00 wt% Pd | 5.11 × 10⁻⁶ |
| 2.50 wt% Pd | 3.77 × 10⁻⁶ |
| 5.00 wt% Pd | 3.76 × 10⁻⁶ |
Table 5.
Quantum yield (QY) for the Pd–TiO2 photocatalyst when using 0.15 g/L. All reported data are average values of three repeats.
Table 5.
Quantum yield (QY) for the Pd–TiO2 photocatalyst when using 0.15 g/L. All reported data are average values of three repeats.
| Semiconductor | QY (%) |
|---|---|
| F–127 TiO2 | 5.0 |
| F-127–0.25 wt% Pd–TiO2 | 13.7 |
| F-127–0.50 wt% Pd–TiO2 | 12.8 |
| F-127–1.00 wt% Pd–TiO2 | 10.9 |
| F-127–2.50 wt% Pd–TiO2 | 9.6 |
| F-127–5.00 wt% Pd–TiO2 | 8.5 |
Table 6.
Quantum yield for 1.00 wt% Pd–TiO2 photocatalyst at different photocatalyst concentrations in the slurry.
Table 6.
Quantum yield for 1.00 wt% Pd–TiO2 photocatalyst at different photocatalyst concentrations in the slurry.
| Catalyst Concentration (g/L) | QY (%) |
|---|---|
| 0.15 | 10.9 |
| 0.30 | 14.5 |
| 0.50 | 22.4 |
| 1.00 | 30.8 |
© 2019 by the authors. Licensee MDPI, Basel, Switzerland. This article is an open access article distributed under the terms and conditions of the Creative Commons Attribution (CC BY) license (http://creativecommons.org/licenses/by/4.0/).
Share and Cite
MDPI and ACS Style
Rusinque, B.; Escobedo, S.; Lasa, H.d. Photocatalytic Hydrogen Production Under Near-UV Using Pd-Doped Mesoporous TiO2 and Ethanol as Organic Scavenger. Catalysts 2019, 9, 33. https://doi.org/10.3390/catal9010033
AMA Style
Rusinque B, Escobedo S, Lasa Hd. Photocatalytic Hydrogen Production Under Near-UV Using Pd-Doped Mesoporous TiO2 and Ethanol as Organic Scavenger. Catalysts. 2019; 9(1):33. https://doi.org/10.3390/catal9010033
Chicago/Turabian StyleRusinque, Bianca, Salvador Escobedo, and Hugo de Lasa. 2019. "Photocatalytic Hydrogen Production Under Near-UV Using Pd-Doped Mesoporous TiO2 and Ethanol as Organic Scavenger" Catalysts 9, no. 1: 33. https://doi.org/10.3390/catal9010033
Note that from the first issue of 2016, this journal uses article numbers instead of page numbers. See further details here.