2.1. Turnover Rate Comparison for Alcohol Oxidation in Gas Phase and Liquid Phase
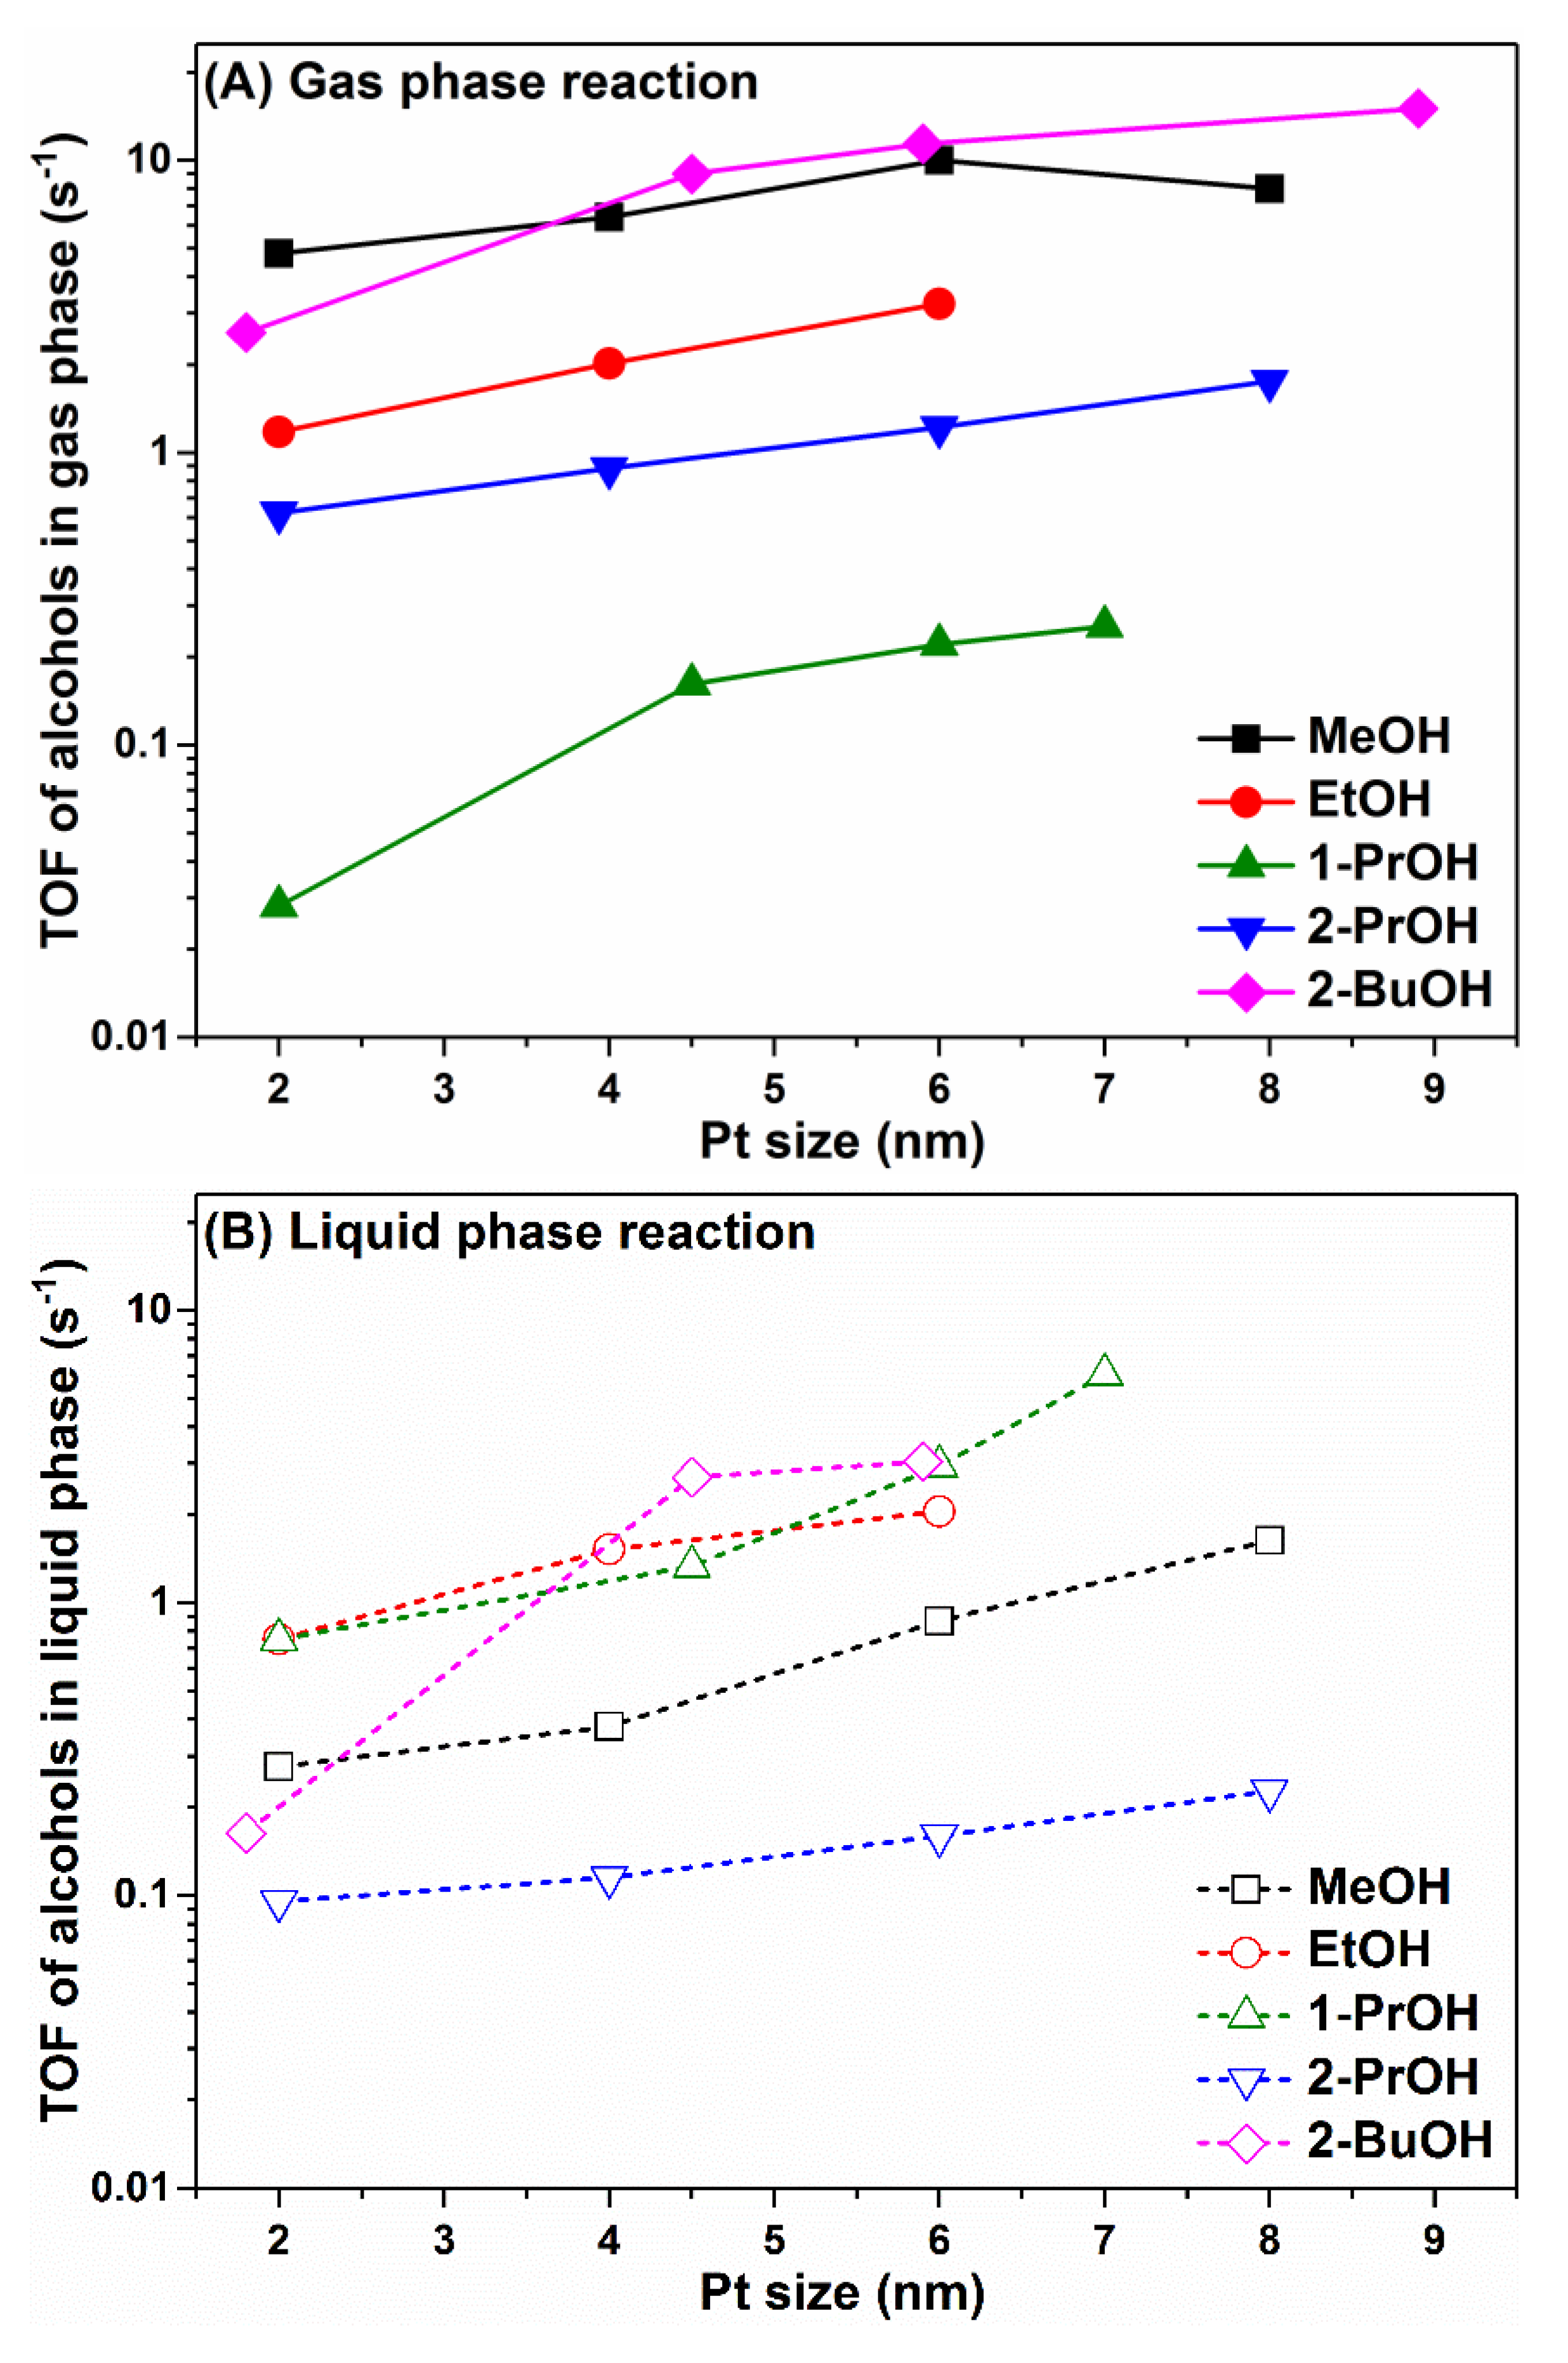
Figure 1 shows the turnover frequency (TOF) of different alcohols in catalytic oxidation reactions producing carbonyl compounds in both gas phase and liquid phase. As we can observe, different alcohols in the gas phase oxidation reaction showed distinct turnover rates; for example, at 60 °C, MeOH showed the highest TOF, followed by EtOH, 2-PrOH and 1-PrOH. The saturated vapor pressure of MeOH, EtOH, 1-PrOH and 2-PrOH at 20 and 60 °C, either cited from literature or calculated using Antoine Equation, are also shown here [
23,
24,
25]. From
Figure 1, it can also be seen that, interestingly, there seems to be a good correlation between gas phase alcohol oxidation reaction rates and alcohol vapor pressure. Alcohols with higher vapor pressure such as MeOH, EtOH, and 2-PrOH have many more dynamic molecules in the gas phase; thus, it can reach the catalyst surface, react to form intermediates/products, and leave the catalyst surface more efficiently. In contrast, alcohol with lower vapor pressure such as 1-PrOH has less dynamic molecules in the gas phase, and these molecules are either “reluctant” to reach the catalyst surface or “stick” to the surface upon contact without leaving quickly, thus resulting in the lower reaction rates in the gas phase oxidation reaction. For 2-BuOH oxidation in gas phase, the reaction was carried out at 80 °C; therefore, the direct comparison of reaction rates between 2-BuOH and other alcohols was not performed here.
For the liquid phase oxidation reactions using pure alcohols, in most cases, such as for MeOH, EtOH, 2-PrOH and 2-BuOH, the turnover rates were lower than those in the gas phase reaction. 1-PrOH was an exception that the liquid phase reaction rate under such condition was higher than that in the gas phase. For gas phase alcohol oxidations, it should be noted that the alcohol to oxygen ratio was controlled at 1:5 (~0.48 mM of alcohols and ~2.41 mM of O
2), while in the liquid phase reaction this alcohol to oxygen ratio was much higher (~4 orders of magnitude depending on alcohol density) than that in the gas phase due to much higher density of alcohols in pure liquid phase. Therefore, for reasonable comparison, we diluted the liquid phase alcohols to one thousandth using a neutral solvent, heptane, which does not show a clear impact on the reaction kinetics of alcohol oxidations under similar reaction conditions [
22]. In this way, the liquid phase alcohol concentrations ranged from 10 to 24 mM, and the dissolved O
2 concentration in the liquid phase (alcohol plus heptane) was about 16.7 mM, making the liquid phase reaction conditions much more similar/comparable to the gas phase reaction conditions. It is evident that, even under comparable alcohol molecular density on Pt nanoparticle surface after 1000 times dilution including MeOH, EtOH, 1-PrOH and 2-PrOH, the reaction rates in the liquid phase were about 1~4 magnitude slower than those in the gas phase reaction. The dilution of 2-BuOH in the liquid phase was not performed, but based on the dilution results for other alcohols, the reaction rate of 2-BuOH would be further decreased upon dilution resulting in much lower activity. These results suggest that the reaction rates of catalytic alcohol oxidation heavily depended on the reaction phase (gas phase versus liquid phase), and the intrinsic root cause for such discrepancy should be understood at the molecular level.
2.2. Size Effect of Pt Nanoparticles on Alcohol Oxidation in Gas Phase and Liquid Phase
Both gas phase and liquid phase alcohol oxidations were carried out on Pt nanoparticles with precisely controlled particle sizes, i.e., 2–9 nm Pt loaded into MCF-17 mesoporous silica. Accordingly, we could study the Pt nanoparticle size dependence of the turnover rates, as well as the product selectivity for different alcohols under both reaction conditions.
As shown in
Figure 2A, for all the alcohol oxidations in the gas phase, including MeOH, EtOH, 1-PrOH, 2-PrOH at 60 °C and 2-BuOH at 80 °C, the turnover rates all showed a monotonic increase as the Pt nanoparticle size grew (except a single point for MeOH oxidation on 8 nm Pt). A very similar trend was also observed for all alcohol oxidations in the liquid phase, as shown in
Figure 2B. These results indicate that the alcohol oxidation reactions preferentially took place on step sites or terrace sites on larger Pt nanoparticles, while the corner sites or edge sites on smaller Pt nanoparticle were not favorable for alcohol oxidations, probably due to their too-strong affinity to oxygenated species blocking the catalyst surface, which was not beneficial to the rate-determining dehydrogenation process of alcohol adsorbates [
1,
26].
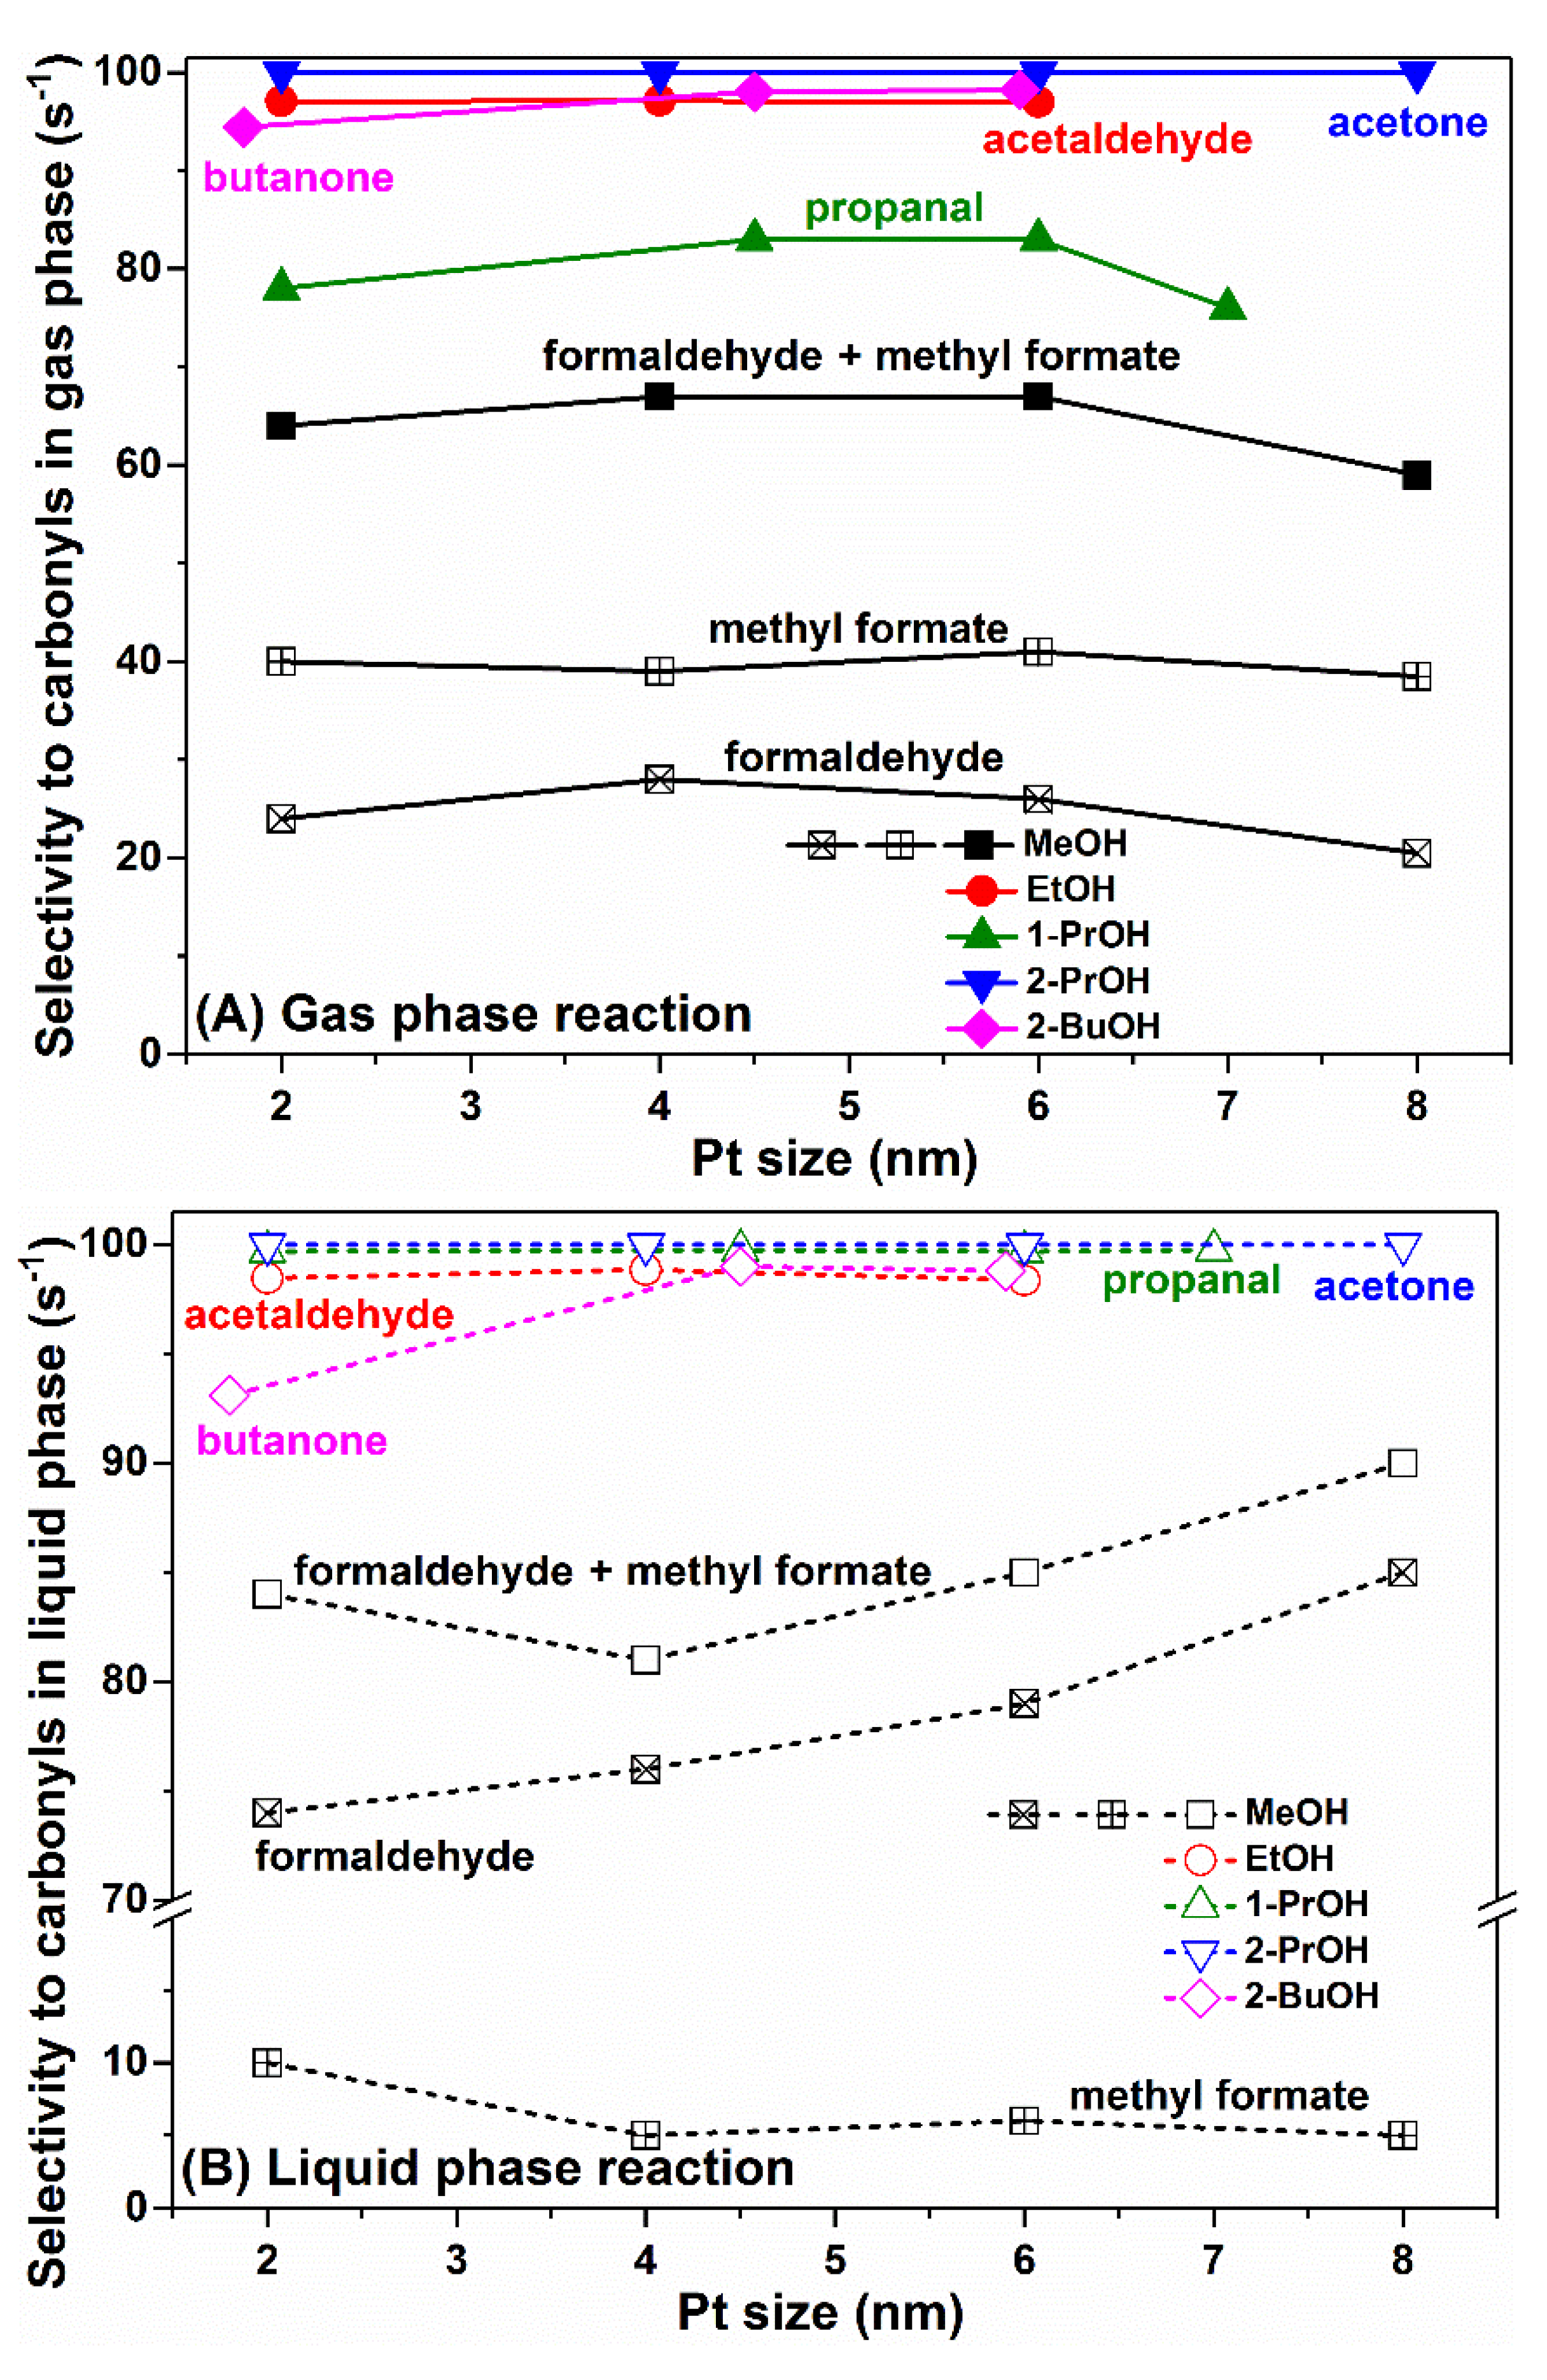
For all alcohol oxidations that we studied in both gas phase and liquid phase, except for CO
2 resulting from complete oxidation, the products were mainly carbonyl compounds from partial oxidation.
Figure 3A shows the selectivity to carbonyl compounds in the gas phase alcohol oxidations. For gas phase MeOH oxidation, the main products were formaldehyde (less) and methyl formate (more), and the selectivity to these two compounds was about 60–70%. No clear correlation between formaldehyde plus methyl formate selectivity and Pt nanoparticle size was observed, except that the highest selectivity was observed on 4–6 nm Pt nanoparticles. For gas phase EtOH oxidation, the main product was acetaldehyde, with selectivity as high as 97%. For gas phase 1-PrOH oxidation, the main product was propanal, and similar to the MeOH case, the highest selectivity to propanal (>80%) was also observed on 4–6 nm Pt nanoparticles. For gas phase 2-PrOH oxidation, acetone was the only product. Moreover, for gas phase 2-BuOH oxidation, the selectivity to butanone on 4–6 nm Pt nanoparticles (ca. 97%) was also slightly higher than that on 2 nm Pt.
Figure 3B shows the selectivity to carbonyl compounds in liquid phase alcohol oxidations. For liquid phase MeOH oxidation, interestingly, much more formaldehyde was produced than methyl formate, and the selectivity to formaldehyde plus methyl formate (ca. 80–90%) was also much higher than that in the gas phase reaction (60–70%). Smaller Pt nanoparticles (such as 2 nm) were more likely to catalyze the deep oxidation of MeOH, thus resulting in the formation of more methyl formate, while larger Pt nanoparticles (such as 4–8 nm) were more favorable for formaldehyde formation with monotonic correlation with particle size. For all other alcohols, including EtOH, 1-PrOH, 2-PrOH and 2-BuOH, the selectivity to carbonyl compounds in the liquid phase oxidation reactions were either similar or higher than those in the gas phase reactions (see 1-PrOH data for more apparent comparison), implying that the complete oxidation of alcohols in liquid phase was actually inhibited to a certain extent, probably due to the different molecular density or molecular orientation on the Pt nanoparticle surface.
2.4. H2O Effect on Alcohol Oxidation in Gas Phase and Liquid Phase on Pt Nanoparticles
H2O is one of the products of the complete or partial oxidation of alcohols, especially in gas phase reactions, where the selectivity to carbonyl compounds is not as high as that in the liquid phase reactions. Therefore, it is indispensable to check the H2O effect on alcohol oxidation not only in the gas phase but also in the liquid phase, which is quite essential for practical application.
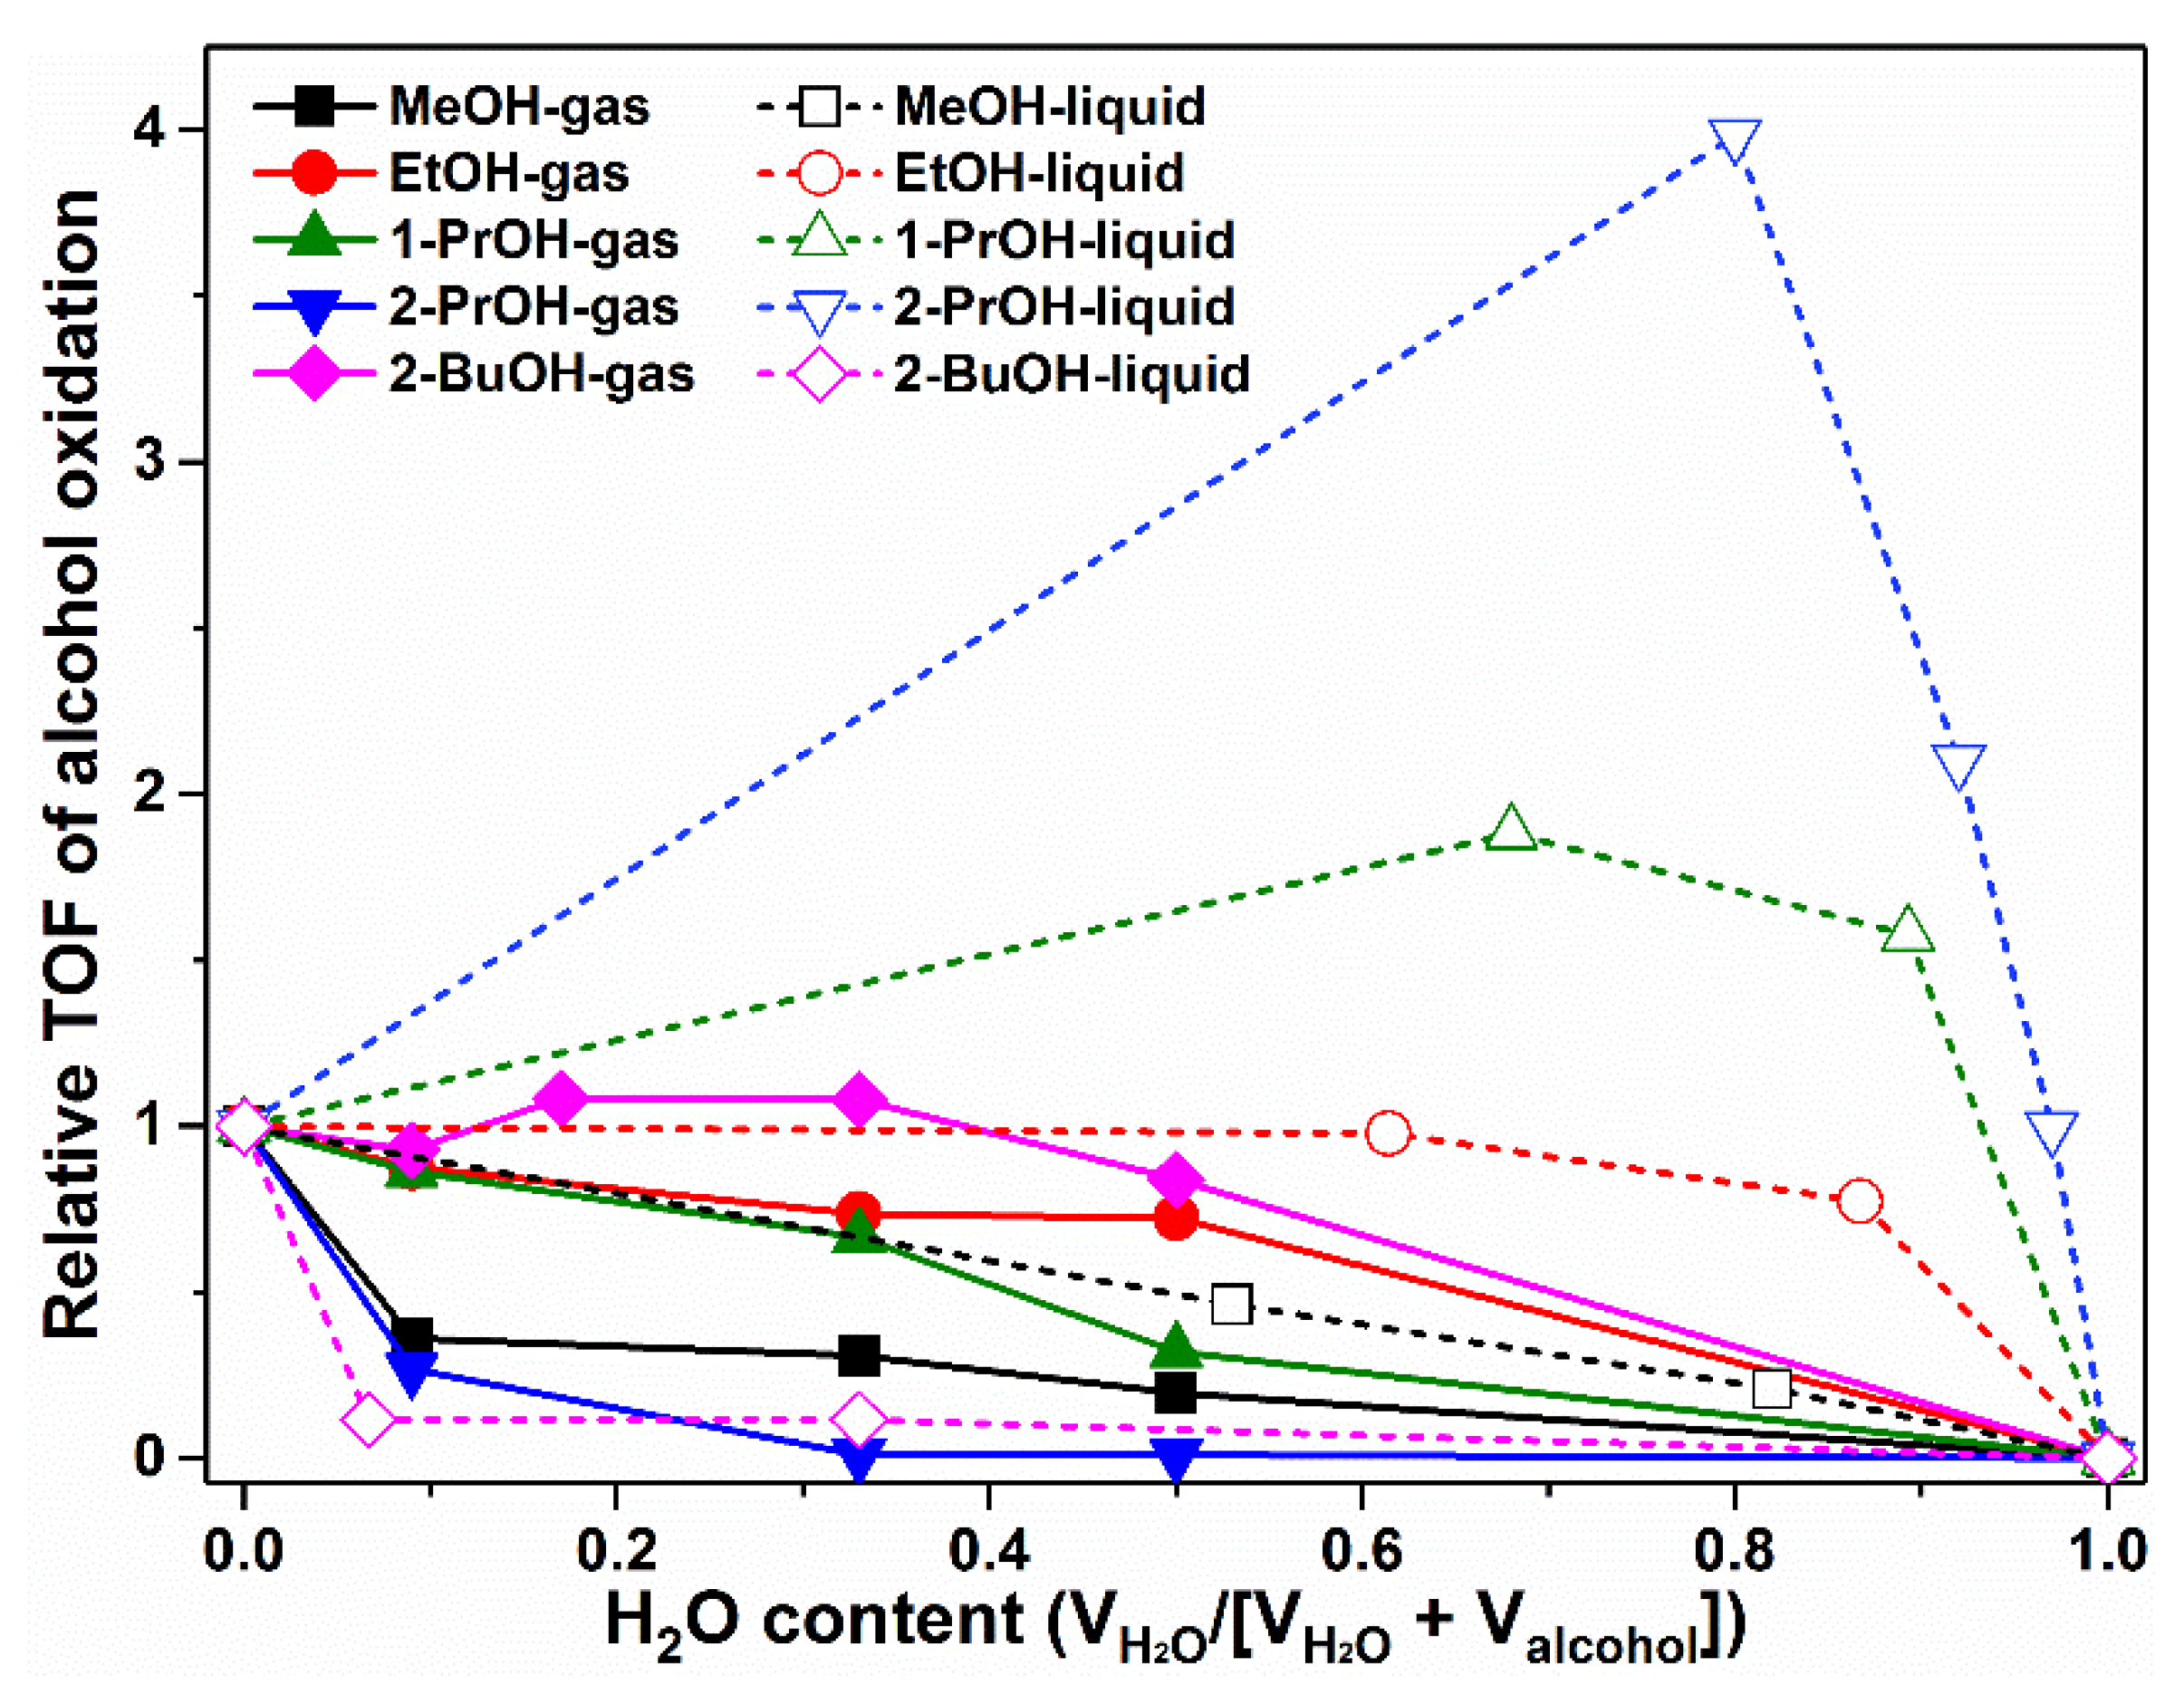
As the results of relative turnover rates shown in
Figure 5 demonstrate, for the gas phase MeOH, EtOH, 1-PrOH and 2-PrOH oxidations, water vapor definitely inhibited the reaction rates significantly, with the TOF values dramatically increasing upon water vapor addition. This could be simply explained by the competitive adsorption of H
2O onto the Pt surface, thus obviously blocking the active sites for catalytic alcohol oxidations. However, in the case of gas phase 2-BuOH oxidation, the water vapor addition showed some promotion effect at medium H
2O doping amounts (i.e., H
2O content of 0.17 and 0.33), which seemed to be unusual.
In the case of the liquid phase alcohol oxidations, the responses to aqueous water addition were totally different from case to case. For example, with regard to liquid MeOH oxidation, H2O showed a nearly linear inhibition effect on reaction rate, but still the inhibition effect was not as strong as that in the gas phase reaction. In the case of the liquid phase EtOH oxidation, the inhibition effect of H2O seemed to be mitigated to a certain extent. While, for the liquid phase 1-PrOH and 2-PrOH oxidations, H2O actually acted as a “promoter” or “co-catalyst”, which significantly increased the turnover rates. Such striking difference of reaction rates in response to aqueous water in the liquid phase alcohol oxidations comparing to response to water vapor in the gas phase alcohol oxidations was mainly due to the totally different alcohol molecular density and/or alcohol molecular orientation on the Pt surface. As for the liquid phase 2-BuOH oxidation, the impact of aqueous water on reaction rate was totally opposite to other alcohols. Even with a very small amount of aqueous water addition, such as an H2O content of 0.07, the turnover rate dramatically decreased to ca. 12% of the initial value, indicating that aqueous water here actually acted as a “poisoning agent” for the liquid phase 2-BuOH oxidation.
So far, totally opposite effects were observed for H
2O on gas phase and liquid phase 2-BuOH oxidations, in contrast to other alcohols, which can probably be explained by the hydrophilicity difference of alcohols. MeOH, EtOH, 1-PrOH and 2-PrOH are all miscible in water, while 2-BuOH has a solubility of only 12.5 g per 100 mL of H
2O due to the existence of more hydrophobic alkyl chains [
9,
29]. The capping agent that we used for Pt nanoparticle synthesis, which was polyvinylpyrrolidone (PVP), actually showed amphiphilicity. In the case of the gas phase 2-BuOH oxidation with relatively high mobility of alcohol and H
2O molecules, once the 2-BuOH molecules had reached and attached to the Pt surface, H
2O could not be adsorbed onto the surface anymore in any significant amount due to the hydrophobic nature of the 2-BuOH molecules. Therefore, water vapor only showed a slight inhibition effect, or even some promotion effect (probably due to the more hydroxyl group formation in the presence of H
2O) [
30,
31], on gas phase 2-BuOH oxidation. Contrastingly, in the case of the liquid phase 2-BuOH oxidation with relatively low mobility of alcohol and H
2O molecules, aqueous water would preferably gather around the Pt surface due to the hydrophobic nature of 2-BuOH. Such aqueous water layer blocked the access to the surface active sites thus resulting in the decrease of turnover rate in the liquid 2-BuOH oxidation [
9].
2.5. Case Study of 1-PrOH Oxidation Using SFG Spectra Analysis on Pt Thin Film and DFT Calculation in Gas and Liquid Phases
To fully understand the picture of how alcohol molecules interact with the Pt surface under different reaction conditions, taking 1-PrOH as first example, we conducted SFG spectra study at 60 °C, which is an in situ technique with surface-specific characteristics, on Pt thin films prepared by electron-beam deposition.
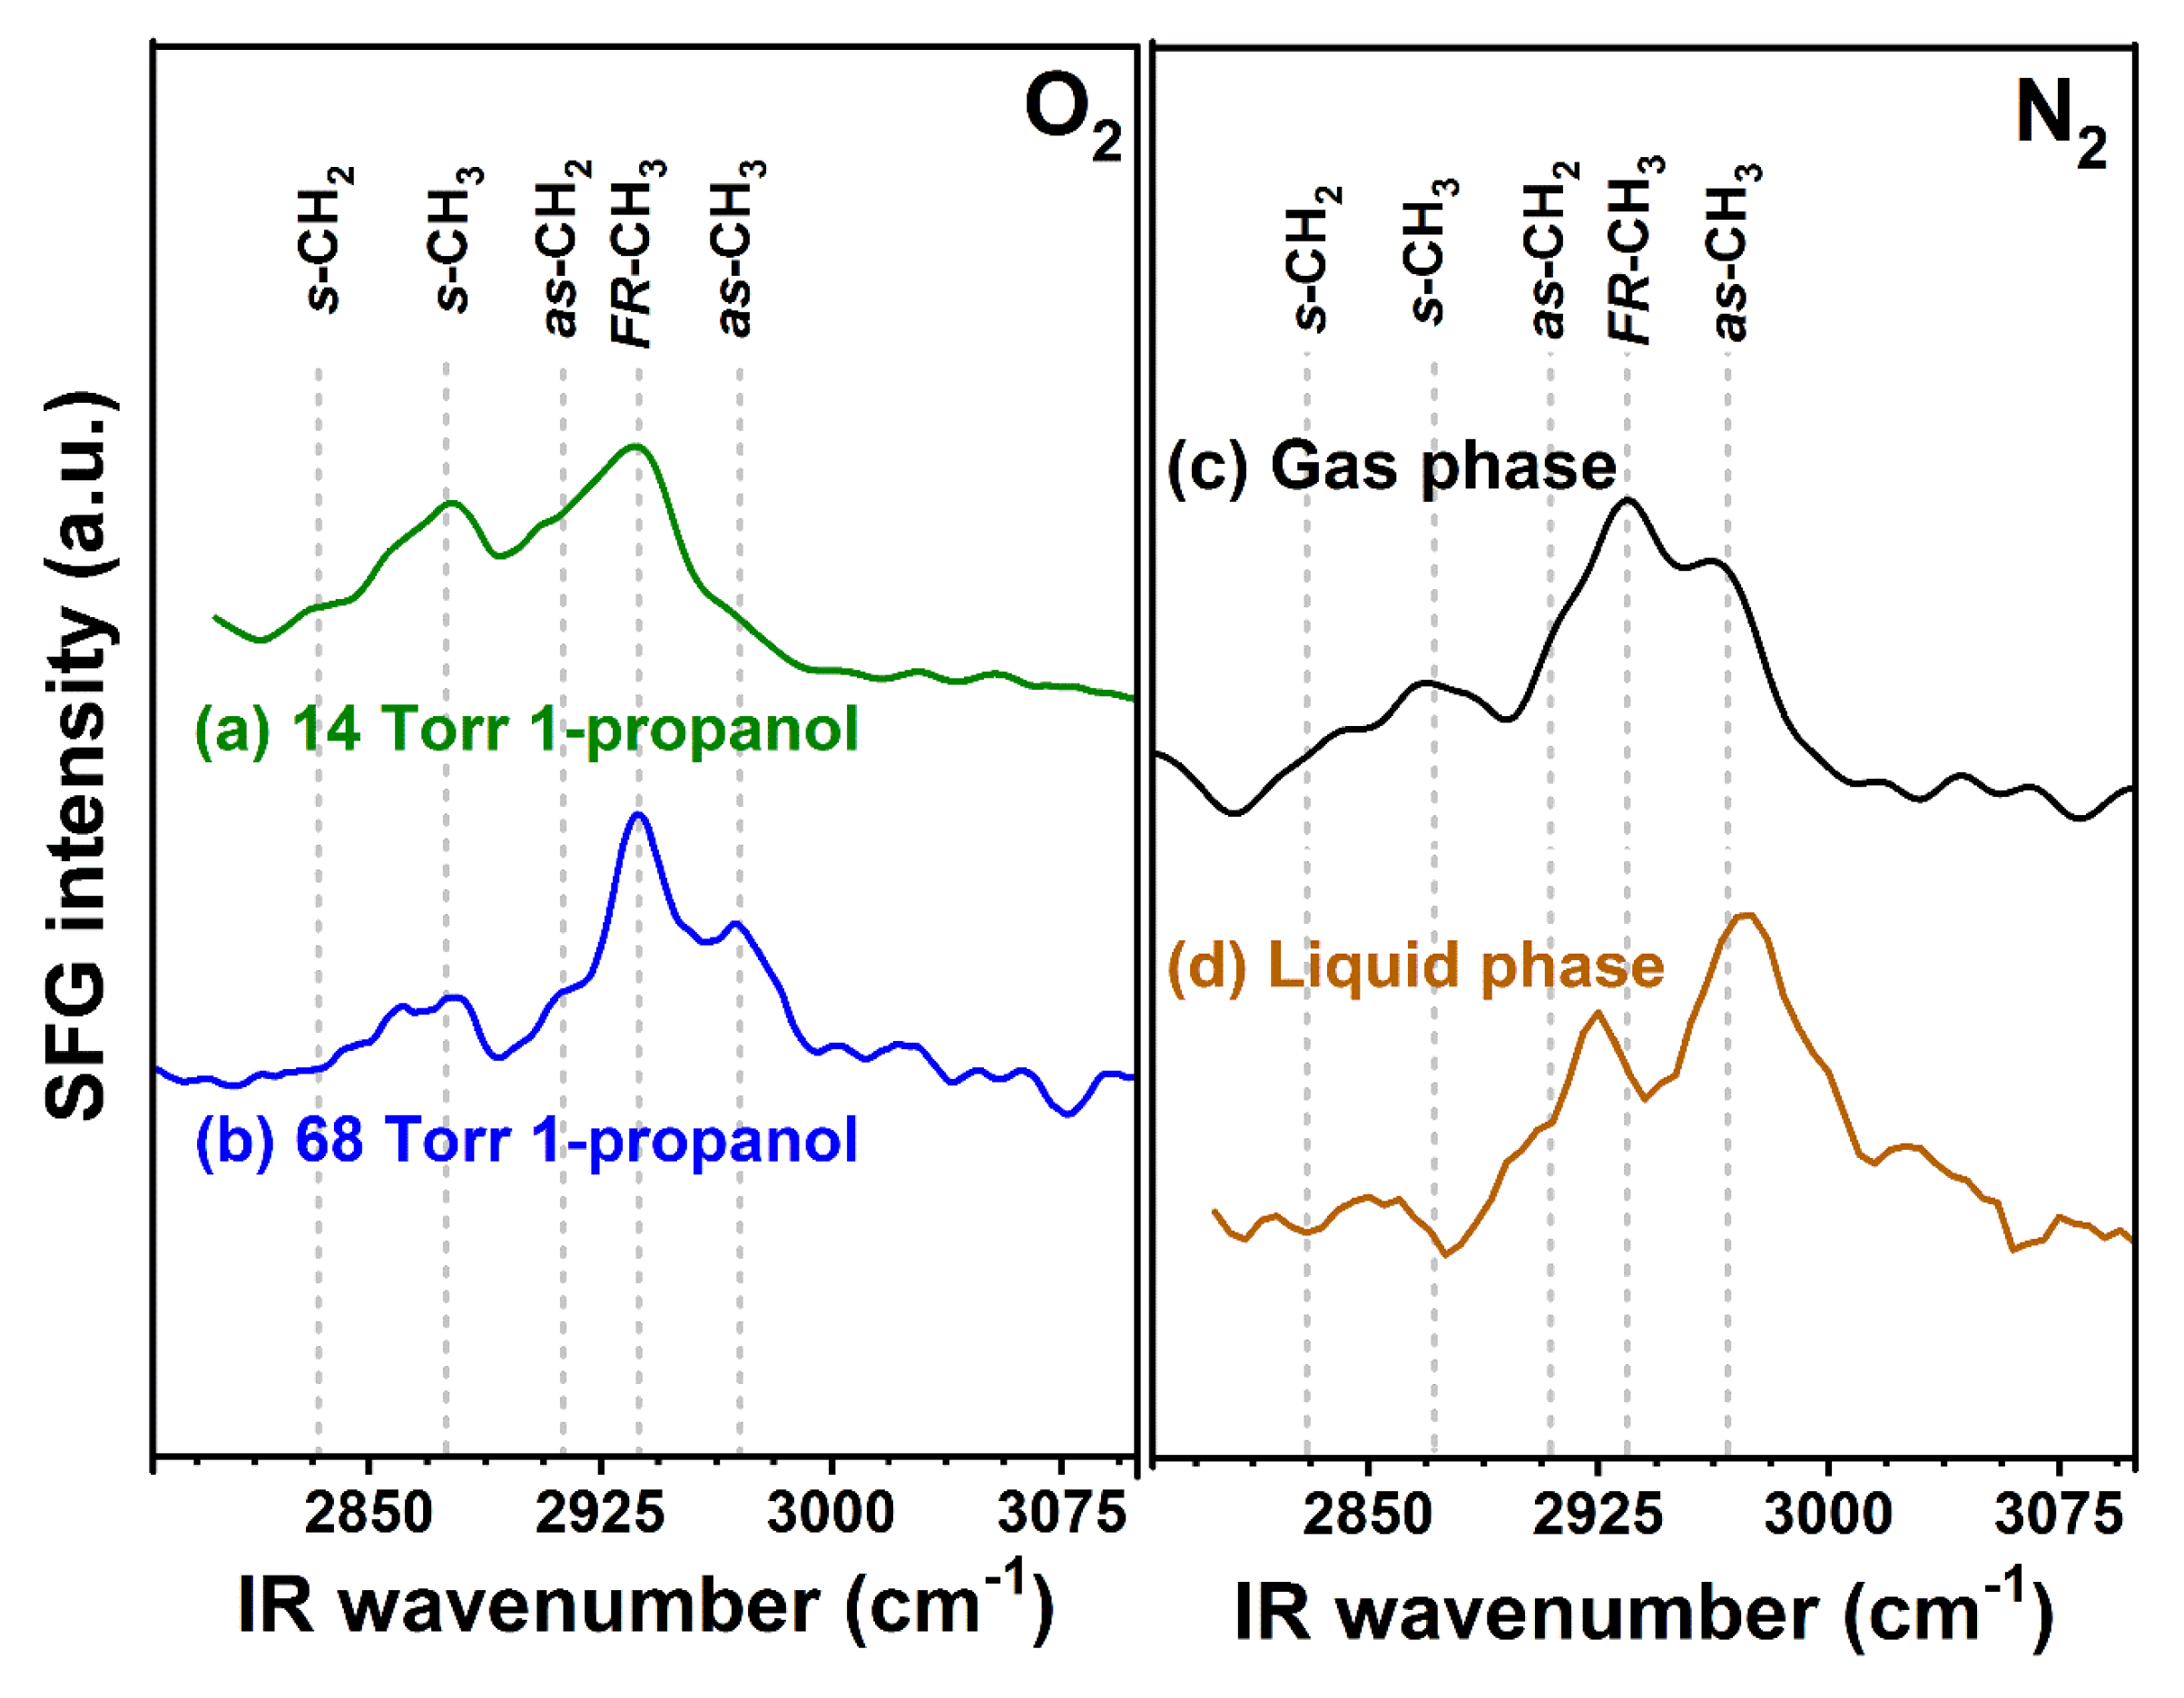
Figure 6 shows the SFG spectra of 1-PrOH in gas phase on Pt thin film during reaction at 60 °C with 101.33 kPa of O
2 and different partial pressures of gas phase 1-PrOH, as well as the SFG spectra of 1-PrOH on Pt thin films at 60 °C purged by N
2 in the gas phase and liquid phase. As can clearly be seen from
Figure 6a,b, the SFG peaks that can be assigned to symmetric CH
2 stretching mode at ca. 2840 cm
−1, symmetric CH
3 stretching mode at ca. 2870 cm
−1, asymmetric CH
2 stretching mode at ca. 2910 cm
−1, CH
3 Fermi resonance at ca. 2935 cm
−1, and asymmetric CH
3 stretching mode at ca. 2970 cm
−1 can be observed on the Pt surface under 1.87 and 9.07 kPa of 1-PrOH with O
2. However, these spectra showed noticeable differences not only in the strength of CH
2 peaks but also in the ratios between asymmetric and symmetric methyl stretches. This is absolutely clear evidence that surface 1-PrOH molecule orientation on Pt is highly dependent on the alcohol molecular density in the gas phase. It should be noted that our SFG spectra were measured under
ppp polarization. Therefore, the absolute 1-PrOH molecule orientation cannot be directly determined. However, SFG theory predicts that a change in the orientation of specific functional groups (such as –CH
3 groups in this study) relative to the studied surface can result in the intensity ratio change of different vibration modes [
22]. In such studies, the surface of Pt was considered to possess C
∞ν symmetry, while the 1-PrOH molecule orientation on the Pt surface was assumed to be isotropic with regard to the azimuthal angle to the z-axis. Therefore, the average tilt angle of –CH
3 group from the Pt surface (θ) could be described by such a measurement, and changes in the asymmetric/symmetric mode ratio among the spectra were accordingly representative of a change of θ [
21]. A low value of θ describes a molecule with its methyl group pointing up from the surface (“standing up” configuration), and a high value describes a molecule close to the surface (“lying down” configuration) [
22]. The ratio of asymmetric/symmetric stretches of –CH
3 group under 1.87 kPa of 1-PrOH with O
2 was ca. 0.5:1, while this ratio significantly increased to 2:1 under 9.07 kPa of 1-PrOH with O
2, which was four times higher. This indicates a significant change in θ between low and high 1-PrOH partial pressure, and thus a different molecular orientation on the Pt surface.
Furthermore, as shown in
Figure 6c,d, we also measured the SFG spectra of 1-PrOH on the Pt surface under N
2 purge with 10.67 kPa partial pressure in the gas phase and pure 1-PrOH in the liquid phase. The SFG spectrum recorded for gas phase 1-PrOH under such conditions showed peaks that could be assigned to –CH
3 groups with symmetric stretching mode at ca. 2870 cm
−1, strong Fermi resonance at ca. 2935 cm
−1, and asymmetric stretching mode at ca. 2960 cm
−1, as well as –CH
2 groups as weak shoulders with symmetric stretching mode at ca. 2840 cm
−1 and asymmetric stretching mode at ca. 2910 cm
−1. This spectrum was pretty similar to the one recorded under O
2 with 1-PrOH with a relatively larger partial pressure in
Figure 6b, although in this case, both the asymmetric and symmetric stretches from –CH
3 and –CH
2 groups showed some increase in peak intensity, mainly due to the higher 1-PrOH density on Pt surface. Contrastingly, the SFG spectrum recorded for liquid phase 1-PrOH showed significantly changed peak patterns compared to the gas phase, with slightly decreased peak intensity in –CH
2 stretching modes and greatly increased intensity ratio between asymmetric and symmetric stretching modes from –CH
3. We believe that the average tilt angle of –CH
3 group from Pt surface, θ, for 1-PrOH in the liquid phase became much smaller than that in the gas phase, which means that the molecular structure in the liquid phase was more ordered and more preferentially in a “standing up” configuration than the “lying down” configuration in the gas phase [
21].
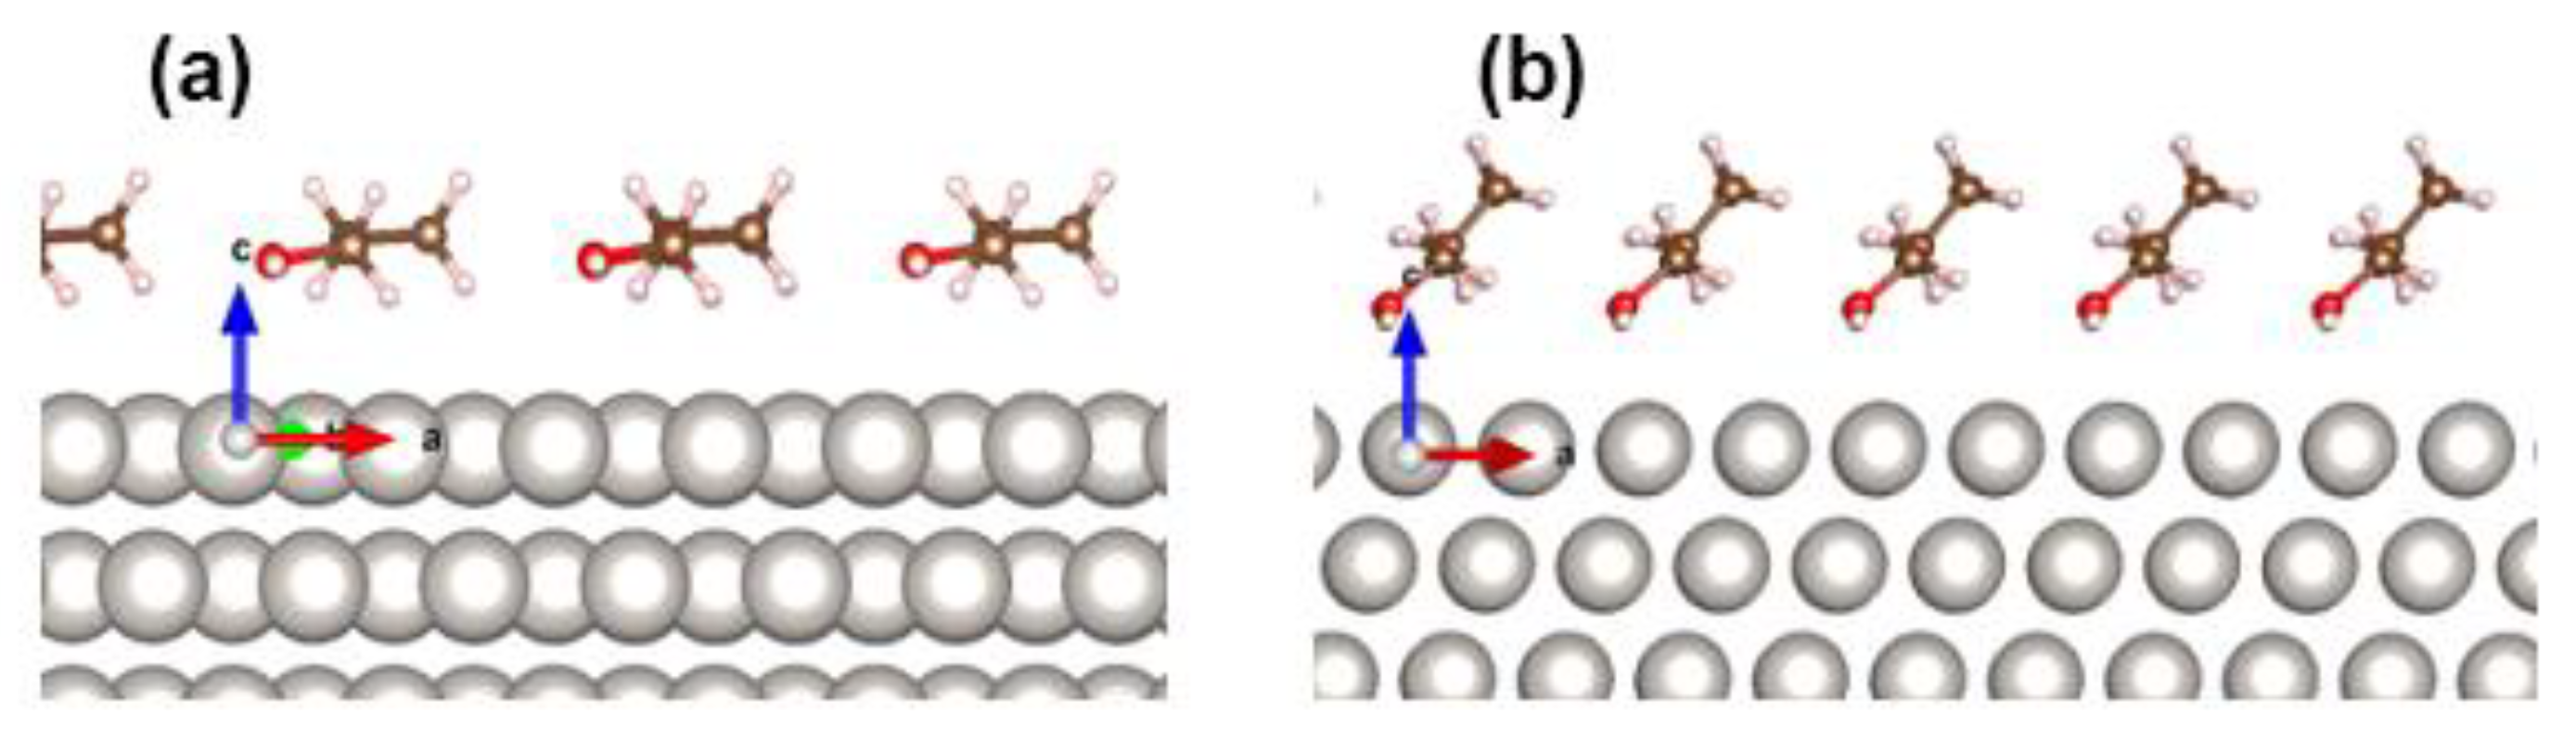
To better understand the molecular orientation of 1-PrOH on Pt surface in gas and liquid phases, we performed DFT theoretical calculation to simulate the concentration-dependent 1-PrOH configurations on Pt(111), which is the dominant surface for Pt nanoparticles used for alcohol oxidation reactions. More details about DFT calculation, as well as comprehensive results, can be found in our previous publication [
21], while
Figure 7 herein shows the minimum energy configurations of 1-PrOH molecules on Pt(111) surface with a surface molecular coverage of 0.94 molecules/nm
2, which represents the gas phase condition, as well as a surface molecular coverage of 3.75 molecules/nm
2, which represents the liquid phase condition. As we can see, under the gas phase condition, the 1-PrOH molecules were nearly “lying down” on the Pt surface, with the bisectrix connecting hydroxyl-O and methyl-C forming 6° angle relative to the surface (as shown in
Table 1). Under the liquid phase condition, the 1-PrOH molecules were nearly “standing up” on the Pt surface with the bisectrix forming 41° angle relative to the surface (as shown in
Table 1). These results are very consistent with the SFG spectral data and well explain the relative peak intensity changes that we observed for 1-PrOH on Pt thin film in the gas phase versus liquid phase. It should also be noted that, as shown in
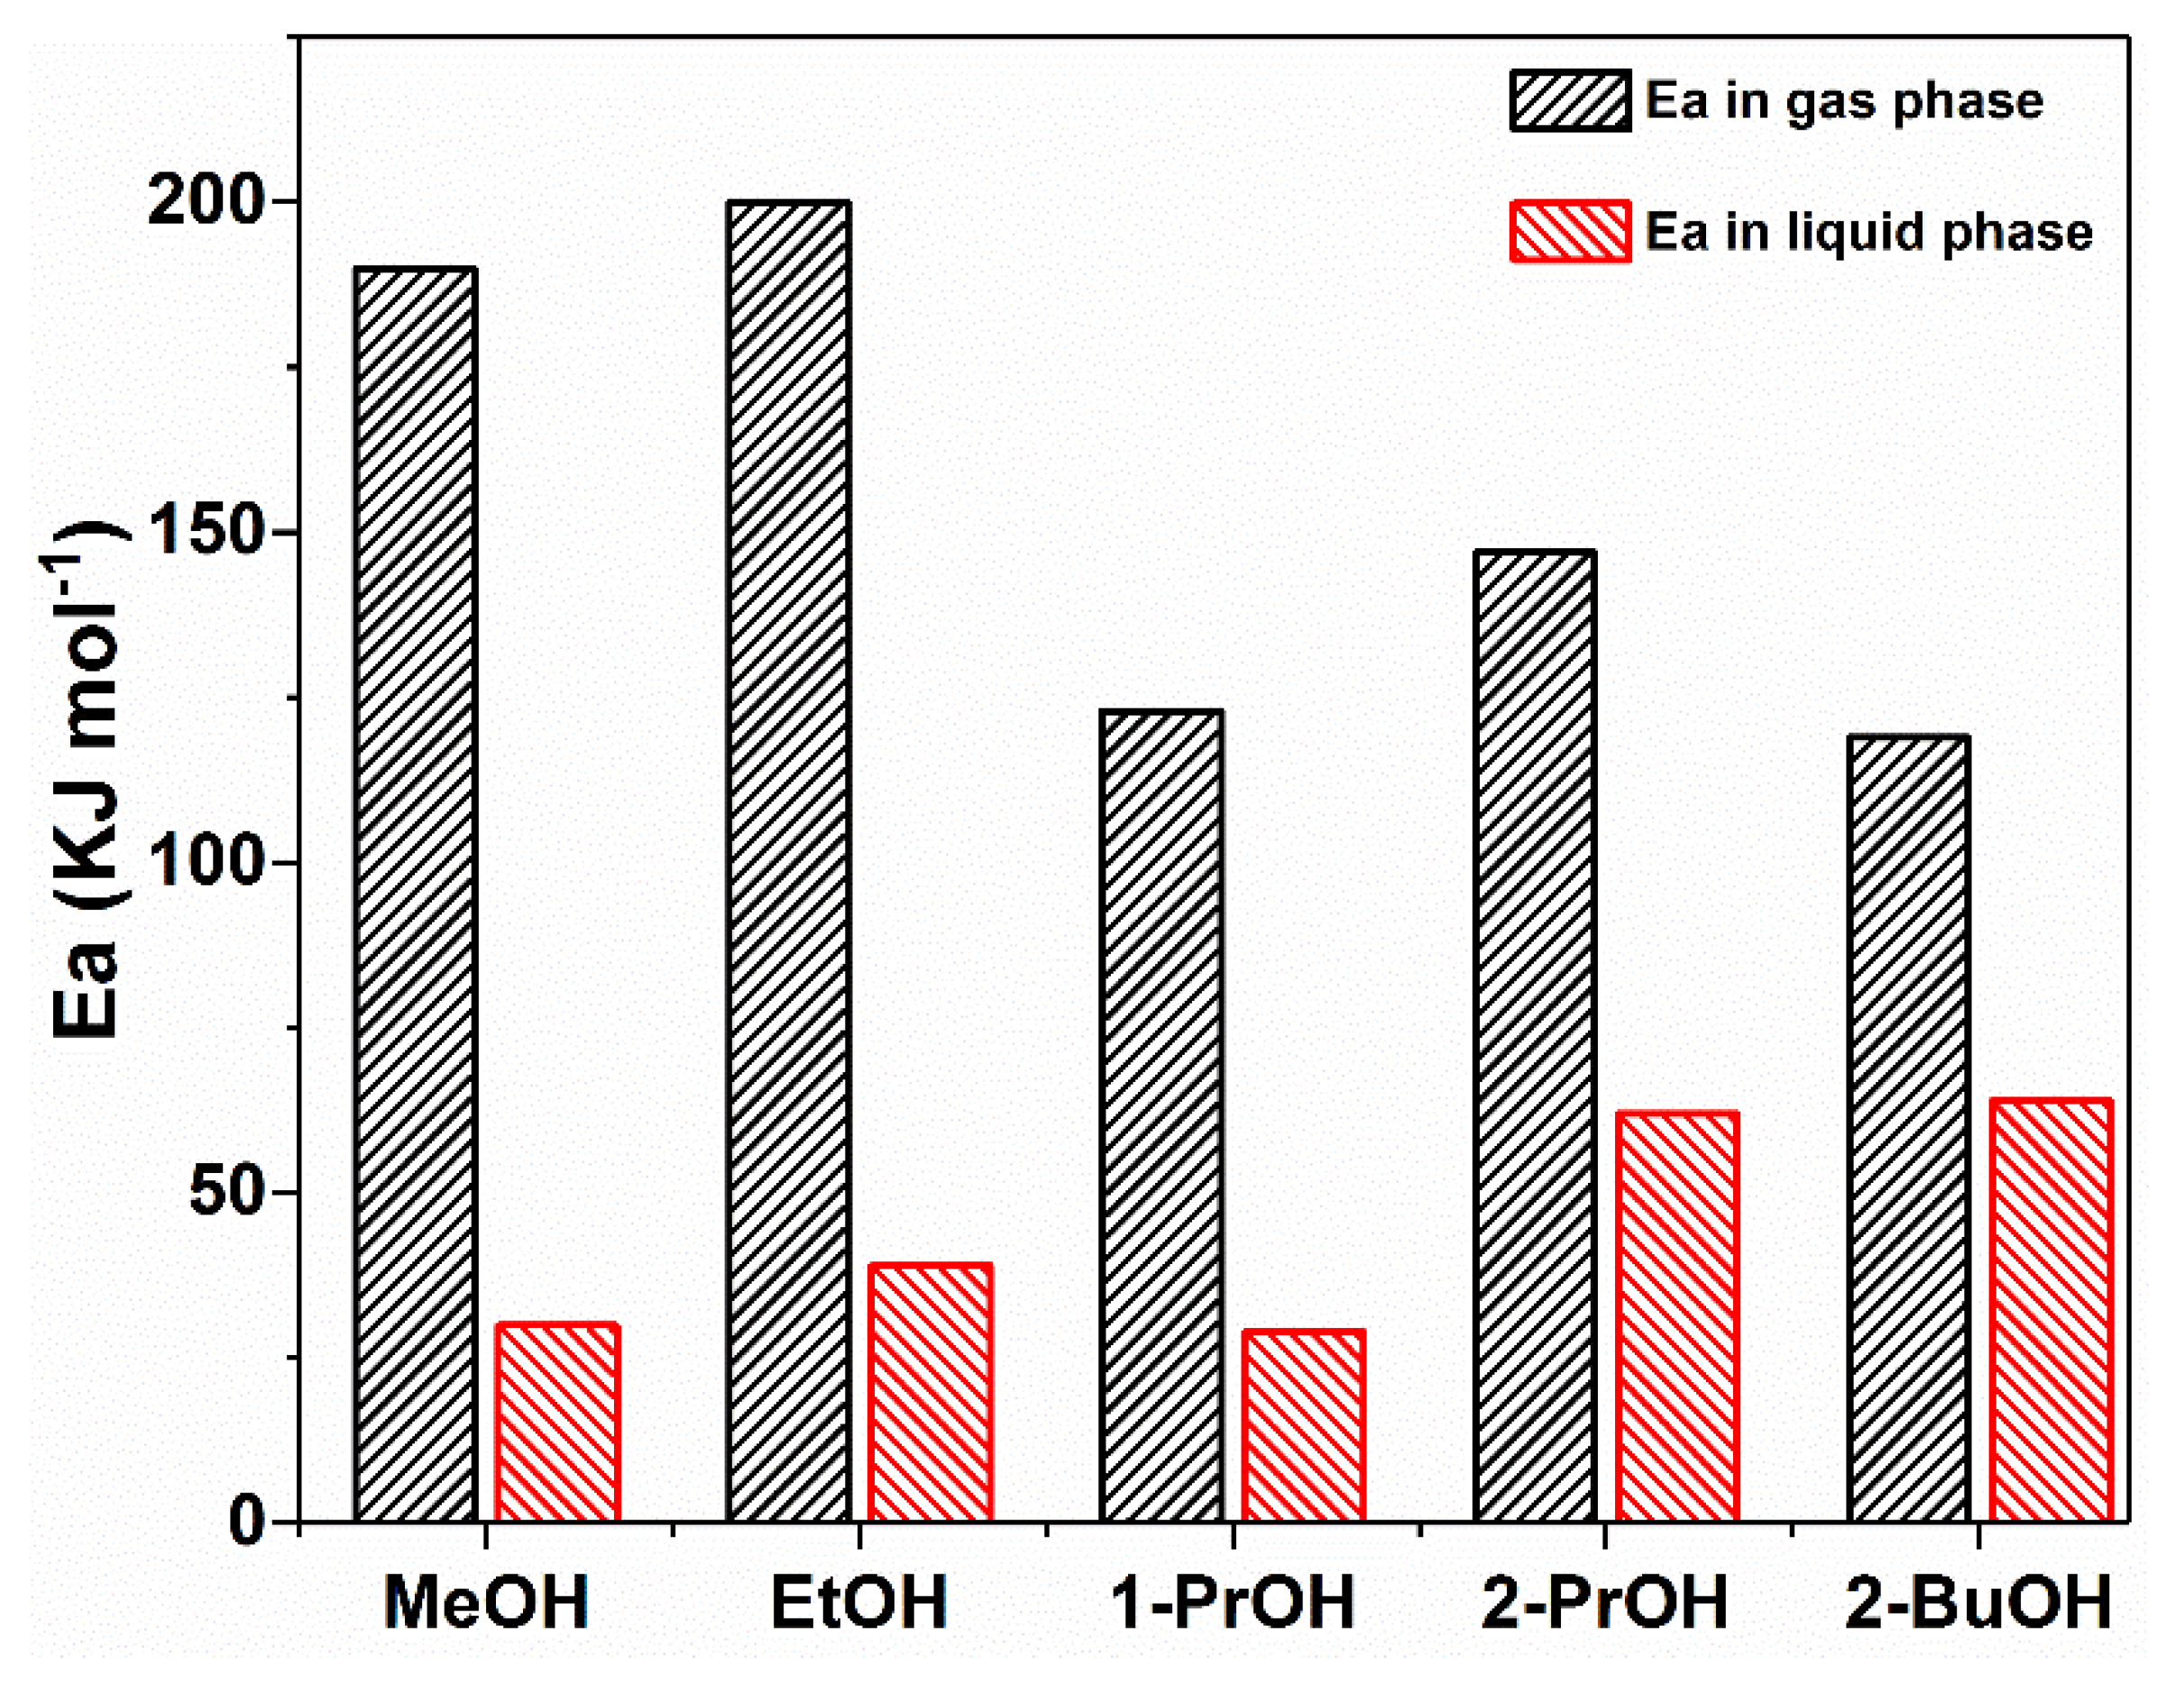
Table 1, the distance between the hydrogen atoms from alcohol hydroxyl group in 1-PrOH and Pt surface under the liquid phase condition was calculated as 0.261 nm, which was 0.056 nm closer to the Pt surface than the corresponding distance under the gas phase condition, i.e., 0.317 nm. This indicates that the hydroxyl group, and possibly also the α-H connecting to the same carbon atom in the 1-PrOH molecule, were much more easily activated/dehydrogenated in the liquid phase than in the gas phase, well explaining why the activation energy for 1-PrOH oxidation in the liquid phase was much lower than that in the gas phase.
2.6. Case Study of 2-PrOH Oxidation Using SFG Spectra Analysis on Pt Nanoparticles and DFT Calculation in Gas Liquid Phases
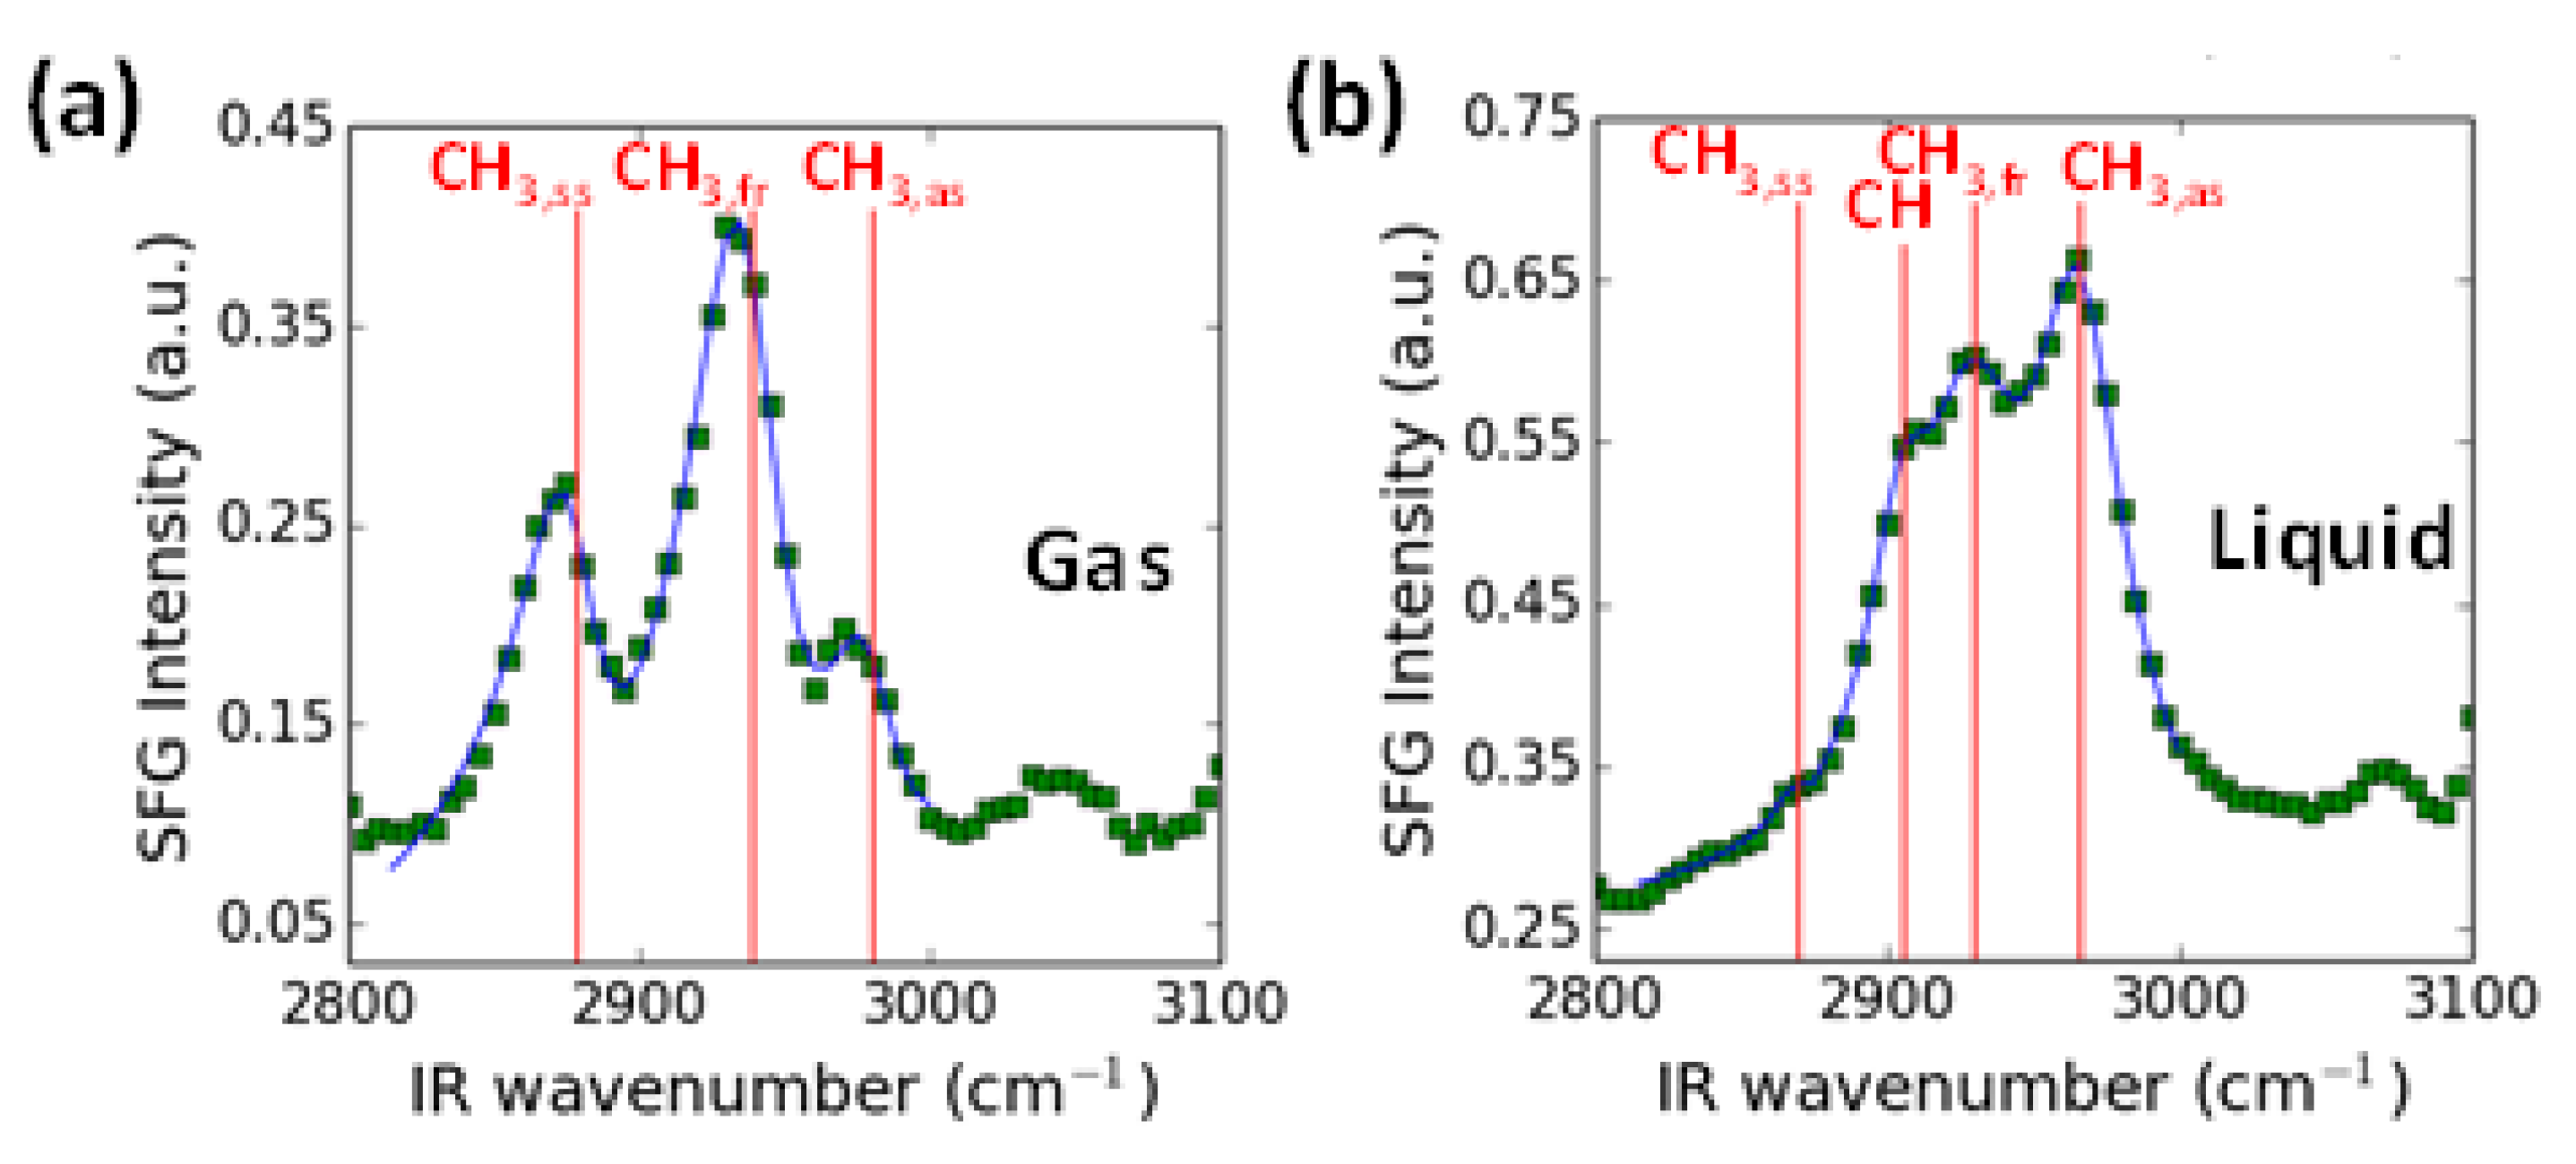
Similar to the 1-PrOH case, we also performed SFG spectra analysis of 2-PrOH oxidation in both gas phase and liquid phase on 4 nm Pt nanoparticles, which was more representatively reflective of the real catalytic reactions that we studied. As shown in
Figure 8a, in the gas phase 2-PrOH oxidation reaction, three noticeable SFG peaks showed up, which could be ascribed to symmetric stretches of CH
3,ss at ca. 2875 cm
−1, Fermi resonance mode of CH
3,fr at ca. 2940 cm
−1, and asymmetric stretches of CH
3,as at ca. 2970 cm
−1. The intensity ratio between asymmetric and symmetric stretches of –CH
3 was relatively small in this case. Not surprisingly, as shown in
Figure 8b, in the liquid phase 2-PrOH oxidation reaction, all three SFG peaks ascribed to CH
3,ss, CH
3,fr, CH
3,as showed up, along with a stretching peak from –CH group at ca. 2905 cm
−1; however, the intensity ratio between asymmetric and symmetric stretches of –CH
3 showed significant increase compared to the gas phase spectrum. These results indicate that the average tilt angle of –CH
3 group from Pt nanoparticle surface, θ, must have changed from a high value in the gas phase to a low value in the liquid phase, suggesting a change in the 2-PrOH molecular configurations from “lying down” to “standing up” on Pt surface, respectively. More detailed discussions about the possibility of 2-PrOH orientation varieties in different phases determined by SFG experimental data can be found in our previous publication [
22].
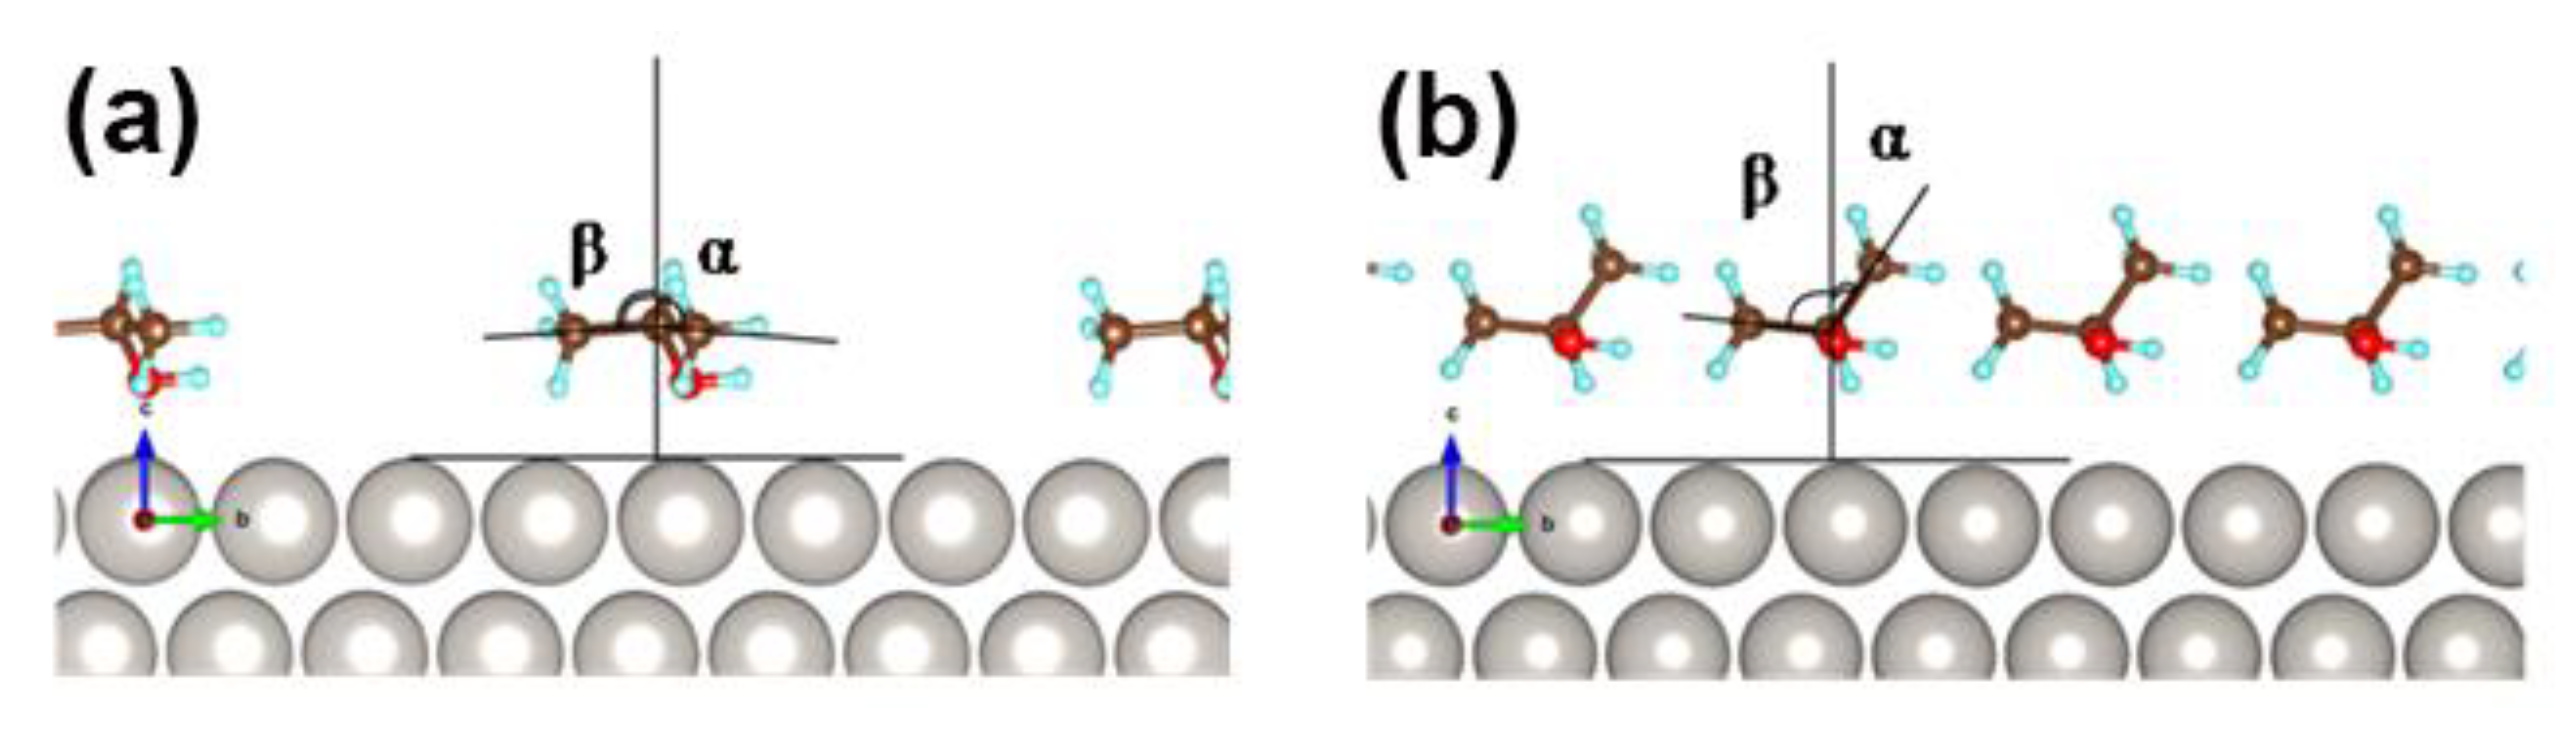
To further confirm the 2-PrOH molecular configuration on the Pt surface, similarly to the 1-PrOH case, DFT theoretical calculation was also performed in our study. As the nanoparticles and nanoparticle-molecule complexes were too large for ab initio calculation, we still used the most dominant Pt(111) surface to investigate the concentration/phase dependence of 2-PrOH molecular orientations. As shown in
Figure 9a, the minimum energy configuration of 2-PrOH molecules on Pt(111) surface with a low surface coverage of 0.94 molecules/nm
2, which is representative of the gas phase condition, showed a “lying down” pattern, with both of the C–C bonds forming 86° relative to the surface normal (
Table 2). In contrast, as shown in
Figure 9b, the minimum energy configuration of 2-PrOH molecules on the Pt(111) surface with high surface coverage of 3.75 molecules/nm
2, which is representative of the liquid phase condition, showed a “standing up” pattern with one C–C bond forming 84° and the other forming 38° relative to the surface normal (
Table 2). The steric molecular interaction effect can easily explain this phenomenon, i.e., alcohol molecules are forced to take the “standing up” position in order to pack more molecules on the Pt surface [
22]. As shown in
Table 2, the 2-PrOH molecular orientation change from “lying down” to “standing up” on the Pt surface also resulted in the distance change between α-H and the nearest Pt atom, i.e., 0.445 nm in the gas phase and 0.257 nm in the liquid phase. Obviously, in such cases, much easier cleavage/dehydrogenation of α-H from α-C (which was considered as the rate-determining step in 2-PrOH oxidation [
1]) can be achieved in the liquid phase than in the gas phase. This is also consistent with the observation that 2-PrOH oxidation showed much lower activation energy in the liquid phase than that in the gas phase [
22].
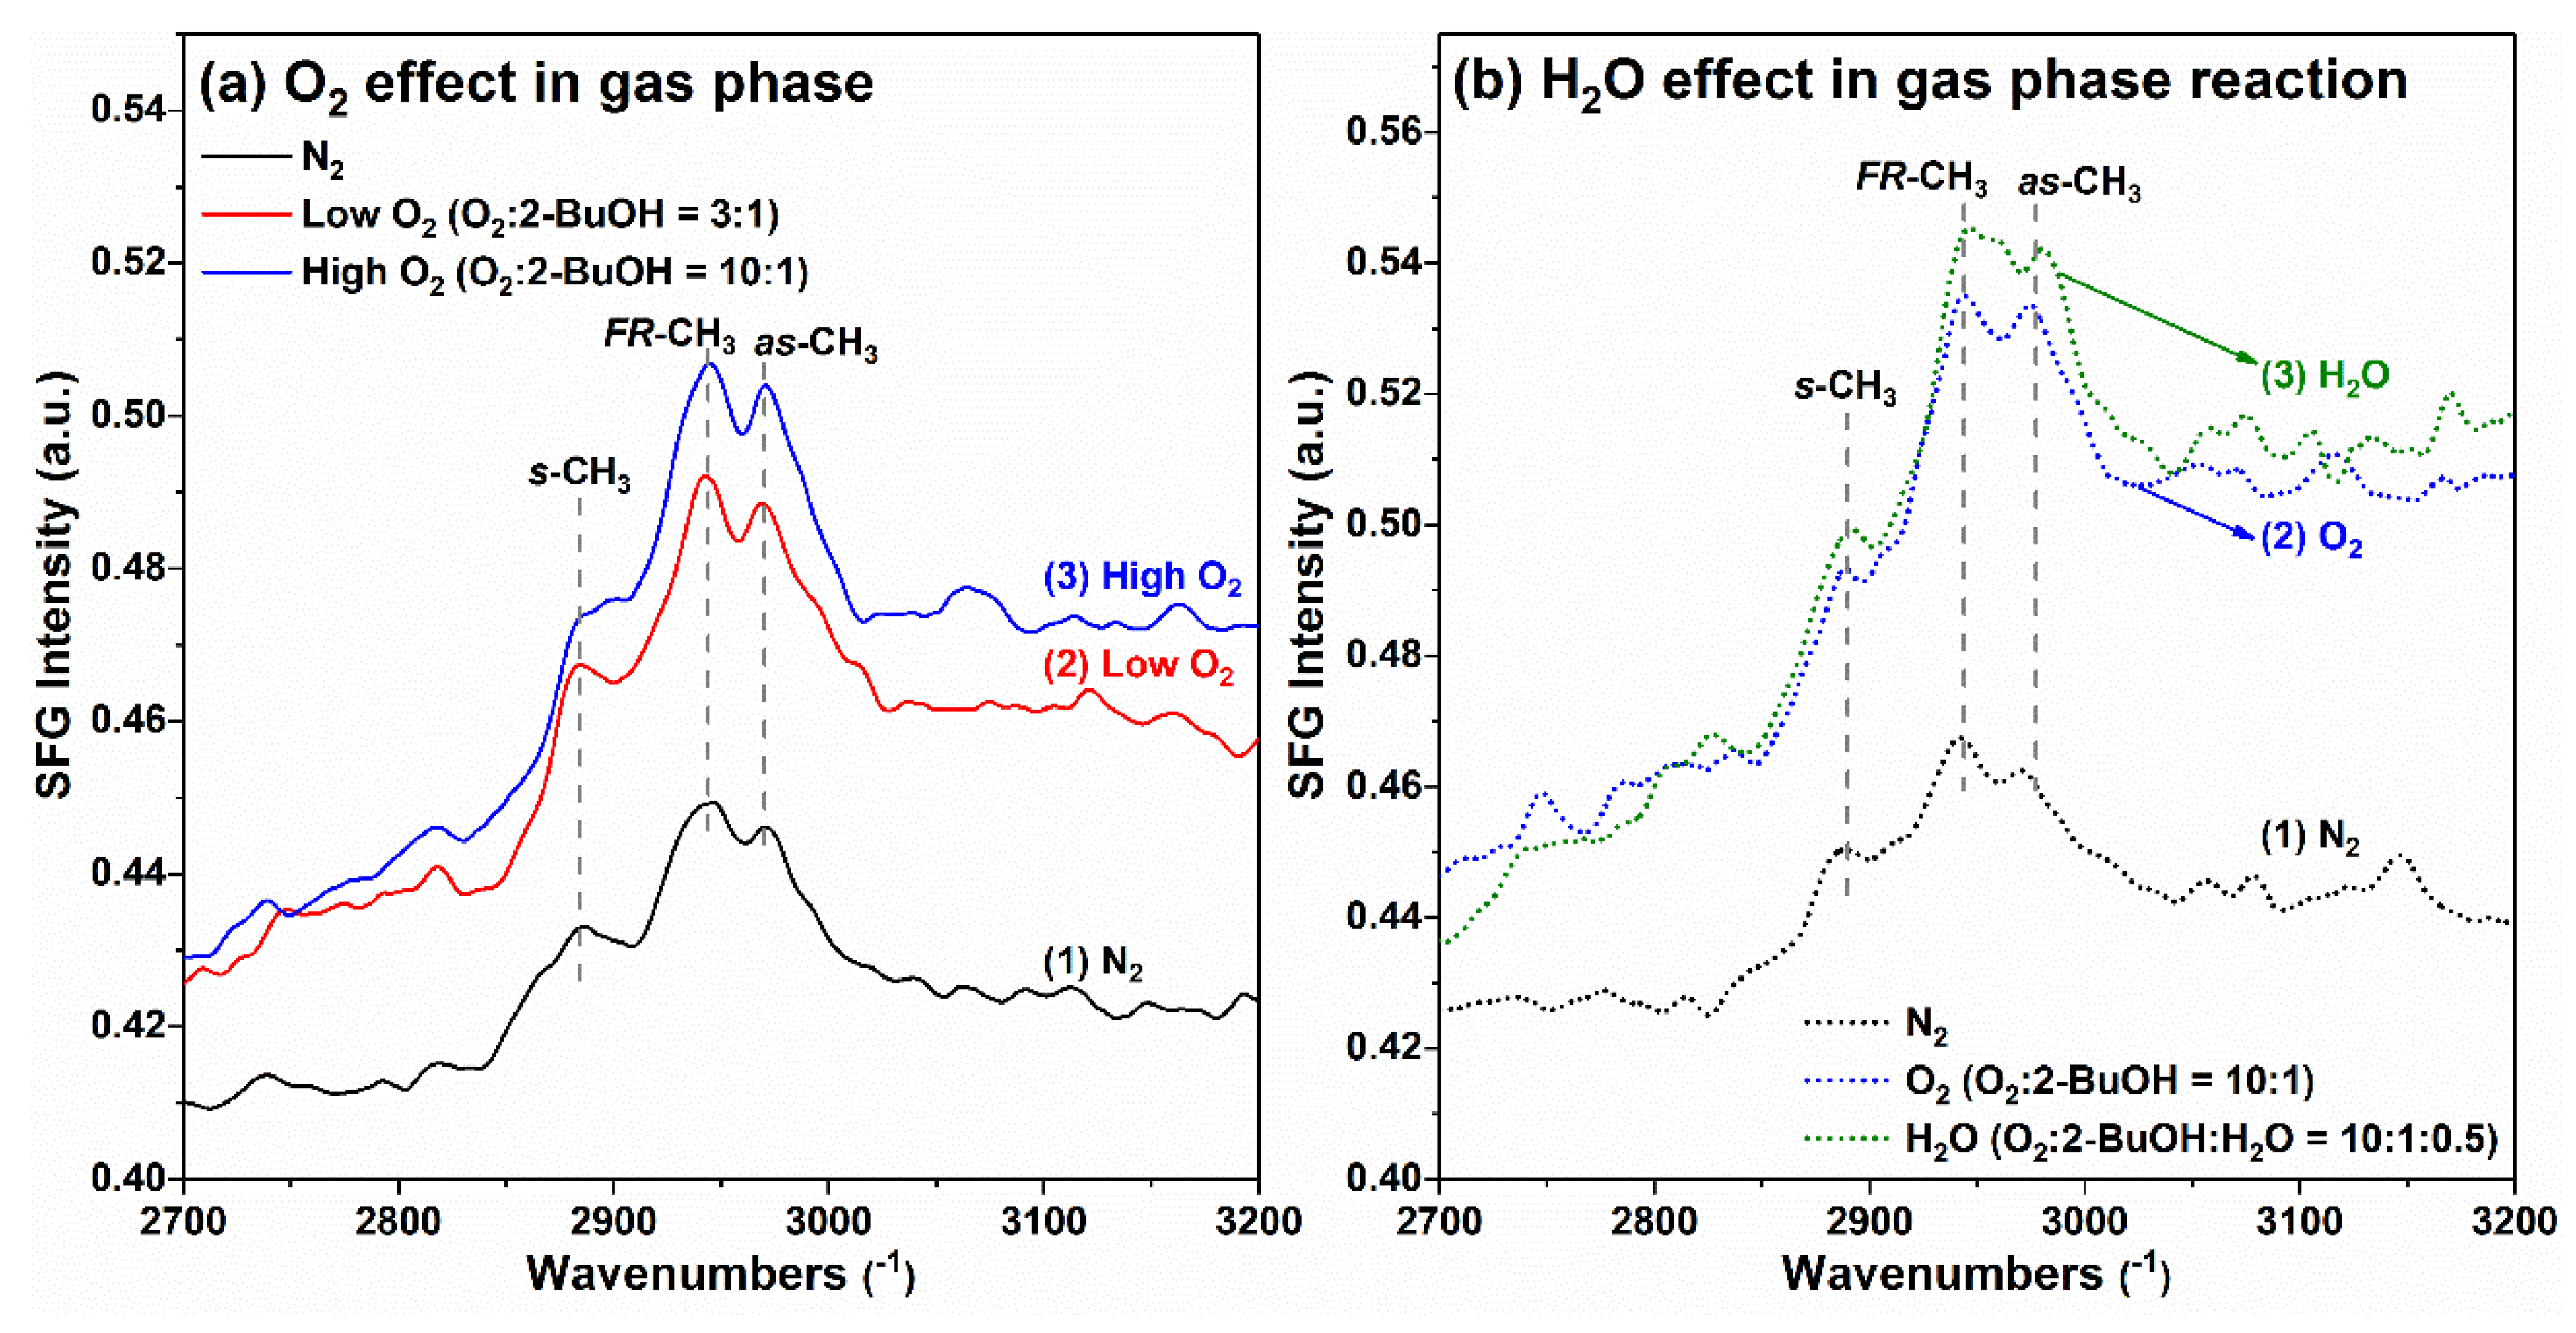
2.7. Case Study of 2-BuOH Oxidation Using SFG Spectra Analysis on Pt Thin Film in Gas Phase: O2 and H2O Effect
To better understand the 2-BuOH oxidation reaction in the gas phase, we performed SFG spectra analysis using various oxygen concentrations as well as added water vapor to see if there was any influence on the 2-BuOH molecular orientation. As shown in
Figure 10a, we first collected the SFG spectrum under 2-BuOH with N
2, and the peaks ascribed to –CH
3 symmetric stretching mode at ca. 2880 cm
−1, –CH
3 Fermi resonance mode at ca. 2945 cm
−1, and –CH
3 asymmetric stretching mode at ca. 2975 cm
−1 could be observed. Based on the SFG results for 1-PrOH, 2-PrOH on the Pt surface, and judging from the intensity ratio between asymmetric and symmetric stretching mode for 2-BuOH case, it can be empirically deduced that the 2-BuOH molecules also had a “lying down” configuration on the Pt surface in the gas phase. Interestingly, in the presence of oxygen, even at a relatively low level (O
2:2-BuOH = 3:1), a much higher SFG signal for 2-BuOH was observed than that in the presence of inert N
2. Further increasing the oxygen content to O
2:2-BuOH = 10:1 yielded an even higher SFG signal. These results indicate that with the co-existence of O
2 in the gas phase, either the 2-BuOH molecules on Pt surface tended to be more ordered, or much higher surface 2-BuOH molecular density could be achieved.
In order to provide insight into the influence of water vapor on 2-BuOH oxidation on Pt surface in the gas phase, the SFG spectra were also taken under reaction conditions with and without H
2O addition. As the results shown in
Figure 10b indicate, again, the introduction of O
2 into system resulted in the sharp increase of SFG peak intensity, but the introduction of water vapor into system seemed to have little effect on the SFG peaks (even with some increased peak intensity for –CH
3,fr and –CH
3,as). These results well support the catalytic data for the gas-phase 2-BuOH oxidation, in which the addition of water vapor had minimal effect on the reaction turnover rates. The SFG spectra analysis for 2-BuOH oxidation on Pt surface in the liquid phase is essential and highly recommended in future study to provide more information for alcohol oxidation chemistry in both phases at molecular level.

 ,
, 


