Article

New Insights on the Oxidation of Unsaturated Fatty Acid Methyl Esters Catalyzed by Niobium(V) Oxide. A Study of the Catalyst Surface Reactivity

by
Christian Marcelo Paraguassú Cecchi
1,2,*,
Darí Cesarín-Sobrinho
2,
Aurélio Baird Buarque Ferreira
2 and
José Carlos Netto-Ferreira
2,3,*
1
Instituto Federal Fluminense (IFF), Campus: Campos-Centro, Campos dos Goytacazes 28030-130, Brazil
2
Departamento de Química, ICE, Universidade Federal Rural do Rio de Janeiro (UFRRJ), BR-465, Km 7, Seropédica 23897-000, Brazil
3
Divisão de Metrologia Química, Instituto Nacional de Metrologia, Qualidade e Tecnologia (INMETRO), Duque de Caxias 25250-020, Brazil
*
Authors to whom correspondence should be addressed.
Catalysts 2018, 8(1), 6; https://doi.org/10.3390/catal8010006
Submission received: 17 November 2017 / Revised: 18 December 2017 / Accepted: 22 December 2017 / Published: 3 January 2018

Abstract

:
The catalytic properties of niobium(V) oxide (Nb2O5-CBMN) of different grades: amorphous, optical and ultra-pure, untreated or heat-treated at 400, 500, 700 and 900 °C were studied, before and after interaction with H2O2, by in situ Raman, FTIR-ATR and diffuse reflectance UV-Visible spectroscopy. The presence of different reaction sites for NbO7 and NbO8 type systems, which are directly related to surface defects present in different states of crystallization, were fully characterized. The reactivity of different catalysts obtained from niobium(V) oxide was investigated, using the oxidation of methyl linoleate in the presence of hydrogen peroxide as probe reaction. The reaction was followed by GC-MS, as well as by 1H and 13C NMR spectrometry and the dominant product was 9-oxo-nonanoic acid methyl ester. A reaction mechanism related to an auto-oxidation process must be occurring, leading initially to the formation of hydroperoxides, which decompose rapidly via Hock-type rearrangement, leading to the formation of aldehydes.

1. Introduction

Niobium(V) oxide (Nb2O5) shows different catalytic sites on its surface, depending on preparation and pretreatment, resulting in the occurrence of strong Brönsted acid sites with Hammett H0 acidity values between −8.0 to −5.6. Water-resistant Lewis acid sites may also be present, making niobium(V) oxide an excellent catalyst in processes where water can be generated during the reaction or even when it is used as solvent [1,2].
The great versatility of Nb2O5 as a catalyst stems from its high polymorphism, a consequence of its form of preparation and, in particular, the treatment temperature [3,4]. The most common phases are: amorphous [5], TT (pseudohexagonal or monoclinic geometry, obtained by heat treatment from 300 to 550 °C) [6,7], T (orthorhombic, from 550 to 850 °C) [8] and H (monoclinic, >1000 °C) [9].
The catalytic activity of Nb2O5 depends on the degree of hydration. For calcination temperatures between 100–500 °C, the simultaneous presence of Brönsted and Lewis acid sites can be observed [10]. In this temperature range, structural changes go from amorphous (100–300 °C) to the TT phase (300–500 °C), which corresponds to a dehydration process. Initially, a reversible loss of water molecules contained in the solvation sphere, which are part of the constitutional defects related to the NbO7 and NbO8 systems must be occurring [11], resulting in a small decrease on the catalytic activity due to Brönsted acid sites. On the other hand, the maximum activity value for Lewis acid sites is observed at a temperature of 300 °C. In the temperature range extending from 300 to 500 °C further elimination of structural water can occur, which is related in part to the loss of the catalytic activity of the remaining Brönsted acid sites and the abrupt drop in the surface area [12,13]. The unit cell of TT-Nb2O5 (pseudohexagonal) has the vacancy of an oxygen atom as a structural defect, with each niobium occupying the center of a polyhedron formed by 5 or 6 oxygen atoms and displaying a Nb-O-Nb-O chain structure along this plane [8,14,15,16].
The existence of structural defects related to Brönsted sites was confirmed spectroscopically by the formation of di-oxygen complexes upon treatment of Nb2O5 with hydrogen peroxide, with these di-oxygen species being classified according to the coordination mode as oxo, peroxo, superoxo and hydroperoxide complexes [17,18,19,20,21]. The correlation between the Brönsted acid sites and the structural defects in NbO7 and NbO8 has been established in a study of the selective Friedel-Crafts alkylation reaction of anisole by benzyl alcohol [22]. On the other hand, from a systematic analysis of Lewis sites on niobium(V) oxide it has been proposed that they are associated to constitutional defects due to the vacancy of oxygen atoms in the oxide structure, as observed by X-ray diffraction (XRD) studies of TT and T phases [11,14]. However, these defects are eliminated completely during the heat treatment of Nb2O5 between 300 and 500 °C [10,23]. A second type of strong acid Lewis sites can be found even after treatment at high temperatures (>900 °C) during the formation of the H phase. This Lewis acid sites can be attributed to the presence of NbO4, having the Nb=O oxo system as active species [2,12,24].
Calcination between 500 and 800 °C generates the T phase, consisting of an orthorhombic unit cell where the niobium atom is surrounded by six or seven oxygen atoms [8,14]. At temperatures between 800 and 900 °C there is the appearance of a new phase, which is described as the H phase and is established above 900 °C [15,16,25]. At this temperature, most of the NbO7 and NbO8 systems have been almost completely eliminated, leaving only the NbO4 and NbO6 centers that will be part of the H phase structure [9]. In amorphous Nb2O5·nH2O presenting a high degree of purity, transition from the T phase directly to the H phase under atmospheric pressure is usually observed and occurs at temperatures slightly below 900 °C [15]. Above 900 °C the structure is completely crystallized and well defined. In this case, only a limited number of constitutional defects such as surface hydroxyls are possible, which explains the low or almost absent Nb2O5 catalytic activity due to Brönsted acidity. However, the presence of NbO4-like structures makes it possible to use these oxides in different catalytic processes through Lewis acid sites, which are considered as water-resistant species [26,27,28].
Natural fatty acids and their esters have been traditionally part of the paints and varnishes industry and are becoming a promising alternative source of raw materials for the industry as a substitute for petrochemical feedstocks [29,30,31,32,33,34]. From the synthetic point of view, unsaturated systems are attractive reactive centers for several types of reaction with maintenance or rupture of the carbon chain [34,35,36]. The most relevant processes are those derived from partial or total oxidation of double bonds by the use of transition metals as catalysts. These processes include epoxidation reaction [32,37,38,39,40,41], partial oxidation leading to the production of diols [42,43,44,45,46,47], aldehydes and/or ketones [36,48] or total oxidation with the production of carboxylic acids as the final products [48,49,50,51]. The use of such compounds as intermediates for subsequent chemical processes leads to the formation of polymeric materials, stabilizers, lubricants, plasticizers, composites, surfactants, adhesives and nanocomposites [30,33]. In the food industry, oxidative processes involving the chemical reactivity of the olefinic systems present in unsaturated fatty acids, such as photo oxidation, enzyme catalyzed reaction or auto oxidation, with the latter being the most common, are determinant of nutritional quality and shelf life of products [52,53].
Unsaturated fatty acids can be divided into two groups: monounsaturated (e.g., oleic acid) and polyunsaturated, such as di- and triunsaturated (linoleic and linolenic acid, respectively) and, less abundantly, tetraunsaturated (arachidonic acid) [30]. The relative reactivity of saturated, mono and polyunsaturated acids may be related to the presence of alkylic, allylic or bis-allylic hydrogens, with C-H binding energies of the order of 98, 83 and 77 kcal/mol, respectively [54,55,56]. For example, monounsaturated systems will only be reactive at high temperatures in the auto-oxidation process, whereas the polyunsaturated compounds (linoleic and linolenic esters) react with molecular oxygen at room temperature [57].
The catalytic systems based on niobium oxide are reasonably selective in oxidative processes [58], such as the selective epoxidation of allylic alcohols [59], the opening of epoxy rings [60], the selective oxidation of geraniol [61], the cyclohexene epoxidation [62], the selective oxidation of terpenes [63,64] and the oxidation of unsaturated fatty acid derivatives [49,65].
In view of the numerous catalytic possibilities offered by the use of Nb2O5 after different temperature treatments in combination with the addition of hydrogen peroxide, it was decided to use the oxidation process of oleic and linoleic acid methyl esters to explore the reactivity of the Nb2O5/H2O2 systems. Three grades of niobium(V) oxide were used: HY340, GO and UP (Section 3). These materials were used as received or heat treated at 400, 500, 700 and 900 °C with hydrogen peroxide being added to the samples prior to the reaction. Raman, FTIR-ATR and diffuse reflectance ultraviolet spectroscopy were employed to study the interaction of hydrogen peroxide with the different catalysts. The nature of the reaction products was elucidated by gas chromatography coupled to mass spectrometry (GC-MS) as well as by 1H and 13C NMR.

2. Results and Discussion

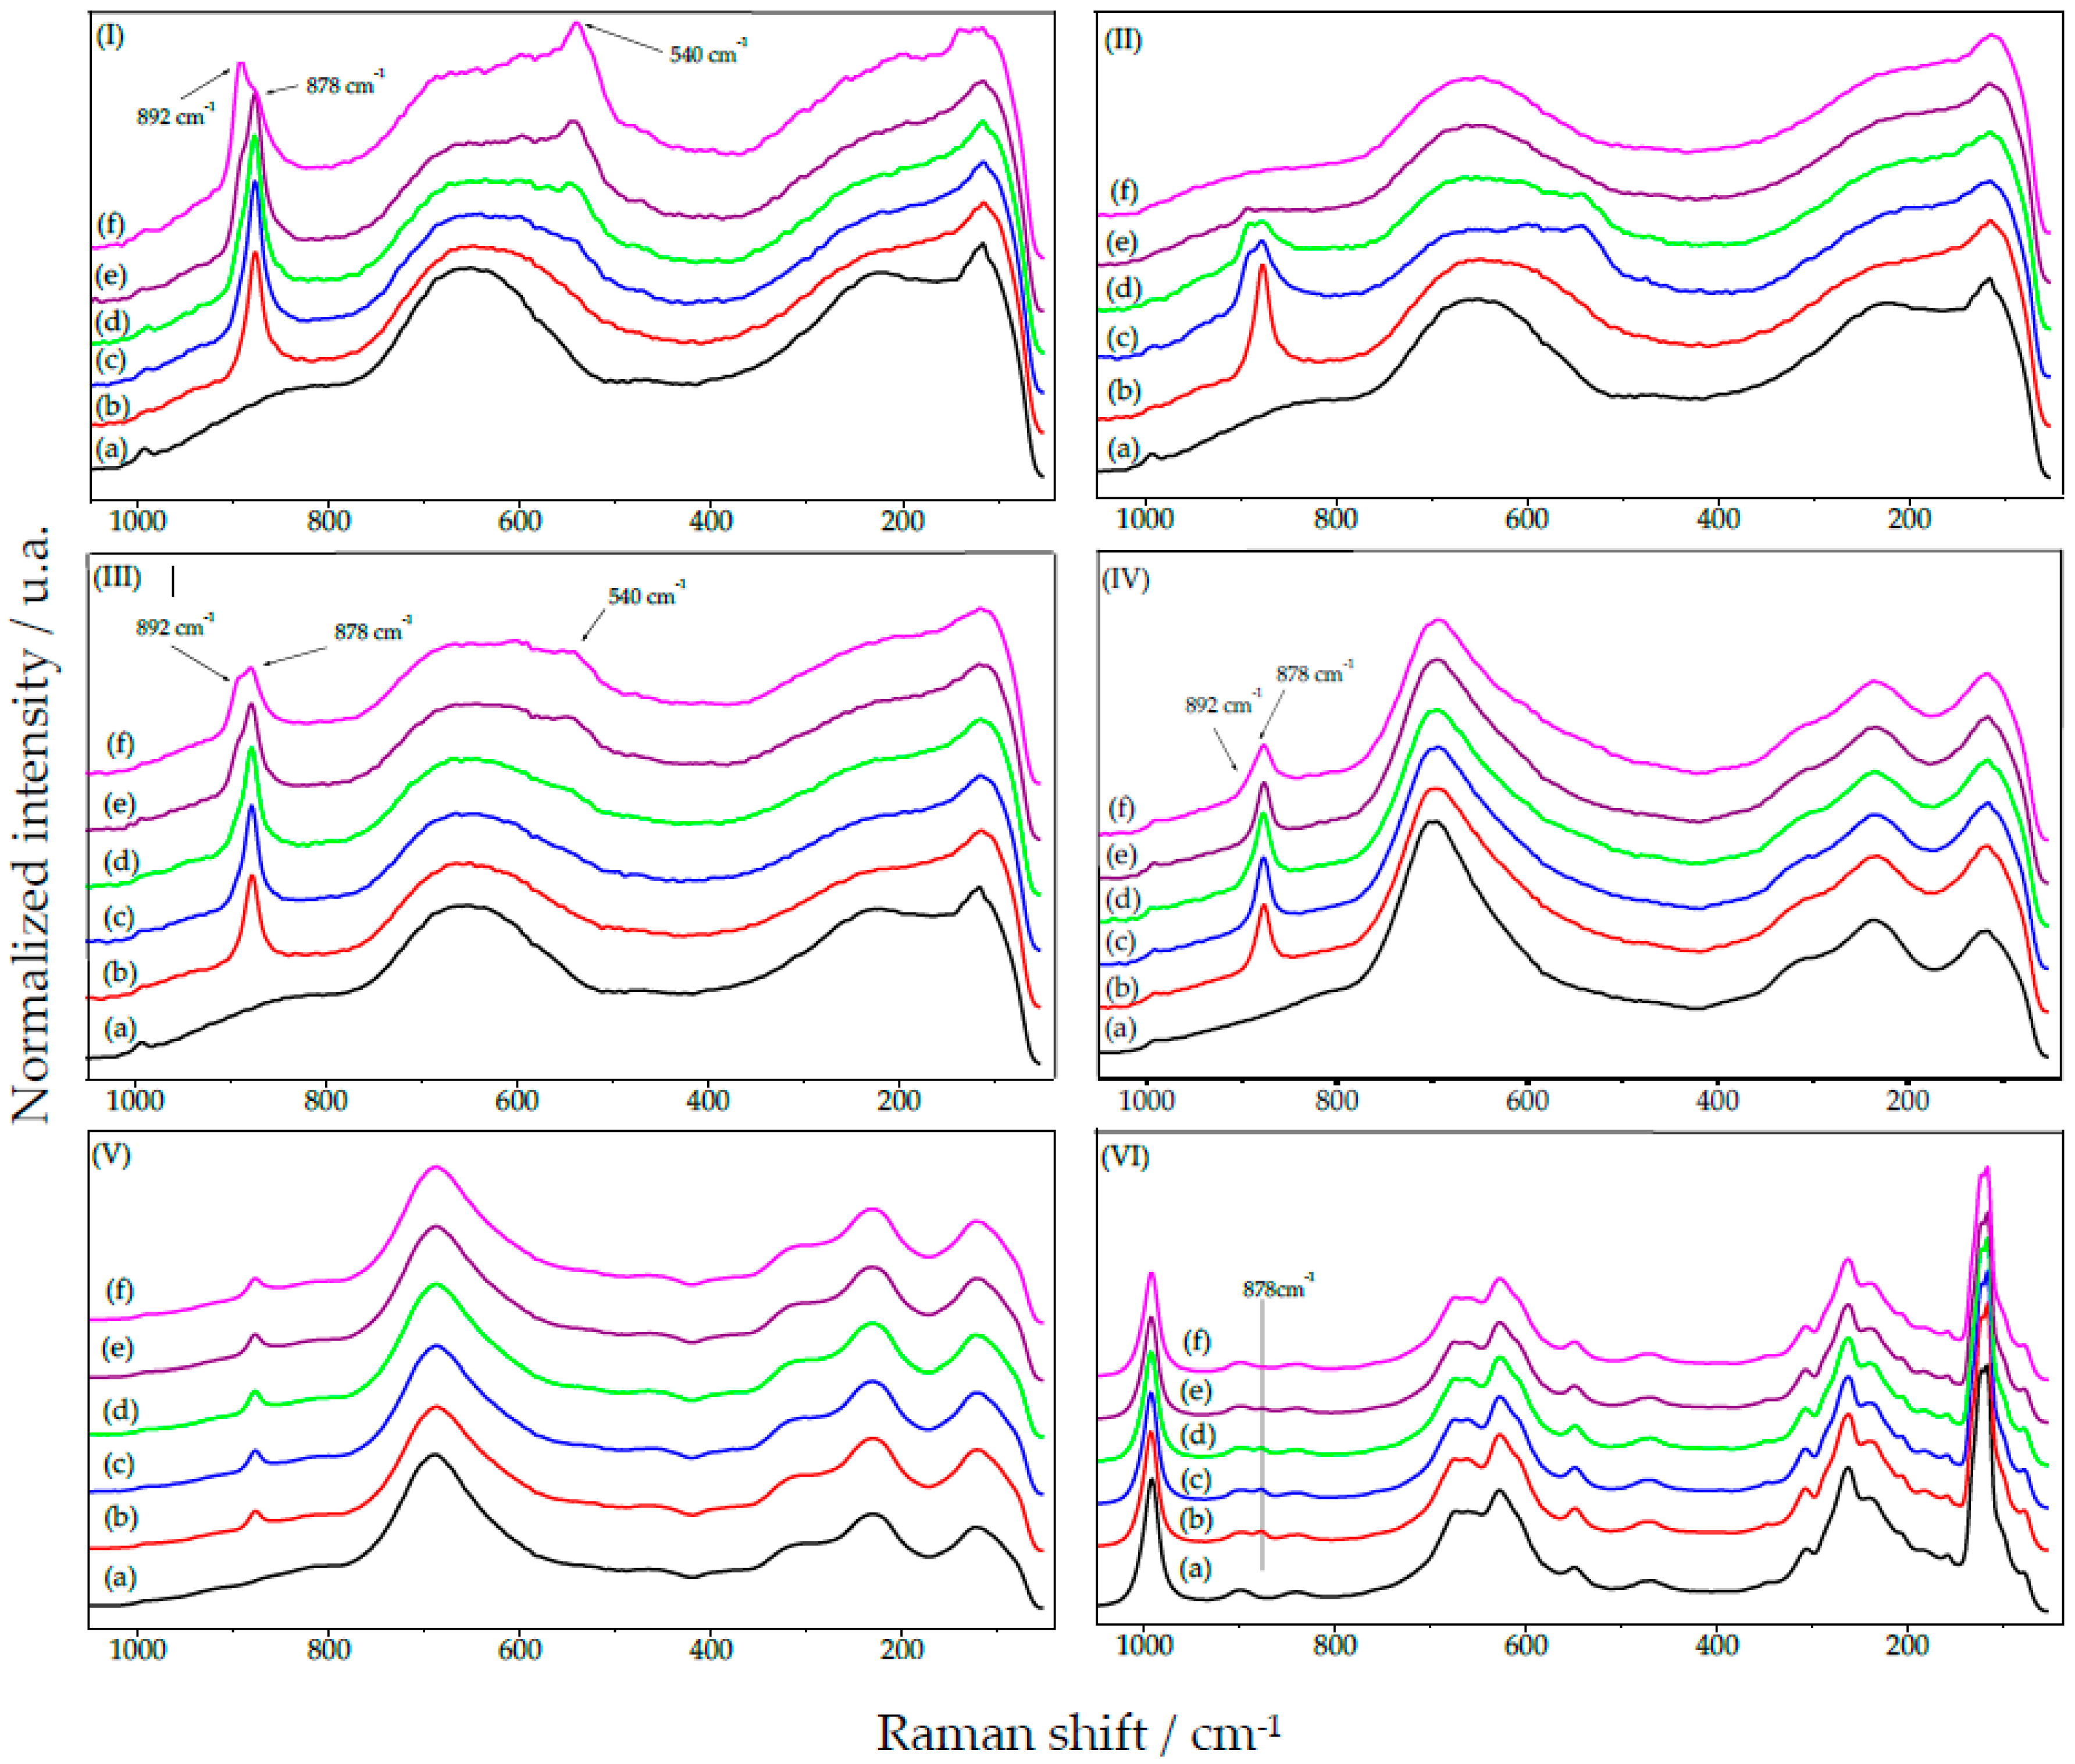
2.1. Analysis by Raman Spectroscopy

Sets of catalysts were obtained from HY340, GO and UP grades of niobium(V) oxide, untreated and by heat treatment at 400, 500, 700 and 900 °C (sets: HY340, HY340-400, HY340-500, HY340-700 and HY340-900; GO, GO-400, GO-500, GO-700 and GO-900; UP, UP-400, UP-500, UP-700 and UP-900) and were studied by Raman spectroscopy before and after addition of H2O2; HY340 samples treated with H2O2 were also studied after heating at 60 °C. Both the type of material and the treatment temperature are extremely important for the behavior presented by the Nb2O5 surface, with hydrogen peroxide addition further modifying it, as expected.

2.1.1. HY340 Set: Before H2O2 Addition

Figure 1 shows the Raman spectra for the HY340 set. The amorphous phase for HY340 and TT for HY340-400 are characterized by an intense and wide signal centered at 650 cm−1 (Figure 1a,b), attributed to the asymmetric stretching of the O-Nb-O group in the distorted polyhedra of NbO6, NbO7 and NbO8; in addition, a shoulder that extends between 750 and 1000 cm−1 can be attributed to constitutional defects [12,24]. The T phase for HY340-500 and HY340-700 is characterized by the presence of more defined signals at 700 and 688 cm−1 (Figure 1c,d), which can be attributed to the vibrational modes of the O-Nb-O group contained in the NbO6 and NbO7 polyhedra presenting a more crystalline structure; no shoulder in the region between 750 and 1000 cm−1 was observed [12,24]. The H-phase for HY340-900 (Figure 1e) shows signals at 993 and 900 cm−1 for the asymmetric and symmetric stretches of the Nb=O bond of the oxo system, respectively, in addition to a signal at 840 cm−1 for coaxial asymmetric stretching of the Nb-O-Nb group. Signals at 630 and 670 cm−1 for the O-Nb-O group stretches and due to the bounded NbO6 distorted octahedra can also be observed. The region ranging from 40 to 450 cm−1 and corresponding to the folding modes of O-Nb-O groups shows a shift from broad to well-defined signals upon increasing the treatment temperature (Figure 1a–e) [12,24].

2.1.2. HY340 Set: After H2O2 Addition

The interaction of the catalysts HY340, HY340-400, HY340-500, HY340-700 and HY340-900 with hydrogen peroxide was studied by Raman spectroscopy using an analysis sequence with time intervals of 1 min between each measurement and with the laser operating at 660 nm/280 mW/32 scans (Figure 2). The spectral profile for HY340 (Figure 2 (I(a))) is clearly altered upon treatment with hydrogen peroxide, resulting in the appearance of a signal at 878 cm−1. This signal increases with time (up to Figure 2 (I(d))) and is followed by a band at 892 cm−1, which overtakes the first one. In Figure 2 (I(f)) the later clearly predominates, although in this case both signals decrease with time. Another signal appears as a shoulder in the 590 cm−1 region (Figure 2 (I(b))) and is overtaken by a peak at 540 cm−1 (Figure 2 (I(c–f))). These signals can be attributed to the asymmetric and symmetric stretches of the NbO2 group, respectively. The appearance of these bands is associated with the formation of a η2-peroxo system on the catalyst surface, which is usually indicative of a large number of structural defects associated with the NbO7 and NbO8 sites [20,21,66,67]. The signals observed at 540 and 892 cm−1 can be attributed to the symmetric and asymmetric stretches of the NbO2 group, respectively and associated to the formation of a di-η2-peroxo system with cis-lateral geometry [66,67]. The maximum value for the ratio between the bands at 892 and 878 cm−1 is reached after five minutes as can be seen in Figure 2 (I(f)).

2.1.3. HY340 Set: Comparison between before and after H2O2 Addition

After heat treatment of the HY340/H2O2 system at 60 °C, the signals at 878 and 892 cm−1 (Figure 2 (II(a))) were gradually suppressed with time (Figure 2 (II(b–d))). After 20 h treatment (Figure 2 (II(f))) the spectral profile of the sample shows a great similarity to that for the pure HY340 compound (Figure 2 (II(a))), indicating that the changes caused by treatment with hydrogen peroxide are reversible and favored by high concentration of H2O2.
The results obtained from Raman spectroscopy for HY340-400 samples untreated (Figure 2 (III(a))) and treated with hydrogen peroxide show an initial reduction of the signal intensity at 878 cm−1 (Figure 2 (III(b))) after hydrogen peroxide addition. With increasing time, there is the appearance of a signal at 892 cm−1 (di-η2-peroxo—Figure 2 (III(c,e))), which is growing-in but does not overtake the peak at 878 cm−1, although in the last spectrum (Figure 2 (III(f))) both signals are decreasing; similar observation applies to the signals at 540 and 590 cm−1. These results are probably due to the onset of crystallization for the TT phase. Figure 2 shows the Raman spectra for the catalysts HY340 and HY340-400 (Figure 2 (I(b)) and (III(b–d))). In both cases it is possible to observe the presence of the η2-peroxo system associated with the NbO7 sites, which is characterized by the signal at 878 cm−1. In the course of the analysis, a difference between the Raman spectra for the catalysts HY340 and HY340-400 (Figure 2 (I(e,f)) and (III(e,f))) is observed, with a stronger signal appearing at 892 cm−1 for HY340 when compared to HY340-400. This signal indicates that a smaller number of sites of type NbO8 are present in HY340-400 which is a consequence of the smaller amount of di-η2-peroxo system when the catalyst is treated at a higher temperature, thus presenting higher crystallinity.
After treatment with hydrogen peroxide the HY340-500 catalyst initially characterized as a T phase (Figure 2 (IV(a))) showed a greater reduction in the signal intensity at 878 cm−1 (Figure 2 (IV(b))) when compared to HY340-400 (Figure 2 (II(b))). It was not possible to observe significant changes in the 892 cm−1 region (Figure 2 (IV(c–e))). The lower ratio observed for the bands at 892 and 878 cm−1 (Figure 2 (IV(f))), compared to Figure 2 (I(b–f)) and (III(b–f))) is a clear indication of a small amount of surface defects of the NbO8 type. This can be a consequence of the higher HY340-500 crystallinity, which should contain a larger proportion of NbO6 systems on its surface. On the other hand, pure HY340-700 presents a Raman spectrum consistent with a more crystalline phase (Figure 2 (V(a))), showing the formation of a single signal at 878 cm−1 upon hydrogen peroxide treatment (Figure 2 (V(b–f))). This is a clear indication that only the oxygen-derived η2-peroxy-type associated to NbO7 systems is formed on its surface. Finally, for pure HY340-900 which has a very characteristic spectrum of a H-phase (Figure 2 (VI(a))), a residual signal at 878 cm−1 can be observed upon hydrogen peroxide treatment (Figure 2 (VI(b))), indicating a small number of defects on the NbO6 system. In none of the cases (Figure 2 (VI(c–f))) a signal at 892 cm−1 was observed, which indicates a high crystallinity for the system. In general, the small change in the rest of the Raman spectra (Figure 2I–VI) indicates that the interaction of the catalysts with H2O2 occurs specifically in the defects associated with the NbO7 and NbO8 systems. It is important to note that for HY340-900 the signal at 993 cm−1 for the oxo system (Nb=O) remained constant, suggesting its stability even after hydrogen peroxide addition. The region between 50–450 cm−1, characteristic of O-Nb-O group bending, is not very informative about structural changes occurring on the surface of niobium(V) oxide [12,24].

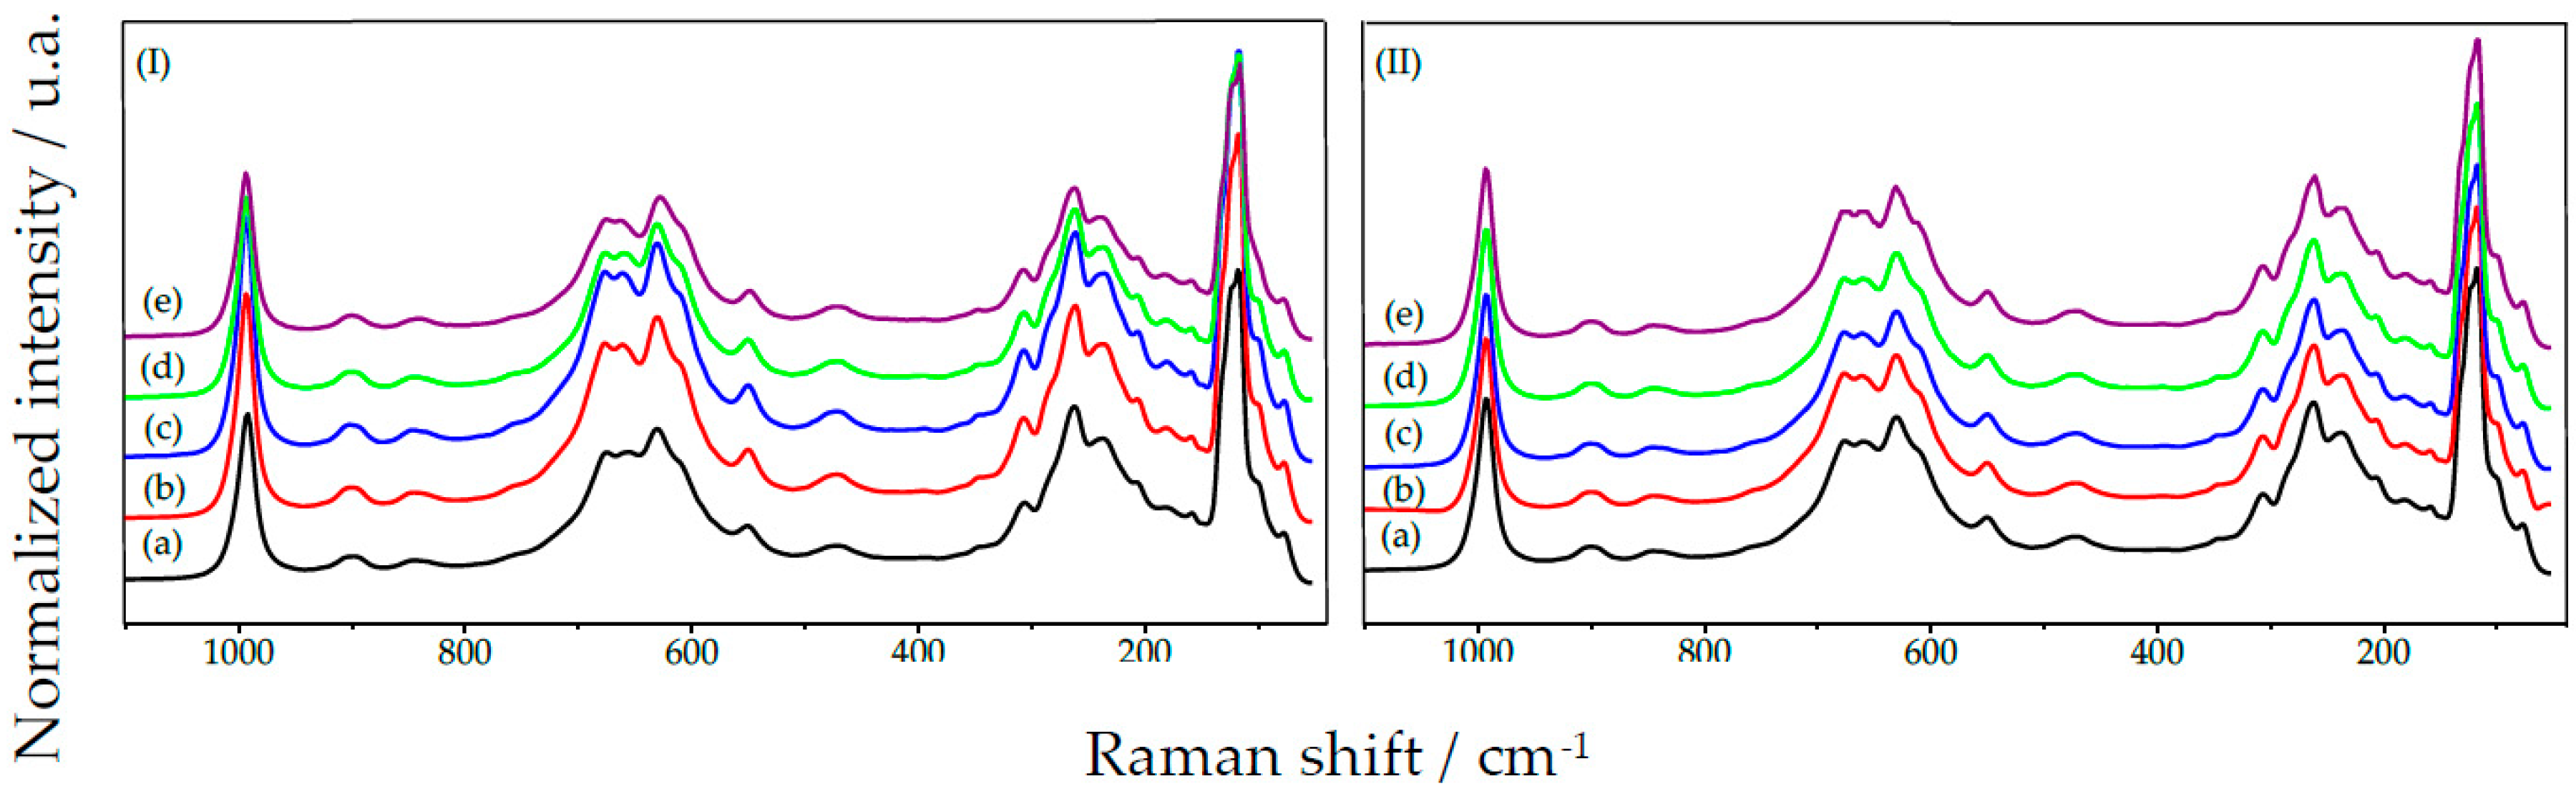
2.1.4. GO Set: Before H2O2 Addition

Raman spectroscopy studies for non-treated Optical Grade Nb2O5 (GO) (Figure 3 (I(a))) and after heat treatment at 400 °C (GO-400), 500 °C (GO-500), 700 °C (GO-700) and 900 °C (GO-900) (Figure 3 (I(b–e))) show a profile indicating the presence of high crystallinity. No significant spectral changes (Figure 3 (I(a–d))) were observed for GO, GO-400, GO-500 and GO-700 samples after heat treatment. In addition to the 840 cm−1 signal for the coaxial vibration of the Nb-O-Nb group, asymmetric and symmetric stretch signals could be reported at 993 and 900 cm−1, respectively, for the Nb=O system. On the other hand, GO-900 presents a characteristic spectrum for H phase (Figure 3 (I(e))) [12,24].

2.1.5. GO Set: After H2O2 Addition

After hydrogen peroxide treatment, Raman spectra for GO, GO-400, GO-500, GO-700 and GO-900 (Figure 3II–VI) show the appearance of a signal at 878 cm−1, which can be attributed to the η2-peroxo system. For the catalysts GO (Figure 3 (II(b–f))), GO-400 (Figure 3 (III(b–f))), GO-500 (Figure 3 (IV(b–f))) and GO-700 (Figure 3 (V(b–f))) a slight decrease in the signal intensity at 878 cm−1 was observed suggesting that heat treatment at 400, 500 and 700 °C does not change the catalyst structure.

2.1.6. GO Set: Comparison between before and after H2O2 Addition

The results for untreated GO-900 catalyst (Figure 3 (VI(a))) and treated with hydrogen peroxide (Figure 3 (VI(b–f))) show the presence of a signal at 878 cm−1 of lower intensity when compared to GO, GO-400, GO-500 and GO-700. A comparison between the catalysts HY340-900 (Figure 2VI) and GO-900 (Figure 3VI) shows that the intensity of the 878 cm−1 signal is higher for GO-900, indicating a larger number of defects for this system.

2.1.7. UP Set: Before and after H2O2 Addition

Raman spectra for Ultrapure Nb2O5 (UP) before and after treatment at 400 °C (UP-400), 500 °C (UP-500), 700 °C (UP-700) and 900 °C (UP-900) (Figure 4 (I(a–e))) indicate that there are no structural changes in these samples. In all cases a very characteristic spectrum of a H-phase is observed, showing signals at 993, 900, 840, 690 and 640 cm−1 [12,24]. When UP, UP-400, UP-500, UP-700 and UP-900 are treated with hydrogen peroxide, the corresponding Raman spectra did not show signals at 878 and 892 cm−1, a clear indication of the absence of structural defects on their structure that could allow the formation of the η2-peroxo system (Figure 4 (II(a–e))). The persistence of signal intensities at 993 and 900 cm−1, as well as of those at 849, 670 and 630 cm−1 (Figure 4 (II(a–e))) before and after treatment with hydrogen peroxide, is an indication that NbO2 η2 complexes are not present. One possible reason is that the NbO7 and NbO8 systems—necessary for the formation of such complexes—are absent even before H2O2 addition [10]. Thus, Nb2O5 UP presents high crystallinity, with the Raman spectroscopy results making it clear that there is no interaction with hydrogen peroxide.

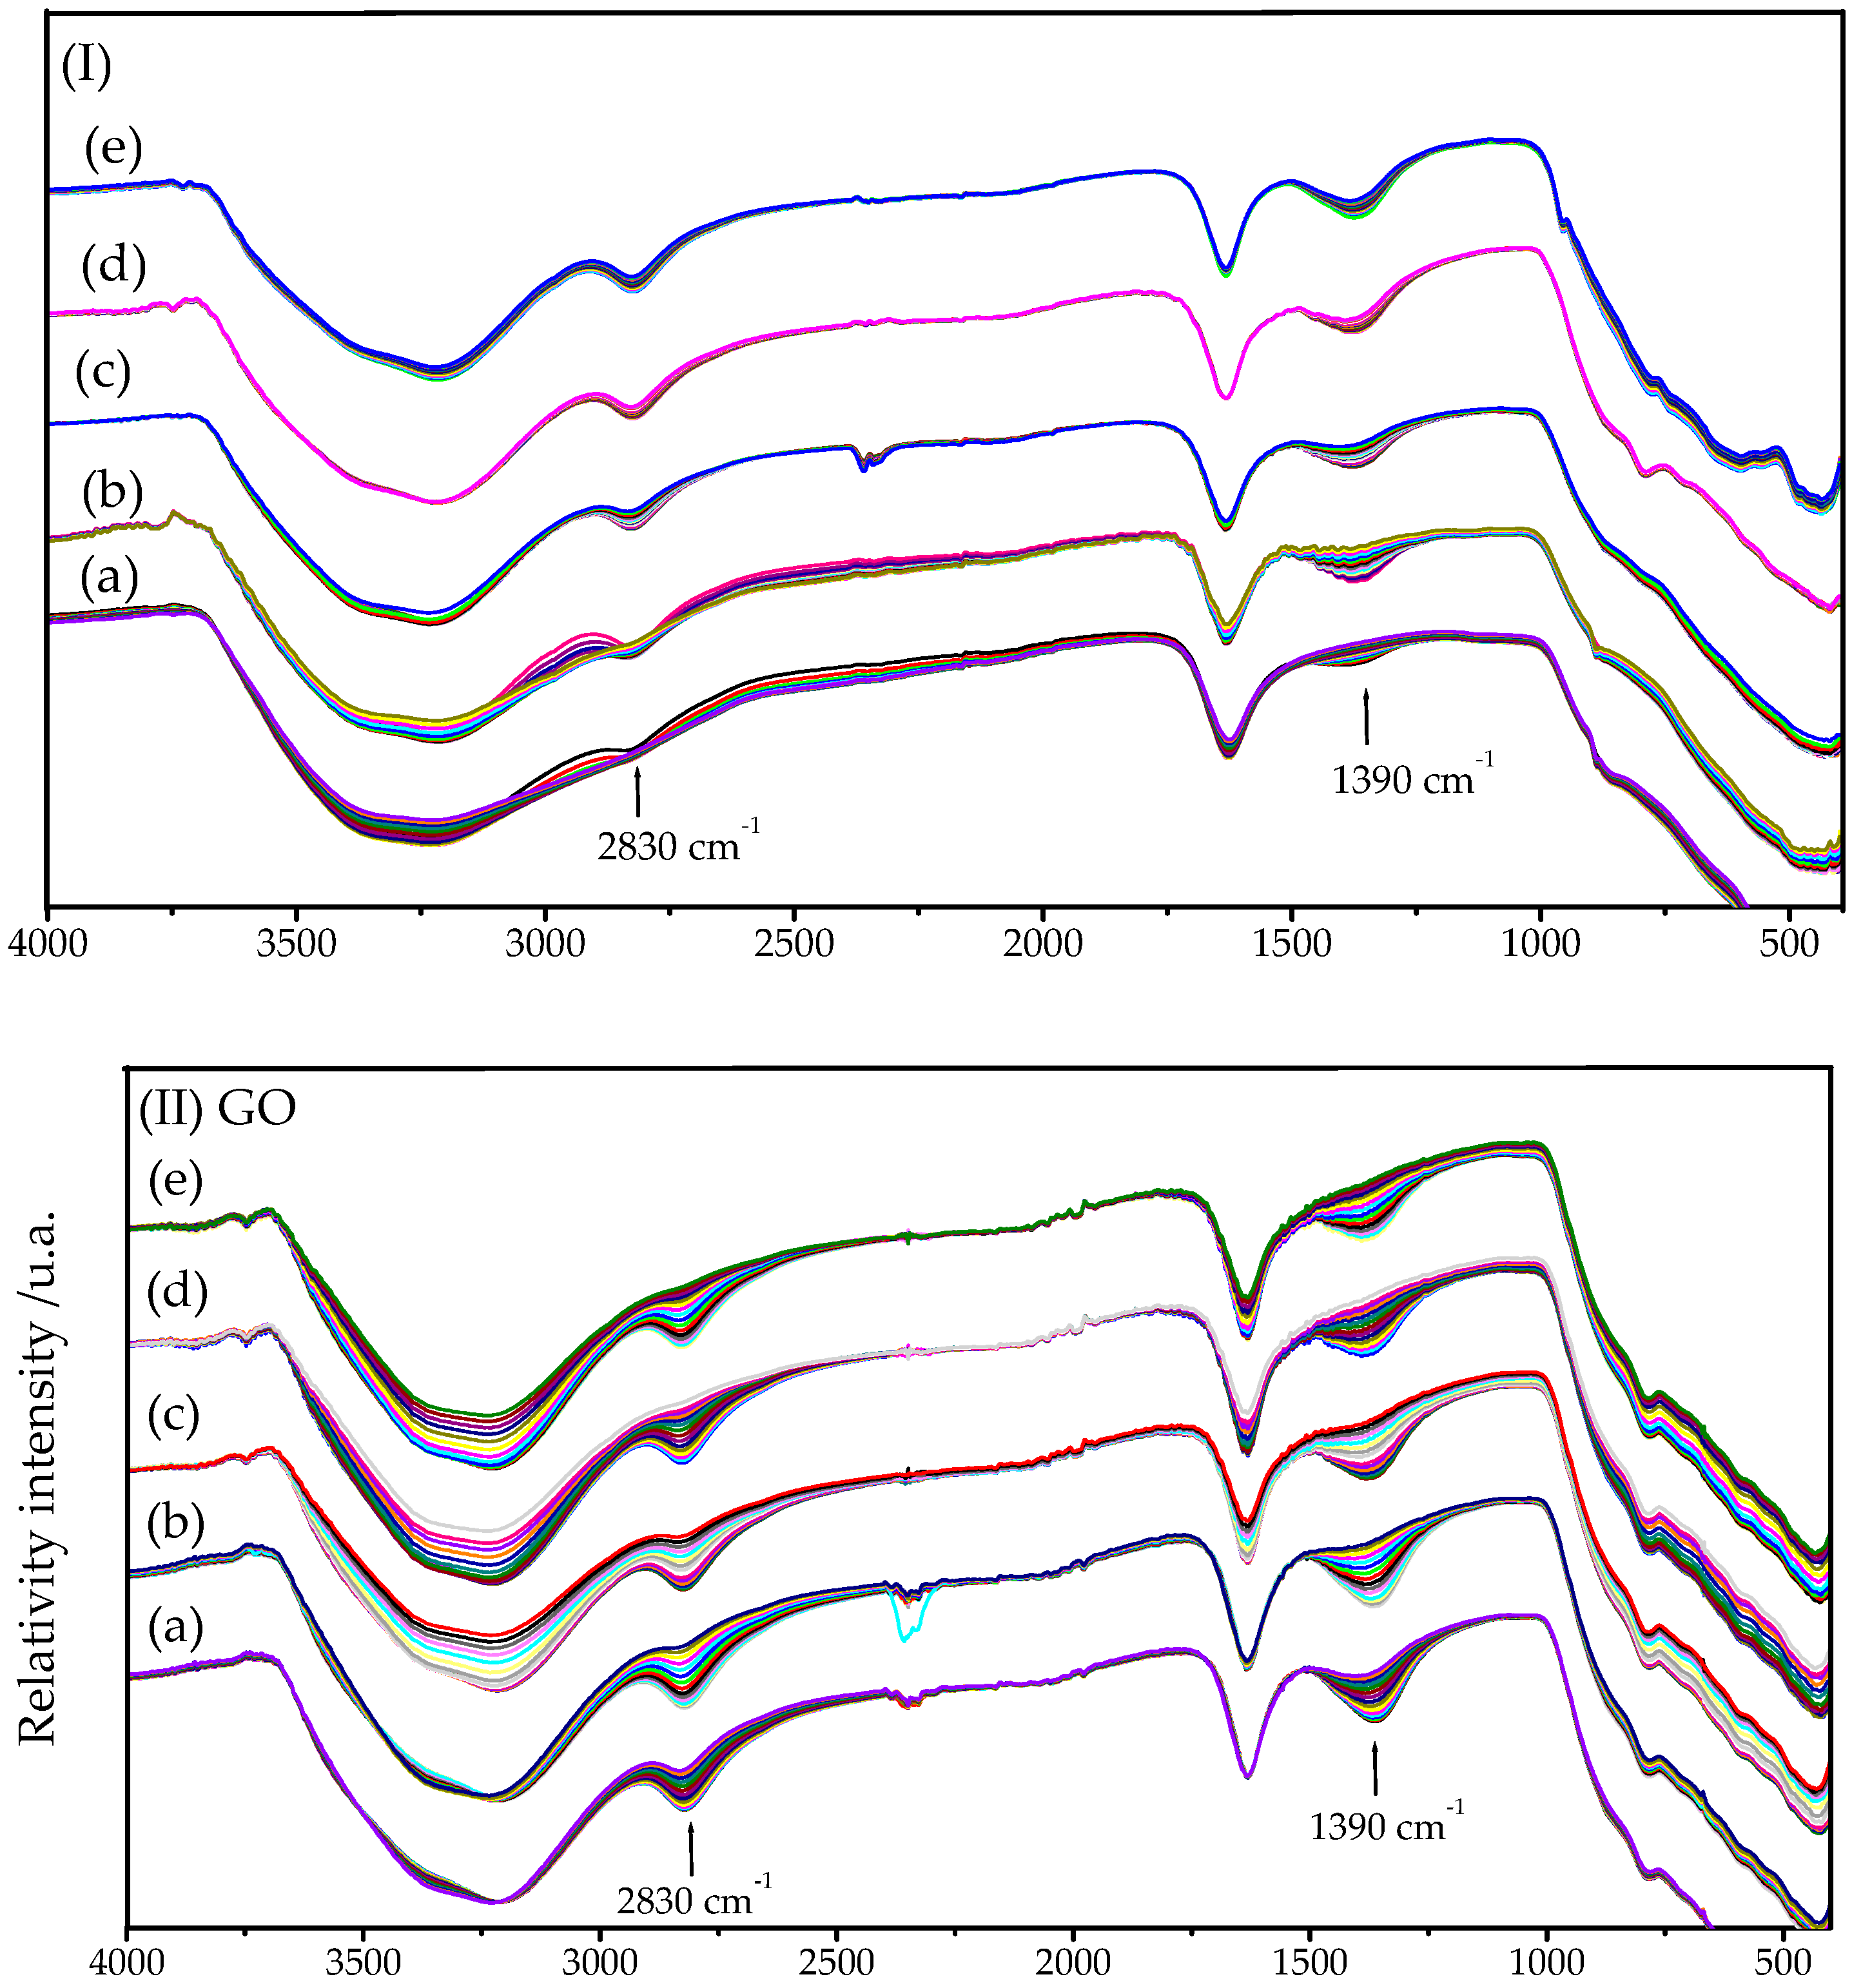
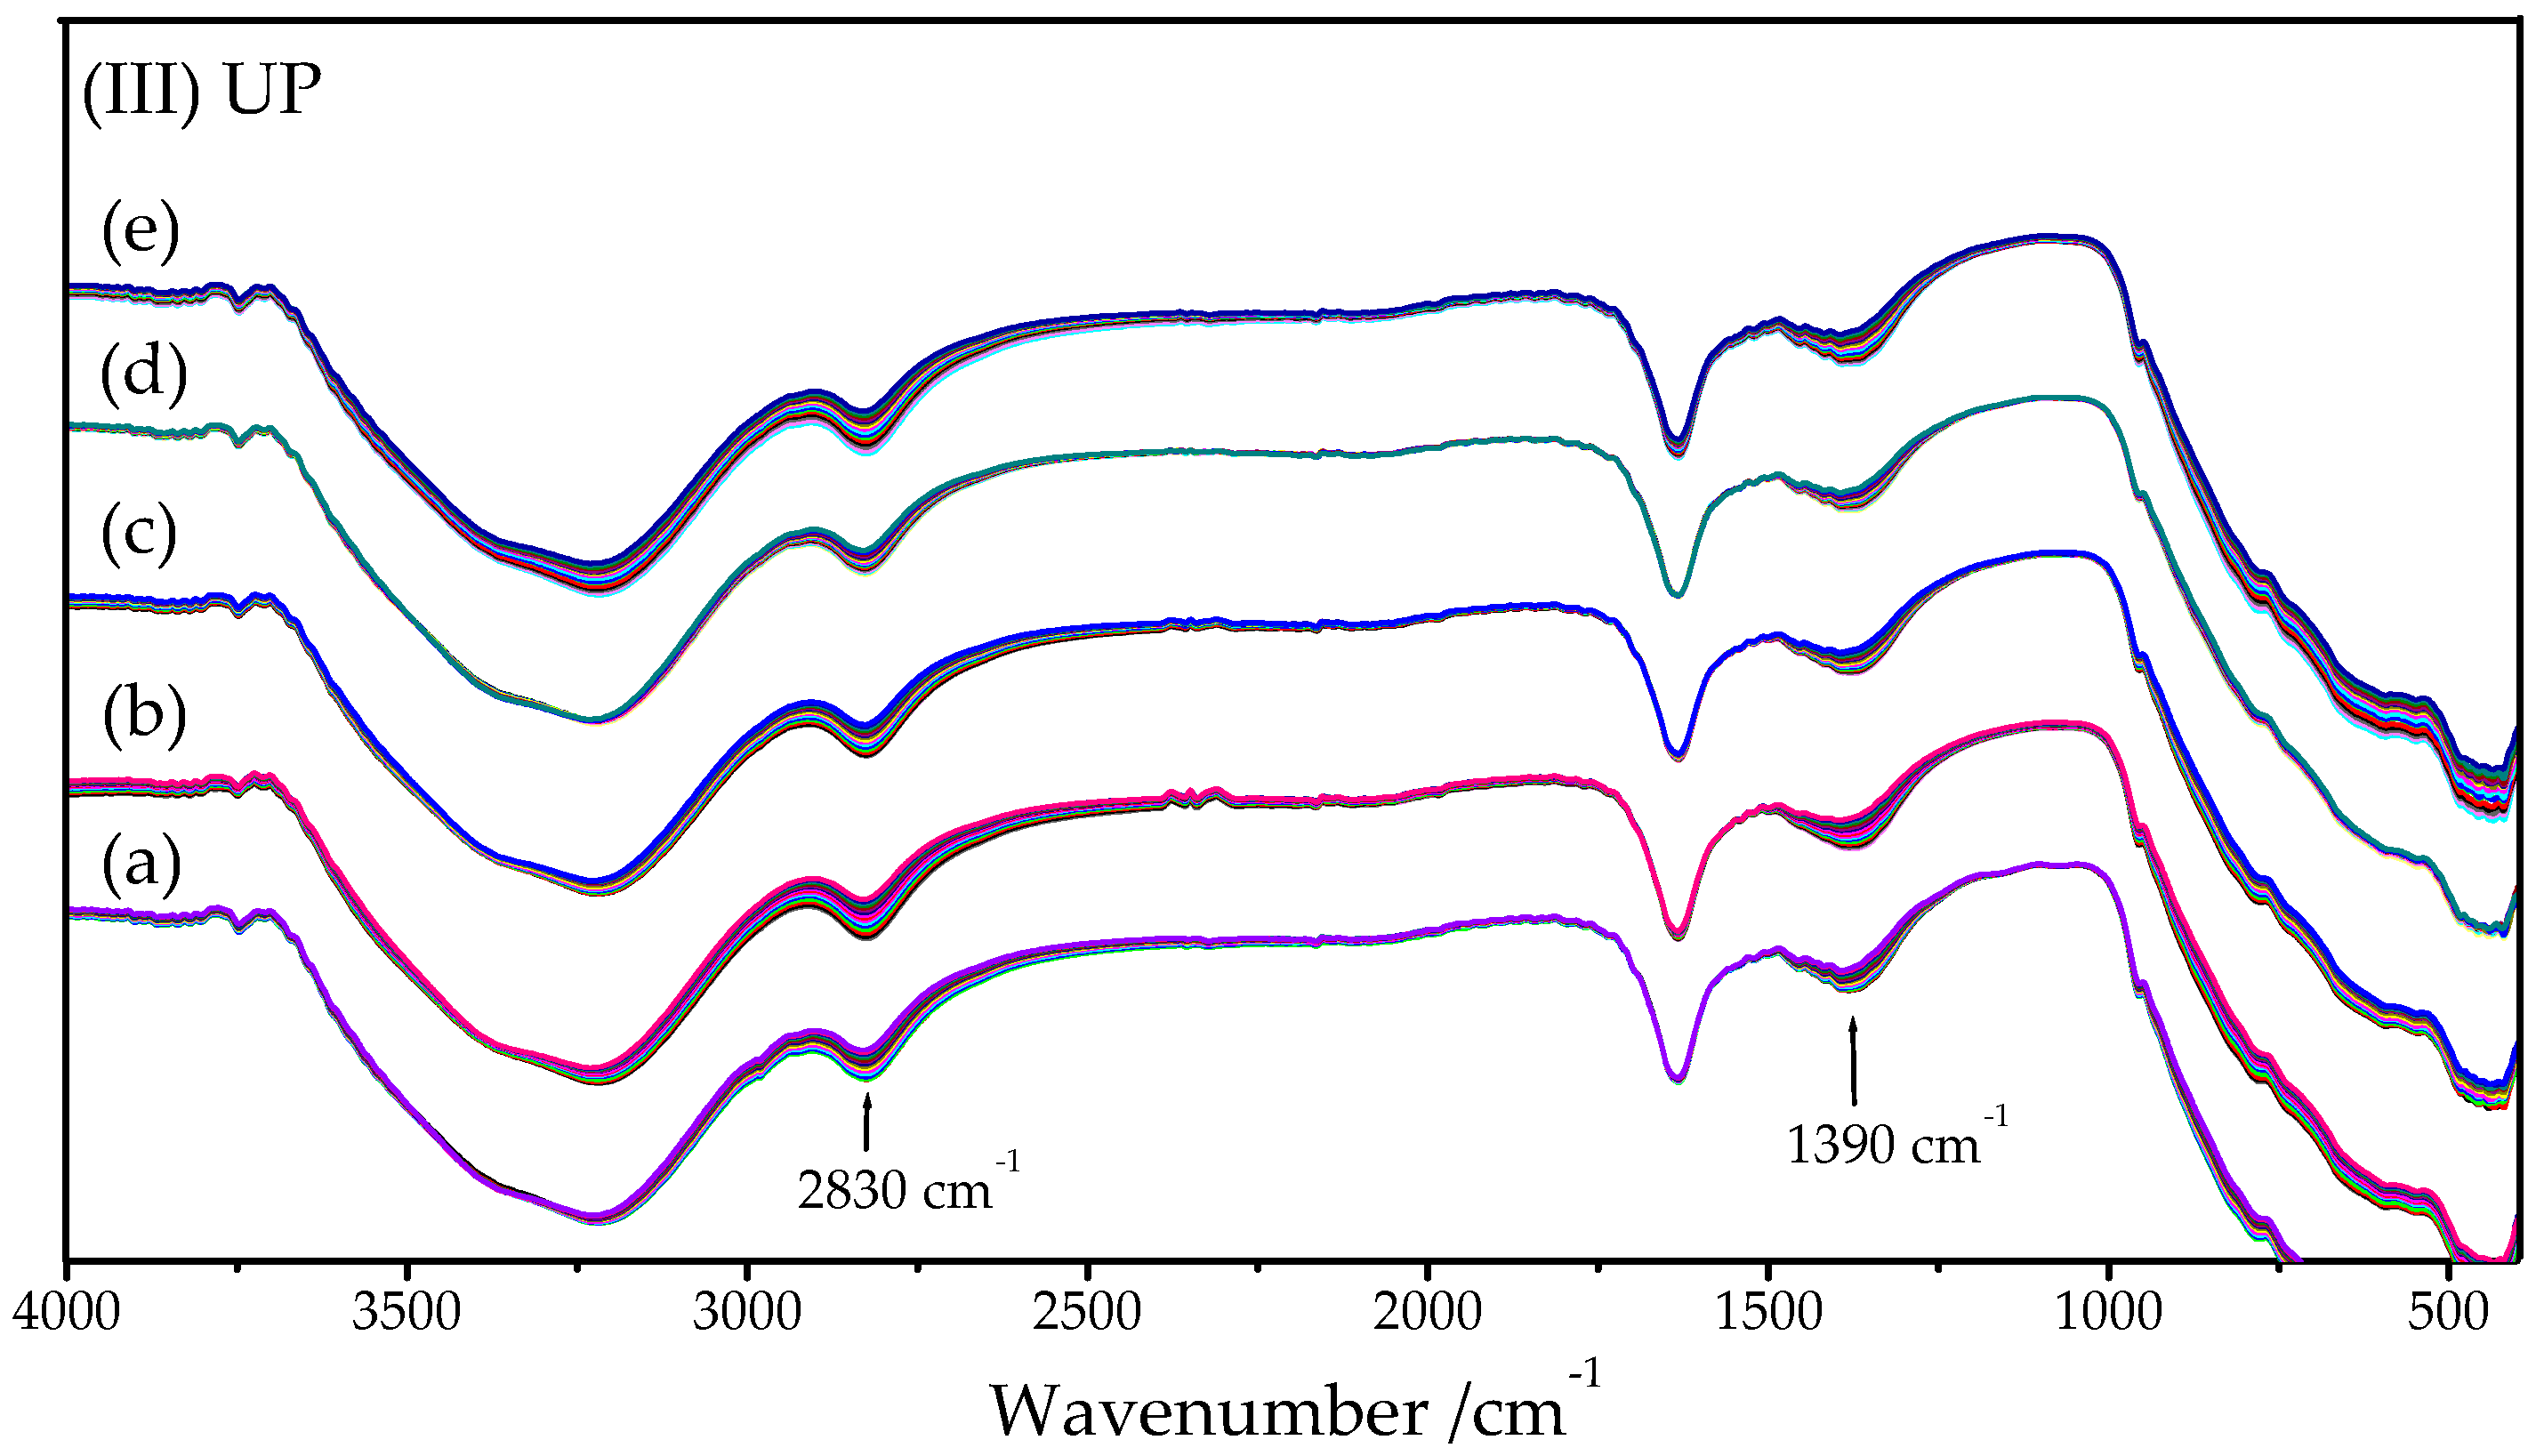
2.2. FTIR-ATR Spectroscopy

2.2.1. HY340 Set: After H2O2 Addition

Figure 5 (I) shows FTIR-ATR spectra for HY340 and its derivatives HY340-400, HY340-500, HY340-700 and HY340-900 after hydrogen peroxide treatment. From these spectra, one can observe signals at 2839 and 1390 cm−1 which can be attributed to the presence of hydrogen peroxide on the surface of the solid system [68]. These signals show a significant decrease for catalysts with a greater number of NbO7 and NbO8 defects such as HY340, HY340-400 and HY340-500. This is due to the formation of a significant number of di-oxygen complexes (Figure 5 (I(a–c))) for these catalysts, whereas HY430-700 and HY340-900 have a relatively slower suppression rate due to their lower number of defects (Figure 5 (I(d–e))).

2.2.2. GO Set: After H2O2 Addition

For GO and its derivatives GO-400, GO-500, GO-700 and GO-900 (Figure 5 (II(a–e))) treated with hydrogen peroxide the high number of defects of NbO7 type, as seen in the Raman spectra (Figure 3II–VI), leads to a marked suppression of the signals at 2830 and 1390 cm−1 resulting in acceleration of the hydrogen peroxide decomposition.

2.2.3. UP Set: After H2O2 Addition

Finally, for UP Nb2O5 and its derivatives UP-400, UP-500, UP-700 and UP-900 treated with hydrogen peroxide (Figure 5 (III(a–e))) a slower suppression of the signals at 2830 and 1390 cm−1 can be observed. This can be associated to the reduced number of defects of NbO7 and NbO8 type as observed in the Raman experiments (Figure 4 (II(a–f))).
Thus, the studies by FTIR-ATR spectroscopy performed on HY340, GO and UP Nb2O5 catalysts, as well as for samples treated at 400, 500, 700 and 900 °C, indicate that the hydrogen peroxide interaction with the different surface types is extremely sensitive to the presence of constitutional defects arising from NbO7 and NbO8. A higher amount of these sites as in the case of HY340, HY340-400, HY340-500, GO, GO-400, GO-500, GO-700 and GO-900 results in hydrogen peroxide decomposition through the formation of a η2 dioxygen-type complex (NbO2) [21]. The later catalysts have an appreciable number of defects on their surface, as demonstrated by Raman spectroscopy, which efficiently promote the hydrogen peroxide decomposition. On the other hand, the slower hydrogen peroxide suppression observed in the case of HY340-700, HY340-900, UP, UP-400, UP-500, UP-700 and UP-900 must be due the almost total absence of NbO8 defects as well as the small amount of type NbO7 defects thus allowing only the formation of η1 dioxygen-type complexes (hydroperoxo or superoxo) [21,69].
It is interesting to note that the results obtained by Raman spectroscopy for the catalyst HY340-500 upon treatment with hydrogen peroxide (Figure 2 (V(a–f))) indicate a higher crystallinity when compared to HY340-400 (Figure 2 (IV(a–f))). However, FTIR-ATR experiments for HY340-500 treated with hydrogen peroxide (Figure 5 (I(c))) demonstrate similar behavior to that found for catalyst HY340-400 (Figure 5 (I(b))). This discrepancy in the behavior verified by comparing both experiments originates in the different physical phenomena observed in the two cases. While Raman spectroscopy is sensitive to the detection of stretches of Nb-O bonds, FTIR-ATR spectroscopy is sensitive to stretches of OH bonds. Thus, it can be concluded that the catalyst HY340-500 has a crystallinity that lies between HY340-400 and HY340-700, having a number of defects correlated to surface OH groups, which resemble those found for HY340-400. On the other hand, considering η2 peroxo defects, HY340-400 has more similarity to HY340-700, showing a single signal at 878 cm−1 and having a much more defined crystal structure (Figure 2 (V(b–f))).

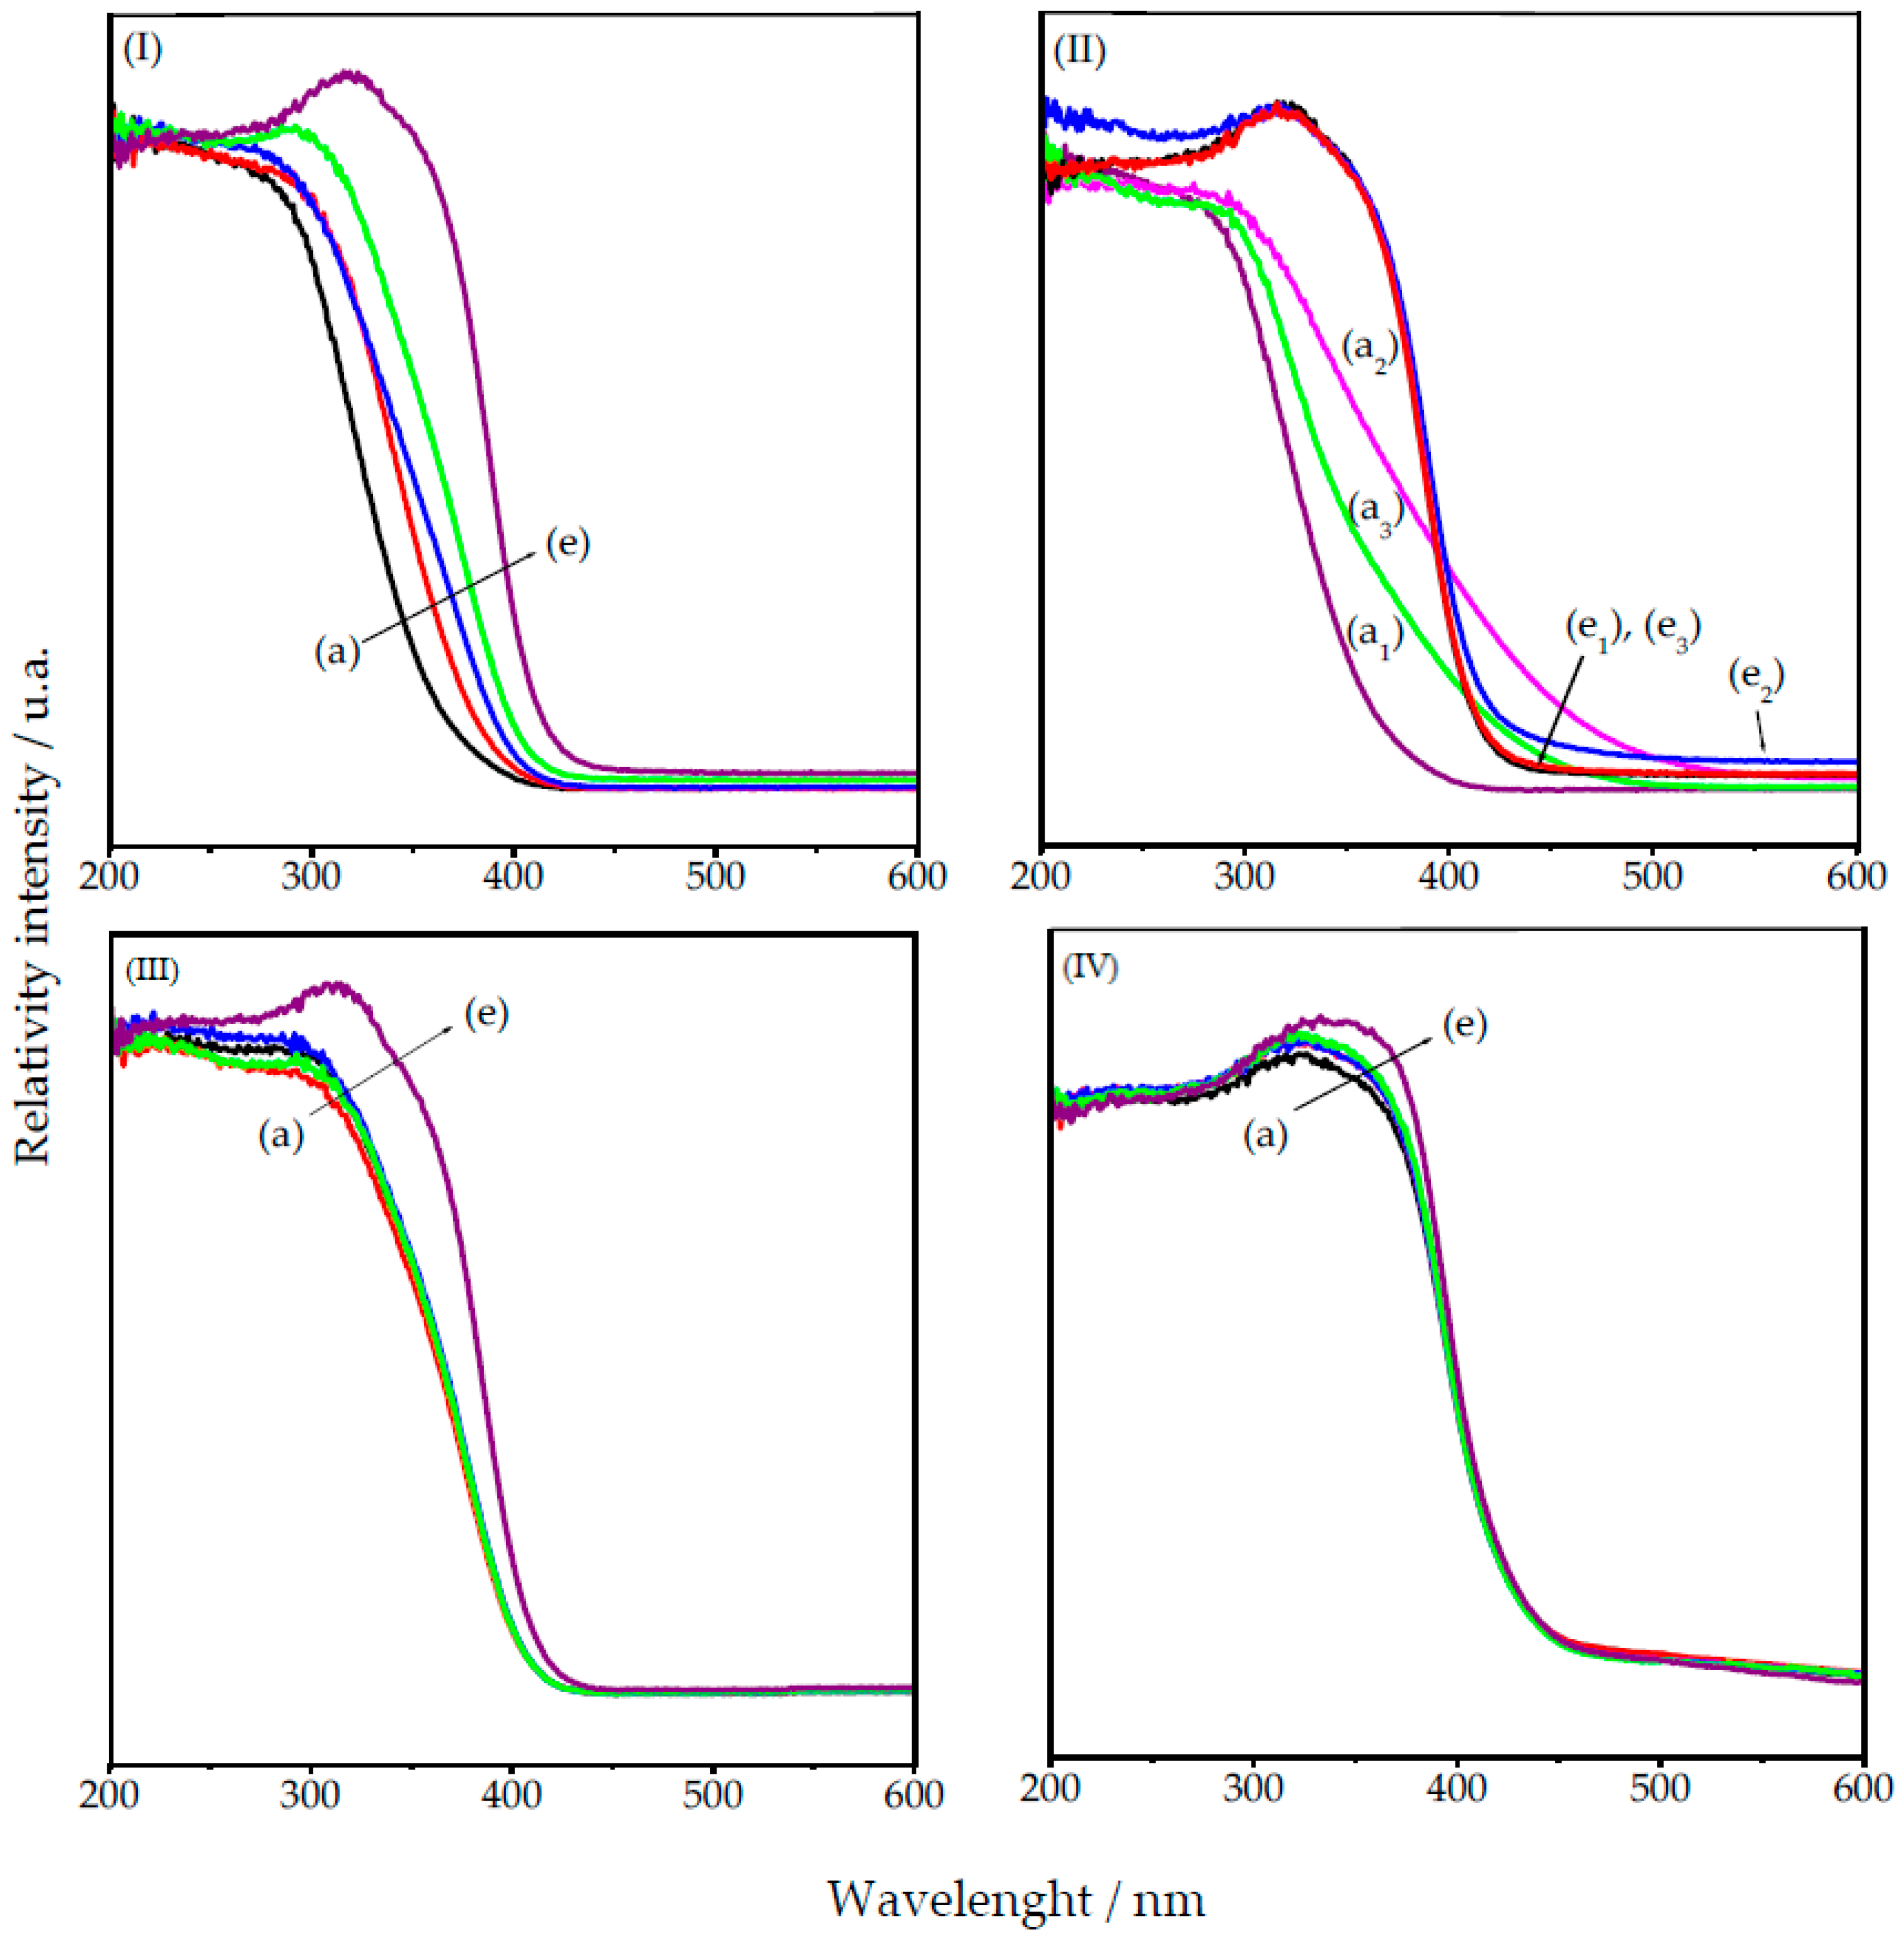
2.3. UV-Visible Spectroscopy

2.3.1. HY340 Set: Before and after H2O2 Addition

Diffuse reflectance spectra in the ultraviolet-visible region (200–600 nm range) for the catalysts HY340, HY340-400, HY340-500, HY340-700 and HY340-900 (Figure 6 (I(a–e))) indicate that increasing treatment temperature leads to a bathochromic shift of up to 25 nm on the absorption band at 290 nm. This may be a consequence of a surface area reduction as well as an increase on the surface density of NbO4 systems for those species treated at higher temperatures, such as HY340-900 [12,13]. The interaction of hydrogen peroxide with the catalysts HY340 and HY340-900 (Figure 6II) indicates that the number of defects on the niobium oxide surface leading to a η2-peroxo type charge transfer complex decreases with the temperature, as observed by the spectral changes found for HY340 (Figure 6 (II(a1))) to Figure 6 (II(a3))) and HY340-900 (Figure 6 (II(e1))) to Figure 6 (II(e3))) [21,70]. Raman spectroscopy studies for HY340-900 before and after H2O2 addition (Figure 2VI) show only a small intensity for the η2-peroxo signal, at 878 cm−1. On the other hand, a small increase in absorption towards the visible region (400–500 nm) can be observed in the UV-Vis spectrum (Figure 6II), mainly for HY340 (which becomes bright yellow after H2O2 addition) and much less so for HY340-900 (very pale yellow). Both results confirm the formation of a η2-peroxo-type complex in small amounts and therefore HY340-900 presents a reduced possibility of formation of the niobium η2-peroxo system.

2.3.2. GO Set

The catalysts GO-400, GO-500 and GO-700 prepared from GO niobium(V) oxide showed no changes in their absorption spectrum in the UV-Vis region (Figure 6 (III(a–d))), indicating that the treatment temperature did not significantly alter their structure. However, the slight bathochromic shift from 300 to 314 nm observed for the GO-900 sample may be a consequence of structural changes promoted by the heat treatment (Figure 6 (III(e))).

2.3.3. UP Set

For the UP catalyst and their derivatives UP-400, UP-500, UP-700 and UP-900 (Figure 6 (IV(a–e))) no significant effects were observed in their absorption band at 315 nm, indicating that these compounds have only a small alteration on their structure by heat treatment, which can be due to high initial crystallinity [21,70].
Diffuse reflectance spectra in the ultraviolet-visible region show temperature dependence for the catalysts HY340, HY340-400, HY340-500, HY340-700 and HY340-900, whereas the spectra of the GO (except for GO-900) and UP sets are temperature independent. This behavior may be associated to a reduction of the surface area of the catalysts. Upon increasing the crystallinity, a relative increase in the surface concentration of NbO4 systems can occur, which is characterized by the presence of a niobate group (Nb=O) and thus the absorption spectrum is shifted to the red [12,13]. Thermal treatment of HY340 catalysts between 400 and 900 °C lead to significant structural changes in the predominant amorphous form, with reduction in the surface area and increase in crystallinity (Figure 6 (I(a–e))). The GO, GO-400, GO-500 and GO-700 catalysts all show similar UV-Vis absorption spectra (Figure 3 (I(a–d))) and also similar Raman spectra, presenting intermediate crystallinity (Figure 6 (III(a–d))) but GO-900 shows significant changes (Figures 3 (I(e))) and 6 (III(e))), due to temperature induced increased crystallinity. The catalysts of the UP series all showed high crystallinity (Figure 4 (I(a–e))).

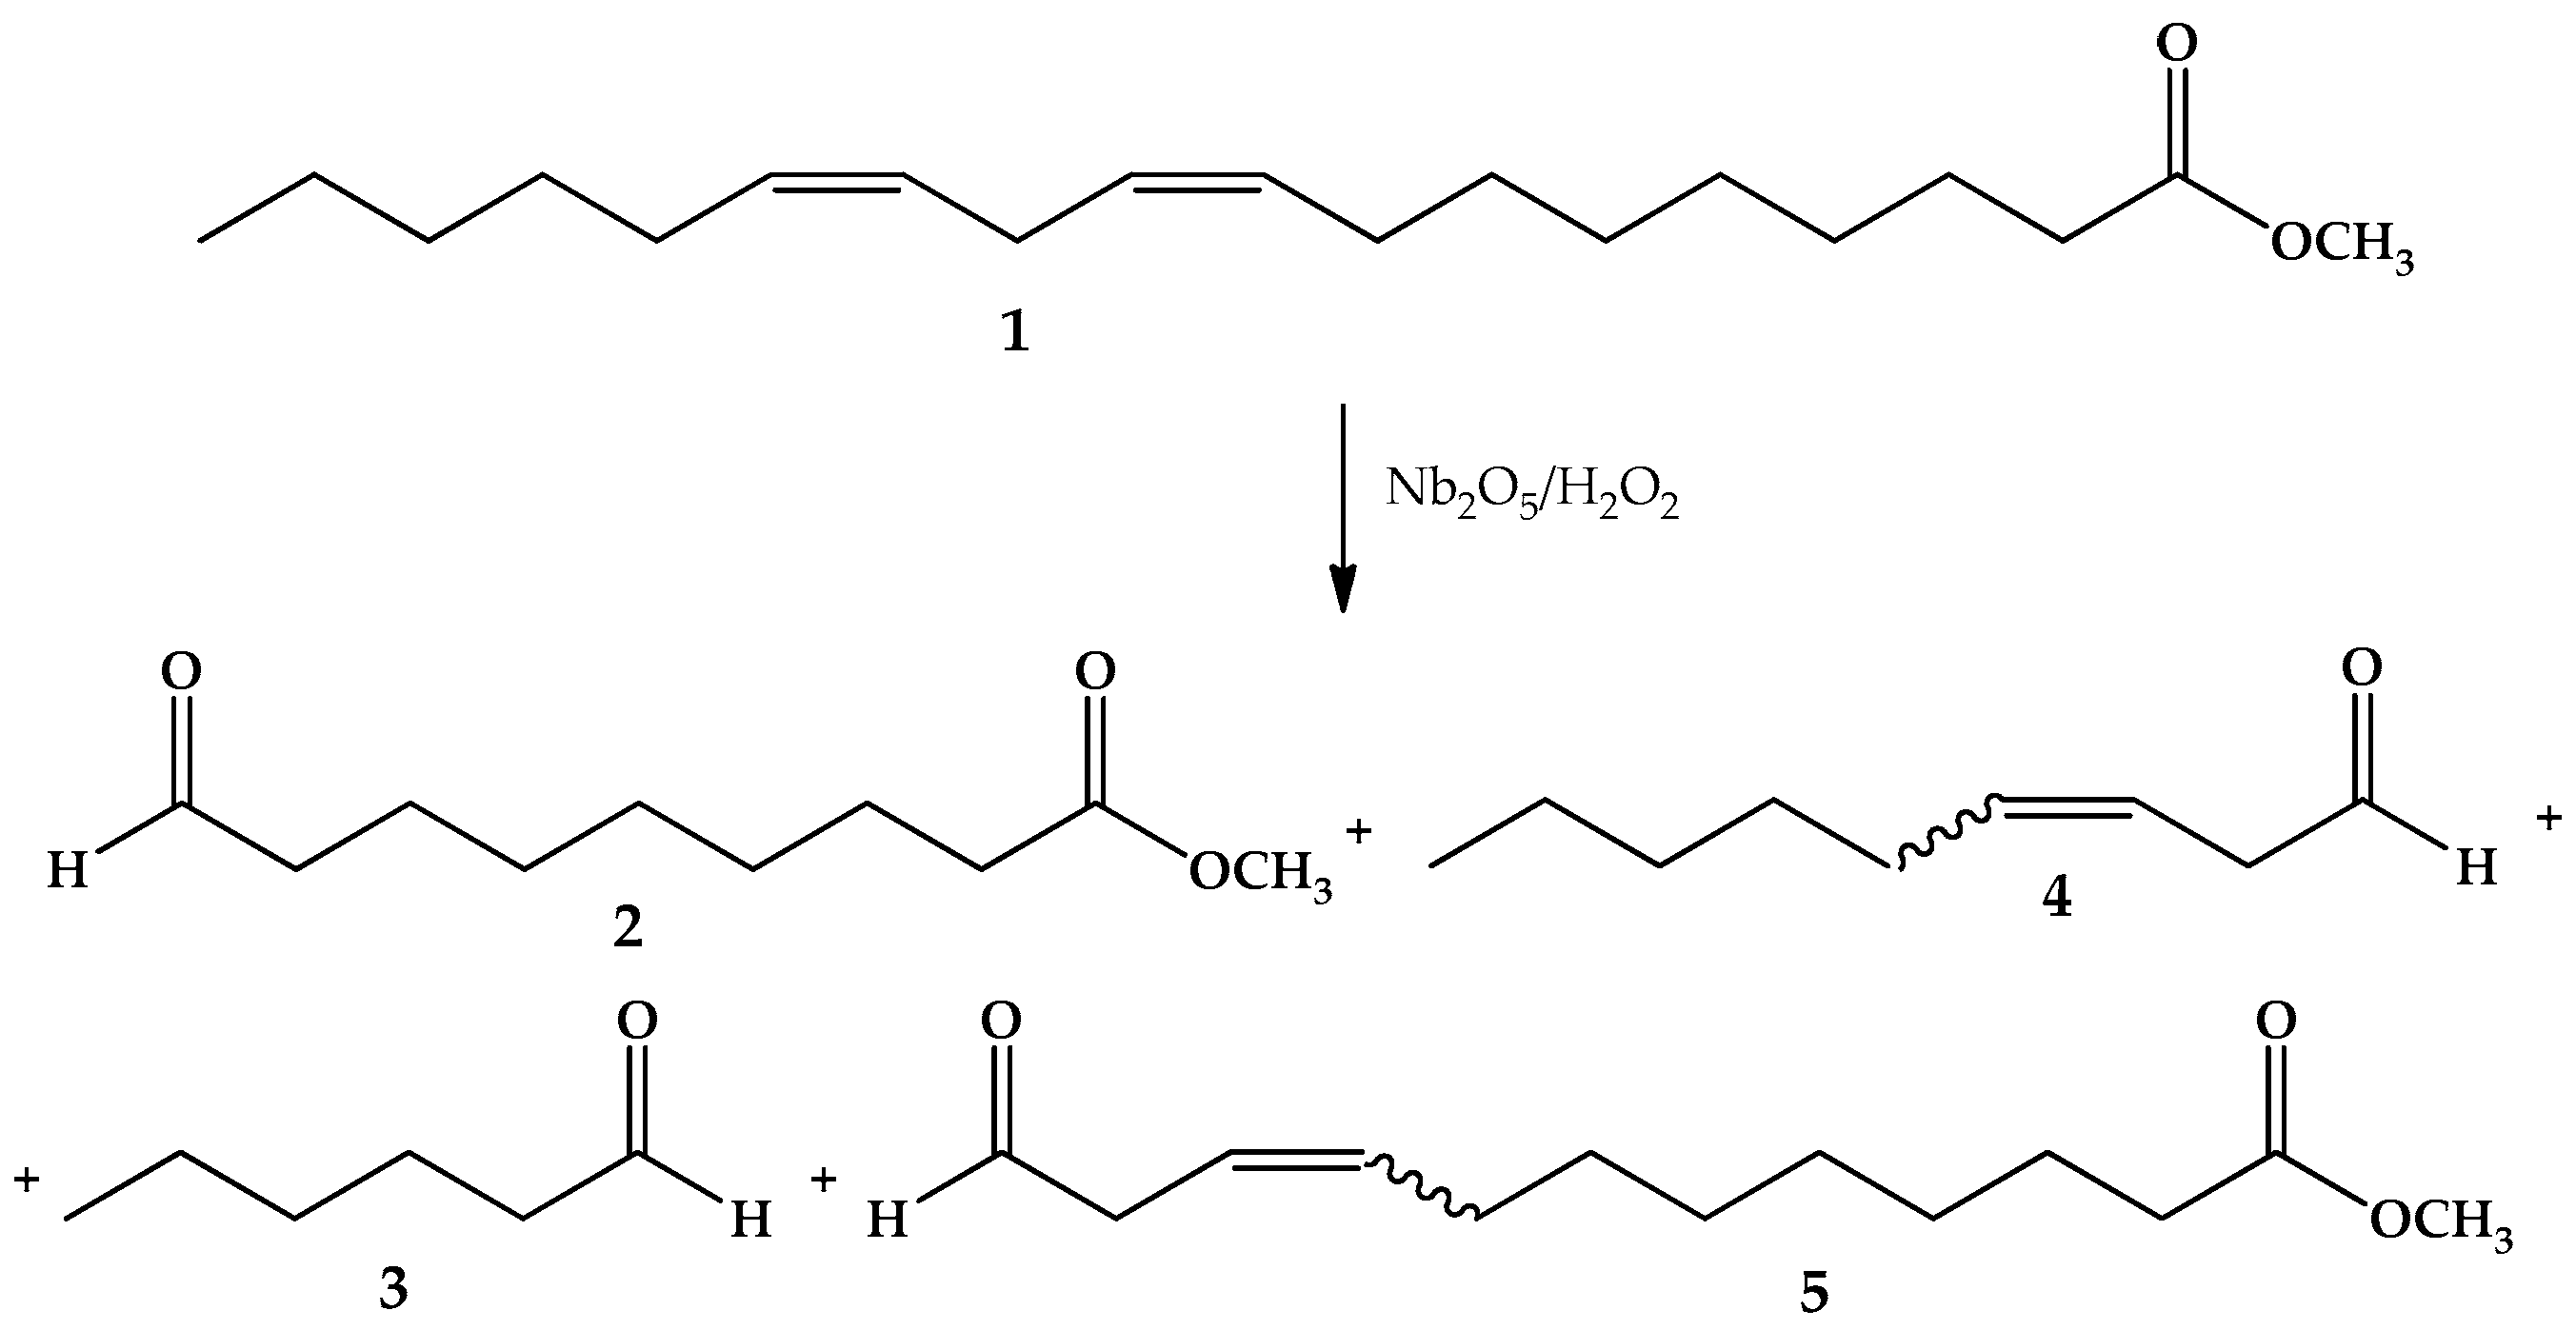
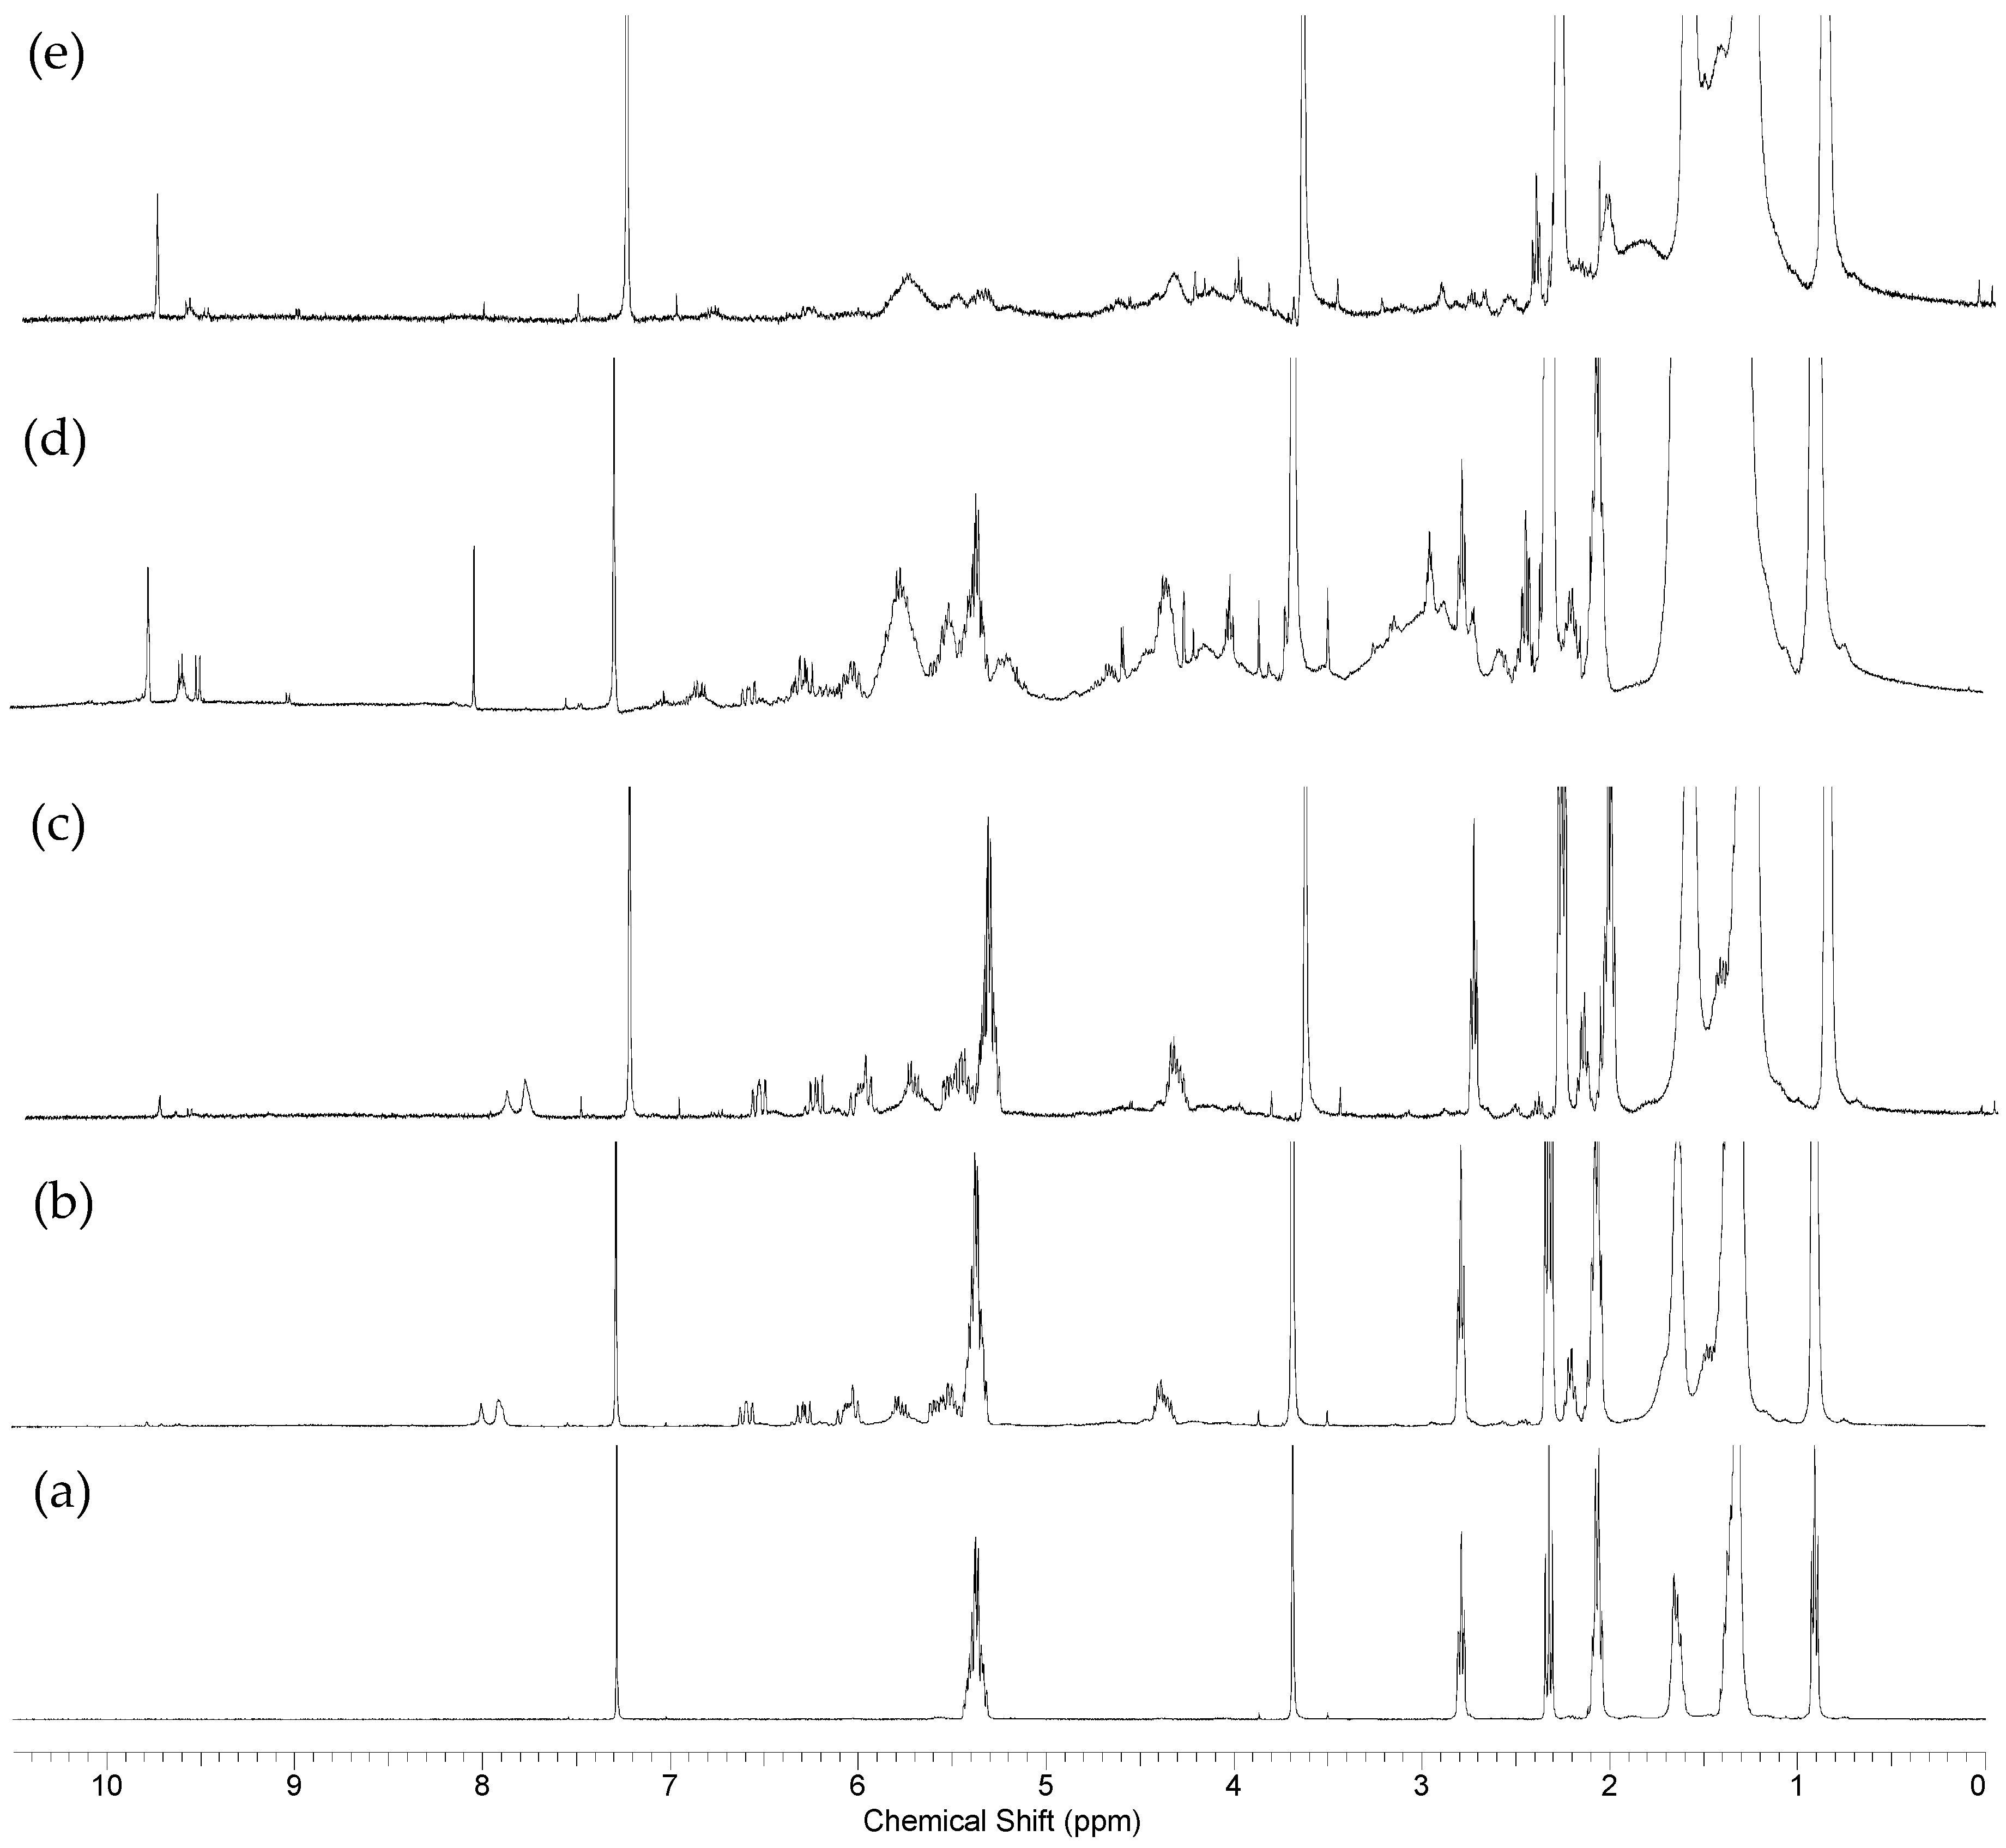
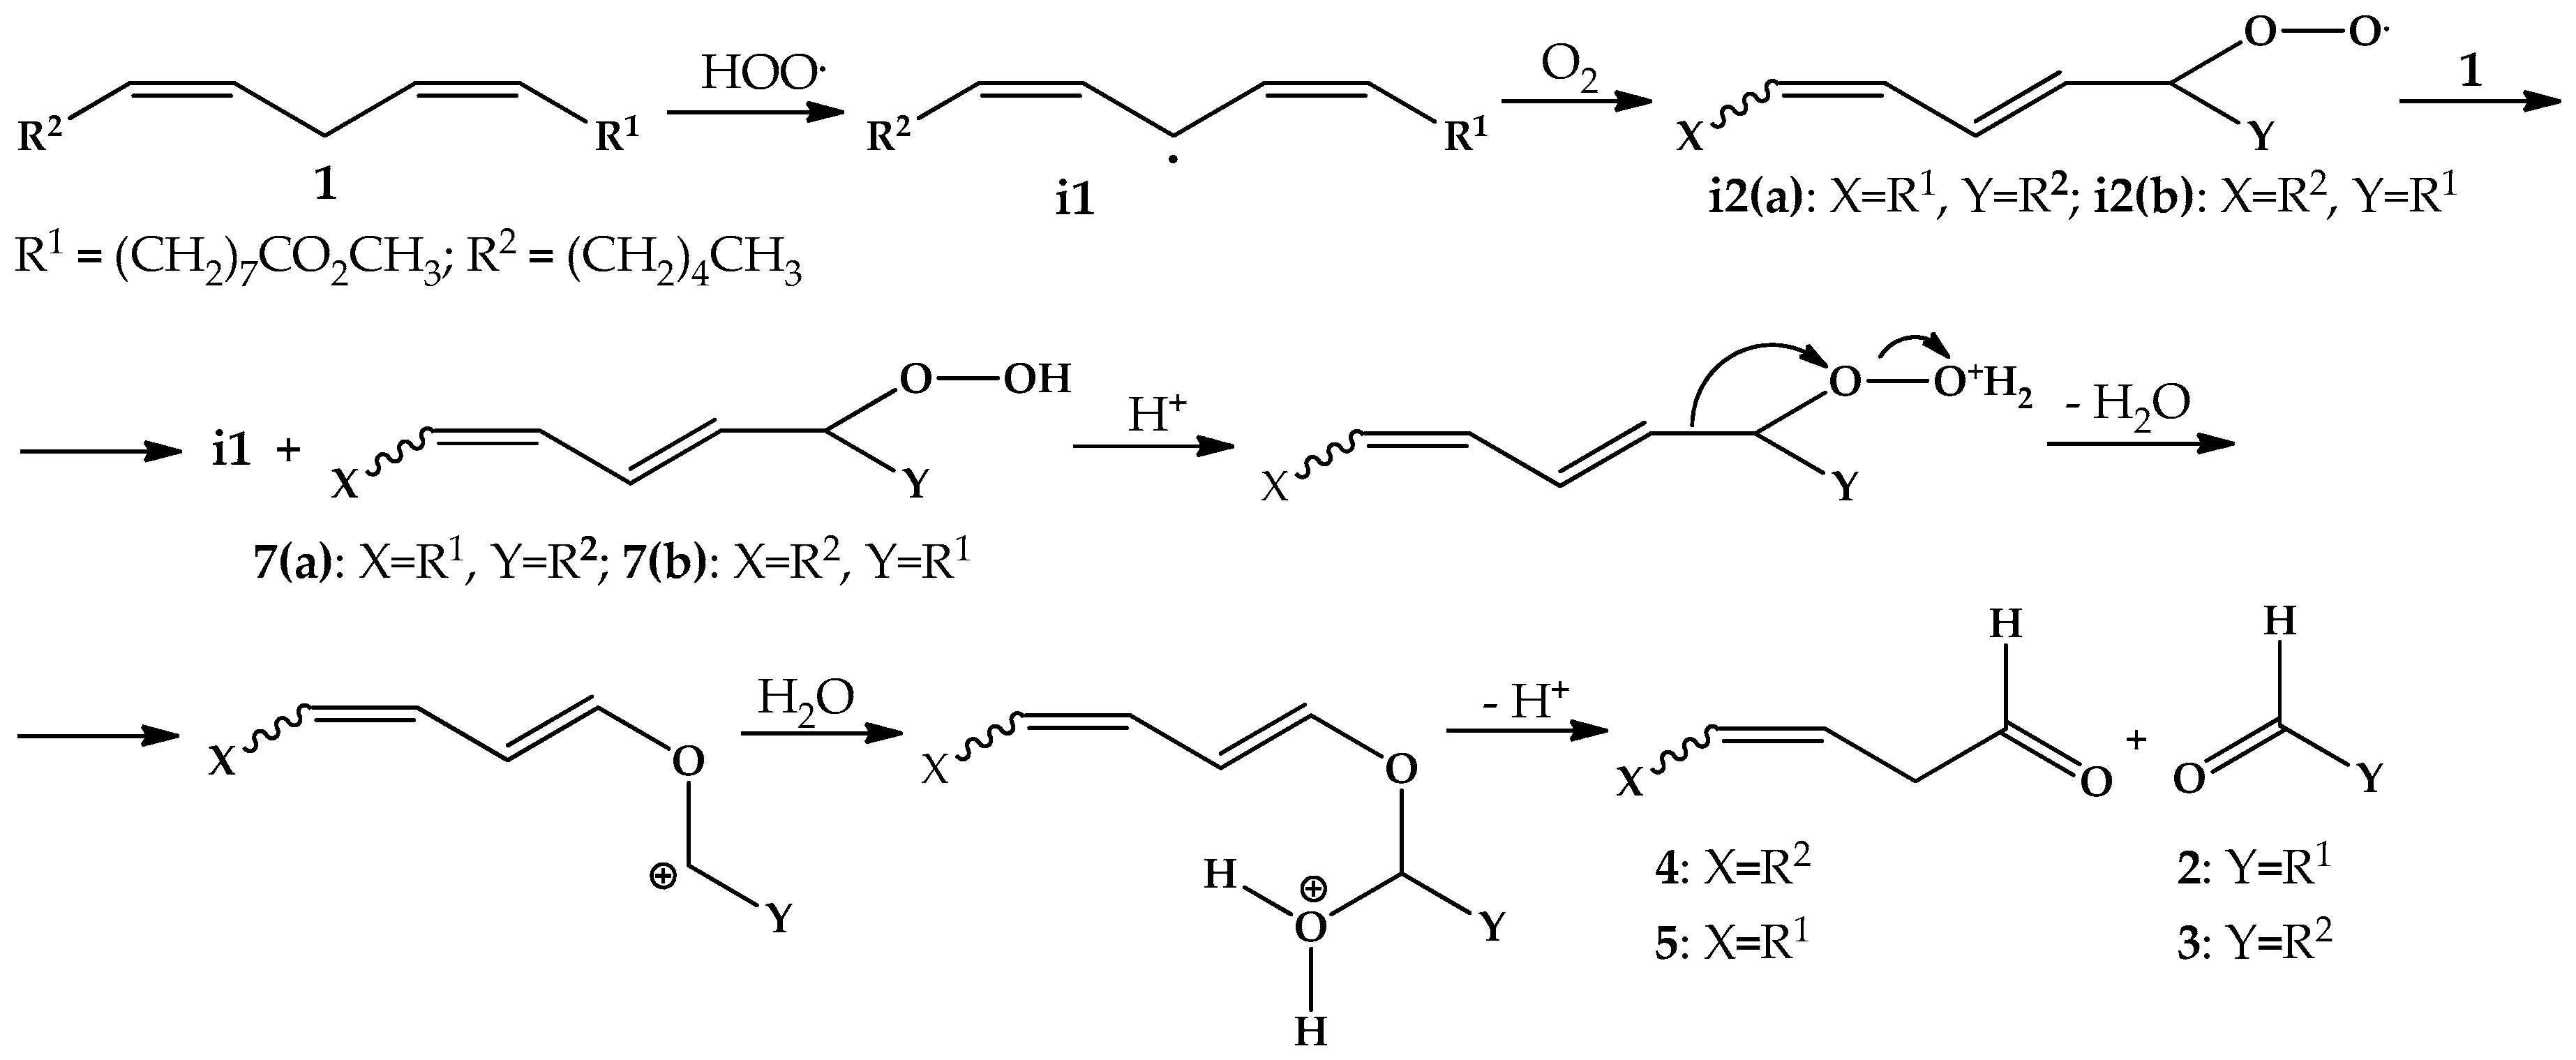
2.4. Oxidation Reaction of Linoleic Acid Methyl Ester Catalyzed by Different Types of Niobium(V) Oxide

Based on the experimental results obtained by Raman and FTIR-ATR spectroscopy, HY340, HY340-900, GO and UP were chosen to study the influence of crystallinity and the different types of systems, i.e., NbO4, NbO6, NbO7, NbO8, on the reactivity of methyl linoleate in presence of hydrogen peroxide. Thus, amorphous HY340 is able to lead to a η2-type peroxo system strongly affecting the catalyst activity. On the other hand, HY340-900 and GO show high crystallinity and a low interaction with hydrogen peroxide. Nb2O5 UP is also highly crystalline but unlike HY340-900 and GO does not show any interaction with hydrogen peroxide. The activity of these four catalysts towards the methyl linoleate oxidation was followed by gas chromatography with a flame ionization detector or coupled to a mass spectrometer and the two main products detected were methyl 9-oxo-nonanoate (2), n-hexanal (3) and, in smaller quantities, non-3-enal (4) and methyl 12-oxo-dodec-9-enoate (5) (Scheme 1).
The HY340-900/H2O2 system at 80 °C was proved to be the best combination for methyl linoleate oxidation and Figure 7 shows a typical chromatogram (CG-MS) for this reaction. Results from similar experiments with HY340, GO e UP are shown in Figures S1 and S2 in the Supplementary Materials.
In the oxidation reaction of methyl linoleate (1) catalyzed by niobium oxide(V) using hydrogen peroxide as the oxidizing agent the formation of the main product methyl 9-oxo-nonanoate (2), n-hexanal (3), non-3-enal (4) and methyl 12-oxo-dodec-9-enoate (5), as well as that of secondary products, was followed by gas chromatography (CG-FID, flame ionization detector) (Figure 7). These GC studies show that the best catalysts regarding methyl 9-oxo-nonanoate (2) and n-hexanal (3) production, were HY340-900 and GO (Figure 8II,III), whereas HY340 e UP showed less reactivity (Figure 8I,IV).
Because HY340-900 has a higher reactivity on the methyl linoleate/H2O2 reaction we decided to undertake an extensive study of this reaction employing 1H and 13C NMR. The 1H NMR spectrum of methyl linoleate (Figure 9a) shows signals for: olefinic CH at C9, C10, C12 and C13, δH 5.3–5.4 (m, 4H); CH3O, δH 3.65 (s, 3H); bis-allylic CH2, δH 2.80 (m, 2H); CH2 at C2, δH 2.5 (t, 2H); CH2 at C8 and C14, δH 2.3 (m, 4H); CH2 at C3, δH 1.60 (m, 2H); CH2 at C4–C7 and C15–C17, δH 1.25 (m, 14H); and CH3 at C18, δH 0.87 (t, 3H). After 10 min reaction, new signals appeared (Figure 9b) between δH 5.40 and 6.70, which are coupled to carbons at δC 123–140 (Figure 10) and therefore were assigned to olefinic hydrogens. At low field (Figure 9b), signals appearing at 7.9–8.0, characteristic of the hydroperoxide hydrogen (ROOH) and at δH 4.35 (m), assigned to the methine proton attached to the COOH (hydroperoxide) group can be observed. This proton is coupled to the carbon at δC 86.40, which clearly indicates the initial formation of hydroperoxides in the oxidation process (Figure 10) [71,72,73,74].
After 30 min reaction (Figure 9c), the appearance of signals in the region δH 9.4–9.8 that are directly coupled to the carbonyl carbon signal at δC 194 (Figure 10) and characteristic of aldehydes can be observed. [72] After 60 min (Figure 9d), the signals at δH 4.45 (H-COOH) and δH 7.9–8.0 (ROOH) are relatively small and an increase in the signals at δH 9.4–9.82 is clearly observed. At 120 min (Figure 9e), these later signals are relatively intense and an almost complete disappearance of the signals for the olefinic hydrogens belonging to methyl linoleate at δH 5.3–5.4 can be observed. At the same time, the signals assigned to methyl linoleate hydroperoxides at δH 7.9–8.0 (ROOH) and to the methine hydrogen at δH 4.35 (HCOOH) are also disappearing. Similar 1H NMR results were found for the methyl linoleate oxidation using catalysts HY340, GO and UP and 60 min reaction time, as shown in Figure S3.
Under the conditions described above and using HY340, HY340-900, GO e UP as the catalysts, studies carried out with methyl oleate did not provide a significant number of products (<1%) (Figure S4) [49].
The results obtained from 1H and 13C NMR studies for the oxidation reaction of methyl linoleate by hydrogen peroxide and catalyzed by HY340-900 indicate that the initial oxidation leads to the formation of conjugated hydroperoxide(s) designated as 7 arising from the peroxyl radical i2, which is proposed as an intermediate in many oxidative processes involving unsaturated derivatives of fatty acids [57]. Peroxyl radicals have been detected, indirectly [75] and, at low temperatures, directly [76], using EPR (electron paramagnetic resonance spectroscopy). The presence of the characteristic signal for the hydroperoxide hydrogen (ROOH) at δH 4.35 (m) is a clear indication of the formation of the intermediate i2 [72,74] in Scheme 2. The absence of hydroperoxides at the simple allylic positions C8 and C14, as well as the lack of reactivity for methyl oleate, suggests a mechanism initiated by hydroperoxyl radicals, formed from the interaction between Nb(V) and H2O2 [77]. These species are less reactive than the usual hydroxyl radical involved in autoxidation of lipids and selectively abstracts a hydrogen atom at the bis-allylic position forming the radical intermediate i1 (Scheme 2). On the other hand, hydrogen peroxide in the presence of transition metal ions can efficiently generate molecular oxygen, without necessarily involving intermediate generation of extremely reactive hydroxyl radicals [78,79]. The bis-allylic radical i1 reacts with oxygen preferentially at C9 and C13, forming conjugated (more stable) peroxyl radicals i2(a) and i2(b) (Scheme 2). These radicals abstract a hydrogen atom from C11 in (I), regenerating i1 and forming hydroperoxides 7(a) and 7(b), which undergo a Hock-type rearrangement [80] catalyzed by the acidity of niobium oxide(V). This rearrangement occurs with elimination of water through a 1,2-suprafacial displacement, forming oxygen-stabilized cations as intermediates that pick water back up and generate protonated hemiacetals, which then can fragment originating two aldehydes for each hydroperoxide.
The low concentration observed for the unsaturated aldehydes 4 and 5 (Figure S1) is due to the fact that these compounds contain labile C-H bonds, i.e., allylic and α to an aldehydic carbonyl (bond dissociation energy ~82.5 kcal/mol, [56] which undergo a second oxidative process yielding malonaldehyde (which is not detected with our analytical conditions) and additional formation of 3 from 4 and 2 from 5 (Scheme 1).
The absence in the 1H NMR spectra (Figure 9b–e) of signals relative to carbinolic CH from diols at δH 3.42–3.85 and CH of oxiranes at δH 2.98–3.10 [81,82,83] rule out an oxidative process occurring through 1,3 and 2,3 dipolar mechanisms and involving a concerted transfer of two electrons [84,85]. These results lead us to conclude that there is no participation of η2-peroxo-type (NbO2) complex in the oxidative process, which would lead to the initial formation of an epoxide and subsequently of diols, ketones or carboxylic acids [47,85,86,87]. In addition, the high degree of oxidation of Nb2O5 should also preclude Fenton-like processes involving hydroxyl radical formation as a reactive species (if formed, these are efficiently quenched by reaction with hydrogen peroxide—forming water and hydroperoxyl radical—before reaching the lipidic carbon chain). The involvement of hydroxyl radicals can be unequivocally discarded by the absence in the 1H NMR spectrum (Figure 9) of signals that could be attributed to other products generated by the reaction between hydroxyl radicals and methyl linoleate, such as the addition reaction to double bonds resulting in diol formation or hydrogen abstraction at sites other than the bis-allylic position [88].

3. Materials and Methods

The catalysts HY340, Optical Grade (GO) and Ultrapure (UP) niobium(V) oxide [CBMM] were subjected to thermal treatment for 24 h periods, at 400, 500, 700 and 900 °C and cooled at room temperature. They were further characterized by spectroscopic methods (Bruker Optics FT-Raman, MultiRAM II/Nd:YAG laser/1064 nm), FTIR Bruker Vertex 70 (ATR)/Nd:YAG laser/1064 nm and Shimadzu/UV-2700 Spectrophotometer/UV-Vis-NIR/Lo-Ray-Light).
In situ catalyst studies were performed with the drop wise addition of hydrogen peroxide (30%, Merck, São Paulo, Brazil) over the oxides, in a molar ratio H2O2/Nb = 1:1, with an induction time of 15 min before the analysis. Raman spectroscopy was obtained at each 1 min interval (laser at 660 nm; 280 mW intensity) and using 32 scans per analysis. Raman spectroscopy experiments aimed to evaluate the thermal stability of the different catalysts after H2O2 treatment were performed at 60 °C for 24 h and then analyzed every 4 h, following a literature procedure [89].
IR analysis was performed at 1 min interval and accumulation of 32 scans per analysis. UV-Vis spectra were recorded using a peroxide/catalyst ratio H2O2/Nb = 1:1 and an induction time of 15 min before the analyses.
Oxidation reactions of the methyl esters were carried out in sealed reactors (10 mL) under constant stirring at a temperature of 80 °C and using 50 mg of catalyst, 10 μL of the ester (oleate or linoleate, 99.99% Aldrich, São Paulo, Brazil), 200 μL of acetonitrile (PA, Tedia, Rio de Janeiro, Brazil) and 40 μL of hydrogen peroxide (Vetec, Rio de Janeiro, Brazil) added in this sequence at room temperature. Reactions were carried out in triplicate. The reaction medium was extracted with Chloroform (PA, Tedia, Rio de Janeiro, Brazil) (3 × 500 μL), centrifuged and analyzed by gas chromatography coupled to mass spectrometry (Shimadzu, GC-MS 2010/QP 2010 Plus/DB-WAX capillary column 30 m operand in splitless mode and H2 as carrier gas. Product yields were calculated from the corresponding chromatograms. 1H and 13C NMR (Bruker, AVANCE III, ULTRASHIELD PLUS-500 MHz) spectra were recorded using CDCl3 as solvent and TMS as the internal standard. In order to obtain a more resolved NMR spectrum a double number of reactants (in mass) was used in the oxidation reaction. The purification procedure was the same as described above and the CHCl3 extract was evaporated in a stream of nitrogen at room temperature and immediately analyzed. Reaction blanks were run either in the absence of hydrogen peroxide or in the presence of hydrogen peroxide and in the absence of the respective catalysts in atmospheric conditions. In all cases product formation was not observed.
Nb2O5 used in this work was supplied by CBMM (Companhia Brasileira de Metalurgia e Mineração, Araxá, Brasil) in three grades: HY340, GO (Optical Grade) and UP (Ultrapure). HY-340: niobium(V) oxide hydrate, is a white powder, not soluble in water, has high acidity (corresponding to 70% H2SO4) when calcinated at relatively low temperatures (100–300 °C) and still containing some adsorbed water. UP: ultra-pure grade niobium(V) oxide, is a calcinated white powder of high purity in niobium oxide (more than 98.5%) and has a crystalline structure; it is employed in the production of super alloys for use under elevated temperatures and in corrosive environments. GO: optical grade niobium(V) oxide, is a high purity (>99.0%) spectroscopic grade, with very low iron content (<5 ppm); it is usually employed in the optical industry (lenses, digital cameras, etc.).

4. Conclusions

Raman spectroscopy studies indicated the association of the signals at 878 and 892 cm−1 to the existence of structural defects on the surface of the catalysts. These defects are capable of originating η2-peroxo and cis-di-η2-peroxo systems, which depend on the presence of NbO7 and NbO8 structures, with amorphous HY340 being the catalyst with the highest number of such defects. Different catalysts such as HY340-900 and GO that show a high degree of crystallinity and a small number of defects are less capable of generating a η2-peroxo system. For the UP catalyst, the absence of signals relative to the η2-peroxo system can also be associated to the reduced number of defects. FTIR-ATR studies for the different catalysts show that hydrogen peroxide decomposition at the surface depends on their degree of crystallinity. For systems with a larger number of structural defects of the NbO7 and NbO8 type easy formation of η2-peroxo systems is expected. On the other hand, the lower rate of hydrogen peroxide decomposition—due to lack of surface defects—observed on the FTIR-ATR spectra for the catalysts HY340-900 and UP (Figure 5) allows the formation of η1-type species (superoxide or hydroperoxo), which are responsible for the reaction selectivity observed on the methyl linoleate oxidation reaction. The large increase in absorption observed in the 400–500 nm region of the UV-Vis spectrum for HY340 after addition of H2O2 (Figure 6 (II(a1) and (a2))) can be a consequence of an association between the defects of NbO7 and NbO8 type present and the formation of η2-peroxo and cis-di-η2-peroxo systems. The high reactivity observed for the oxidative formation of methyl 9-oxo-nonanoate from methyl linoleate, for the catalyst HY340-900 when compared to HY340 and the absence of diol or epoxide products, lead us to conclude that η2-peroxo systems are not participating as oxidant species in the reaction of methyl linoleate with hydrogen peroxide catalyzed by HY340-900. This last catalyst, which is active, and UP, which is inactive, show very similar crystallinities and the presence of a Raman signal at 993 cm−1 (Figures 1e and 4), characteristic of NbO4 type systems; this suggests that the presence of these systems have no effect on the reactivity observed in the oxidative process. Finally, the proposed mechanism leading to the initial formation of a hydroperoxide in the oxidation reaction of methyl linoleate by niobium(V) oxide/H2O2 suggests that the catalytic reactivity observed must be associated to the formation of radical species showing low oxidative potential, similar to either a hydroperoxyl radical or a η1 superoxo-type complex, which then could justify both the reactivity and selectivity presented by this reaction.

Supplementary Materials

The following are available online at www.mdpi.com/2073-4344/8/1/6/s1, Figure S1. Chromatogram in gas phase (GC) for the oxidation reaction of methyl linoleate. Figure S2. Mass fragments for the oxidation reaction of methyl linoleate. Figure S3. 1H NMR spectra (500 MHz) for the products of the oxidation reaction of methyl linoleate. Figure S4. 1H NMR spectra (500 MHz) for the products of the oxidation reaction of methyl oleate. Table S1. Composition mol percent for the oxidation reaction of methyl linoleate with hydrogen peroxide in the presence of catalysts: HY340, HY340-900, GO and UP.

Acknowledgments

The authors gratefully acknowledge the Brazilian funding agencies FAPERJ, CNPq and CAPES and CBMM (Brazilian Metallurgy and Mining Company, Brazil) for providing the Nb2O5·nH2O samples (HY-340, GO-Optical Grade and UP-Ultrapure).

Author Contributions

All authors contributed equally to this paper.

Conflicts of Interest

The authors declare no conflict of interests.

References

  1. Iizuka, T.; Ogasawara, K.; Tanabe, K. Acidic and Catalytic Properties of Niobium Pentaoxide. Bull. Chem. Soc. Jpn. 1983, 56, 2927–2931. [Google Scholar] [CrossRef]
  2. Nakajima, K.; Baba, Y.; Noma, R.; Kitano, M.; Kondo, J.N.; Hayashi, S.; Hara, M. Nb2O5·nH2O as a Heterogeneous Catalyst with Water-Tolerant Lewis Acid Sites. J. Am. Chem. Soc. 2011, 133, 4224–4227. [Google Scholar] [CrossRef] [PubMed]
  3. Nico, C.; Monteiro, T.; Graça, M.P.F. Niobium oxides and niobates physical properties: Review and prospects. Prog. Mater. Sci. 2016, 80, 1–37. [Google Scholar] [CrossRef]
  4. Valencia-Balvín, C.; Pérez-Walton, S.; Dalpian, G.M.; Osorio-Guillén, J.M. First-principles equation of state and phase stability of niobium pentoxide. Comp. Mater. Sci. 2014, 81, 133–140. [Google Scholar] [CrossRef]
  5. Aleshina, L.A.; Malinenko, V.P.; Phouphanov, A.D.; Jakovleva, N.M. The short-range order of anodic amorphous oxide films of Ta and Nb. J. Non-Cryst. Solids 1986, 87, 350–360. [Google Scholar] [CrossRef]
  6. Frevel, L.K.; Rlnn, H.W. Powder Diffraction Standards for Niobium Pentoxide and Tantalum Pentoxide. Anal. Chem. 1955, 1329–1330. [Google Scholar] [CrossRef]
  7. Holtzberg, F.; Reisman, A.; Berry, M.; Berkenblit, M. Chemistry of the Group VB Pentoxides. VI. The Polymorphism of Nb2O5. J. Am. Chem. Soc. 1957, 79, 2039–2043. [Google Scholar] [CrossRef]
  8. Kato, V.K.; Tamura, S. Die Kristallstruktur von T-Nb2O5. Acta Cryst. 1975, B31, 673–677. [Google Scholar] [CrossRef]
  9. Gatehouse, B.M.; Wadsley, A.D. The Crystal Structure of the High Temperature form of Niobium Pentoxide. Acta Cryst. 1964, 17, 1545–1554. [Google Scholar] [CrossRef]
  10. Tanabe, K. Niobic acid as an unusual acidic solid material. Mater. Chem. Phys. 1987, 17, 217–225. [Google Scholar] [CrossRef]
  11. Ushikubo, T.; Koike, Y.; Wada, K.; Xie, L.; Wang, D.; Guo, X. Study of the structure of niobium oxide by X-ray absorption fine structure and surface science techniques. Catal. Today 1996, 28, 59–69. [Google Scholar] [CrossRef]
  12. Jehng, J.-M.; Wachs, I.E. Structural Chemistry and Raman Spectra of Niobium Oxides. Chem. Mater. 1991, 3, 100–107. [Google Scholar] [CrossRef]
  13. Lebarbier, V.; Houalla, M.; Onfroy, T. New insights into the development of Brønsted acidity of niobic acid. Catal. Today 2012, 192, 123–129. [Google Scholar] [CrossRef]
  14. Ko, E.I.; Weissman, J.G. Structures of niobium pentoxide and their implications on chemical behavior. Catal. Today 1990, 8, 27–36. [Google Scholar] [CrossRef]
  15. Weissman, J.G.; Ko, E.I.; Wynblatt, P.; Howe, J.M. High-resolution electron microscopy and image simulation of TT-,T-, and H-niobia and model silica-supported niobium surface oxides. Chem. Mater. 1989, 1, 187–193. [Google Scholar] [CrossRef]
  16. Ikeya, T.; Senna, M. Change in the structure of niobium pentoxide due to mechanical and thermal treatments. J. Non-Cryst. Solids 1988, 105, 243–250. [Google Scholar] [CrossRef]
  17. Vaska, L. Dioxygen-Metal Complexes: Toward a Unified View. Acc. Chem. Res. 1975, 9, 175–183. [Google Scholar] [CrossRef]
  18. Sheldon, R.A.; Kochi, J.K. Chapter 4, Activation of Molecular Oxygen by Metal Complexes. In Metal-Catalyzed Oxidations of Organic Compounds, Mechanistic Principles and Synthetic Methodology Including Biochemical Processes, 1st ed.; Academic Press: New York, NY, USA, 1981; pp. 71–119. ISBN 978-0-12-639380-4. [Google Scholar]
  19. Bayot, D.; Devillers, M.; Peeters, D. Vibrational Spectra of Eight-Coordinate Niobium and Tantalum Complexes with Peroxo Ligands: A Theoretical Simulation. Eur. J. Inorg. Chem. 2005, 2005, 4118–4123. [Google Scholar] [CrossRef]
  20. Oliveira, L.C.A.; Ramalho, T.C.; Gonçalves, M.; Cereda, F.; Carvalho, K.T.; Nazarro, M.S.; Sapag, K. Pure niobia as catalyst for the oxidation of organic contaminants: Mechanism study via ESI-MS and theoretical calculations. Chem. Phys. Lett. 2007, 446, 133–137. [Google Scholar] [CrossRef]
  21. Ziolek, M.; Sobczak, I.; Decyk, P.; Sobanska, K.; Pietrzyk, P.; Sojka, Z. Search for reactive intermediates in catalytic oxidation with hydrogen peroxide over amorphous niobium(V) and tantalum(V) oxides. Appl. Catal. B Environ. 2015, 164, 288–296. [Google Scholar] [CrossRef]
  22. Fan, W.; Zhang, Q.; Deng, W.; Wang, Y. Niobic Acid Nanosheets Synthesized by a Simple Hydrothermal Method as Efficient Brønsted Acid Catalysts. Chem. Mater. 2013, 25, 3277–3287. [Google Scholar] [CrossRef]
  23. Paulis, M.; Martin, M.; Soria, D.B.; Diaz, A.; Odriozola, J.A.; Montes, M. Preparation and characterization of niobium oxide for the catalytic aldol condensation of acetone. Appl. Catal. A 1999, 180, 411–420. [Google Scholar] [CrossRef]
  24. Pittman, R.M.; Bell, A.T. Raman studies of the structure of niobium oxide/titanium oxide (Nb2O5·TiO2). J. Phys. Chem. 1993, 97, 12178–12185. [Google Scholar] [CrossRef]
  25. Izumi, F.; Kodama, H. Crystallization and relative stabilities of Polymorphs of Niobium(V) Oxide under hydrothermal conditions. Z. Anorg. Allg. Chem. 1978, 440, 155–167. [Google Scholar] [CrossRef]
  26. Jimenez-Morales, I.; Teckchandani-Ortiz, A.; Santamaria-Gonzalez, J.; Maireles-Torres, P.; Jimenez-Lopez, A. Selective dehydration of glucose to 5-hydroxymethylfurfural on acidic mesoporous tantalum phosphate. Appl. Catal. B Environ. 2014, 144, 22–28. [Google Scholar] [CrossRef]
  27. Ali, M.; Siddiki, S.M.A.; Kon, K.; Shimizu, K.I. A Heterogeneous Niobium(V) Oxide Catalyst for the Direct Amidation of Esters. ChemCatChem 2015, 7, 2705–2710. [Google Scholar] [CrossRef]
  28. Gupta, N.K.; Fukuoka, A.; Nakajima, K. Amorphous Nb2O5 as a Selective and Reusable Catalyst for Furfural Production from Xylose in Biphasic Water and Toluene. ACS Catal. 2017, 7, 2430–2436. [Google Scholar] [CrossRef]
  29. Mbaraka, I.K.; Shanks, B.H. Conversion of oils and fats using advanced mesoporous heterogeneous catalysts. J. Am. Oil Chem. Soc. 2006, 83, 79–91. [Google Scholar] [CrossRef]
  30. Biermann, U.; Bornscheuer, U.; Meier, M.A.; Metzger, J.O.; Schäfer, H.J. Oils and Fats as Renewable Raw Materials in Chemistry. Angew. Chem. Int. Ed. Engl. 2011, 50, 3854–3871. [Google Scholar] [CrossRef] [PubMed]
  31. Anneken, D.J.; Both, S.; Christoph, R.; Fieg, G.; Steinberner, U.; Westfechtel, A. Fatty Acids. Ullmann’s Encycl. Ind. Chem. 2006, 14, 73–116. [Google Scholar] [CrossRef]
  32. Godard, A.; De Caro, P.; Thiebaud-Roux, S.; Vedrenne, E.; Mouloungui, Z. New Environmentally Friendly Oxidative Scission of Oleic Acid into Azelaic Acid and Pelargonic Acid. J. Am. Oil Chem. Soc. 2013, 90, 133–140. [Google Scholar] [CrossRef]
  33. Samarth, N.B.; Mahanwar, P.A. Modified Vegetable Oil Based Additives as a Future Polymeric Material—Review. Open J. Org. Polym. Mater. 2015, 5, 1–22. [Google Scholar] [CrossRef]
  34. Kerenkan, A.E.; Béland, F.; Do, T.-O. Chemically catalyzed oxidative cleavage of unsaturated fatty acids and their derivatives into valuable products for industrial applications: A review and perspective. Catal. Sci. Technol. 2016, 6, 971–987. [Google Scholar] [CrossRef]
  35. Holleben, M.L.A.V.; Schuch, C.M. Ativação do peróxido de hidrogênio para a epoxidação de olefinas não-funcionalizadas. Quim. Nova 1997, 20, 58–71. [Google Scholar] [CrossRef]
  36. Spannring, P.; Bruijnincx, P.C.A.; Weckhuysen, B.M.; Gebbink, R.J.M.K. Transition metal-catalyzed oxidative double bond cleavage of simple and bio-derived alkenes and unsaturated fatty acids. Catal. Sci. Technol. 2014, 4, 2182–2209. [Google Scholar] [CrossRef]
  37. Khlebnikova, T.B.; Pai, Z.P.; Fedoseeva, L.A.; Mattsat, Y.V. Catalytic oxidation of fatty acids. II. Epoxidation and oxidative cleavage of unsaturated fatty acid esters containing additional functional groups. React. Kinet. Catal. Lett. 2009, 98, 9–17. [Google Scholar] [CrossRef]
  38. Pérez, J.E.; Haagenson, D.M.; Pryor, S.W.; Ulven, C.A.; Wiesenborn, D.P. Production and Characterization of Epoxidized Canola Oil. Trans. ASABE 2009, 52, 1289–1297. [Google Scholar] [CrossRef]
  39. Mungroo, R.; Goud, V.V.; Pradhan, N.C.; Dalai, A.K. Modification of epoxidised canola oil. Asia-Pac. J. Chem. Eng. 2011, 6, 14–22. [Google Scholar] [CrossRef]
  40. Tan, S.G.; Chow, W.S. Biobased Epoxidized Vegetable Oils and Its Greener Epoxy Blends: A Review. Polym.-Plast. Technol. Eng. 2010, 49, 1581–1590. [Google Scholar] [CrossRef]
  41. Santacesaria, E.; Renken, A.; Russo, V.; Turco, R.; Tesser, R.; Di Serio, M. Biphasic Model Describing Soybean Oil Epoxidation with H2O2 in Continuous Reactors. Ind. Eng. Chem. Res. 2012, 51, 8760–8767. [Google Scholar] [CrossRef]
  42. Oakley, M.A.; Woodward, S.; Coupland, K.; Parker, D.; Temple-Heald, C. Practical dihydroxylation and C–C cleavage of unsaturated fatty acids. J. Mol. Catal. A Chem. 1999, 150, 105–111. [Google Scholar] [CrossRef]
  43. Köckritz, A.; Martin, A. Synthesis of azelaic acid from vegetable oil-based feedstocks. Eur. J. Lipid Sci. Technol. 2011, 113, 83–91. [Google Scholar] [CrossRef]
  44. Kulik, A.; Janz, A.; Pohl, M.M.; Martin, A.; Köckritz, A. Gold-catalyzed synthesis of dicarboxylic and monocarboxylic acids. Eur. J. Lipid Sci. Technol. 2012, 114, 1327–1332. [Google Scholar] [CrossRef]
  45. Santacesaria, E.; Sorrentino, A.; Rainone, F.; Di Serio, M.; Speranza, F. Oxidative Cleavage of the Double Bond of Monoenic Fatty Chains in Two Steps:  A New Promising Route to Azelaic Acid and Other Industrial Products. Ind. Eng. Chem. Res. 2000, 39, 2766–2771. [Google Scholar] [CrossRef]
  46. Zaldman, B.; Kisilev, A.; Sasson, Y.; Garti, N. Double bond oxidation of unsaturated fatty acids. J. Am. Oil Chem. Soc. 1988, 65, 611–615. [Google Scholar] [CrossRef]
  47. Turnwald, S.E.; Lorier, M.A.; Wright, L.J.; Mucalo, M.R. Oleic Acid Oxidation Using Hydrogen Peroxide in Conjunction with Transition Metal Catalysis. J. Mater. Sci. Lett. 1998, 17, 1305–1307. [Google Scholar] [CrossRef]
  48. Schaich, K.M.; Borg, D.C. Fenton reactions in lipid phases. Lipids 1988, 23, 570–579. [Google Scholar] [CrossRef] [PubMed]
  49. Noureddini, H.; Kanabur, M. Liquid-phase catalytic oxidation of unsaturated fatty acids. J. Am. Oil Chem. Soc. 1999, 76, 305–312. [Google Scholar] [CrossRef]
  50. Rup, S.; Zimmermann, F.; Meux, E.; Schneider, M.; Sindt, M.; Oget, N. The ultrasound-assisted oxidative scission of monoenic fatty acids by ruthenium tetroxide catalysis: Influence of the mixture of solvents. Ultrason. Sonochem. 2009, 16, 266–272. [Google Scholar] [CrossRef] [PubMed]
  51. Otte, K.B.; Kirtz, M.; Nestl, B.M.; Hauer, B. Synthesis of 9-Oxononanoic Acid, a Precursor for Biopolymers. ChemSusChem 2013, 6, 2149–2156. [Google Scholar] [CrossRef] [PubMed]
  52. Liguori, A.; Belsito, E.L.; Gioia, M.L.; Leggio, A.; Malagrinò, F.; Romio, E.; Siciliano, C.; Tagarelli, A. GC/MS Analysis of Fatty Acids in Italian Dry Fermented Sausages. Open Food Sci. J. 2015, 9, 5–13. [Google Scholar] [CrossRef]
  53. Sun, Y.-E.; Wang, W.-D.; Chen, H.-W.; Li, C. Autoxidation of Unsaturated Lipids in Food Emulsion. Crit. Rev. Food Sci. Nutr. 2011, 51, 453–466. [Google Scholar] [CrossRef] [PubMed]
  54. Min, D.B.; Boff, J.M. Chapter 11, Lipid Oxidation of Edible Oil. In Food Lipids: Chemistry, Nutrition and Biotechnology, 2nd ed.; Akoh, C.C., Min, D.B., Eds.; CRC Press: New York, NY, USA, 2002; pp. 335–364. ISBN 0-8247-0749-4. [Google Scholar]
  55. Mattila, H.; Khorobrykh, S.; Havurinne, V.; Tyystjärvi, E. Reactive oxygen species: Reactions and detection from photosynthetic tissues. J. Photochem. Photobiol. B 2015, 152, 176–214. [Google Scholar] [CrossRef] [PubMed]
  56. Luo, Y.-R. Comprehensive Handbook of Chemical Bond Energies; CRC Press: Boca Raton, FL, USA, 2007. [Google Scholar]
  57. Choe, E.; Min, D.B. Mechanisms and Factors for Edible Oil Oxidation. Compr. Rev. Food Sci. Food Saf. 2006, 5, 169–186. [Google Scholar] [CrossRef]
  58. Guerrero-Perez, M.O.; Banares, M.A. Niobium as promoting agent for selective oxidation reactions. Catal. Today 2009, 142, 245–251. [Google Scholar] [CrossRef]
  59. Chen, C.; Zhao, X.; Chen, J.; Hua, L.; Zhang, R.; Guo, L.; Hou, Z. Niobium Peroxide-Catalyzed Selective Epoxidation of Allylic Alcohols. ChemCatChem 2014, 6, 3231–3238. [Google Scholar] [CrossRef]
  60. Marchetti, F.; Pampaloni, G.; Zacchini, S. Epoxide ring opening and insertion into the M–X bond of niobium and tantalum pentahalides: Synthesis of dihalide-tris(2-haloalcoholato) complexes. Polyhedron 2009, 28, 1235–1240. [Google Scholar] [CrossRef]
  61. Marin-Astorga, N.; Martinez, J.J.; Suarez, D.N.; Cubillos, J.; Rojas, H.; Ortiz, C.A. Nb2O5 as Heterogeneous Catalysts for the Selective Oxidation of Geraniol. Curr. Org. Chem. 2012, 16, 2797–2801. [Google Scholar] [CrossRef]
  62. Nowak, I.; Kilos, B.; Ziolek, M.; Lewandowska, A. Epoxidation of cyclohexene on Nb-containing meso- and macroporous materials. Catal. Today 2003, 78, 487–498. [Google Scholar] [CrossRef]
  63. Tiozzo, C.; Bisio, C.; Carniato, F.; Guidotti, M. Grafted non-ordered niobium-silica materials: Versatile catalysts for the selective epoxidation of various unsaturated fine chemicals. Catal. Today 2014, 235, 49–57. [Google Scholar] [CrossRef]
  64. Tiozzo, C.; Palumbo, C.; Psaro, R.; Bisio, C.; Carniato, F.; Gervasini, A.; Guidotti, M. The stability of niobium-silica catalysts in repeated liquid-phase epoxidation tests: A comparative evaluation of in-framework and grafted mixed oxides. Inorg. Chim. Acta 2015, 431, 190–196. [Google Scholar] [CrossRef]
  65. Turco, R.; Aronne, A.; Carniti, P.; Gervasini, A.; Minieri, L.; Pernice, P.; Di Serio, M. Influence of preparation methods and structure of niobium oxide-based catalysts in the epoxidation reaction. Catal. Today 2015, 254, 99–103. [Google Scholar] [CrossRef]
  66. Bayot, D.; Tinant, B.; Devillers, M. Water-soluble niobium peroxo complexes as precursors for the preparation of Nb-based oxide catalysts. Catal. Today 2003, 78, 439–447. [Google Scholar] [CrossRef]
  67. Bayot, D.; Tinant, B.; Mathieu, B.; Declercq, J.P.; Devillers, M. Spectroscopic and Structural Characterizations of Novel Water-Soluble Peroxo[polyaminocarboxylato bis(N-oxido)]niobate(V) Complexes. Eur. J. Inorg. Chem. 2003, 4, 737–743. [Google Scholar] [CrossRef]
  68. Voraberger, H.; Ribitsch, V.; Janotta, M.; Mizaikoff, B. Application of Mid-Infrared Spectroscopy: Measuring Hydrogen Peroxide Concentrations in Bleaching Baths. Appl. Spectrosc. 2003, 57, 574–579. [Google Scholar] [CrossRef] [PubMed]
  69. Carvalho, K.T.; Silva, A.C.; Oliveira, L.C.; Gonçalves, M.; Magriotis, Z.M. Nióbia sintética modificada como catalisador na oxidação de corante orgânico: Utilização de H2O2 e O2 atmosférico como oxidantes. Quim. Nova 2009, 32, 1373–1377. [Google Scholar] [CrossRef]
  70. Ziolek, M.; Sobczak, I.; Decyk, P.; Wolski, L. The ability of Nb2O5 and Ta2O5 to generate active oxygen in contact with hydrogen peroxide. Catal. Commun. 2013, 37, 85–91. [Google Scholar] [CrossRef]
  71. Grechkin, A.N.; Kuramshin, R.A.; Latypov, S.K.; Safonova, Y.Y.; Gafarova, T.E.; Ilyasov, A.V. Hydroperoxides of α-ketols. FEBS J. 1991, 199, 451–457. [Google Scholar] [CrossRef]
  72. Miccichè, F.; van Haveren, J.; Oostveen, E.; Ming, W.; van der Linde, R. Oxidation and oligomerization of ethyl linoleate under the influence of the combination of ascorbic acid 6-palmitate/iron-2-ethylhexanoate. Appl. Catal. A Gen. 2006, 297, 174–181. [Google Scholar] [CrossRef]
  73. Juita; Dlugogorski, B.Z.; Kennedy, E.M.; Mackie, J.C. Low temperature oxidation of linseed oil: A review. Fire Sci. Rev. 2012, 1, 1–36. [Google Scholar] [CrossRef]
  74. Brash, A.R. Autoxidation of methyl linoleate: Identification of the bis-allylic 11-hydroperoxide. Lipids 2000, 35, 947–952. [Google Scholar] [CrossRef] [PubMed]
  75. Yanez, J.; Sevilla, C.L.; Becker, D.; Sevilla, M.D. Low-temperature autoxidation in unsaturated lipids: An electron spin resonance study. J. Phys. Chem. 1987, 91, 487–491. [Google Scholar] [CrossRef]
  76. Venkataraman, S.; Schafer, F.Q.; Buettner, G.R. Detection of Lipid Radicals Using EPR. Antioxid. Redox Signal. 2004, 6, 631–638. [Google Scholar] [CrossRef] [PubMed]
  77. Ramalho, T.C.; Oliveira, L.C.A.; Carvalho, K.T.G.; Souza, E.F.; Cunha, E.F.F.; Nazzaro, M. The molecular basis for the behaviour of niobia species in oxidation reaction probed by theoretical calculations and experimental techniques. Mol. Phys. 2009, 107, 171–179. [Google Scholar] [CrossRef]
  78. Kremer, M.L. “Complex” versus “free radical” mechanism for the catalytic decomposition of H2O2 by ferric ions. Int. J. Chem. Kinet. 1985, 17, 1299–1314. [Google Scholar] [CrossRef]
  79. Salem, I.A.; El-Maazawi, M.; Zaki, A.B. Kinetics and mechanisms of decomposition reaction of hydrogen peroxide in presence of metal complexes. Int. J. Chem. Kinet. 2000, 32, 643–666. [Google Scholar] [CrossRef]
  80. Wang, Z. Hock Rearrangement. In Comprehensive Organic Name Reactions and Reagents; John Wiley & Sons: New York, NY, USA, 2010; pp. 1438–1442. ISBN 9780470638859. [Google Scholar]
  81. Li, Z.; Tran, V.H.; Duke, R.K.; Ng, M.C.; Yang, D.; Duke, C.C. Synthesis and biological activity of hydroxylated derivatives of linoleic acid and conjugated linoleic acids. Chem. Phys. Lipids 2009, 158, 39–45. [Google Scholar] [CrossRef] [PubMed]
  82. Mungroo, R.; Pradhan, N.C.; Goud, V.V.; Dalai, A.K. Epoxidation of Canola Oil with Hydrogen Peroxide Catalyzed by Acidic Ion Exchange Resin. J. Am. Oil Chem. Soc. 2008, 85, 887–896. [Google Scholar] [CrossRef]
  83. Farias, M.; Martinelli, M. Epoxidation of soybean oil with [MoO2(acac)2]/TBHP Catalytic system in [bmim][PF6]. Quim. Nova 2012, 35, 1538–1541. [Google Scholar] [CrossRef]
  84. Mimoun, H.; De Roch, I.S.; Sajus, L. Epoxydation des olefines par les complexes peroxydiques covalents du molybdene-VI. Tetrahedron 1970, 26, 37–50. [Google Scholar] [CrossRef]
  85. Mimoun, H.; Saussine, L.; Daire, E.; Postel, M.; Fischer, J.; Weiss, R. Vanadium(V) peroxy complexes. New versatile biomimetic reagents for epoxidation of olefins and hydroxylation of alkanes and aromatic hydrocarbons. J. Am. Chem. Soc. 1983, 105, 3101–3110. [Google Scholar] [CrossRef]
  86. Bregante, D.T.; Flaherty, D.W. Periodic Trends in Olefin Epoxidation over Group IV and V Framework-Substituted Zeolite Catalysts: A Kinetic and Spectroscopic Study. J. Am. Chem. Soc. 2017, 139, 6888–6898. [Google Scholar] [CrossRef] [PubMed]
  87. Pai, Z.P.; Tolstikov, A.G.; Berdnikova, P.V.; Kustova, G.N.; Khlebnikova, T.B.; Selivanova, N.V.; Kostrovskii, V.G. Catalytic oxidation of olefins and alcohols with hydrogen peroxide in a two-phase system giving mono- and dicarboxylic acids. Russ. Chem. Bull. 2005, 54, 1847–1854. [Google Scholar] [CrossRef]
  88. Machulek, A.; Quina, F.H.; Gozzi, F.; Silva, V.O.; Friedrich, L.C.; Moraes, J.E. Chapter 11, Fundamental Mechanistic Studies of the Photo-Fenton Reaction for the Degradation of Organic Pollutants. In Organic Pollutants Ten Years after the Stockholm Convention—Environmental and Analytical Update; Intech: London, UK, 2012; pp. 271–293. ISBN 978-953-307-917-2. [Google Scholar]
  89. Oliveira, L.C.A.; Portilho, M.F.; Silva, A.C.; Taroco, H.A.; Souza, P.P. Modified niobia as a bifunctional catalyst for simultaneous dehydration and oxidation of glycerol. Appl. Catal. B Environ. 2012, 117–118, 29–35. [Google Scholar] [CrossRef]
Figure 1. Raman spectra for the HY340 set: (a) HY340; (b) HY340-400; (c) HY340-500; (d) HY340-700 and (e) HY340-900.
Catalysts 08 00006 g001
Figure 2. In situ Raman spectra (laser: 660 nm/280 mW/32 scans) showing the signal intensity variation at 540, 878 and 892 cm−1. Spectra before H2O2-treatment: (I(a)) and (II(a)) HY340, (III(a)) HY340-400, (IV(a)) HY340-500, (V(a)) HY340-700 and (VI(a)) HY340-900. After addition of hydrogen peroxide: (I(bf)) HY340/H2O2, taken after 1 min time intervals between spectra; (II(bf)) HY340/H2O2, taken after 4 h intervals at 60 °C; (III(bf)) HY340-400/H2O2, (IV(bf)) HY340-500/H2O2, (V(bf)) HY340-700/H2O2 and (VI(bf)) HY340-900/H2O2, all taken after 1 min intervals.
Catalysts 08 00006 g002
Figure 3. (I) Raman spectroscopy for GO catalysts treated at different temperatures, before addition of hydrogen peroxide (untreated, 400 °C, 500 °C, 700 °C and 900 °C): (a) GO; (b) GO-400; (c) GO-500; (d) GO-700 and (e) GO-900. In situ Raman spectroscopy for GO catalysts before addition of hydrogen peroxide (II(a)) GO; (III(a)) GO-400; (IV(a)) GO-500; (V(a)) GO-700 and (VI(a)) GO-900; and after addition of hydrogen peroxide: (II(bf)) GO; (III(bf)) GO-400; (IV(bf)) GO-500; (V(bf)) GO-700 and (VI(bf)) GO-900—successive analyses at 1 min time intervals with the laser operating at 660 nm/280 mW/32 scans.
Catalysts 08 00006 g003
Figure 4. (I) Raman spectrum for the catalysts: (I(a)) UP; (I(b)) UP-400; (I(c)) UP-500; (I(d)) UP-700 and (I(e)) UP-900 (II). In situ Raman spectra for the catalysts treated with hydrogen peroxide: (II(a)) UP; (II(b)) UP-400; (II(c)) UP-500; (II(d)) UP-700 and (II(e)) UP-900.
Catalysts 08 00006 g004
Figure 5. In situ FTIR-ATR spectra for the catalysts treated with hydrogen peroxide recorded with 1 min intervals and 32 scans/reading: (I) (a) HY340; (b) HY340-400; (c) HY340-500; (d) HY340-700 and (e) HY340-900. (II) (a) GO; (b) GO-400; (c) GO-500; (d) GO-700 and (e) GO-900. (III) (a) UP; (b) UP-400; (c) UP-500; (d) UP-700 and (e) UP-900.
Catalysts 08 00006 g005aCatalysts 08 00006 g005b
Figure 6. Diffuse reflectance UV-Visible spectra. (I), before treatment with hydrogen peroxide: (a) HY340; (b) HY340-400; (c) HY340-500; (d) HY340-700 and (e) HY340-900; (II) after treatment with hydrogen peroxide: (a1) HY340; (a2) HY340/H2O2; (a3) HY340/H2O2 12 h at 60 °C; (e1) HY340-900; (e2) HY340-900/H2O2; (e3) HY340-900/H2O2/12 h at 60 °C; (III) (a) GO; (b) GO-400; (c) GO-500; (d) GO-700 and (e) GO-900; (IV) (a) UP; (b) UP-400; (c) UP-500; (d) UP-700 and (e) UP-900.
Catalysts 08 00006 g006
Scheme 1. Oxidation of methyl linoleate by hydrogen peroxide/Nb2O5.
Catalysts 08 00006 sch001
Figure 7. GC-MS for methyl linoleate oxidation by HY340-900/H2O2 at 80 °C after 60 min reaction. (1) methyl linoleate, (2) methyl 9-oxo-nonanoate, (3) n-hexanal, (4) non-3-enal and (5) methyl 12-oxo-dodec-9-enoate.
Catalysts 08 00006 g007
Figure 8. Time (minutes) x composition (mol %) curves for the oxidation reaction of methyl linoleate with hydrogen peroxide in the presence of catalysts: (I) HY340, (II) HY340-900, (III) GO and (IV) UP.
Catalysts 08 00006 g008
Figure 9. 1H NMR spectra (500 MHz) for the products of the oxidation reaction of methyl linoleate with hydrogen peroxide catalyzed by HY340-900 at reaction times: (a) zero; (b) 10, (c) 30, (d) 60 and (e) 120 min.
Catalysts 08 00006 g009
Figure 10. HSQC spectrum (500 MHz for the products formed upon the oxidation reaction of methyl linoleate catalyzed by HY340-900/H2O2 at a reaction time of 30 min.
Catalysts 08 00006 g010
Scheme 2. Proposed mechanism for oxidation of methyl linoleate initiated by hydroperoxyl radical.
Catalysts 08 00006 sch002

