Article

1,25-Dihydroxyvitamin D3 (1,25(OH)2D3) Signaling Capacity and the Epithelial-Mesenchymal Transition in Non-Small Cell Lung Cancer (NSCLC): Implications for Use of 1,25(OH)2D3 in NSCLC Treatment

1
Department of Pharmacology and Therapeutics, Roswell Park Cancer Institute, Elm and Carlton Streets, Buffalo, NY 14263, USA
2
Department of Biostatistics and Bioinformatics, Roswell Park Cancer Institute; Elm and Carlton Streets, Buffalo, NY 14263, USA
*
Author to whom correspondence should be addressed.
These authors contributed equally to this work.
Cancers 2013, 5(4), 1504-1521; https://doi.org/10.3390/cancers5041504
Submission received: 5 September 2013 / Revised: 22 October 2013 / Accepted: 31 October 2013 / Published: 8 November 2013
(This article belongs to the Special Issue Vitamin D: Role in Cancer Causation, Progression and Therapy)

Abstract

:
1,25-dihydroxyvitamin D3 (1,25(OH)2D3) exerts anti-proliferative activity by binding to the vitamin D receptor (VDR) and regulating gene expression. We previously reported that non-small cell lung cancer (NSCLC) cells which harbor epidermal growth factor receptor (EGFR) mutations display elevated VDR expression (VDRhigh) and are vitamin D-sensitive. Conversely, those with K-ras mutations are VDRlow and vitamin D-refractory. Because EGFR mutations are found predominately in NSCLC cells with an epithelial phenotype and K-ras mutations are more common in cells with a mesenchymal phenotype, we investigated the relationship between vitamin D signaling capacity and the epithelial mesenchymal transition (EMT). Using NSCLC cell lines and publically available lung cancer cell line microarray data, we identified a relationship between VDR expression, 1,25(OH)2D3 sensitivity, and EMT phenotype. Further, we discovered that 1,25(OH)2D3 induces E-cadherin and decreases EMT-related molecules SNAIL, ZEB1, and vimentin in NSCLC cells. 1,25(OH)2D3-mediated changes in gene expression are associated with a significant decrease in cell migration and maintenance of epithelial morphology. These data indicate that 1,25(OH)2D3 opposes EMT in NSCLC cells. Because EMT is associated with increased migration, invasion, and chemoresistance, our data imply that 1,25(OH)2D3 may prevent lung cancer progression in a molecularly defined subset of NSCLC patients.

1. Introduction

1,25-Dihydroxyvitamin D3 (1,25(OH)2D3), the active metabolite of vitamin D, exerts anti-cancer activities by binding to the vitamin D receptor (VDR) and modulating gene expression [1]. Historically, the anti-tumor activity of 1,25(OH)2D3 has been attributed largely to its ability to suppress cell cycle progression via the induction of cyclin dependent kinase inhibitors p21waf1 and p27kip1 [2,3,4,5,6]. However, more recent studies demonstrate that 1,25(OH)2D3 inhibits a number of additional processes critical to tumor survival and progression including angiogenesis [7,8,9], telomerase activation [10,11], and the epithelial-mesenchymal transition (EMT) [12,13,14,15].
EMT refers to a process in which cells lose expression of genes associated with an epithelial phenotype (such as E-cadherin (CDH1)) and acquire expression of genes associated with a mesenchymal phenotype (such as vimentin (VIM)). Transcription factors belonging to the SNAIL and ZEB families coordinate EMT by repressing CDH1 and other cell junction proteins (reviewed in [16]). EMT-associated changes in gene expression are accompanied by alterations in cell morphology and behavior, such that cells which have undergone EMT acquire an elongated, spindle shape and display increased migration and invasiveness.
In lung cancer models, EMT confers resistance to both radiation and chemotherapy [17,18]. EMT also determines the therapeutic response of NSCLC cells to epidermal growth factor receptor (EGFR) tyrosine kinase inhibitors erlotinib and gefitinib. In 2005 it was discovered that NSCLC cells with wild-type EGFR display a range of sensitivities to erlotinib, and that sensitivity depends on whether the cells express CDH1 or VIM [19]. Consistent with these findings, CDH1 transfection was demonstrated to be sufficient to sensitize NSCLC cells to EGFR tyrosine kinase inhibitors [20]. At the same time, microarray approaches were used to uncover the basis for the differential responsiveness of NSCLC cells to erlotinib. These also resulted in the identification of EMT as a determinant of drug sensitivity and CDH1 protein expression as a biomarker of erlotinib activity in NSCLC patients [21]. EMT also represents an important mechanism by which NSCLC cells and NSCLC patients become resistant to EGFR tyrosine kinase inhibitors during treatment [22].
To more fully characterize EMT in NSCLC and its association with drug response, Byers et al. recently developed and validated a 76-gene EMT signature: This signature predicts the resistance of NSCLC cells to EGFR and PI3K inhibitors and disease control in NSCLC patients receiving erlotinib [23]. Several of the NSCLC cell lines that were used in the derivation of the EMT signature were previously characterized for their sensitivity towards 1,25(OH)2D3 by us [24]. This afforded us the unique opportunity to explore the relationship between vitamin D signaling capacity and the EMT phenotype in NSCLC. Data contained in this report provide initial evidence that the EMT phenotype (as defined by the 76-gene EMT signature) discriminates between NSCLC cells that are sensitive or resistant to the growth inhibitory effects of 1,25(OH)2D3, and that the epithelial phenotype is actively supported by 1,25(OH)2D3. The implications of these findings with regard to the clinical application of vitamin D in the treatment of NSCLC are provided in the Discussion.

2. Results and Discussion

A 76-gene signature which classifies whether a NSCLC cell line has undergone EMT was recently described by Byers et al. [23]. Hierarchical clustering of 54 NSCLC cell lines based on the 76-gene signature resulted in distinct epithelial and mesencyhmal groups. Upon examining the cell lines that fell within each group, we noted a possible association between EMT phenotype and 1,25(OH)2D3 responsiveness (Table 1). Specifically, we observed that cell lines which express relatively high levels of vitamin D receptor (VDR) and respond to 1,25(OH)2D3 treatment (such as HCC827 and H3122 cells) have an epithelial phenotype (Table 1). Conversely, cell lines that express relatively low levels of VDR and are refractory to 1,25(OH)2D3 treatment (such as H23 and A549 cells) possess a mesenchymal phenotype (Table 1). A cell line was considered 1,25(OH)2D3-sensitive if treatment resulted in robust induction of the vitamin D target gene CYP24A1 and/or growth inhibition at 10 nM 1,25(OH)2D3. These observations prompted us to examine in more detail the relationship between VDR expression, vitamin D sensitivity, and the EMT in NSCLC cells.
Table 1. Relationship between Vitamin D Signaling Pathway Integrity and EMT Phenotype in NSCLC. VDR and CYP24A1 mRNA expression were measured in each cell line by qRT-PCR. VDR expression was measured under basal growth conditions. CYP24A1 was measured in cells treated with either vehicle (control) or 10 nM 1,25(OH)2D3 for 8 h. CYP24A1 induction was calculated as follows: Fold-induction = CYP24A1 in 1,25(OH)2D3 treatment group/CYP24A1 in control group. Clonogenic assays were used to measure growth inhibition by 1,25(OH)2D3 (10 nM), as outlined in the Experimental section. * Value was abstracted from previously published work [24,25]. The EMT phenotype was defined by Byers et al based on a 76-gene signature [23]. E (epithelial), M (mesenchymal), ND (not determined).
VDR PhenotypeVDRhighVDRlow
Lung Cancer Cell LineH3122H292HCC827SK-LU-1H23A427A549
Normalized VDR1.00.630.320.490.030.0040.01
Fold-induction CYP24A135049791452271167.21.21.6
% Inhibition by 1,25(OH)2D37073 *82 *30NDND4 *
EMT phenotypeE E M M

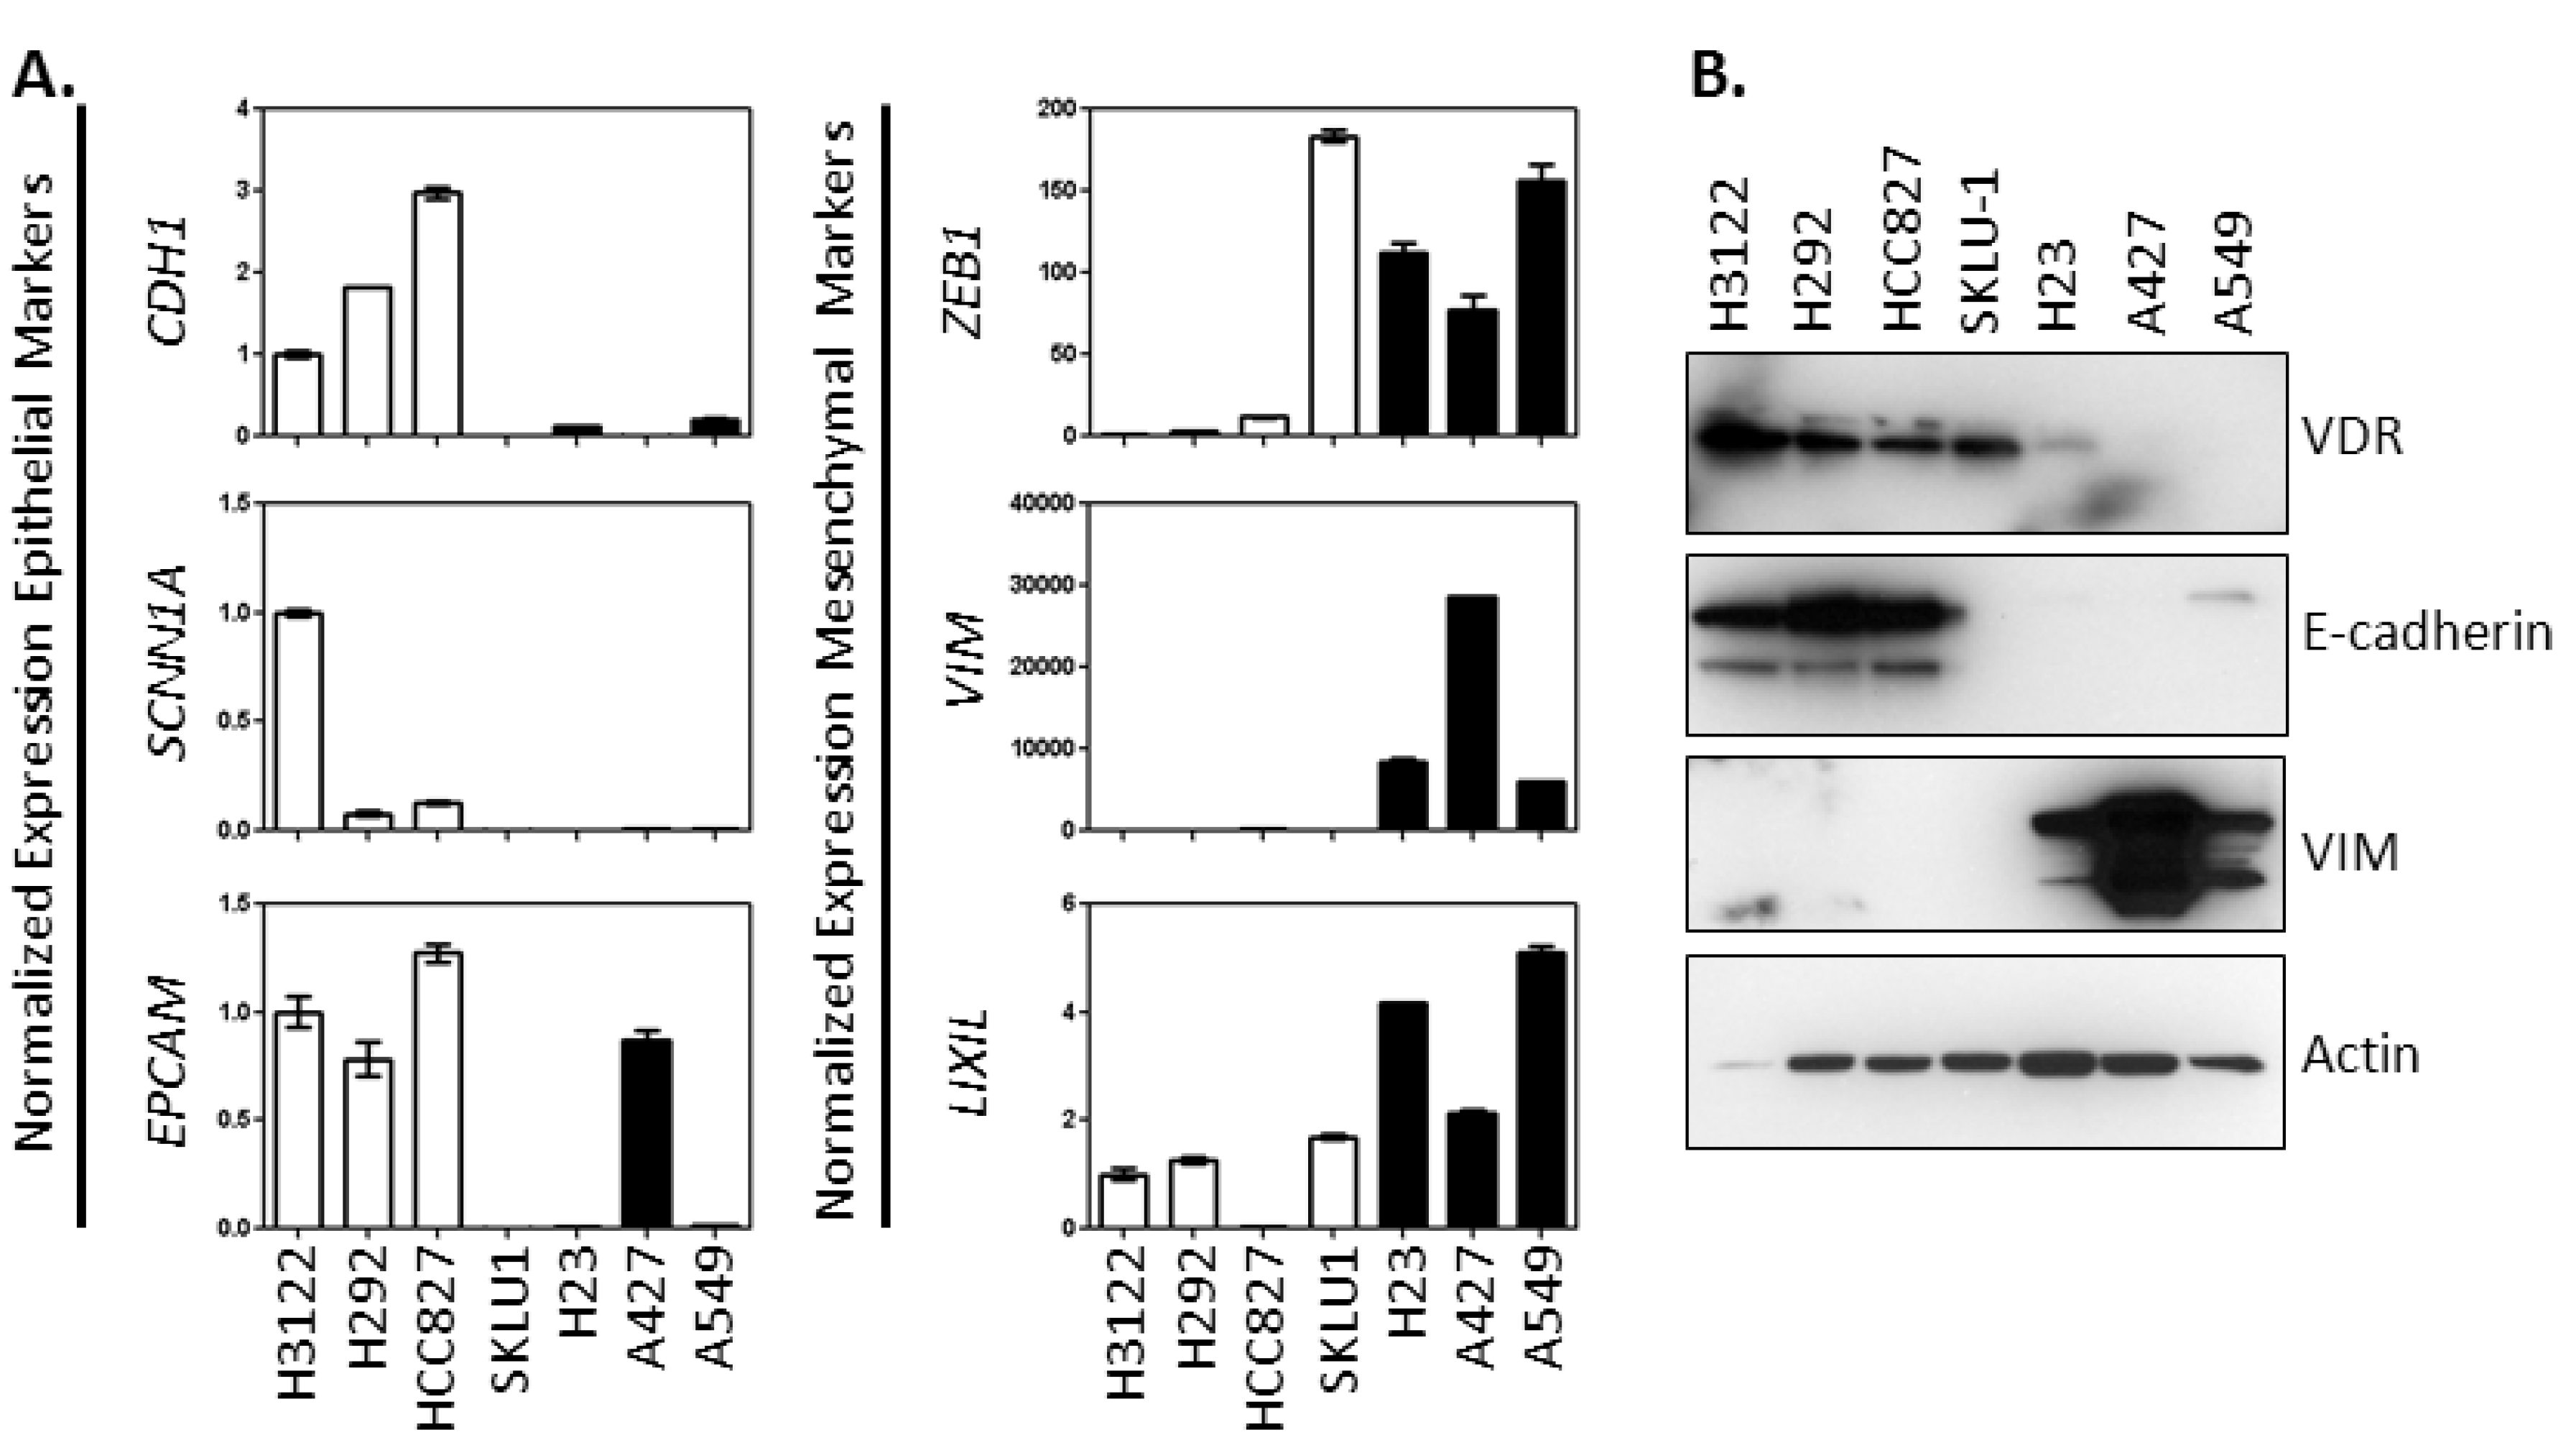
2.1. Characterization of the Association between Vitamin D Signaling Capacity and EMT Phenotype in NSCLC Cells

Based on our initial observations described above, we hypothesized that EMT phenotype distinguishes between cells that express the VDR and are vitamin D-sensitive and those that weakly express VDR and are vitamin D-refractory. To test this, two approaches were taken. First, qRT-PCR was used to measure the expression of epithelial markers (CDH1, SCNN1A, and EPCAM) and mesenchymal markers (ZEB1, VIM, LIX1L) across the full set of NSCLC cell lines for which we had vitamin D sensitivity data (presented in Table 1). Markers of the epithelial phenotype were preferentially expressed in H3122, H292, and HCC827 cells that are VDRhigh and vitamin D responsive (Figure 1). Conversely, markers of the mesenchymal phenotype were preferentially expressed in H23, A427, and A549 cells that express relatively low levels of the VDR and are more refractory to 1,25(OH)2D3 treatment. Using only these six genes, we could not classify SK-LU-1 cells as having a distinct epithelial or mesenchymal phenotype: SK-LU-1 cells had very low expression of all 3 epithelial markers that were tested, but they also lacked expression of VIM, a classical marker of the mesencyhmal phenotype. 1,25(OH)2D3 treatment of SK-LU-1 cells resulted in CYP24A1 induction and growth suppression (Table 1). Interestingly, the magnitude of growth suppression in SK-LU-1 cells is intermediate between cells with a distinct epithelial or mesenchymal gene signature.
To confirm that the RNA-based signatures were reflected in expression of corresponding proteins, whole cell extracts were prepared from each of the cell lines and examined for expression of VDR, E-cadherin, and VIM by immunoblot. H3122, H292 and HCC827 cells that were classified as VDRhigh and epithelial based on their RNA expression profiles displayed high expression of VDR, high expression of E-cadherin, and were VIM negative (Figure 1B). Conversely, H23, A427, and A549 cells that were classified as VDRlow and mesenchymal based on their RNA expression profiles displayed little to no VDR, little to no E-cadherin, and high levels of VIM. Furthermore, as predicted from the RNA data, SK-LU-1 cells expressed VDR but had undetectable levels of either E-cadherin or VIM. These data indicate high concordance between RNA and protein based EMT markers.
In a second approach, we determined the correlation between expression of VDR and genes included in the 76-gene EMT signature of Byers et al. using publically available GEO dataset GSE4824. Probes for only 48 of the EMT signature genes were contained within the array data. Therefore, these 48 genes were surveyed. GSE4824 includes samples from >75 lung cancer cell lines and was used in derivation of the EMT gene signature [23]. The gene most inversely related to VDR was the mesenchymal marker ZEB1, with a correlation coefficient of −0.385. The three genes which showed the strongest positive correlation with VDR were TACSTD2, SH3YL1 and the epithelial marker, CDH1 (correlation coefficients between 0.73–0.77). TACSTD2 and SH3YL1 appear to mark cells with a more epithelial phenotype, as their expression correlates positively with CDH1 and negatively with VIM [23]. The complete ranked gene-by-gene analysis is provided in Table 2. These results are consistent with our cell line experiments and support an association between VDR expression and EMT phenotype in NSCLC cells.
Figure 1. NSCLC cells that are VDRhigh and vitamin D-sensitive preferentially express markers of an epithelial phenotype. The indicated NSCLC cell lines were grown under basal growth conditions until they achieved 50%–70% confluence. (A) RNA was extracted and used to prepare cDNA. One microliter of each cDNA was used in a quantitative PCR assay to measure expression of representative epithelial markers (CDH1, SCNN1A, and EPCAM) and mesencyhmal markers (ZEB1, VIM, and LIX1L). Data are the mean ± SD for triplicate determinations within a single experiment. Data were normalized to that obtained for H3122 cells. H3122 gene expression was arbitrarily assigned a value of 1.0. VDRhigh cells are indicated with white bars. VDRlow cells are indicated with black bars; (B) Protein was extracted 24 h post-seeding of 5 × 10⁶ cells and analyzed by immunoblot for VDR, E-cadherin and VIM. Thirty micrograms of total protein was analyzed per sample.
Cancers 05 01504 g001
Table 2. Correlation between VDR and EMT Signature Genes in lung cancer cell lines. The correlation between expression of VDR (Affymetrix probe 204254_s_at) and individual EMT signature genes in GEO dataset GSE4824 is presented.
Probe IDGene IDCorrelationProbe IDGene IDCorrelation
212764_atZEB1−0.39210715_s_atSPINT20.52
210875_s_atZEB1−0.36219121_s_atRBM35A0.52
201426_s_atVIM0.01205977_s_atEPHA10.52
208510_s_atPPARG0.0337117_atPRR50.54
201069_atMMP20.06205709_s_atCDS10.55
207847_s_atMUC10.10220318_atEPN30.57
202686_s_atAXL0.11210058_atMAPK130.57
218792_s_atBSPRY0.12212070_atGPR560.58
211732_x_atHNMT0.24203453_atSCNN1A0.59
212298_atNRP10.25202525_atPRSS80.59
202454_s_atERBB30.25200606_atDSP0.60
201839_s_atTACSTD10.26205980_s_atPRR50.60
204112_s_atHNMT0.27213285_atTMEM30B0.60
201428_atCLDN40.29219476_atLRRC540.61
205847_atPRSS220.29218856_atTNFRSF210.62
209488_s_atRBPMS0.30202489_s_atFXYD30.62
35148_atTJP30.30203397_s_atGALNT30.63
214702_atFN10.32221610_s_atSTAP20.64
202005_atST140.34219919_s_atSSH30.66
216905_s_atST140.36203780_atMPZL20.67
202790_atCLDN70.38219411_atELMO30.68
204503_atEVPL0.40218677_atS100A140.68
65517_atAP1M20.41203256_atCDH30.69
201506_atTGFBI0.47201650_atKRT190.72
218186_atRAB250.48201131_s_atCDH10.73
218261_atAP1M20.49204019_s_atSH3YL10.74
211719_x_atFN10.50202286_s_atTACSTD20.77

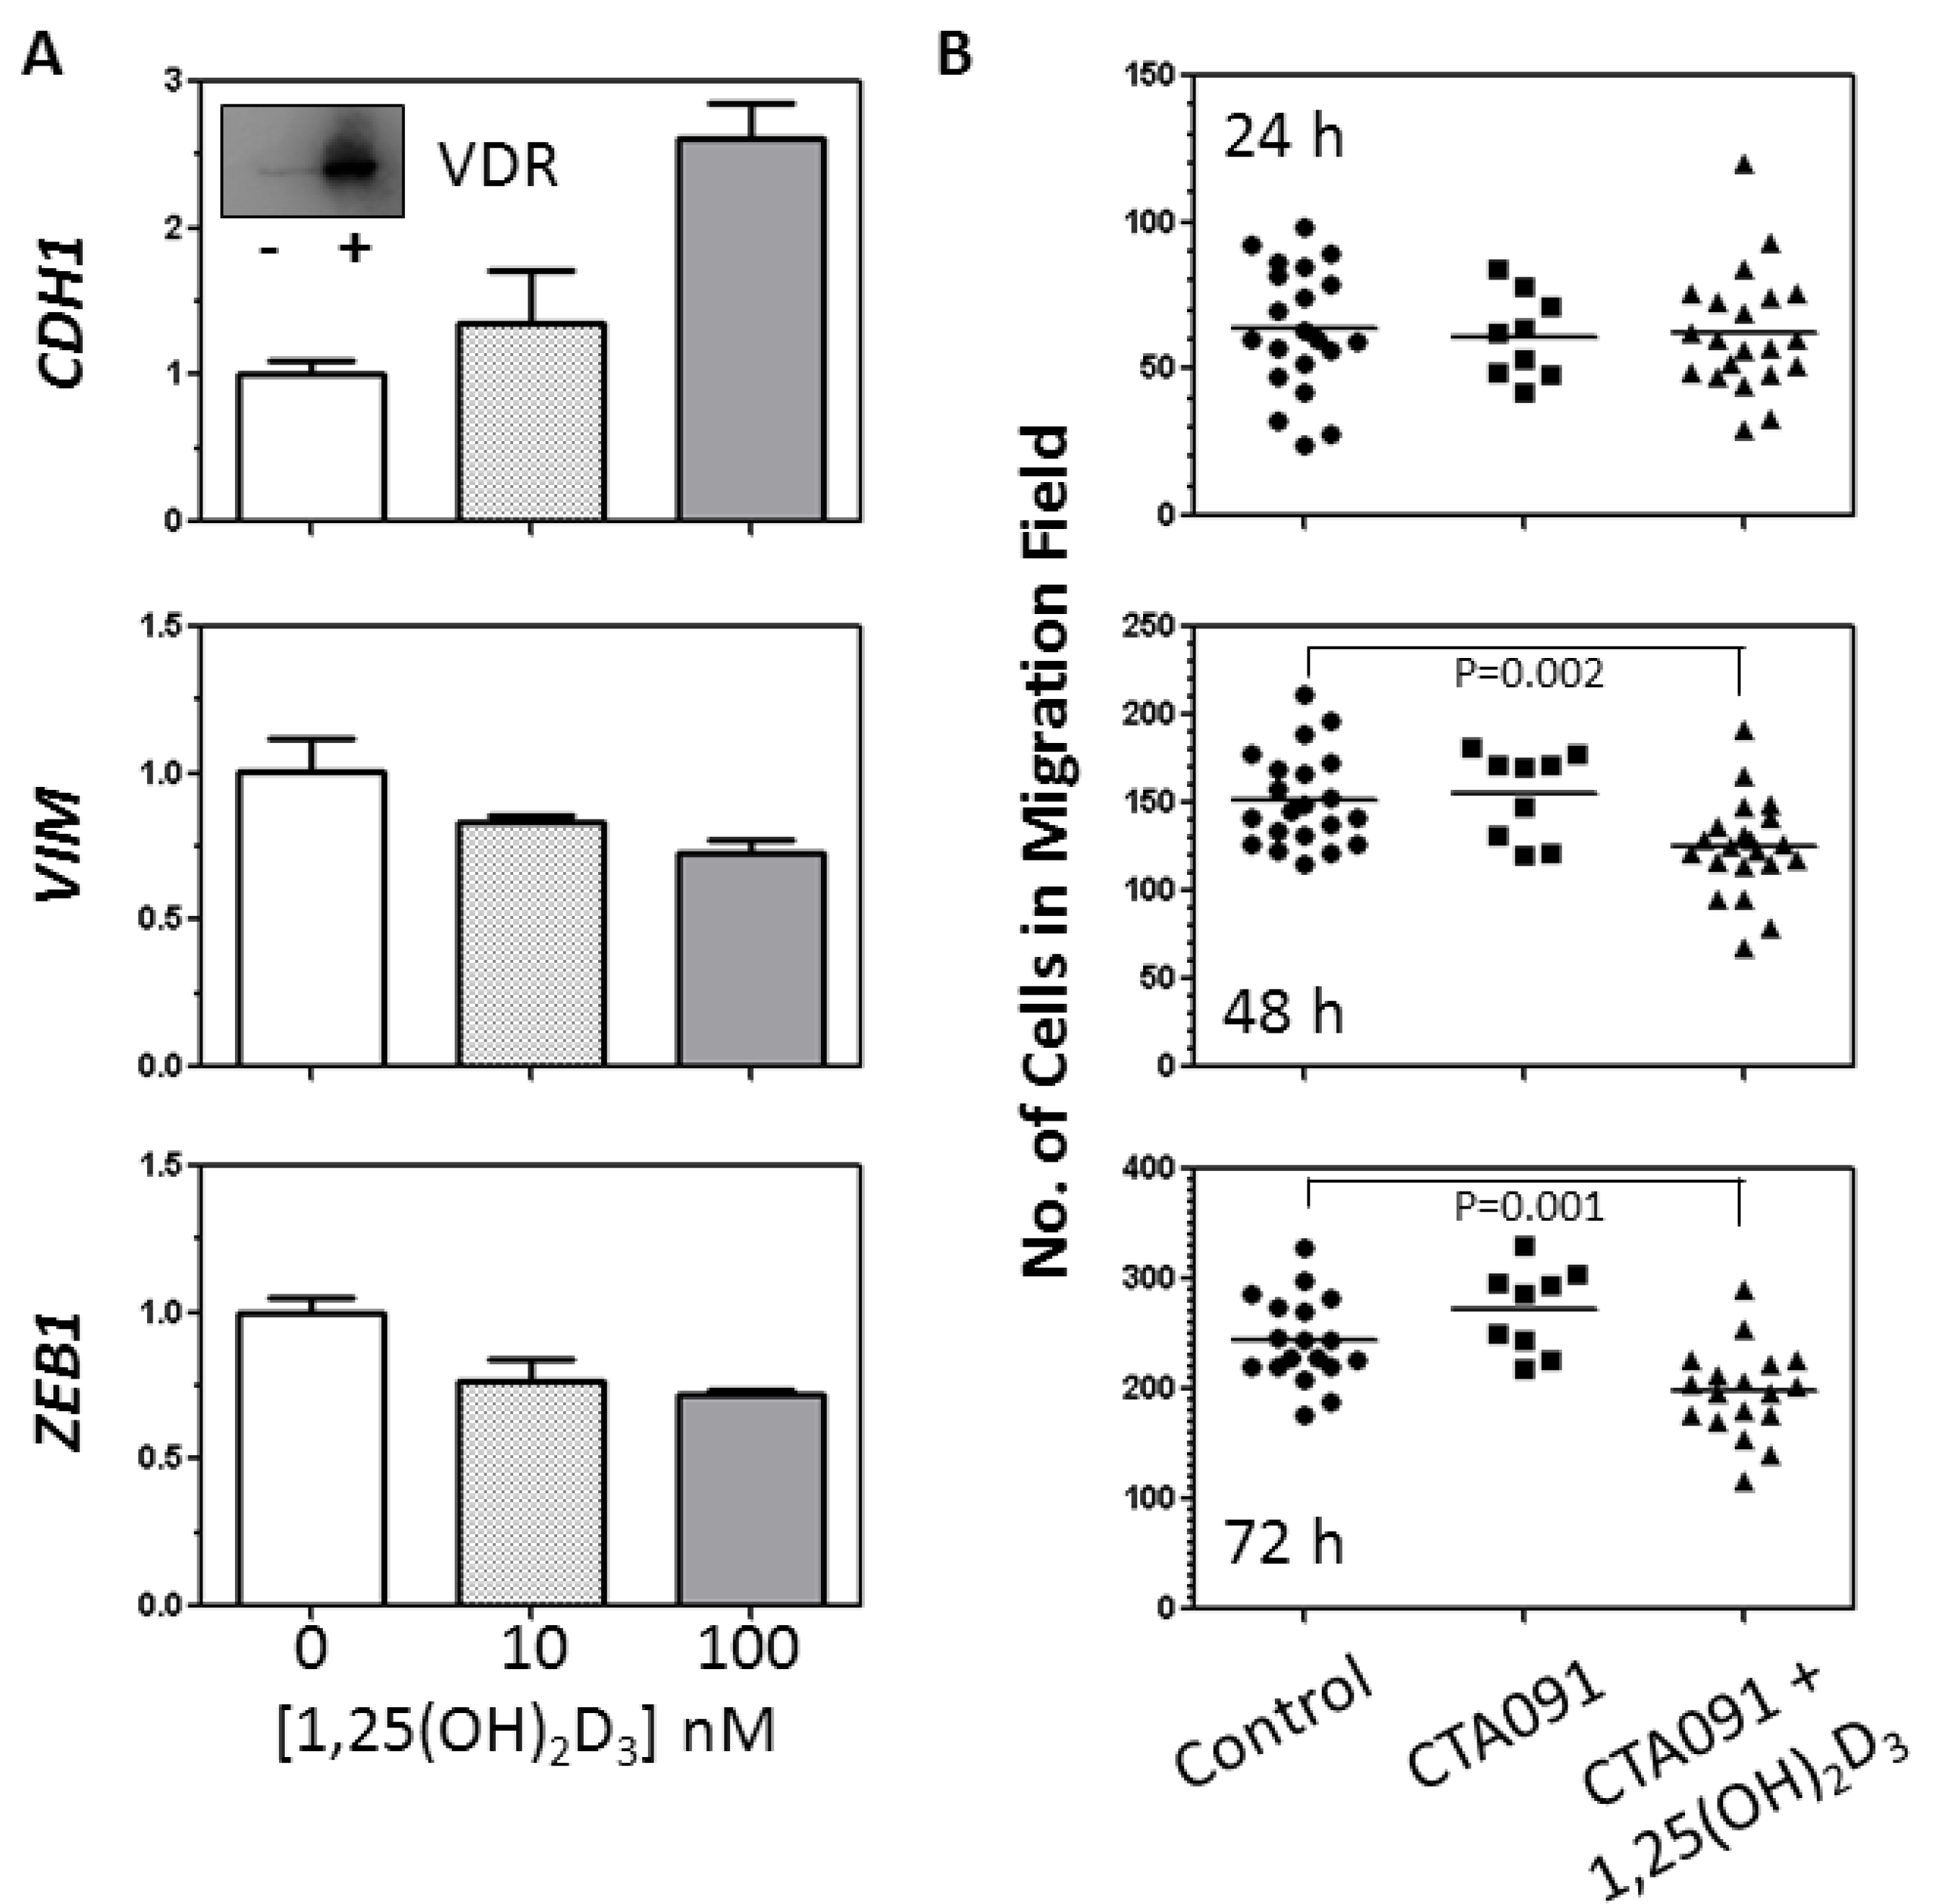
2.2. Analysis of the Effects of 1,25(OH)2D3 on EMT Related Genes and Migration of SK-LU-1 cells

Cumulatively, the above data suggest that NSCLC cells with an epithelial gene signature have higher expression of VDR and greater sensitivity to 1,25(OH)2D3 treatment than cells with a mesenchymal phenotype. VDR/1,25(OH)2D3 signaling has been shown to influence the EMT in rat lung epithelial cells and in breast and colon cancer cells [12,14,26]. Therefore, we next sought to determine whether in NSCLC cells 1,25(OH)2D3 actively supports the epithelial phenotype or is simply correlated with it. To do this, we treated SK-LU-1 cells with vehicle or increasing concentrations of 1,25(OH)2D3. After 96h, RNA was isolated and the expression of CDH1, VIM, and ZEB1 was measured by qRT-PCR. SK-LU-1 cells were used for these studies because they had an intermediate EMT phenotype and retained VDR expression (Figure 2A inset) and so might be susceptible to regulation by 1,25(OH)2D3. Indicative of an active role for 1,25(OH)2D3 in regulation of the EMT in SK-LU-1, treatment resulted in a 2.6-fold increase in CDH1 expression and a modest 30%–50% decrease in expression of both VIM and ZEB1 (Figure 2A).
To ascertain whether such changes in gene expression might have functional relevance, we subsequently evaluated the effect of 1,25(OH)2D3 treatment on the migration of SK-LU-1 cells. SK-LU-1 cells robustly induce expression of the vitamin D catabolizing enzyme CYP24A1 in response to 1,25(OH)2D3 treatment (Table 1). Based on our prior work in NSCLC cells, CYP24A1 induction was expected to result in a time-dependent decline in 1,25(OH)2D3 levels [27]. To avoid the need for periodic replenishment of 1,25(OH)2D3 and minimize disruption of the cell monolayers during the migration assays, the CYP24A1 selective inhibitor, CTA091 was added in combination with 1,25(OH)2D3. CTA091 itself had no effect on cell migration at any of the time points examined (Figure 2B). In contrast, treatment of SK-LU-1 cells with 1,25(OH)2D3 plus CTA091 for 48 h or greater resulted in significant inhibition of cell migration.
Figure 2. 1,25(OH)2D3 supports the acquisition of an epithelial phenotype in SK-LU-1 cells and significantly decreases their migration. (A) SK-LU-1 cells were seeded into 6-well dishes and then treated with vehicle (controls) or 1,25(OH)2D3. Treatments were replaced every two days. After 96 h, RNA was extracted. qRT-PCR was used to measure expression of the epithelial marker CDH1 and the mesenchymal markers VIM and ZEB1. Data are the mean ± SD for triplicate measurements within a single experiment. The expression of each gene was normalized to the level obtained for vehicle treated cells. Similar results were obtained in a second, independent experiment. Inset shows VDR protein expression [20 µg/lane for vehicle treated cells (−) and cells treated with 100 nM 1,25(OH)2D3 (+)]; (B) SK-LU-1 cells were seeded into ibid cell culture inserts as outlined in the Experimental Section. The next day, the inserts were removed, and cells were treated with fresh medium containing vehicle (controls), CTA091 (50 nM), or 100 nM 1,25(OH)2D3 plus CTA091 (50 nM). The number of cells that migrated into the open field at various times post-treatment (h) was determined. Migration was measured at three locations within each well, and the data from 3 independent experiments (1−3 wells/experiment) was pooled. Each data point reflects a separate measurement, and horizontal bars indicate the mean cell number. Data were analyzed for statistical significance using an unpaired t-test.
Cancers 05 01504 g002

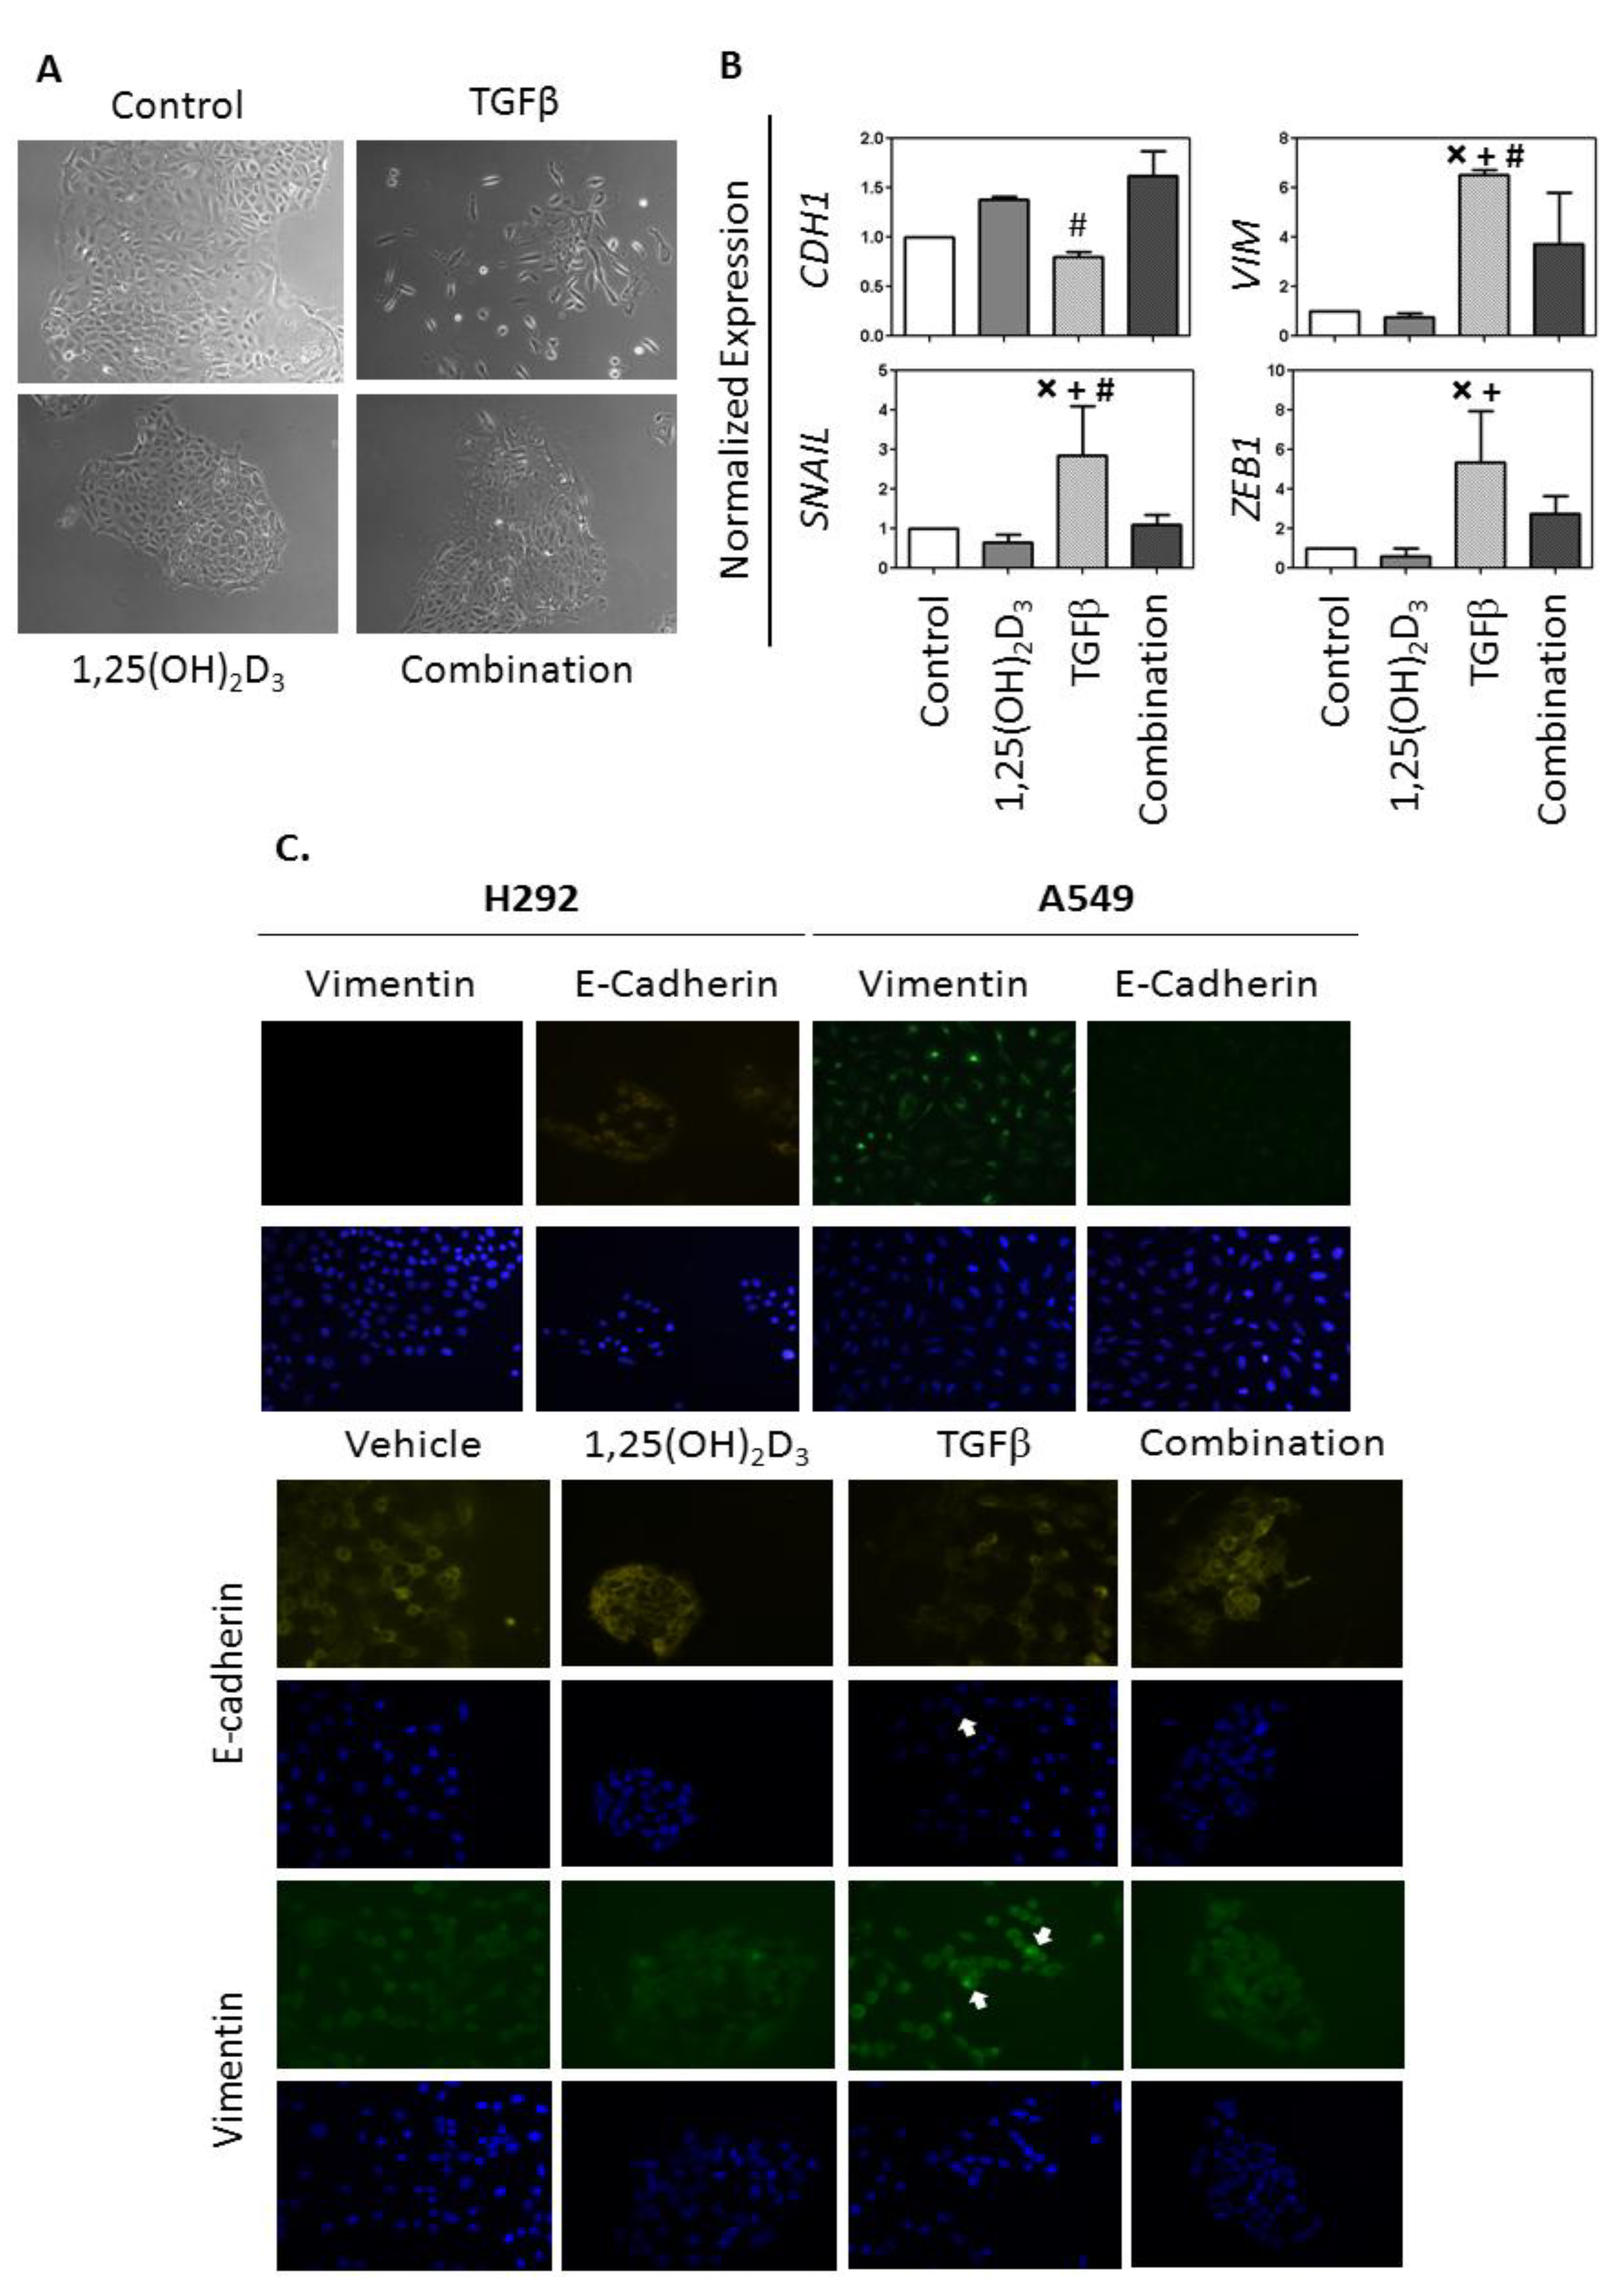
2.3. Analysis of the Effects of 1,25(OH)2D3 on TGFβ Induction of the EMT in VDRhigh NSCLC cells

TGFβ treatment induces EMT in epithelial cells (reviewed in [28]). Therefore, as a further test of the effect of 1,25(OH)2D3 on EMT regulation in NSCLC, the ability of 1,25(OH)2D3 to oppose TGFβ induction of the EMT in HCC827 cells was determined. To do this, HCC827 cells were left untreated (controls) or were treated with 0.125 ng/mL TGFβ, 100 nM 1,25(OH)2D3, or the combination of TGFβ plus 1,25(OH)2D3 for 96 h. The effect of treatment on cell morphology was ascertained by light microscopy (Figure 3A), and the expression of CDH1, VIM, SNAIL, and ZEB1 was quantified by qRT-PCR (Figure 3B). When left untreated, HCC827 cells have a cuboidal shape and form a tight monolayer. In response to TGFβ administration, the cells become spindle shaped and form loose colonies. Cells treated with the combination of TGFβ plus 1,25(OH)2D3 have a morphology more similar to controls.
Figure 3. 1,25(OH)2D3 opposes TGFβ induction of the EMT in HCC827 cells. HCC827 cells were seeded into 6-well plates at a density of 5 × 10³ cells/well. Treatments were initiated 48 h after seeding and were repeated every other day for a total of 4 treatments. The experiment was terminated 4 h after the final treatment. (A) Representative photographs of treated cells; (B) qRT-PCR was used to measure the expression of genes associated with EMT. The expression of each gene was normalized to the level obtained for control cells, which were arbitrarily assigned a value of 1.0. Data represent the mean ± SD for 3 independent experiments. The normalized data were analyzed by ANOVA with a post-hoc Tukey’s multiple comparison test (X, control vs. TGFβ p < 0.05; +,1,25(OH)2D3 vs. TGFβ p < 0.05; #, TGFβ vs. combination p < 0.05). (C) Cells were seeded onto glass slides and treated as outlined in (A). Four h after the final treatment, cells were fixed and stained with PE-conjugated E-cadherin antibodies or Alexa 488-conjugated VIM antibodies. Nuclei were visualized with DAPI. Immunofluorescence controls included untreated H292 (E-cadherin positive, VIM negative) and A549 cells (E-cadherin negative, VIM positive).
Cancers 05 01504 g003
With regard to gene regulation, TGFβ treatment resulted in a significant decrease in CDH1 expression and a significant increase in expression of VIM, SNAIL, and ZEB1 (Figure 3B). Although 1,25(OH)2D3 alone had no significant effects on gene expression, it suppressed the effects of TGFβ in HCC827 cells. Specifically, expression of VIM and SNAIL was significantly decreased in cells treated with 1,25(OH)2D3 plus TGFβ as compared to TGFβ alone (Figure 3B). Although not statistically significant, ZEB1 expression was also 50% lower in cells treated with 1,25(OH)2D3 plus TGFβ as compared to TGFβ alone in each of three independent experiments (Figure 3B). A similar suppressive effect of 1,25(OH)2D3 on TGFβ induction of EMT was observed when the TGFβ concentration was increased to 1 µg/mL (data not shown).
To determine whether changes in RNA expression resulted in corresponding changes in protein expression, HCC827 cells were treated and then analyzed for expression of E-cadherin and VIM by immunofluorescence. Untreated H292 (E-cadherin positive, VIM negative) and A549 cells (E-cadherin low, VIM positive) were included as staining controls. Consistent with the RNA-based data, TGFβ treatment resulted in a decrease in E-cadherin expression in at least some cells (unstained cells indicated with white arrow in Figure 3C) and bright focal expression of VIM (example shown with white arrows in Figure 3C). These same bright foci were observed following VIM staining of control A549 cells but not H292 cells, indicating they are VIM specific. Conversely, 1,25(OH)2D3-treated cells displayed bright E-cadherin staining at the plasma membrane and close connectivity between cells. Cells treated with the combination of 1,25(OH)2D3 plus TGFβ had a staining pattern that was generally consistent with 1,25(OH)2D3 alone: both E-cadherin positive cell clusters and an absence of VIM bright foci were noted. We conclude from these morphological observations, gene expression profiles, and immunofluorescence data that the ability of TGFβ to induce an EMT in HCC827 cells is attenuated in the presence of 1,25(OH)2D3.

2.4. Discussion

Recently, a 76-gene signature was defined which distinguishes NSCLC cells based on their EMT phenotype and predicts resistance of NSCLCs to EGFR and PI3K inhibitors [23]. We build upon these findings and show that EMT phenotype (as predicted by the 76-gene EMT signature) also appears to predict resistance to vitamin D. We demonstrate that NSCLC cells which are characterized as epithelial based on the EMT signature express VDR and are sensitive to 1,25(OH)2D3 treatment. Conversely, NSCLC cells that are defined as having a mesechymal phenotype are relatively VDR-deficient and 1,25(OH)2D3-refractory. The association between vitamin D signaling capacity and EMT status led us to investigate whether vitamin D regulates the EMT in NSCLC or is simply correlated with it. We observe that the active metabolite of vitamin D, 1,25(OH)2D3, increases expression of the epithelial marker CDH1 and decreases expression of the mesenchymal marker VIM in SK-LU-1 cells, where it also decreases cell migration. In HCC827 cells, 1,25(OH)2D3 opposes the ability of TGFβ to induce EMT-associated changes in cell morphology and gene expression. Cumulatively, these results support an active role for 1,25(OH)2D3 in control of the EMT in NSCLC. Our findings are consistent with prior studies showing a suppressive effect of 1,25(OH)2D3 on EMT in lung epithelial cells and breast and colon cancer cells [12,14,26].

2.4.1. VDR Expression Is Associated with an Epithelial Phenotype and 1,25(OH)2D3 Sensitivity in NSCLC Cells

Based on the observation that VDR expression and vitamin D sensitivity are higher in NSCLC cells that express epithelial markers (CDH1, SCNN1A, EPCAM) than cells that express mesenchymal markers (VIM, ZEB1, LIX1L), we conclude that a relationship exists between EMT phenotype and 1,25(OH)2D3 sensitivity in NSCLC (Figure 1, Table 1). One limitation in arriving at this conclusion is that we characterized the relationship between EMT phenotype and 1,25(OH)2D3 sensitivity in a relatively small number of cell lines using only a subset of genes derived from the EMT signature. To circumvent this limitation, we examined the relationship between VDR and 48 genes derived from the 76 gene EMT signature using a publically available dataset containing gene expression profiles from >75 lung cancer cell lines. Using this approach, we uncovered a positive association between VDR and CDH1 and a negative association between VDR and ZEB1. We believe that the results of this microarray analysis support our laboratory observations and increase the likelihood that our findings regarding EMT phenotype and 1,25(OH)2D3 sensitivity are relevant and can be generalized. We know from prior work by us and others that VDR expression predicts the response of NSCLC cells to 1,25(OH)2D3 treatment [24,29,30]. Thus, one implication of our current work is that an EMT signature may be useful in identifying the subset of NSCLC patients with VDRhigh/vitamin D responsive tumors.

2.4.2. 1,25(OH)2D3 Opposes EMT Induction in NSCLC Cells

In HCC827 cells, TGFβ induces expression of SNAIL and ZEB1, master transcriptional regulators of the EMT. When TGFβ is combined with 1,25(OH)2D3, its ability to increase SNAIL and ZEB1 expression is reduced. These data lead us to conclude that 1,25(OH)2D3 signaling opposes EMT induction by TGFβ. 1,25(OH)2D3 also down-regulates expression of SNAIL and ZEB1 and opposes EMT induction in colon cancer cells [12,13]. The mechanistic details of the vitamin D/EMT regulatory circuit in colon cancer cells have been defined: 1,25(OH)2D3 increases expression of the histone demethylase KDM6B/JMJD3 [12]. In turn, JMJD3 controls expression of miR-200b and miR-200c, which target ZEB1 for degradation [13]. We are currently investigating the contribution of this mechanism towards vitamin D control of the EMT in NSCLC cells.

2.4.3. EMT Signature may Identify NSCLC Patients that Benefit from 1,25(OH)2D3 Treatment

The finding of a relationship between vitamin D signaling capacity and EMT phenotype has important implications for lung cancer treatment and progression. Improvements in the treatment of advanced NSCLC have arisen from the molecular phenotyping of tumor cells and application of appropriate molecularly targeted therapies. For example, response to the EGFR tyrosine kinase inhibitor, erlotinib, is approximately 10% in an unselected population of patients with advanced NSCLC, but it is nearly 70% in those individuals whose lung tumors harbor activating mutations in EGFR (reviewed in [31]). To date, no gene signature has been available to identify a population of NSCLC patients that may benefit from 1,25(OH)2D3 supplementation. Based on our novel finding that a relationship exists between vitamin D sensitivity and EMT phenotype, we hypothesize that an EMT signature such as the one described by Byers et al. may prove to be clinically useful in identifying a responsive patient subset. Furthermore, our data lead us to predict that vitamin D supplementation will be effective selectively in NSCLC patients whose tumors are identified as being epithelial based on the EMT signature.
With regard to the identification of molecularly-defined lung cancer subsets that respond preferentially to vitamin D, we previously reported that NSCLC cells with activating EGFR mutations expressed high levels of VDR and were 1,25(OH)2D3 sensitive whereas NSCLC cells with oncogenic K-ras mutations were VDR-deficient and 1,25(OH)2D3-refractory [24]. When the 76-gene EMT signature was applied to 54 NSCLC cell lines, Byers et al. observed that all nine EGFR mutant cell lines included in their study had an epithelial phenotype. Conversely, K-ras mutations were more common in cell lines with a mesenchymal phenotype [23]. Thus, our results regarding the relationship between (a) oncogene mutations and vitamin D signaling capacity and (b) EMT status and vitamin D signaling capacity are concordant. In light of our new data, we speculate that the basis for the prior association we noted between oncogenic mutations and vitamin D sensitivity may not have resulted from a specific effect of the mutations on vitamin D signaling capacity per se. Rather, these mutations may drive the NSCLC cells into a particular biological state (EGFR mutation/epithelial state or K-ras mutation/mesenchymal state) in which vitamin D responsiveness is altered. The precise mechanism by which vitamin D signaling becomes silenced as lung cancer cells acquire a mesenchymal phenotype remains to be determined. One possibility is that the EMT transcriptional regulator SNAIL binds to the VDR promoter and represses its transcription [32].

3. Experimental

3.1. Cell Culture

HCC827, H23, A427, SK-LU-1, H3122, H292 and A549 cells were purchased from the American Type Culture Collection (ATCC, Manassas, VA, USA). A549 cells were cultured in BME medium supplemented with 2 mM glutamine (Life Technologies, Grand Island, NY, USA). HCC827, H23, H3122, and H292 cells were cultured in RPMI 1640 containing 2 mM glutamine (Corning, Tewksbury, MA, USA). H292 cells received additional supplementation with 1mM sodium pyruvate and 10 mM HEPES buffer. SK-LU-1 and A427 cells were cultured in EMEM containing 2 mM glutamine (ATCC). Unless otherwise specified, all media preparations contained 10% fetal bovine serum (FBS, Tissue Culture Biologicals, Tulare, CA, USA) and 100 U/mL penicillin-streptomycin. Cells were incubated at 37 °C with 5% CO2. All cells were periodically tested for mycoplasma and consistently found to be negative. No cells were used for experimental studies beyond 25 passages in our laboratory.

3.2. Reagents and Chemicals

The vitamin D metabolite, 1,25(OH)2D3, was generously provided as a 480 μM stock in absolute ethanol by Dr. Candace Johnson (Roswell Park Cancer Institute, Buffalo, NY, USA). Immediately prior to use, the stock was diluted to a final concentration of 10 or 100 nM in fresh tissue culture medium. Recombinant human TGFβ1 (R&D Systems, Inc. Minneapolis, MN, USA) was prepared as a stock of 20 ng/µL in 4 mM HCl containing 0.5% BSA. Immediately prior to use, it was diluted in fresh tissue culture media to a final concentration of 0.125 ng/mL. For studies involving TGFβ1, the treatments were replenished every two days. CTA091 was kindly provided by Cytochroma, Inc (Markham, ON, Canada). It was diluted and handled as described previously [24].

3.3. RNA Isolation

For EMT studies, cells were seeded in six well plates at a density of 5 × 10³ cells per well and were treated with either vehicle control, 1,25(OH)2D3, 0.125 ng/mL TGFβ1, or the combination of TGFβ1 and 1,25(OH)2D3. Treatments were replenished every two days for a total of four treatments. Four hours following the last treatment, cells were collected in TRI-reagent (Direct-Zol RNA Mini-Prep Kit, Zymo Research, Irvine, CA, USA) to initiate RNA extraction. RNA isolation was carried out per manufacturer’s instructions. RNA concentrations were read using a NanoDrop. All RNA had a 260/280 ratio of at least 2. Eluted RNA was stored at −80 °C until further use.

3.4. cDNA Synthesis

500 ng of RNA was converted to cDNA using a High Capacity cDNA Reverse Transcription Kit, which included an RNase inhibitor (Applied Biosystems, Foster City, CA, USA). A 20 μL reaction was prepared, and cDNA synthesis was carried out following the manufacturer’s instructions.

3.5. Real-Time PCR

Real-time PCR reactions were prepared using the Maxima SYBR green/ROX qPCR Master Mix (Thermo Scientific, Pittsburgh, PA, USA) and run on a 7300 Real Time PCR System (Applied Biosystems). A volume of 1 μL of cDNA was added per reaction. The reactions were run at 50 °C for 2 min, 95 °C for 10 min, and then subjected to 40 cycles of 95 °C for 20 s, 56 °C for 25 s and 72 °C for 27 s. Data was collected during the 72 °C extension step. Relative gene expression was calculated using the 2−ΔΔCt method. All primers were purchased from Integrated DNA Technologies. Primer sequences are as follows (F: forward; R: reverse) in Table 3.
Table 3. Primer Sequences.
Geneprimer
VIMF: 5'-TGCCCTTAAAGGAACCAATGAGTC-3'
R: 5'-ATTCACGAAGGTGACGAGCCAT-3'
ZEB1F: 5'-TCCAGCCAAATGGAAATCAGGATG-3'
R: 5'-CAGATTCCACACTCATGAGGTCTT-3'
SNAILF: 5'-TAGCGAGTGGTTCTTCTGCG-3'
R: 5'-CTGCTGGAAGGTAAACTCTGGA-3'
CDH1F: 5'-TGGACCGAGAGAGTTTCCCT-3'
R: 5'-ACGACGTTAGCCTCGTTCTC-3'
GAPDHF: 5'-CTCCTCTGACTTCAACAGCG-3'
R: 5'-GCCAAATTCGTTGTCATACCAG-3'
VDRF: 5'-ATAAGACCTACGACCCCACCTA-3'
R: 5'-GGACGAGTCCATCATGTCTGAA-3'
CYP24A1F: 5'-GCACAAGAGCCTCAACACCAA-3'
R: 5'-AGACTGTTTGCTGTCGTTTCCA-3'
SCNN1AF: 5'-GTCTCCCTCTGTCACGATGGTCA-3'
R: 5'-ACCAGTATCGGCTTCGGAACCT-3'
EPCAMF: 5'-GAGCGAGTGAGAACCTACTGG-3'
R: 5'-ACGCGTTGTGATCTCCTTCT-3'
LIX1LF: 5'-GCTTTGGGAGTTTCCAGTTTTGCC-3'
R: 5'-CCCTGTATTTGGGTTGTCAGCTTC-3'

3.6. Clonogenic Assay

Cells were seeded in triplicate wells in complete growth medium at a density optimized for each cell line. Cells were treated with either vehicle control or 1,25(OH)2D3 every two days for 10 days. At the time of harvest, colonies were fixed by adding 2 mL of 70% methanol per well for 5 min. This step was repeated, and the colonies were then stained using 2 mL of 0.1% crystal violet for 5 min. Wells were rinsed with water and dried for 24 h prior to quantitation. Colonies were inspected microscopically, and a colony was defined as a cluster of at least 30 cells. To calculate the percent colonies remaining, the following equation was used: % colonies remaining = 100 × [number colonies for treatment group/average number colonies for control group].

3.7. Migration Assay

SK-LU-1 cells were trypsinized and resuspended in complete tissue culture medium to a concentration of 2 × 10⁵ cells/mL. One cell culture migration insert (ibidi, Verona, WI, USA) was placed into one well of a six-well plate. A volume of 70 μL of the cell suspension was placed into each side of the insert. The next day, the inserts were removed, and 2 mL of treatment medium was added. Treatments included vehicle control, 1,25(OH)2D3, CTA091 or the combination of 1,25(OH)2D3 plus CTA091. Pictures were taken each day from the time the inserts were removed until study termination using a Leica DMIL microscope equipped with a Leica ICC50 HD camera. Three images were taken per culture insert in the left, middle, and right viewing fields and were quantified by counting the number of cells that migrated into the open field. Each image was treated as a separate measurement.

3.8. Preparation of Whole Cell Extracts and Immunoblotting

Protein extraction and immunoblotting was done as described by us previously [24]. The following primary antibodies were used: mouse anti-human E-cadherin, clone 36 (BD Transduction Laboratories, San Jose, CA, USA); mouse anti-human Vimentin, clone RV202 (BD Pharmingen, San Diego, CA, USA); rat anti-VDR, clone 9A7 (Thermo Scientific, Rockford, IL, USA), and rabbit anti-actin (sc-1616-R, Santa Cruz Biotechnology, Dallas, TX, USA). Antibodies against E-cadherin, Vimentin, and VDR were used at a dilution of 1:1,000. Anti-actin antibody was used at a dilution of 1:2,000.

3.9. Immunofluorescence

Cells were seeded onto sterile coverslips at a density of 5 × 10³/well. The next day, cells were treated with vehicle, TGFβ, 100 nM 1,25(OH)2D3, or the combination of TGFβ plus 1,25(OH)2D3. Treatments were replenished every 48 h, for a total of 96 h. Four h after the final treatment, cells were washed two times with PBS at 37 °C (5 min per wash). Cells were fixed with a solution of 4% formaldehyde in PBS for 30 min at room temperature. The formaldehyde was removed, and cells were washed with PBS (as above). Fixed cells were permeabilized with 0.5% Triton-X100 solution made in PBS for 15 min and then washed three times (5 min per wash). Blocking was performed by adding a 1% w/v BSA solution (Bovine albumin, Sigma Aldrich, St. Louis, MO, USA) made in PBS. PE-conjugated anti-E-cadherin antibody (clone 36, BD Pharmingen) or Alexa Fluor 488-conjugated anti-VIM antibody (clone RV202, BD Pharmingen) were diluted in 1% BSA and exposed to the cells overnight. The next day, the cells were washed, stained with DAPI, and mounted to microscope slides (Molecular Probes, Invitrogen, Grand Island, NY, USA). Images were taken using QCapture software.

3.10. Microarray Analysis

Gene expression profiles of NSCLC cells along with their annotation were downloaded from NCBI’s Gene Expression Omnibus repository (GSE4824) [33]. The Epithelial-Mesenchymal Transition (EMT) gene signature was obtained from [1]. The expression values of the VDR gene (probe 204254_s_at) and the EMT signature genes were extracted and the correlation between VDR and each of the EMT signature genes was calculated and ranked. The analysis was performed using the statistical computational environment R Version 2.15.2 [34].
GSE4824 contains 164 samples, with 6 samples profiled by the Affymetrix Plus2.0 platform, 79 samples profiled by the Affymetrix U133A platform, and 79 samples profiled by the Affymetrix U133B platform. Since there are no VDR probes in the U133B platform, the 79 samples profiled by the Affymetrix U133B platform were discarded. The EMT gene signature contains 96 Affymetrix probes for 76 genes. Because 42 probes were not in the U133A platform, we discarded them from the analysis. Hence, our final analysis included 54 probes (from 48 unique genes) which are available in both the Affymetrix Plus2.0 and U133A platforms.

4. Conclusions

Studies presented in this manuscript provide evidence that (A) a relationship exists between EMT phenotype and vitamin D sensitivity in NSCLC and that (B) 1,25(OH)2D3 actively suppresses EMT in at least some NSCLC cells. These results have two important clinical implications. First, as noted above, our work suggests that an EMT signature may be useful in identifying the subset of NSCLC patients with VDRhigh/vitamin D responsive tumors. In lung cancer, the EMT is associated with increased tumor cell proliferation, invasion, migration, metastasis, and chemotherapy resistance [17,18,35,36]. Thus, the second implication of our work is that by suppressing EMT, 1,25(OH)2D3 may prevent or reduce the onset of metastatic disease, may enhance response to chemotherapy, or may delay the development of resistance to conventional chemotherapy and molecularly targeted agents. The effect on EMT, combined with the documented ability of 1,25(OH)2D3 to directly suppress the growth of NSCLC cells via cell cycle inhibition [25,29], provides a reasonable explanation for the observed favorable association between vitamin D status and better outcomes in NSCLC [37,38].

Acknowledgments

Portions of this work were supported by the Roswell Park Alliance Foundation, National Cancer Institute grants R01 CA132844, P50 CA090440, and T32 CA009072. The authors wish to thank Tatiana Shaurova for her assistance with clonogenic assays.

Conflicts of Interest

The authors declare no conflict of interest.

References

  1. Deeb, K.K.; Trump, D.L.; Johnson, C.S. Vitamin D signalling pathways in cancer: Potential for anticancer therapeutics. Nat. Rev. Cancer 2007, 7, 684–700. [Google Scholar] [CrossRef]
  2. Schwaller, J.; Koeffler, H.P.; Niklaus, G.; Loetscher, P.; Nagel, S.; Fey, M.F.; Tobler, A. Posttranscriptional stabilization underlies p53-independent induction of p21waf1/cip1/sdi1 in differentiating human leukemic cells. J. Clin. Invest. 1995, 95, 973–979. [Google Scholar] [CrossRef]
  3. Liu, M.; Lee, M.-H.; Cohen, M.; Bommakanti, M.; Freedman, L.P. Transcriptional activation of the Cdk inhibitor p21 by Vitamin D3 leads to the induced differentiation of the myelomonocytic cell line U937. Genes Dev. 1996, 10, 142–153. [Google Scholar] [CrossRef]
  4. Verlinden, L.; Verstuyf, A.; Convents, R.; Marcelis, S.; van Camp, M.; Bouillon, R. Action of 1,25(OH)2D3 on the cell cycle genes, cyclin D1, p21, and p27 in MCF-7 cells. Mol. Cell. Endocrinol. 1998, 142, 57–65. [Google Scholar] [CrossRef]
  5. Hager, G.; Formanek, M.; Gedlicka, C.; Thurnher, D.; Knerer, B.; Kornfehl, J. 1,25(OH)2 Vitamin D3 induces elevated expression of the cell cycle regulating genes p21 and p27 in squamous carcinoma cell lines of the head and neck. Acta Otolaryngol. 2001, 121, 102–109. [Google Scholar]
  6. Saramaki, A.; Banwell, C.M.; Campbell, M.J.; Carlberg, C. Regulation of the human p21(waf1/cip1) gene promoter via multiple binding sites for p53 and the Vitamin D3 receptor. Nucleic Acids Res. 2006, 34, 543–554. [Google Scholar] [CrossRef]
  7. Bernardi, R.J.; Johnson, C.S.; Modzelewski, R.A.; Trump, D.L. Antiproliferative effects of 1α,25-dihydroxyvitamin D3 and vitamin D analogs on tumor-derived endothelial cells. Endocrinology 2002, 143, 2508–2514. [Google Scholar] [CrossRef]
  8. Pendas-Franco, N.; Garcia, J.M.; Pena, C.; Valle, N.; Palmer, H.G.; Heinaniemi, M.; Carlberg, C.; Jimenez, B.; Bonilla, F.; Munoz, A.; et al. Dickkopf-4 is induced by tcf/beta-catenin and upregulated in human colon cancer, promotes tumour cell invasion and angiogenesis and is repressed by 1alpha,25-dihydroxyvitamin D3. Oncogene 2008, 27, 4467–4477. [Google Scholar] [CrossRef]
  9. Chung, I.; Han, G.; Seshadri, M.; Gillard, B.M.; Yu, W.D.; Foster, B.A.; Trump, D.L.; Johnson, C.S. Role of vitamin D receptor in the antiproliferative effects of calcitriol in tumor-derived endothelial cells and tumor angiogenesis in vivo. Cancer Res. 2009, 69, 967–975. [Google Scholar] [CrossRef]
  10. Ikeda, N.; Uemura, H.; Ishiguro, H.; Hori, M.; Hosaka, M.; Kyo, S.; Miyamoto, K.; Takeda, E.; Kubota, Y. Combination treatment with 1alpha,25-dihydroxyvitamin D3 and 9-cis-retinoic acid directly inhibits human telomerase reverse transcriptase transcription in prostate cancer cells. Mol. Cancer Ther. 2003, 2, 739–746. [Google Scholar]
  11. Kasiappan, R.; Shen, Z.; Tse, A.K.; Jinwal, U.; Tang, J.; Lungchukiet, P.; Sun, Y.; Kruk, P.; Nicosia, S.V.; Zhang, X.; et al. 1,25-dihydroxyvitamin D3 suppresses telomerase expression and human cancer growth through microrna-498. J. Biol. Chem. 2012, 287, 41297–41309. [Google Scholar] [CrossRef]
  12. Pereira, F.; Barbachano, A.; Silva, J.; Bonilla, F.; Campbell, M.J.; Munoz, A.; Larriba, M.J. Kdm6b/jmjd3 histone demethylase is induced by vitamin D and modulates its effects in colon cancer cells. Hum. Mol. Genet. 2011, 20, 4655–4665. [Google Scholar] [CrossRef]
  13. Pereira, F.; Barbachano, A.; Singh, P.K.; Campbell, M.J.; Munoz, A.; Larriba, M.J. Vitamin D has wide regulatory effects on histone demethylase genes. Cell Cycle 2012, 11, 1081–1089. [Google Scholar] [CrossRef] [Green Version]
  14. Pervin, S.; Hewison, M.; Braga, M.; Tran, L.; Chun, R.; Karam, A.; Chaudhuri, G.; Norris, K.; Singh, R. Down-regulation of vitamin D receptor in mammospheres: Implications for vitamin D resistance in breast cancer and potential for combination therapy. PLoS One 2013, 8, e53287. [Google Scholar] [CrossRef]
  15. Ma, Y.; Yu, W.D.; Su, B.; Seshadri, M.; Luo, W.; Trump, D.L.; Johnson, C.S. Regulation of motility, invasion, and metastatic potential of squamous cell carcinoma by 1alpha,25-dihydroxycholecalciferol. Cancer 2013, 119, 563–574. [Google Scholar] [CrossRef]
  16. De Craene, B.; Berx, G. Regulatory networks defining EMT during cancer initiation and progression. Nat. Rev. Cancer 2013, 13, 97–110. [Google Scholar] [CrossRef]
  17. Ren, J.; Chen, Y.; Song, H.; Chen, L.; Wang, R. Inhibition of zeb1 reverses EMT and chemoresistance in docetaxel-resistant human lung adenocarcinoma cell line. J. Cell. Biochem. 2013, 114, 1395–1403. [Google Scholar] [CrossRef]
  18. Gomez-Casal, R.; Bhattacharya, C.; Ganesh, N.; Bailey, L.; Basse, P.; Gibson, M.; Epperly, M.; Levina, V. Non-small cell lung cancer cells survived ionizing radiation treatment display cancer stem cell and epithelial-mesenchymal transition phenotypes. Mol. Cancer 2013, 12. [Google Scholar] [CrossRef]
  19. Thomson, S.; Buck, E.; Petti, F.; Griffin, G.; Brown, E.; Ramnarine, N.; Iwata, K.K.; Gibson, N.; Haley, J.D. Epithelial to mesenchymal transition is a determinant of sensitivity of non-small-cell lung carcinoma cell lines and xenografts to epidermal growth factor receptor inhibition. Cancer Res. 2005, 65, 9455–9462. [Google Scholar] [CrossRef]
  20. Witta, S.E.; Gemmill, R.M.; Hirsch, F.R.; Coldren, C.D.; Hedman, K.; Ravdel, L.; Helfrich, B.; Dziadziuszko, R.; Chan, D.C.; Sugita, M.; et al. Restoring E-cadherin expression increases sensitivity to epidermal growth factor receptor inhibitors in lung cancer cell lines. Cancer Res. 2006, 66, 944–950. [Google Scholar] [CrossRef]
  21. Yauch, R.L.; Januario, T.; Eberhard, D.A.; Cavet, G.; Zhu, W.; Fu, L.; Pham, T.Q.; Soriano, R.; Stinson, J.; Seshagiri, S.; et al. Epithelial versus mesenchymal phenotype determines in vitro sensitivity and predicts clinical activity of erlotinib in lung cancer patients. Clin. Cancer Res. 2005, 11, 8686–8698. [Google Scholar] [CrossRef]
  22. Zhang, Z.; Lee, J.C.; Lin, L.; Olivas, V.; Au, V.; LaFramboise, T.; Abdel-Rahman, M.; Wang, X.; Levine, A.D.; Rho, J.K.; et al. Activation of the AXL kinase causes resistance to EGFR-targeted therapy in lung cancer. Nat. Genet. 2012, 44, 852–860. [Google Scholar] [CrossRef]
  23. Byers, L.A.; Diao, L.; Wang, J.; Saintigny, P.; Girard, L.; Peyton, M.; Shen, L.; Fan, Y.; Giri, U.; Tumula, P.K.; et al. An epithelial-mesenchymal transition gene signature predicts resistance to EGFR and PI3K inhibitors and identifies Axl as a therapeutic target for overcoming EGFR inhibitor resistance. Clin. Cancer Res. 2013, 19, 279–290. [Google Scholar] [CrossRef]
  24. Zhang, Q.; Kanterewicz, B.; Shoemaker, S.; Hu, Q.; Liu, S.; Atwood, K.; Hershberger, P. Differential response to 1alpha,25-dihydroxyvitamin D3 (1alpha,25(OH)2D3) in non-small cell lung cancer cells with distinct oncogene mutations. J. Steroid Biochem. Mol. Biol. 2012, 136, 264–270. [Google Scholar]
  25. Zhang, Q.; Kanterewicz, B.; Buch, S.; Petkovich, M.; Parise, R.; Beumer, J.; Lin, Y.; Diergaarde, B.; Hershberger, P.A. Cyp24 inhibition preserves 1alpha,25-dihydroxyvitamin D3 anti-proliferative signaling in lung cancer cells. Mol. Cell. Endocrinol. 2012, 355, 153–161. [Google Scholar] [CrossRef]
  26. Ramirez, A.M.; Wongtrakool, C.; Welch, T.; Steinmeyer, A.; Zugel, U.; Roman, J. Vitamin D inhibition of pro-fibrotic effects of transforming growth factor beta1 in lung fibroblasts and epithelial cells. J. Steroid Biochem. Mol. Biol. 2010, 118, 142–150. [Google Scholar] [CrossRef]
  27. Parise, R.A.; Egorin, M.J.; Kanterewicz, B.; Taimi, M.; Petkovich, M.; Lew, A.M.; Chuang, S.S.; Nichols, M.; El-Hefnawy, T.; Hershberger, P.A. Cyp24, the enzyme that catabolizes the antiproliferative agent vitamin D, is increased in lung cancer. Int. J. Cancer 2006, 119, 1819–1828. [Google Scholar] [CrossRef]
  28. Xu, J.; Lamouille, S.; Derynck, R. TGF-beta-induced epithelial to mesenchymal transition. Cell Res. 2009, 19, 156–172. [Google Scholar] [CrossRef]
  29. Kim, S.H.; Chen, G.; King, A.N.; Jeon, C.K.; Christensen, P.J.; Zhao, L.; Simpson, R.U.; Thomas, D.G.; Giordano, T.J.; Brenner, D.E.; et al. Characterization of vitamin D receptor (VDR) in lung adenocarcinoma. Lung Cancer 2012, 77, 265–271. [Google Scholar] [CrossRef]
  30. Jeong, Y.; Xie, Y.; Lee, W.; Bookout, A.L.; Girard, L.; Raso, G.; Behrens, C.; Wistuba, I.I.; Gadzar, A.F.; Minna, J.D.; et al. Research resource: Diagnostic and therapeutic potential of nuclear receptor expression in lung cancer. Mol. Endocrinol. 2012, 26, 1443–1454. [Google Scholar] [CrossRef]
  31. Nguyen, K.S.; Neal, J.W. First-line treatment of EGFR-mutant non-small-cell lung cancer: The role of erlotinib and other tyrosine kinase inhibitors. Biologics 2012, 6, 337–345. [Google Scholar]
  32. Palmer, H.G.; Larriba, M.J.; Garcia, J.M.; Ordonez-Moran, P.; Pena, C.; Peiro, S.; Puig, I.; Rodriguez, R.; de la Fuente, R.; Bernad, A.; et al. The transcription factor snail represses vitamin D receptor expression and responsiveness in human colon cancer. Nat. Med. 2004, 10, 917–919. [Google Scholar] [CrossRef]
  33. Zhou, B.B.; Peyton, M.; He, B.; Liu, C.; Girard, L.; Caudler, E.; Lo, Y.; Baribaud, F.; Mikami, I.; Reguart, N.; et al. Targeting adam-mediated ligand cleavage to inhibit HER3 and EGFR pathways in non-small cell lung cancer. Cancer Cell 2006, 10, 39–50. [Google Scholar] [CrossRef]
  34. Maindonald, J.; Braun, J. Data Analysis and Graphics Using R, 2nd ed.; Cambridge University Press: Cambridge, UK, 2007. [Google Scholar]
  35. Creighton, C.J.; Gibbons, D.L.; Kurie, J.M. The role of epithelial-mesenchymal transition programming in invasion and metastasis: A clinical perspective. Cancer Manag. Res. 2013, 5, 187–195. [Google Scholar] [CrossRef]
  36. Kuo, C.H.; Chen, K.F.; Chou, S.H.; Huang, Y.F.; Wu, C.Y.; Cheng, D.E.; Chen, Y.W.; Yang, C.J.; Hung, J.Y.; Huang, M.S. Lung tumor associated dendritic cell-derived resistin promoted cancer progression by increasing wolf-hirschhorn syndrome candidate 1/twist pathway. Carcinogenesis 2013. [Google Scholar] [CrossRef]
  37. Zhou, W.; Heist, R.S.; Liu, G.; Asomaning, K.; Neuberg, D.S.; Hollis, B.W.; Wain, J.C.; Lynch, T.J.; Giovannucci, E.; Su, L.; et al. Circulating 25-hydroxyvitamin D levels predict survival in early-stage non-small-cell lung cancer patients. J. Clin. Oncol. 2007, 25, 479–485. [Google Scholar] [CrossRef]
  38. Zhou, W.; Suk, R.; Liu, G.; Park, S.; Neuberg, D.S.; Wain, J.C.; Lynch, T.J.; Giovannucci, E.; Christiani, D.C. Vitamin D is associated with improved survival in early-stage non-small cell lung cancer patients. Cancer Epidemiol. Biomarkers Prev. 2005, 14, 2303–2309. [Google Scholar] [CrossRef]

