Long Pentraxin-3 Follows and Modulates Bladder Cancer Progression

 ,
,  , ,
, ,  ,
,  , ,
, ,  and
and 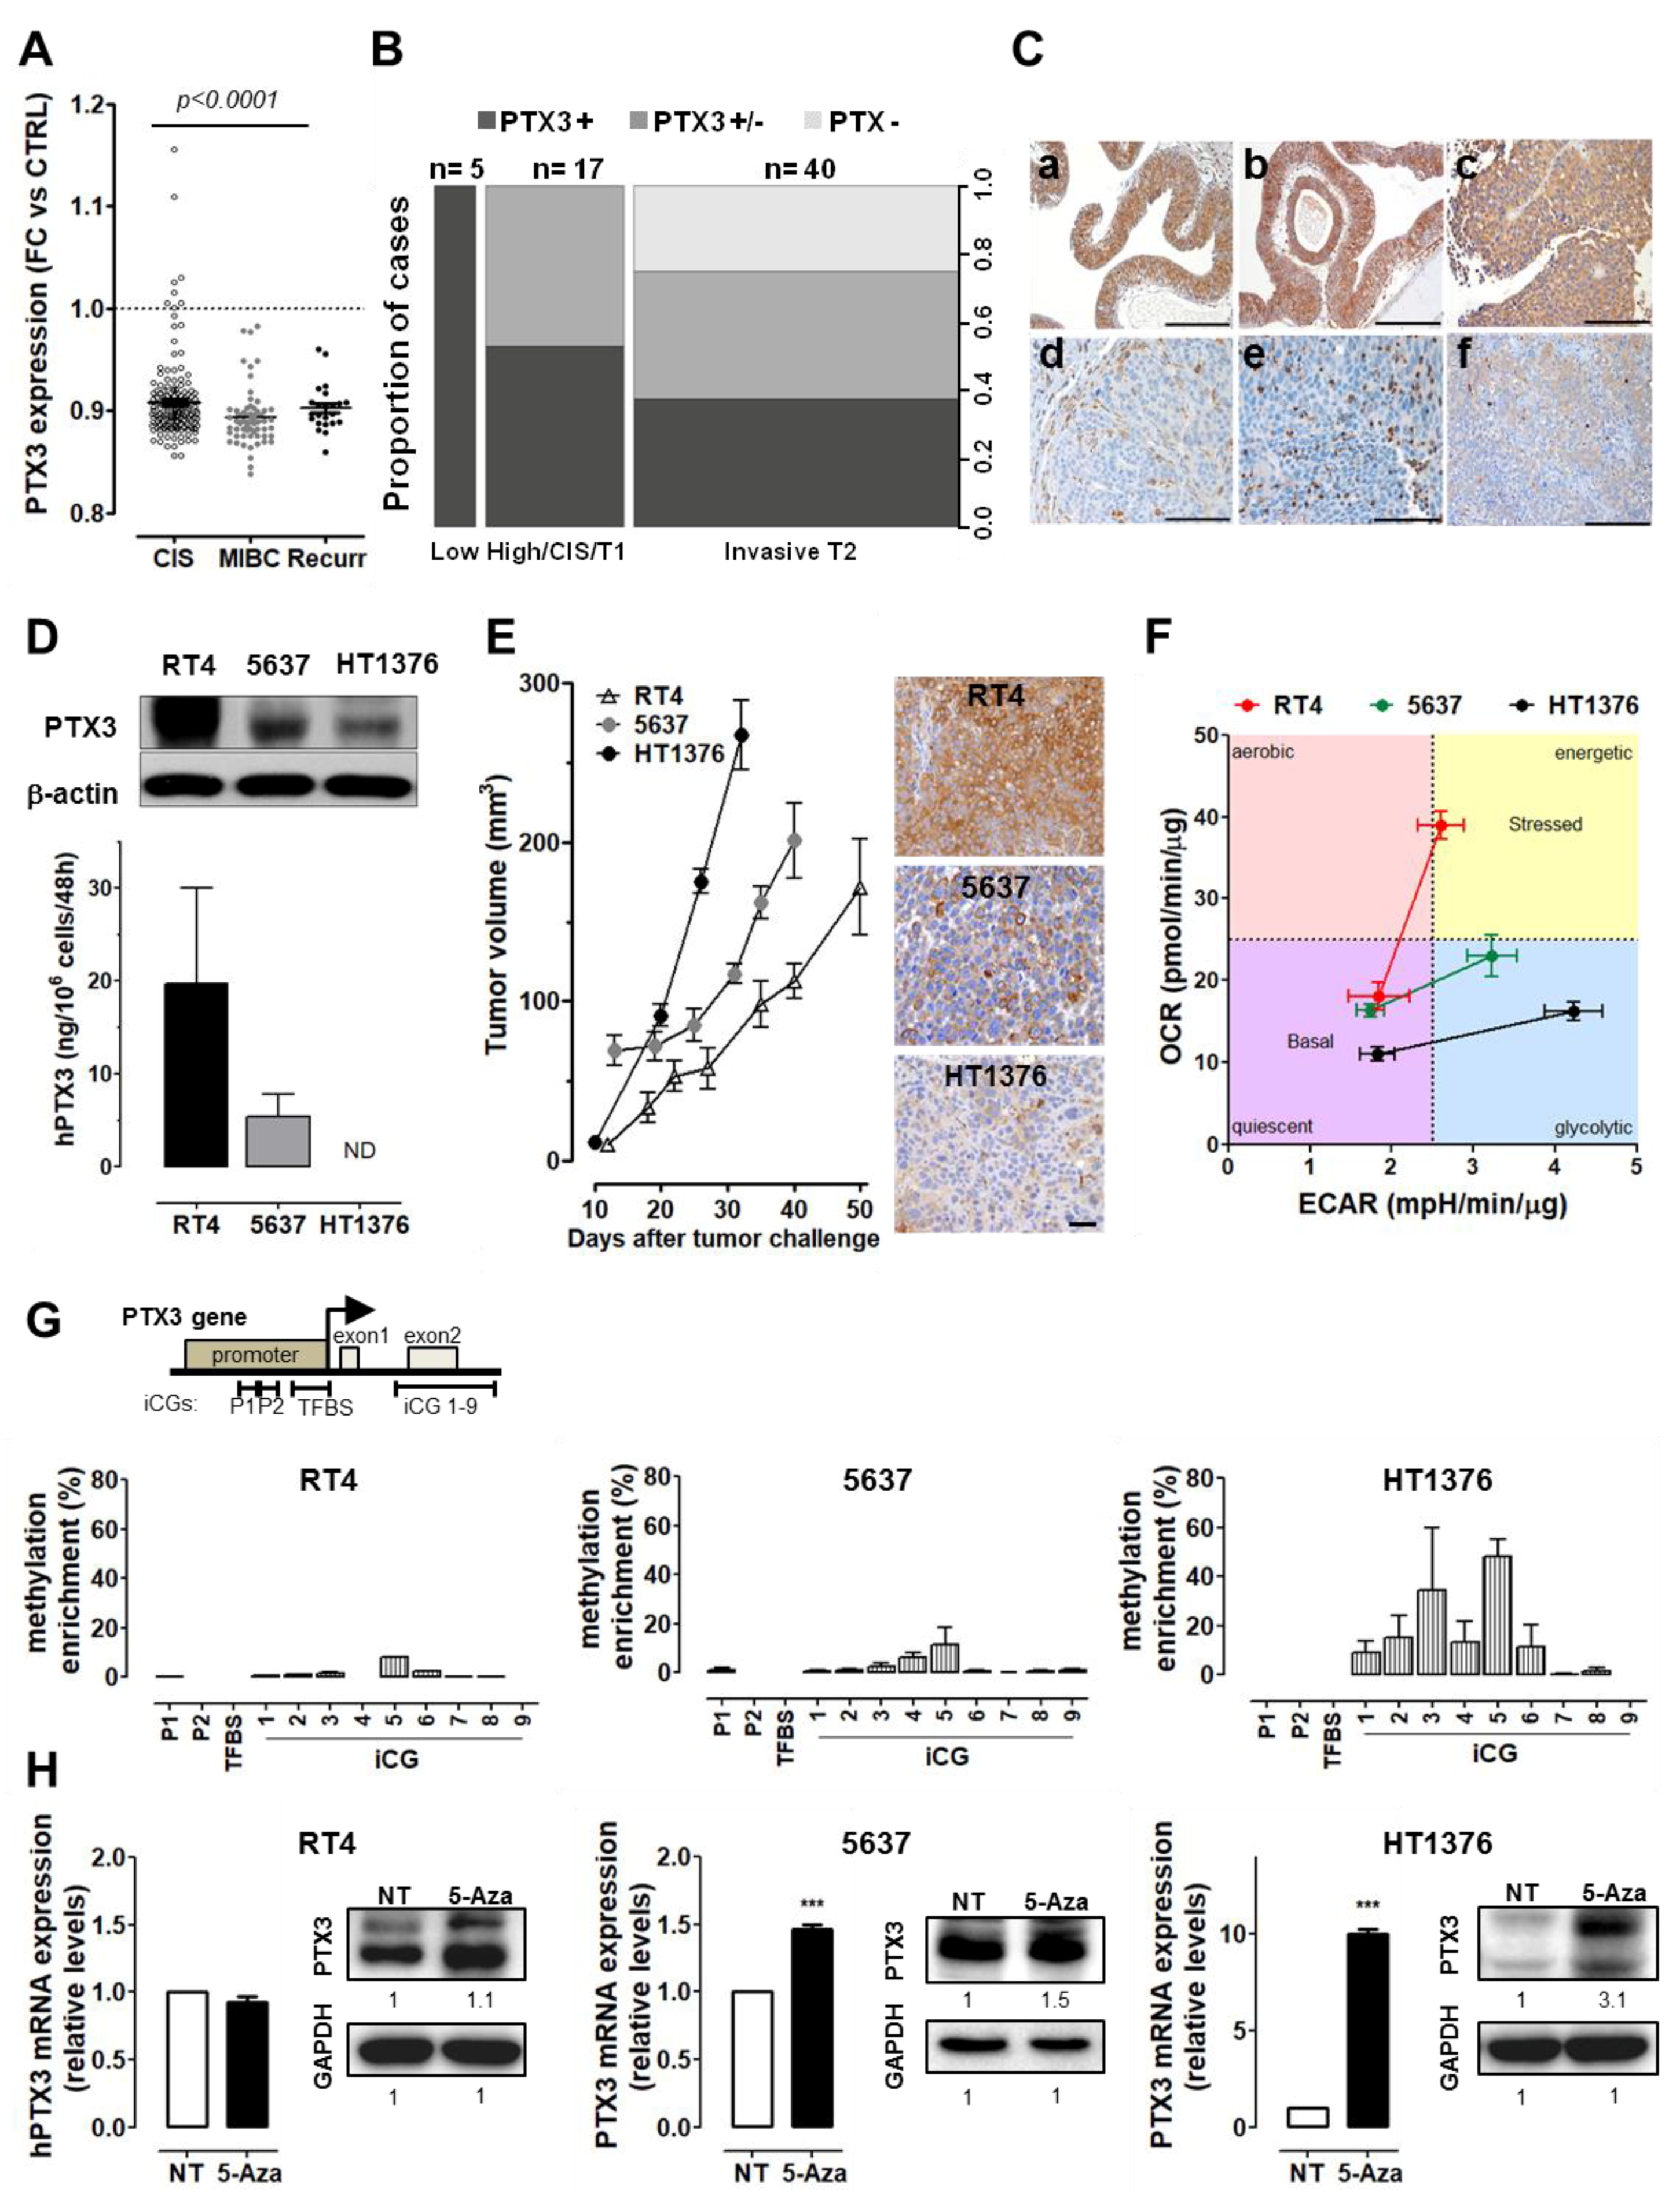
Abstract
1. Introduction
2. Results
2.1. PTX3 Expression Is Related to Tumor Grade in BC Patients and Cell Lines
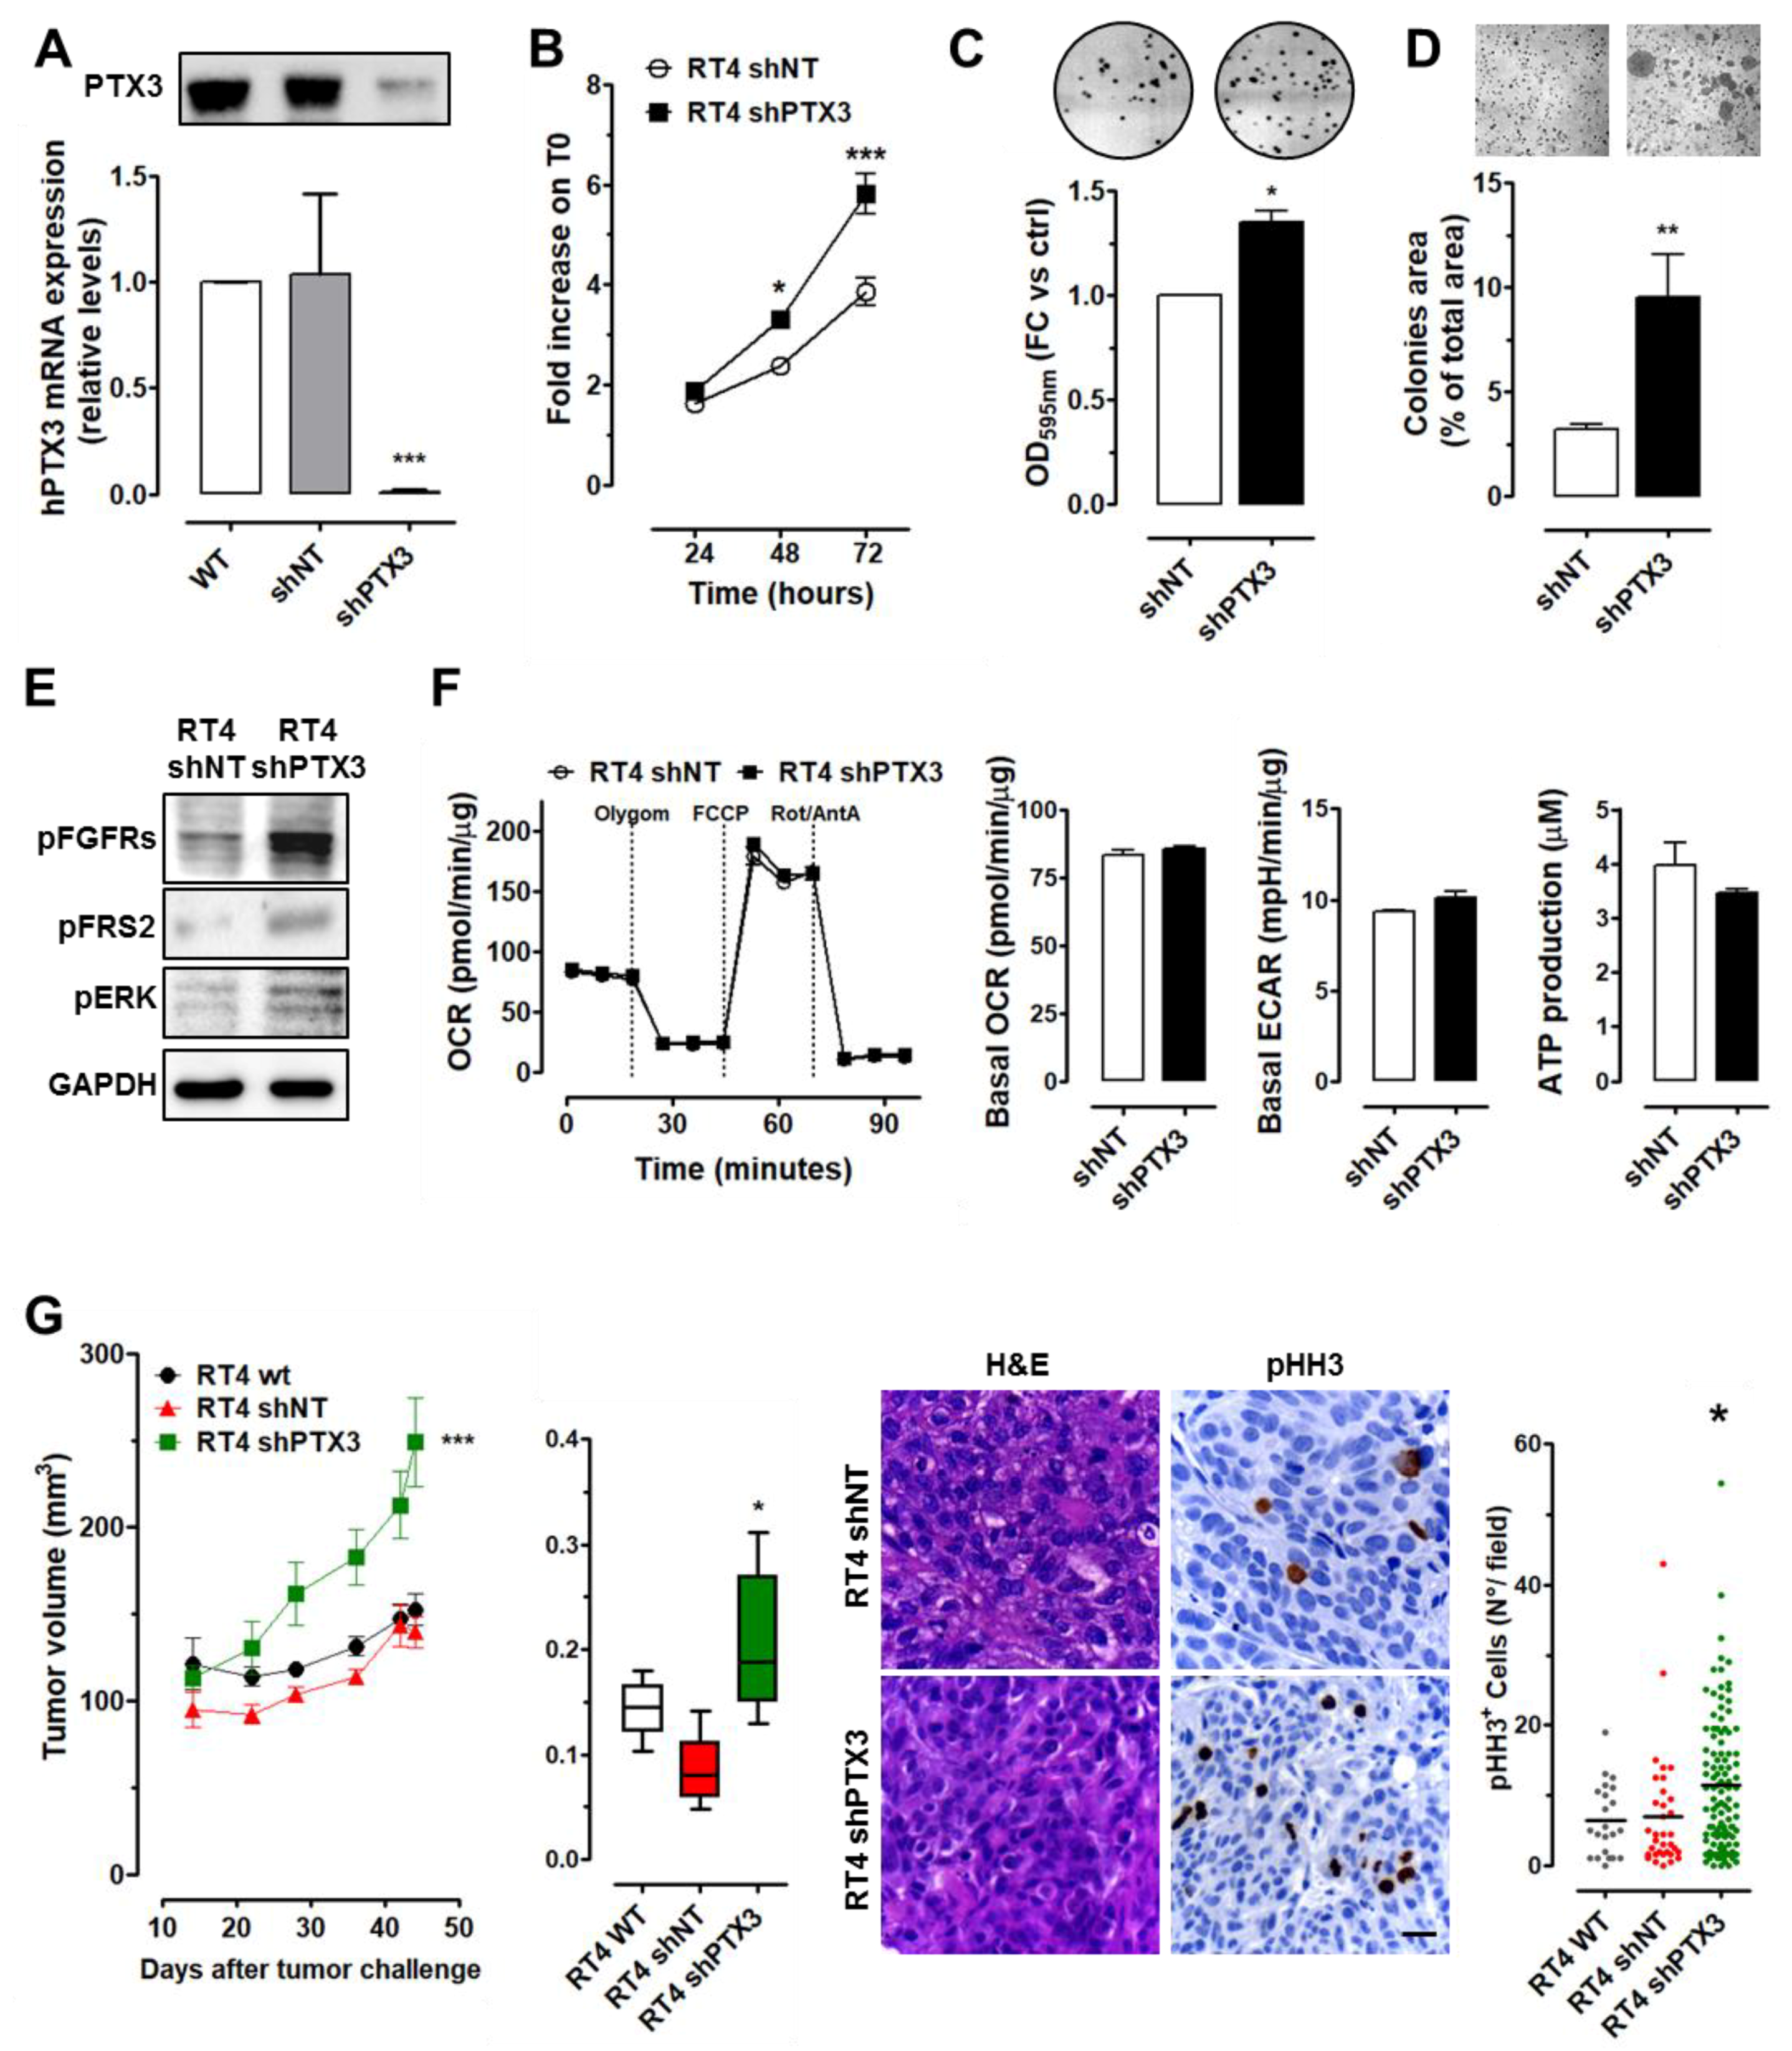
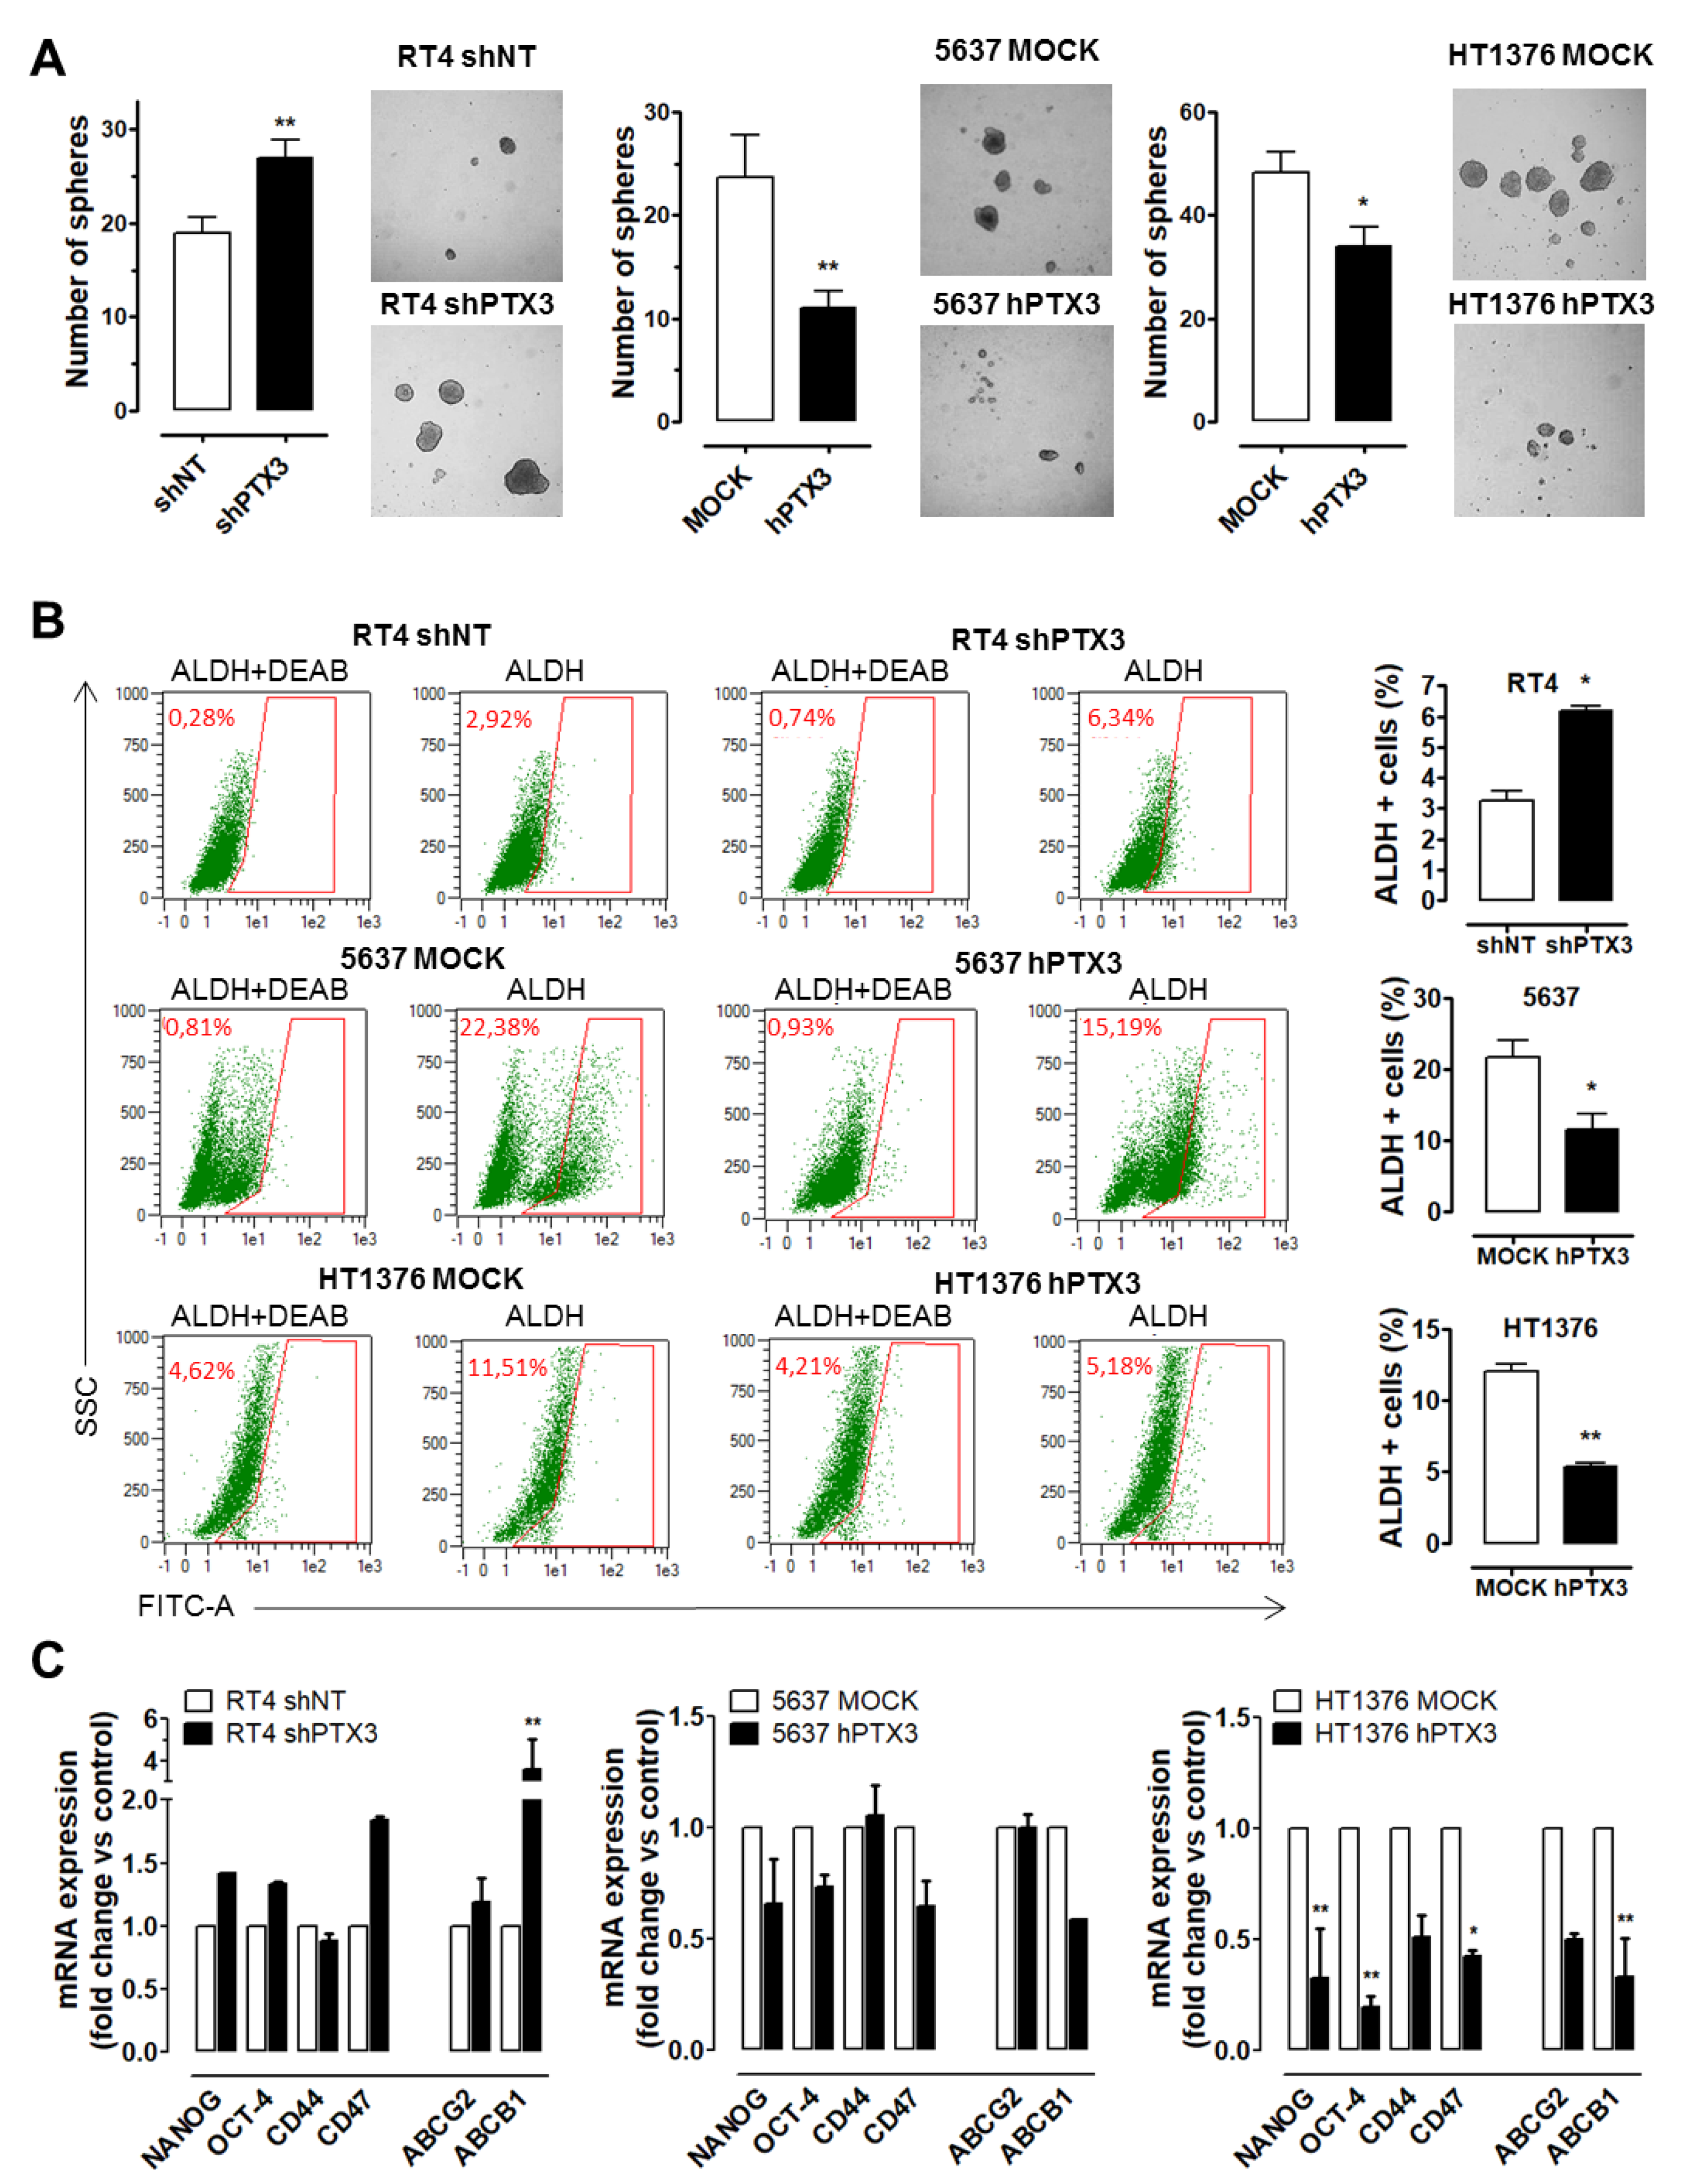
2.2. PTX3 Silencing Enhances Aggressiveness of Low-Grade BC Cells
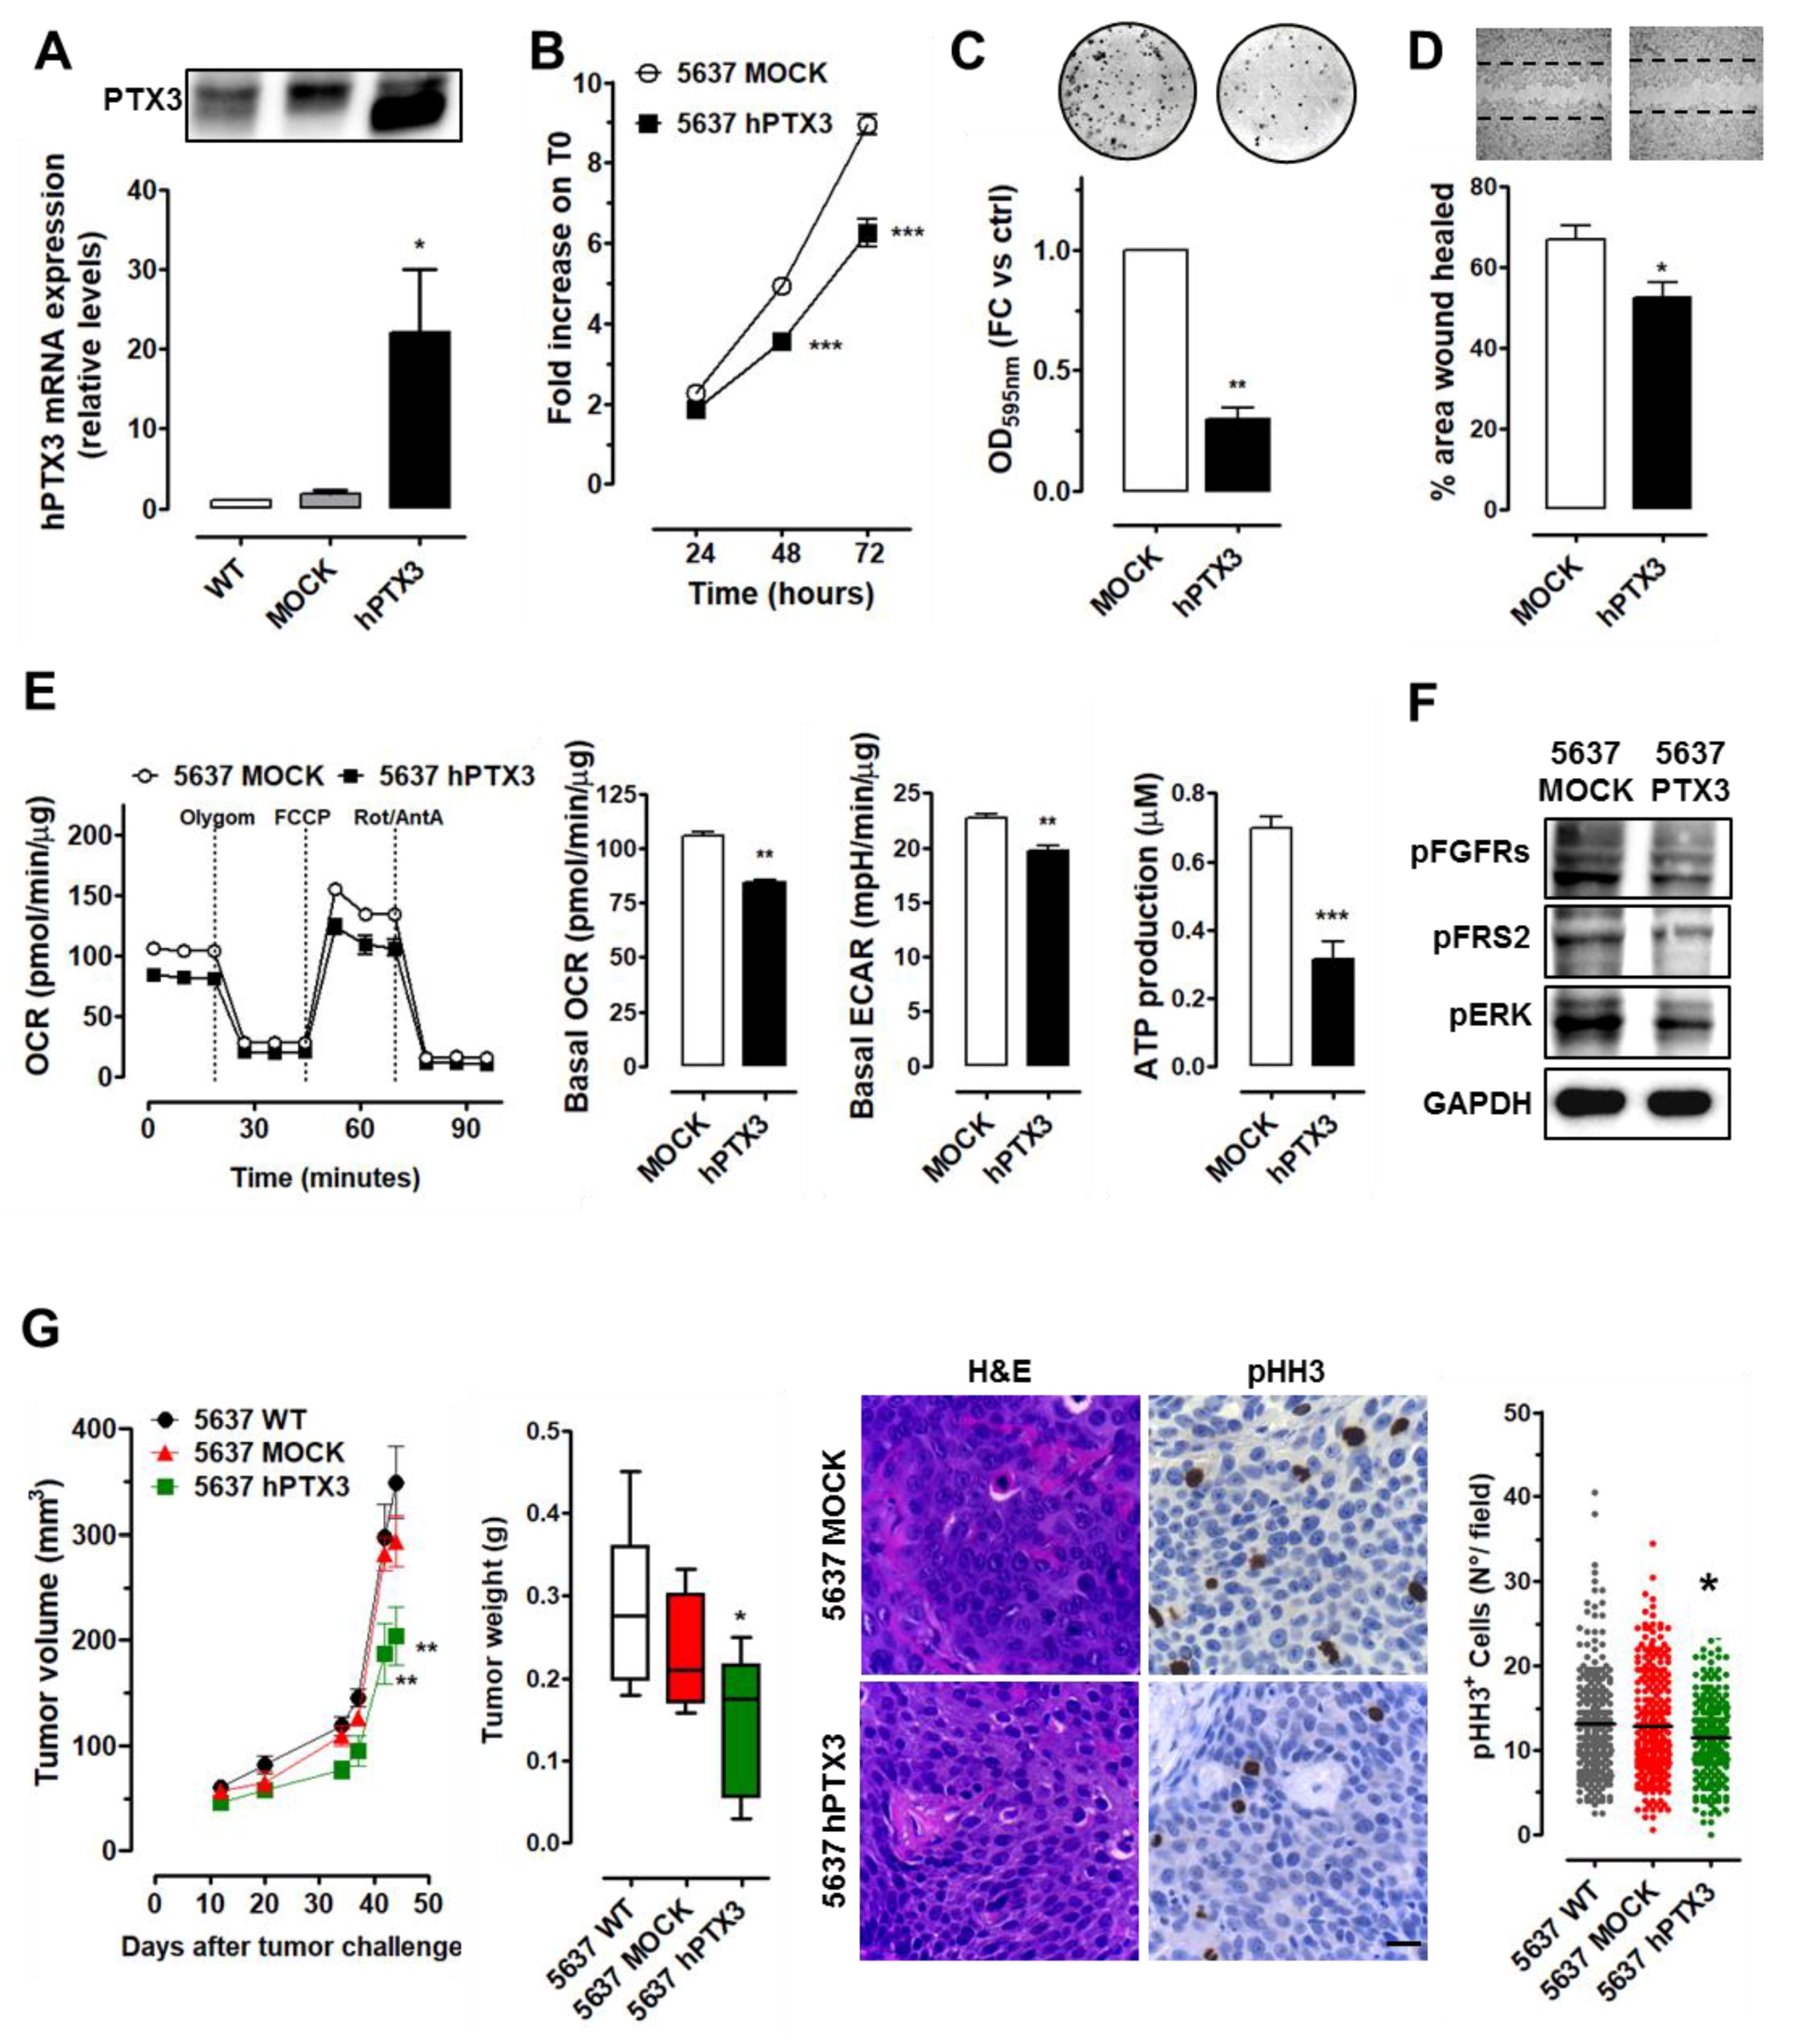
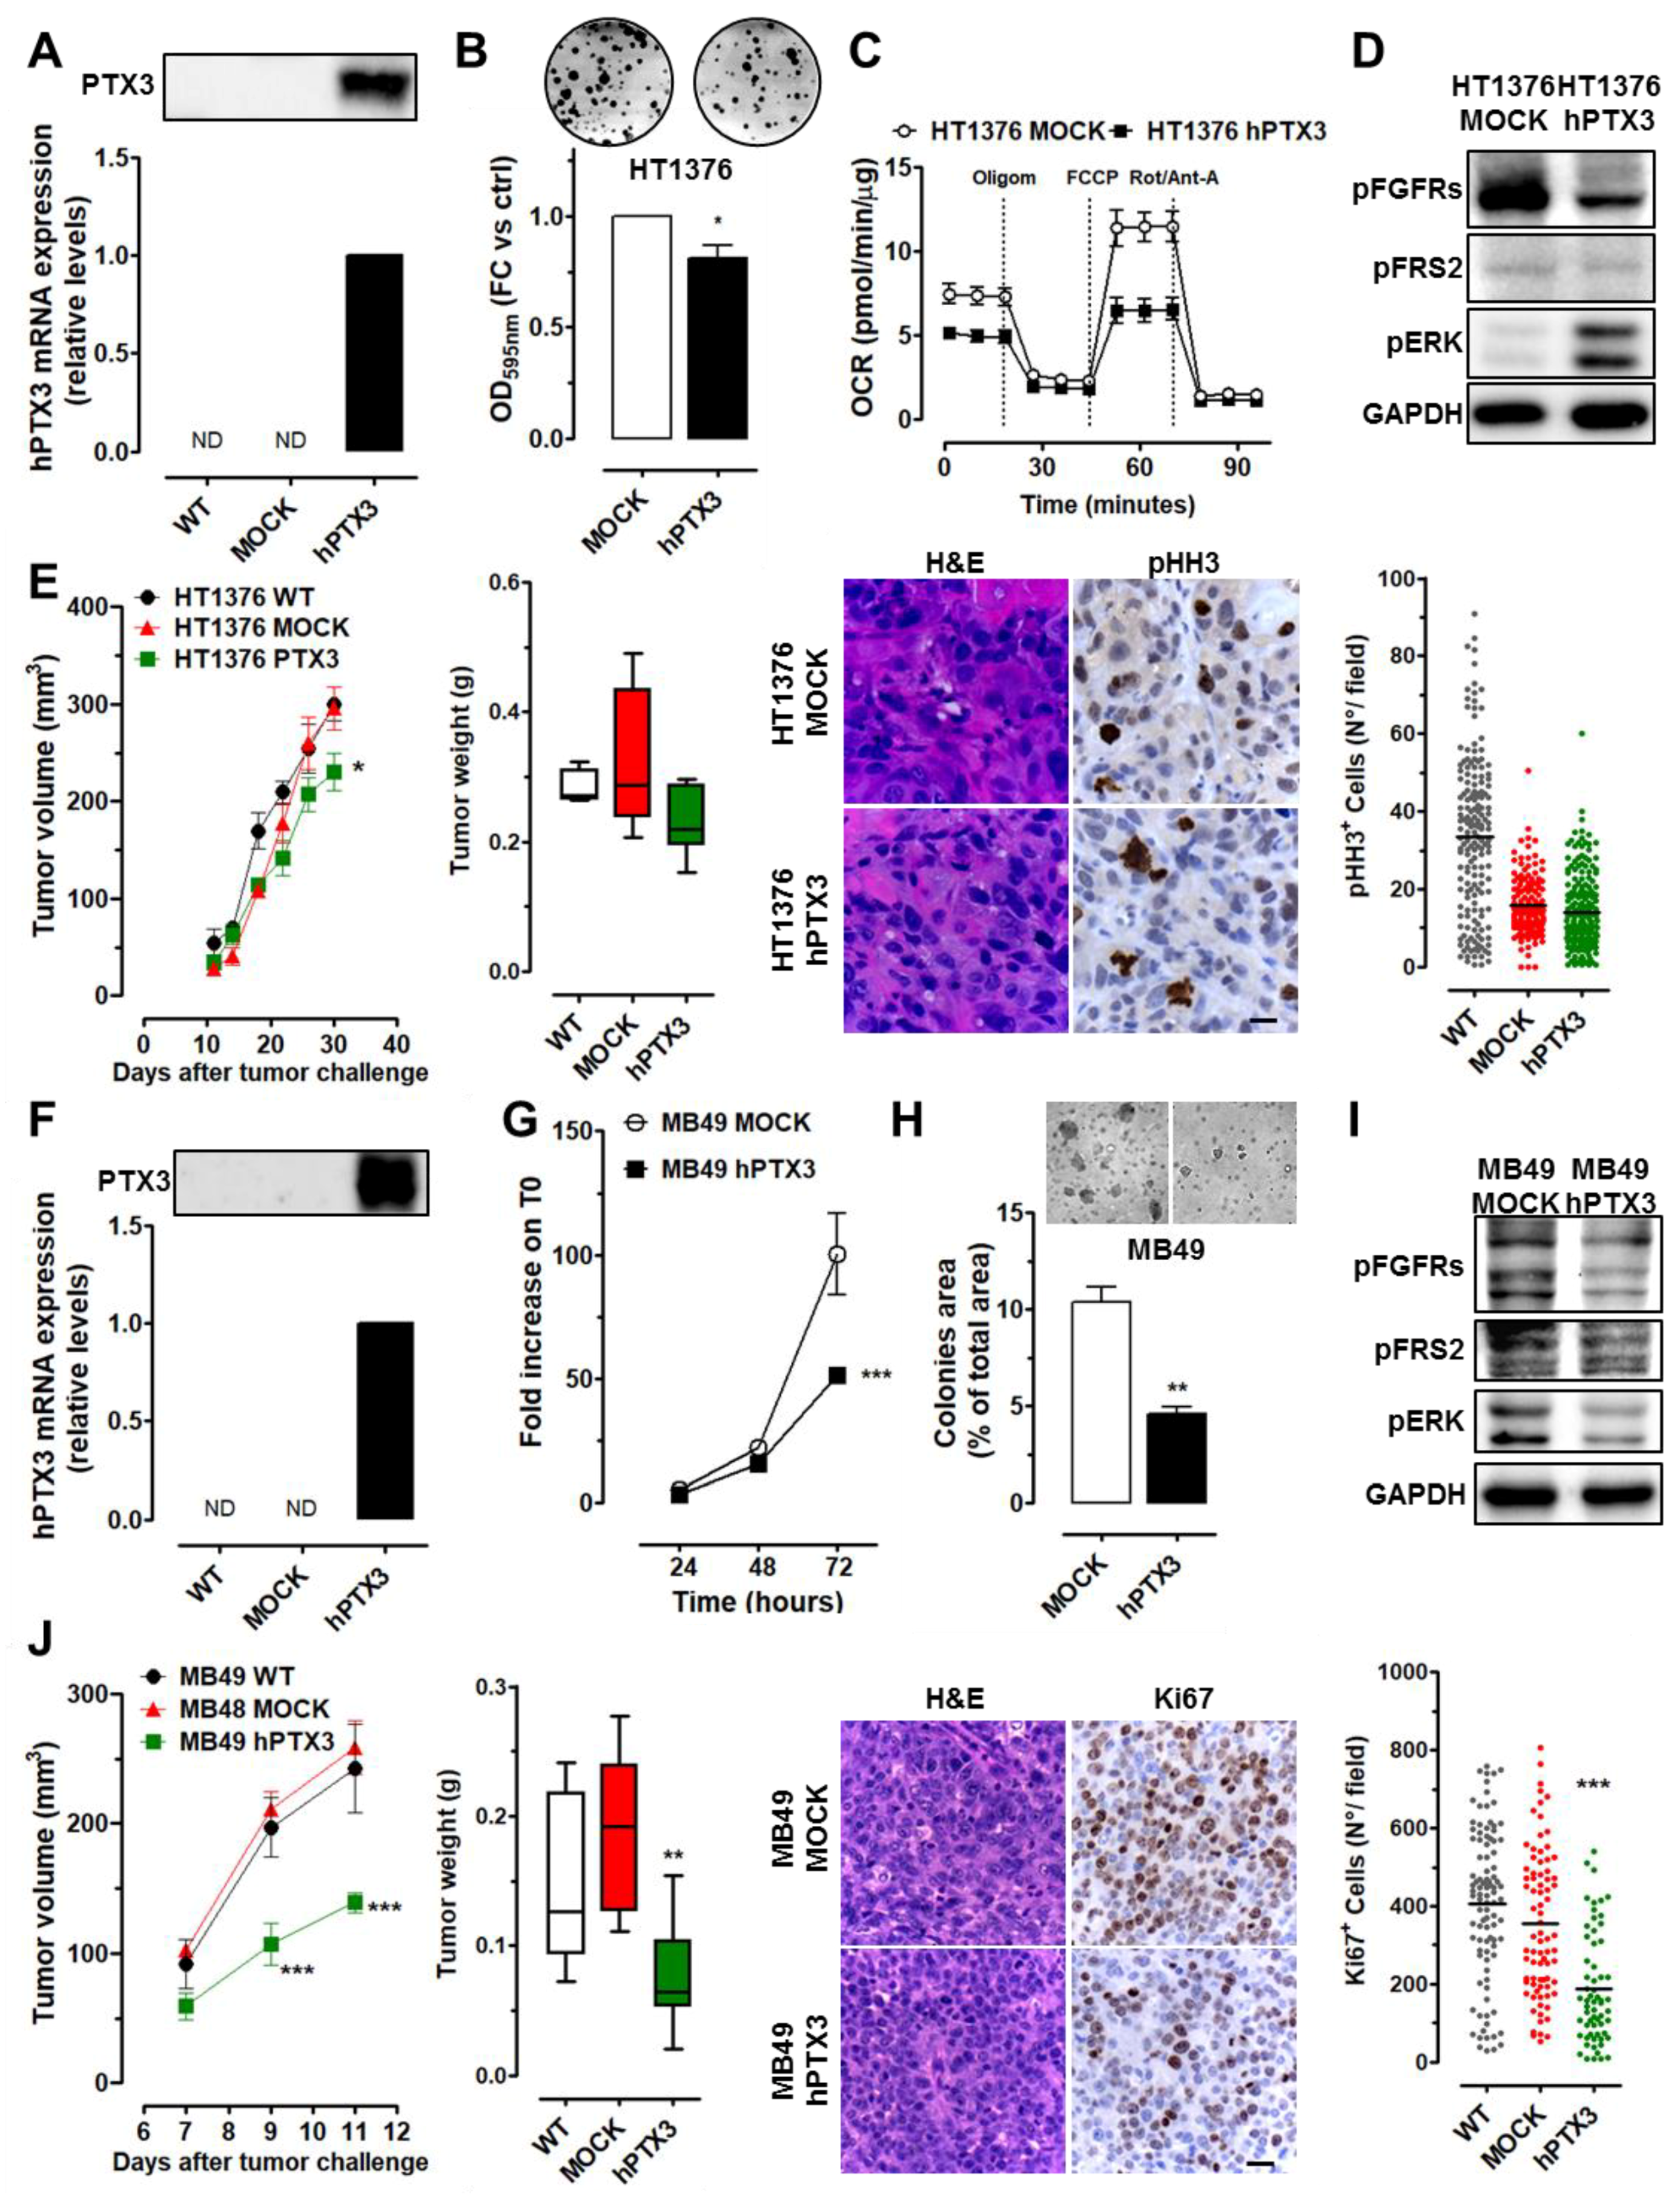
2.3. PTX3 Overexpression Exerts an Oncosuppressive Effect on High-Grade BC Cells
2.4. PTX3 Modulation Affects Stemness Features in BC Cells
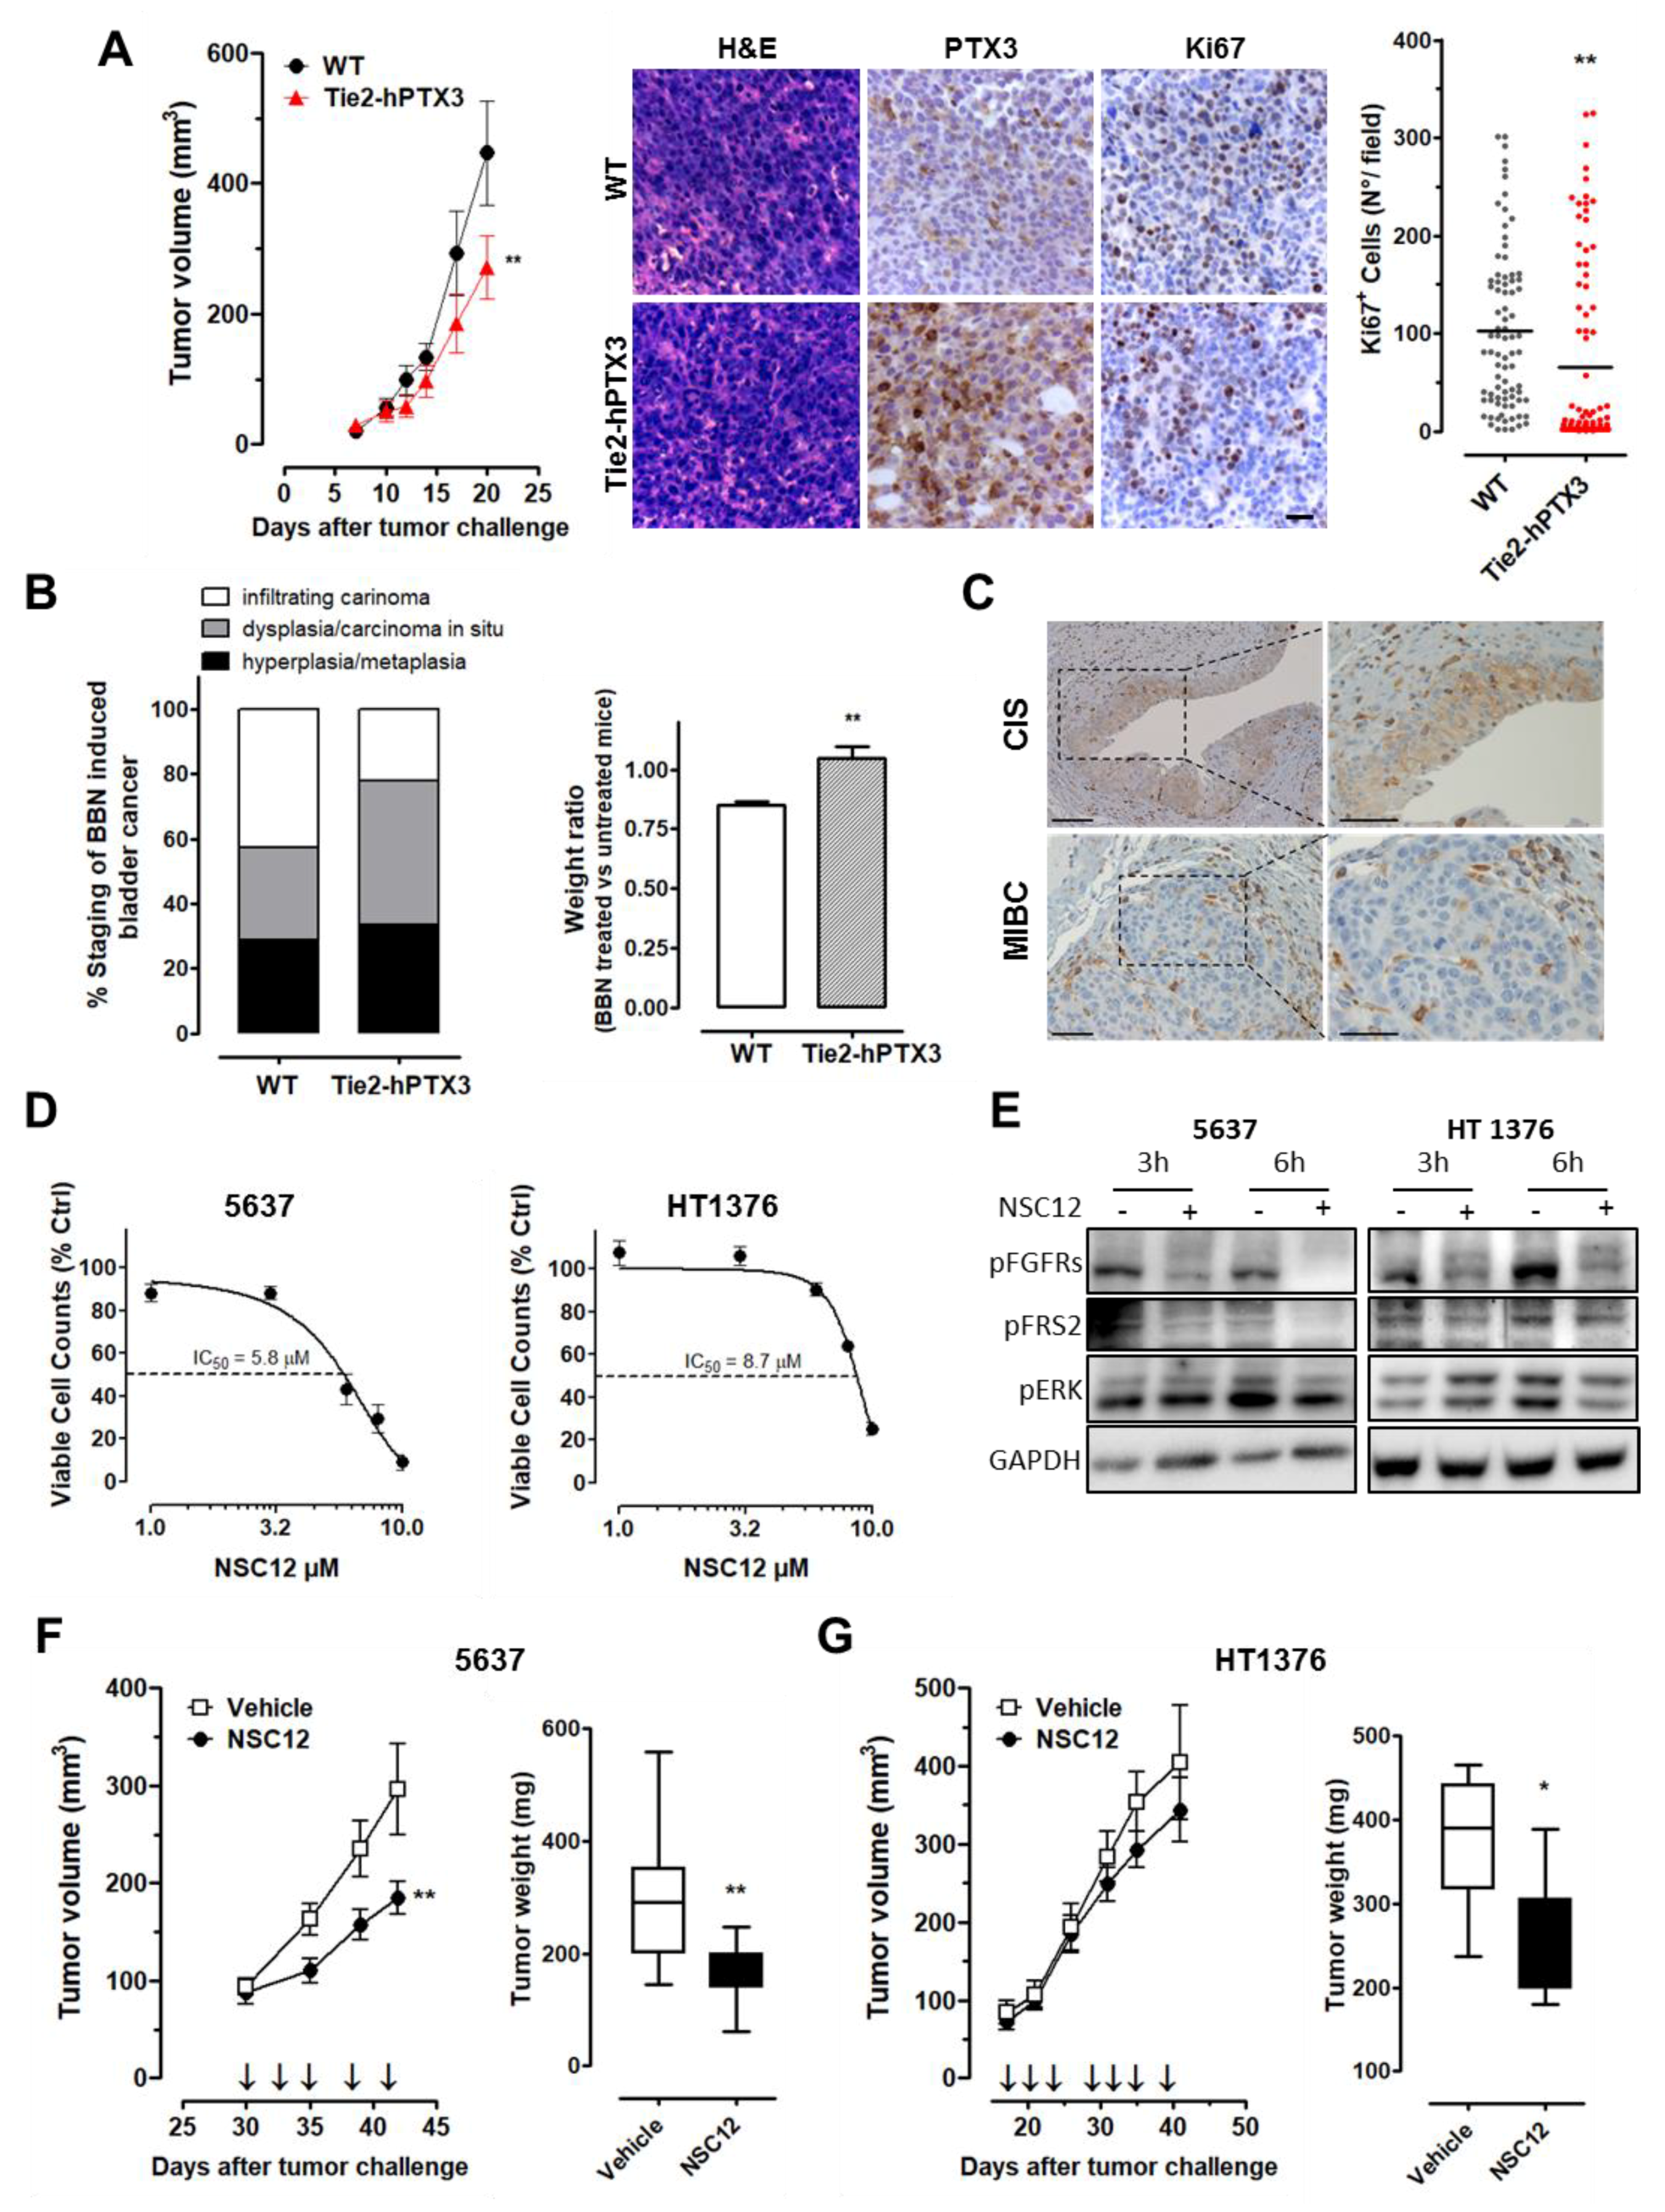
2.5. Stromal Expression of PTX3 Hampers BC Growth
3. Discussion
4. Materials and Methods
4.1. Reagents and Cell Cultures
4.2. Methylation Analysis
4.3. In Vitro Assays
4.4. Tumour Sphere Formation Assay and ALDH Analysis
4.5. Seahorse and ATP Quantification
4.6. Immunohistochemistry
4.7. In Vivo Studies
5. Conclusions
Supplementary Materials
Author Contributions
Funding
Conflicts of Interest
References
- Antoni, S.; Ferlay, J.; Soerjomataram, I.; Znaor, A.; Jemal, A.; Bray, F. Bladder Cancer Incidence and Mortality: A Global Overview and Recent Trends. Eur. Urol. 2017, 71, 96–108. [Google Scholar] [CrossRef]
- Yeung, C.; Dinh, T.; Lee, J. The health economics of bladder cancer: An updated review of the published literature. Pharmacoeconomics 2014, 32, 1093–1104. [Google Scholar] [CrossRef] [PubMed]
- O’Brien, T.S.; Smith, K.; Cranston, D.; Fuggle, S.; Bicknell, R.; Harris, A.L. Urinary basic fibroblast growth factor in patients with bladder cancer and benign prostatic hypertrophy. Br. J. Urol. 1995, 76, 311–314. [Google Scholar] [CrossRef] [PubMed]
- Yoshimura, K.; Eto, H.; Miyake, H.; Hara, I.; Arakawa, S.; Kamidono, S. Messenger ribonucleic acids for fibroblast growth factors and their receptor in bladder and renal cell carcinoma cell lines. Cancer Lett. 1996, 103, 91–97. [Google Scholar] [CrossRef]
- Di Martino, E.; Tomlinson, D.C.; Knowles, M.A. A Decade of FGF Receptor Research in Bladder Cancer: Past, Present, and Future Challenges. Adv. Urol. 2012, 2012, 429213. [Google Scholar] [CrossRef] [PubMed]
- Lim, S.; Koh, M.J.; Jeong, H.J.; Cho, N.H.; Choi, Y.D.; Cho, D.Y.; Lee, H.Y.; Rha, S.Y. Fibroblast Growth Factor Receptor 1 Overexpression Is Associated with Poor Survival in Patients with Resected Muscle Invasive Urothelial Carcinoma. Yonsei Med. J. 2016, 57, 831–839. [Google Scholar] [CrossRef] [PubMed]
- Tomlinson, D.C.; Baldo, O.; Harnden, P.; Knowles, M.A. FGFR3 protein expression and its relationship to mutation status and prognostic variables in bladder cancer. J. Pathol. 2007, 213, 91–98. [Google Scholar] [CrossRef] [PubMed]
- Ronca, R.; Alessi, P.; Coltrini, D.; Di Salle, E.; Giacomini, A.; Leali, D.; Corsini, M.; Belleri, M.; Tobia, C.; Garlanda, C.; et al. Long pentraxin-3 as an epithelial-stromal fibroblast growth factor-targeting inhibitor in prostate cancer. J. Pathol. 2013, 230, 228–238. [Google Scholar] [CrossRef] [PubMed]
- Ronca, R.; Benzoni, P.; Leali, D.; Urbinati, C.; Belleri, M.; Corsini, M.; Alessi, P.; Coltrini, D.; Calza, S.; Presta, M.; et al. Antiangiogenic activity of a neutralizing human single-chain antibody fragment against fibroblast growth factor receptor 1. Mol. Cancer Ther. 2010, 9, 3244–3253. [Google Scholar] [CrossRef]
- Rodrigues, P.F.; Matarazzo, S.; Maccarinelli, F.; Foglio, E.; Giacomini, A.; Silva Nunes, J.P.; Presta, M.; Dias, A.A.M.; Ronca, R. Long Pentraxin 3-Mediated Fibroblast Growth Factor Trapping Impairs Fibrosarcoma Growth. Front. Oncol. 2018, 8, 472. [Google Scholar] [CrossRef]
- Giacomini, A.; Ghedini, G.C.; Presta, M.; Ronca, R. Long pentraxin 3: A novel multifaceted player in cancer. Biochim. Biophys. Acta 2018, 1869, 53–63. [Google Scholar] [CrossRef] [PubMed]
- Bonavita, E.; Gentile, S.; Rubino, M.; Maina, V.; Papait, R.; Kunderfranco, P.; Greco, C.; Feruglio, F.; Molgora, M.; Laface, I.; et al. PTX3 is an extrinsic oncosuppressor regulating complement-dependent inflammation in cancer. Cell 2015, 160, 700–714. [Google Scholar] [CrossRef] [PubMed]
- Ronca, R.; Di Salle, E.; Giacomini, A.; Leali, D.; Alessi, P.; Coltrini, D.; Ravelli, C.; Matarazzo, S.; Ribatti, D.; Vermi, W.; et al. Long Pentraxin-3 Inhibits Epithelial-Mesenchymal Transition in Melanoma Cells. Mol. Cancer Ther. 2013, 12, 2760–2771. [Google Scholar] [CrossRef] [PubMed]
- Jaillon, S.; Moalli, F.; Ragnarsdottir, B.; Bonavita, E.; Puthia, M.; Riva, F.; Barbati, E.; Nebuloni, M.; Cvetko Krajinovic, L.; Markotic, A.; et al. The humoral pattern recognition molecule PTX3 is a key component of innate immunity against urinary tract infection. Immunity 2014, 40, 621–632. [Google Scholar] [CrossRef] [PubMed]
- Goodison, S.; Chang, M.; Dai, Y.; Urquidi, V.; Rosser, C.J. A multi-analyte assay for the non-invasive detection of bladder cancer. PLoS ONE 2012, 7, e47469. [Google Scholar] [CrossRef]
- Griffith, O.L.; Chan, S.R.; Griffith, M.; Krysiak, K.; Skidmore, Z.L.; Hundal, J.; Allen, J.A.; Arthur, C.D.; Runci, D.; Bugatti, M.; et al. Truncating Prolactin Receptor Mutations Promote Tumor Growth in Murine Estrogen Receptor-Alpha Mammary Carcinomas. Cell Rep. 2016, 17, 249–260. [Google Scholar] [CrossRef]
- Gunther, J.H.; Jurczok, A.; Wulf, T.; Brandau, S.; Deinert, I.; Jocham, D.; Bohle, A. Optimizing syngeneic orthotopic murine bladder cancer (MB49). Cancer Res. 1999, 59, 2834–2837. [Google Scholar]
- Chan, K.S.; Volkmer, J.P.; Weissman, I. Cancer stem cells in bladder cancer: A revisited and evolving concept. Curr. Opin. Urol. 2010, 20, 393–397. [Google Scholar] [CrossRef]
- Ronca, R.; Giacomini, A.; Di Salle, E.; Coltrini, D.; Pagano, K.; Ragona, L.; Matarazzo, S.; Rezzola, S.; Maiolo, D.; Torrella, R.; et al. Long-Pentraxin 3 Derivative as a Small-Molecule FGF Trap for Cancer Therapy. Cancer Cell 2015, 28, 225–239. [Google Scholar] [CrossRef]
- Vasconcelos-Nobrega, C.; Colaco, A.; Lopes, C.; Oliveira, P.A. Review: BBN as an urothelial carcinogen. In Vivo 2012, 26, 727–739. [Google Scholar]
- Castelli, R.; Giacomini, A.; Anselmi, M.; Bozza, N.; Vacondio, F.; Rivara, S.; Matarazzo, S.; Presta, M.; Mor, M.; Ronca, R. Synthesis, Structural Elucidation, and Biological Evaluation of NSC12, an Orally Available Fibroblast Growth Factor (FGF) Ligand Trap for the Treatment of FGF-Dependent Lung Tumors. J. Med. Chem. 2016, 59, 4651–4663. [Google Scholar] [CrossRef] [PubMed]
- Eriksson, P.; Aine, M.; Veerla, S.; Liedberg, F.; Sjodahl, G.; Hoglund, M. Molecular subtypes of urothelial carcinoma are defined by specific gene regulatory systems. BMC Med. Genom. 2015, 8, 25. [Google Scholar] [CrossRef] [PubMed]
- Sjodahl, G.; Eriksson, P.; Liedberg, F.; Hoglund, M. Molecular classification of urothelial carcinoma: Global mRNA classification versus tumour-cell phenotype classification. J. Pathol. 2017, 242, 113–125. [Google Scholar] [CrossRef] [PubMed]
- Giacomini, A.; Matarazzo, S.; Pagano, K.; Ragona, L.; Rezzola, S.; Corsini, M.; Di Salle, E.; Presta, M.; Ronca, R. A long pentraxin-3-derived pentapeptide for the therapy of FGF8b-driven steroid hormone-regulated cancers. Oncotarget 2015, 6, 13790–13802. [Google Scholar] [CrossRef] [PubMed]
- Leali, D.; Alessi, P.; Coltrini, D.; Ronca, R.; Corsini, M.; Nardo, G.; Indraccolo, S.; Presta, M. Long pentraxin-3 inhibits FGF8b-dependent angiogenesis and growth of steroid hormone-regulated tumors. Mol. Cancer Ther. 2011, 10, 1600–1610. [Google Scholar] [CrossRef] [PubMed]
- Jaillon, S.; Mancuso, G.; Hamon, Y.; Beauvillain, C.; Cotici, V.; Midiri, A.; Bottazzi, B.; Nebuloni, M.; Garlanda, C.; Fremaux, I.; et al. Prototypic long pentraxin PTX3 is present in breast milk, spreads in tissues, and protects neonate mice from Pseudomonas aeruginosa lung infection. J. Immunol. 2013, 191, 1873–1882. [Google Scholar] [CrossRef] [PubMed]
- Doni, A.; Stravalaci, M.; Inforzato, A.; Magrini, E.; Mantovani, A.; Garlanda, C.; Bottazzi, B. The Long Pentraxin PTX3 as a Link Between Innate Immunity, Tissue Remodeling, and Cancer. Front. Immunol. 2019, 10, 712. [Google Scholar] [CrossRef] [PubMed]
- Di Martino, E.; Tomlinson, D.C.; Williams, S.V.; Knowles, M.A. A place for precision medicine in bladder cancer: Targeting the FGFRs. Future Oncol. 2016, 12, 2243–2263. [Google Scholar] [CrossRef]
- Giacomini, A.; Chiodelli, P.; Matarazzo, S.; Rusnati, M.; Presta, M.; Ronca, R. Blocking the FGF/FGFR system as a “two-compartment” antiangiogenic/antitumor approach in cancer therapy. Pharmacol. Res. 2016, 107, 172–185. [Google Scholar] [CrossRef]
- Visvader, J.E.; Lindeman, G.J. Cancer stem cells in solid tumours: Accumulating evidence and unresolved questions. Nat. Rev. Cancer 2008, 8, 755–768. [Google Scholar] [CrossRef]
- Ho, P.L.; Kurtova, A.; Chan, K.S. Normal and neoplastic urothelial stem cells: Getting to the root of the problem. Nat. Rev. Urol. 2012, 9, 583–594. [Google Scholar] [CrossRef] [PubMed]
- Bentivegna, A.; Conconi, D.; Panzeri, E.; Sala, E.; Bovo, G.; Vigano, P.; Brunelli, S.; Bossi, M.; Tredici, G.; Strada, G.; et al. Biological heterogeneity of putative bladder cancer stem-like cell populations from human bladder transitional cell carcinoma samples. Cancer Sci. 2010, 101, 416–424. [Google Scholar] [CrossRef] [PubMed]
- Ferreira-Teixeira, M.; Parada, B.; Rodrigues-Santos, P.; Alves, V.; Ramalho, J.S.; Caramelo, F.; Sousa, V.; Reis, F.; Gomes, C.M. Functional and molecular characterization of cancer stem-like cells in bladder cancer: A potential signature for muscle-invasive tumors. Oncotarget 2015, 6, 36185–36201. [Google Scholar] [CrossRef] [PubMed]
- Maehara, O.; Suda, G.; Natsuizaka, M.; Ohnishi, S.; Komatsu, Y.; Sato, F.; Nakai, M.; Sho, T.; Morikawa, K.; Ogawa, K.; et al. Fibroblast growth factor-2-mediated FGFR/Erk signaling supports maintenance of cancer stem-like cells in esophageal squamous cell carcinoma. Carcinogenesis 2017, 38, 1073–1083. [Google Scholar] [CrossRef] [PubMed]
- Begicevic, R.R.; Falasca, M. ABC Transporters in Cancer Stem Cells: Beyond Chemoresistance. Int. J. Mol. Sci. 2017, 18, 2362. [Google Scholar] [CrossRef] [PubMed]


© 2019 by the authors. Licensee MDPI, Basel, Switzerland. This article is an open access article distributed under the terms and conditions of the Creative Commons Attribution (CC BY) license (http://creativecommons.org/licenses/by/4.0/).
Share and Cite
Matarazzo, S.; Melocchi, L.; Rezzola, S.; Grillo, E.; Maccarinelli, F.; Giacomini, A.; Turati, M.; Taranto, S.; Zammataro, L.; Cerasuolo, M.; et al. Long Pentraxin-3 Follows and Modulates Bladder Cancer Progression. Cancers 2019, 11, 1277. https://doi.org/10.3390/cancers11091277
Matarazzo S, Melocchi L, Rezzola S, Grillo E, Maccarinelli F, Giacomini A, Turati M, Taranto S, Zammataro L, Cerasuolo M, et al. Long Pentraxin-3 Follows and Modulates Bladder Cancer Progression. Cancers. 2019; 11(9):1277. https://doi.org/10.3390/cancers11091277
Chicago/Turabian StyleMatarazzo, Sara, Laura Melocchi, Sara Rezzola, Elisabetta Grillo, Federica Maccarinelli, Arianna Giacomini, Marta Turati, Sara Taranto, Luca Zammataro, Marianna Cerasuolo, and et al. 2019. "Long Pentraxin-3 Follows and Modulates Bladder Cancer Progression" Cancers 11, no. 9: 1277. https://doi.org/10.3390/cancers11091277
APA StyleMatarazzo, S., Melocchi, L., Rezzola, S., Grillo, E., Maccarinelli, F., Giacomini, A., Turati, M., Taranto, S., Zammataro, L., Cerasuolo, M., Bugatti, M., Vermi, W., Presta, M., & Ronca, R. (2019). Long Pentraxin-3 Follows and Modulates Bladder Cancer Progression. Cancers, 11(9), 1277. https://doi.org/10.3390/cancers11091277