Mining of Self-Organizing Map Gene-Expression Portraits Reveals Prognostic Stratification of HPV-Positive Head and Neck Squamous Cell Carcinoma

 ,
, 
Abstract
:1. Introduction
2. Results
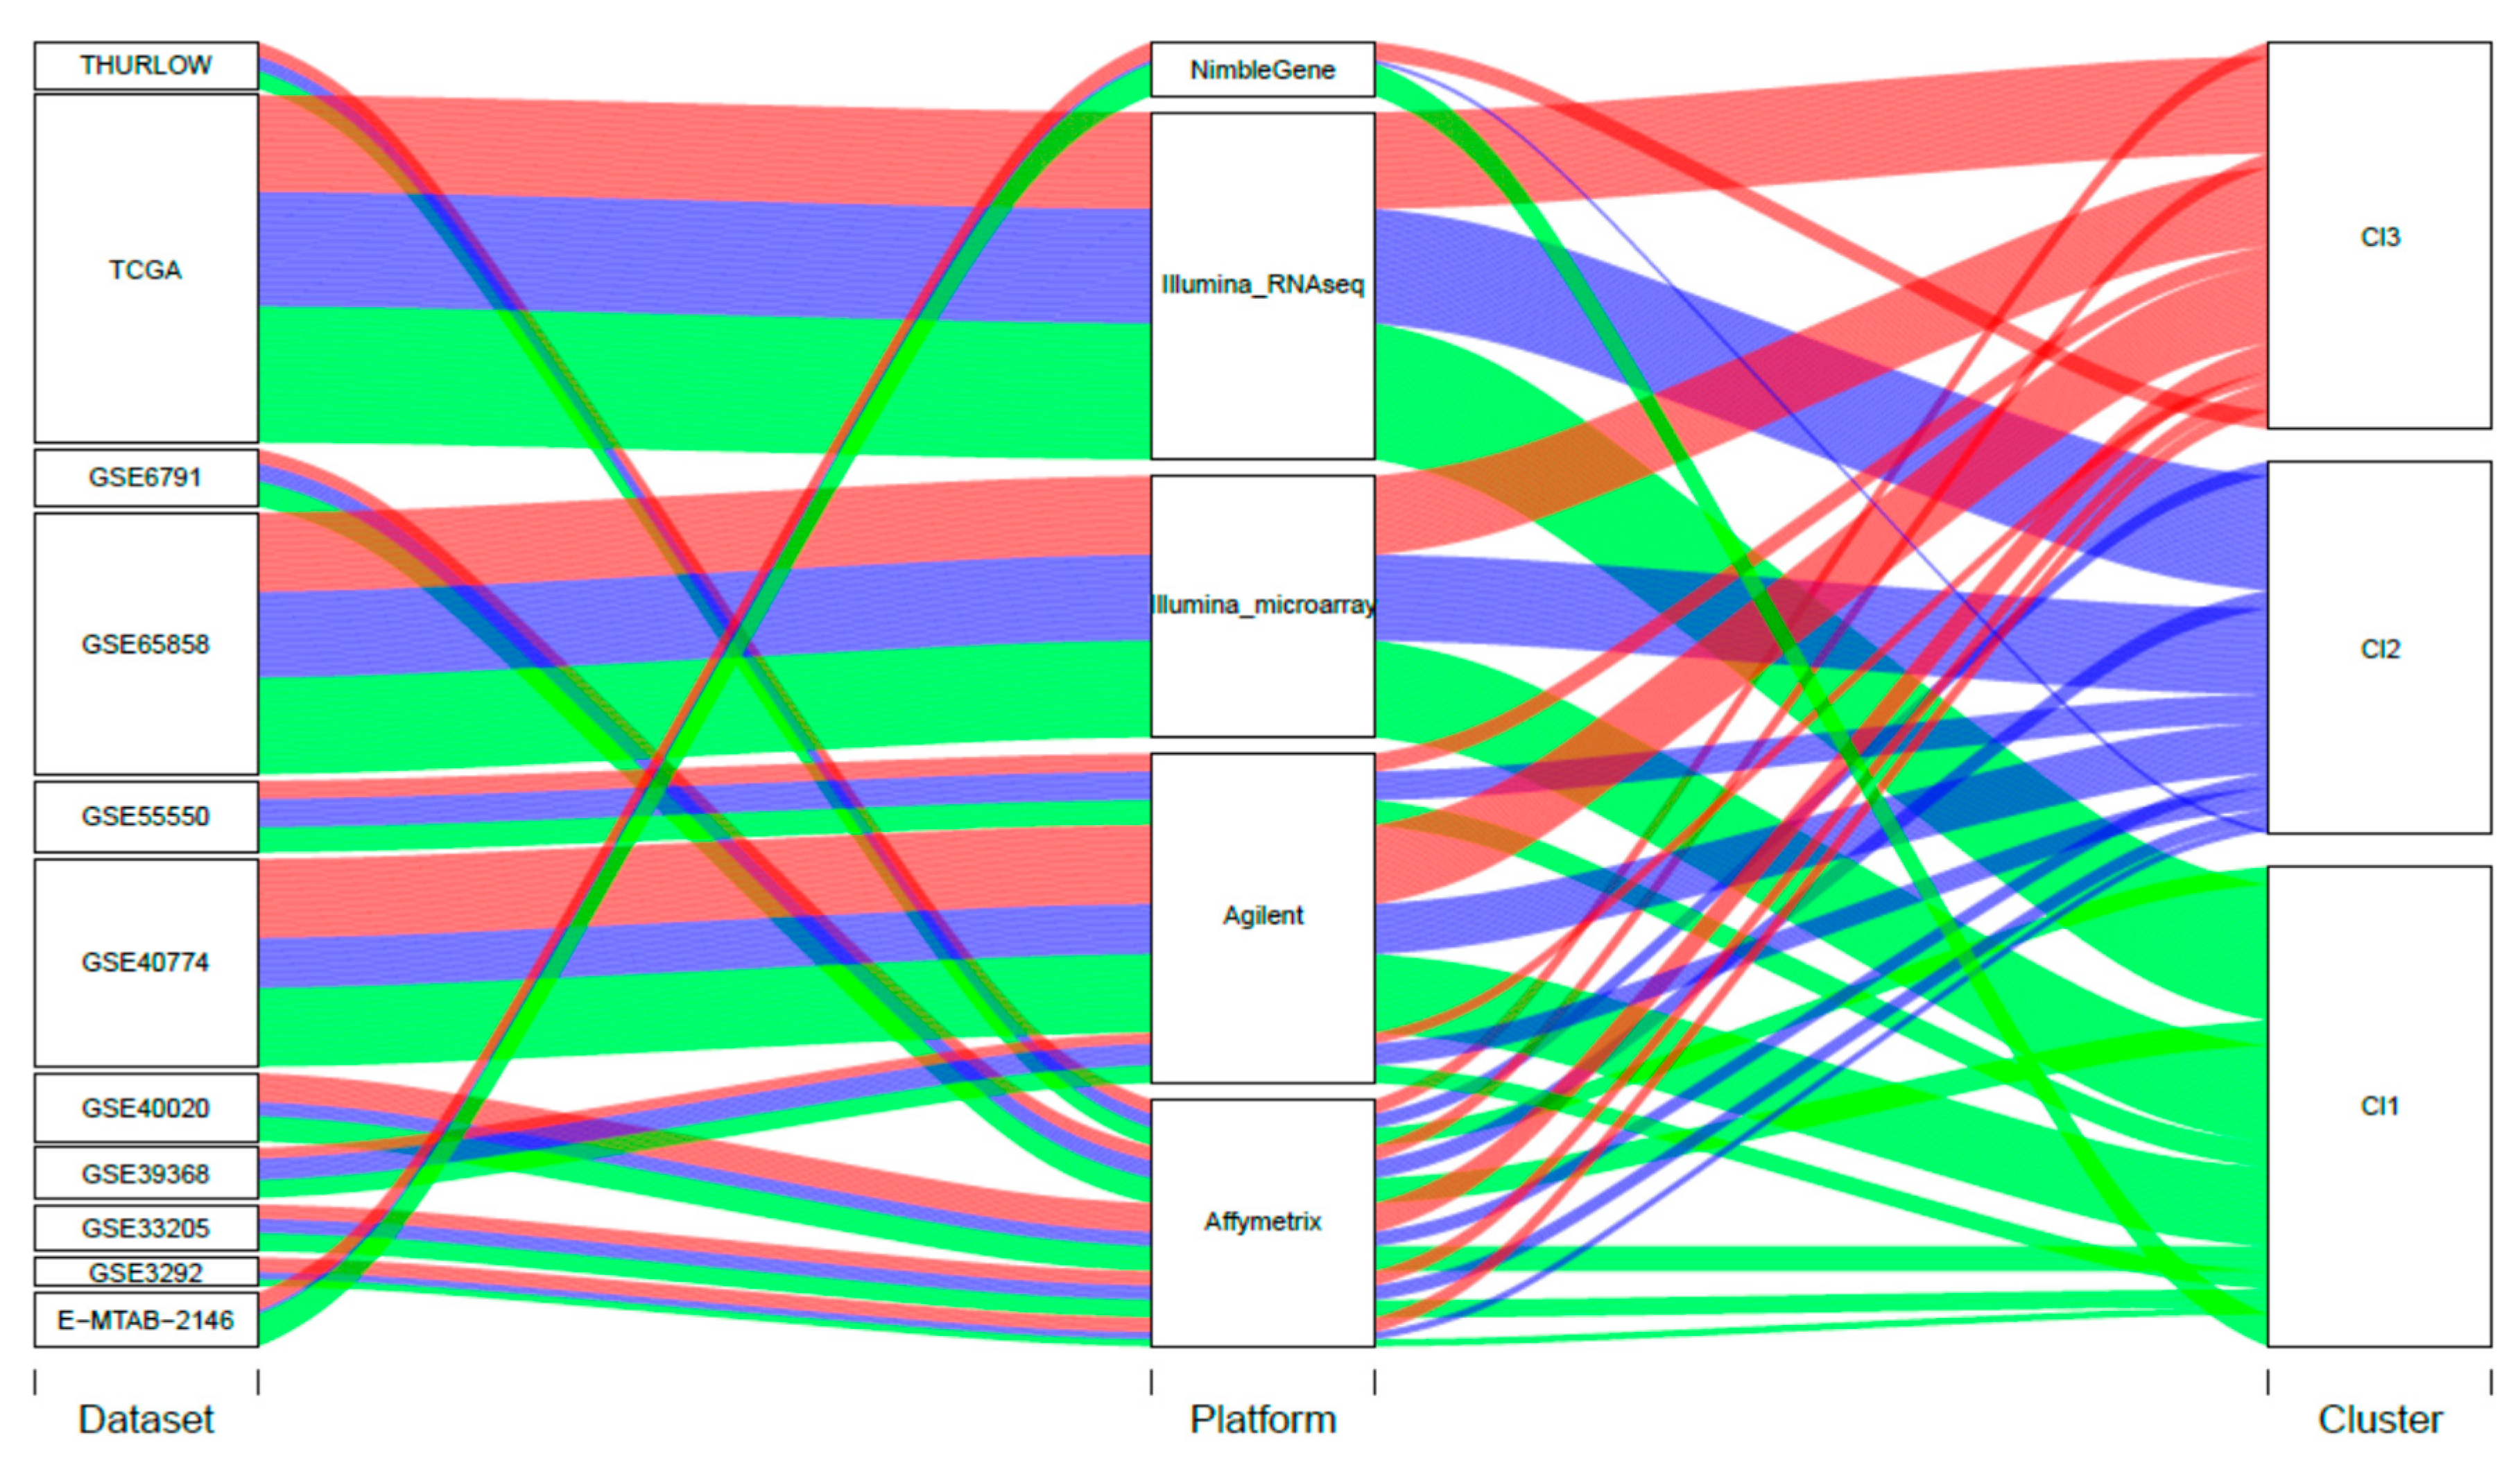
2.1. Case Material
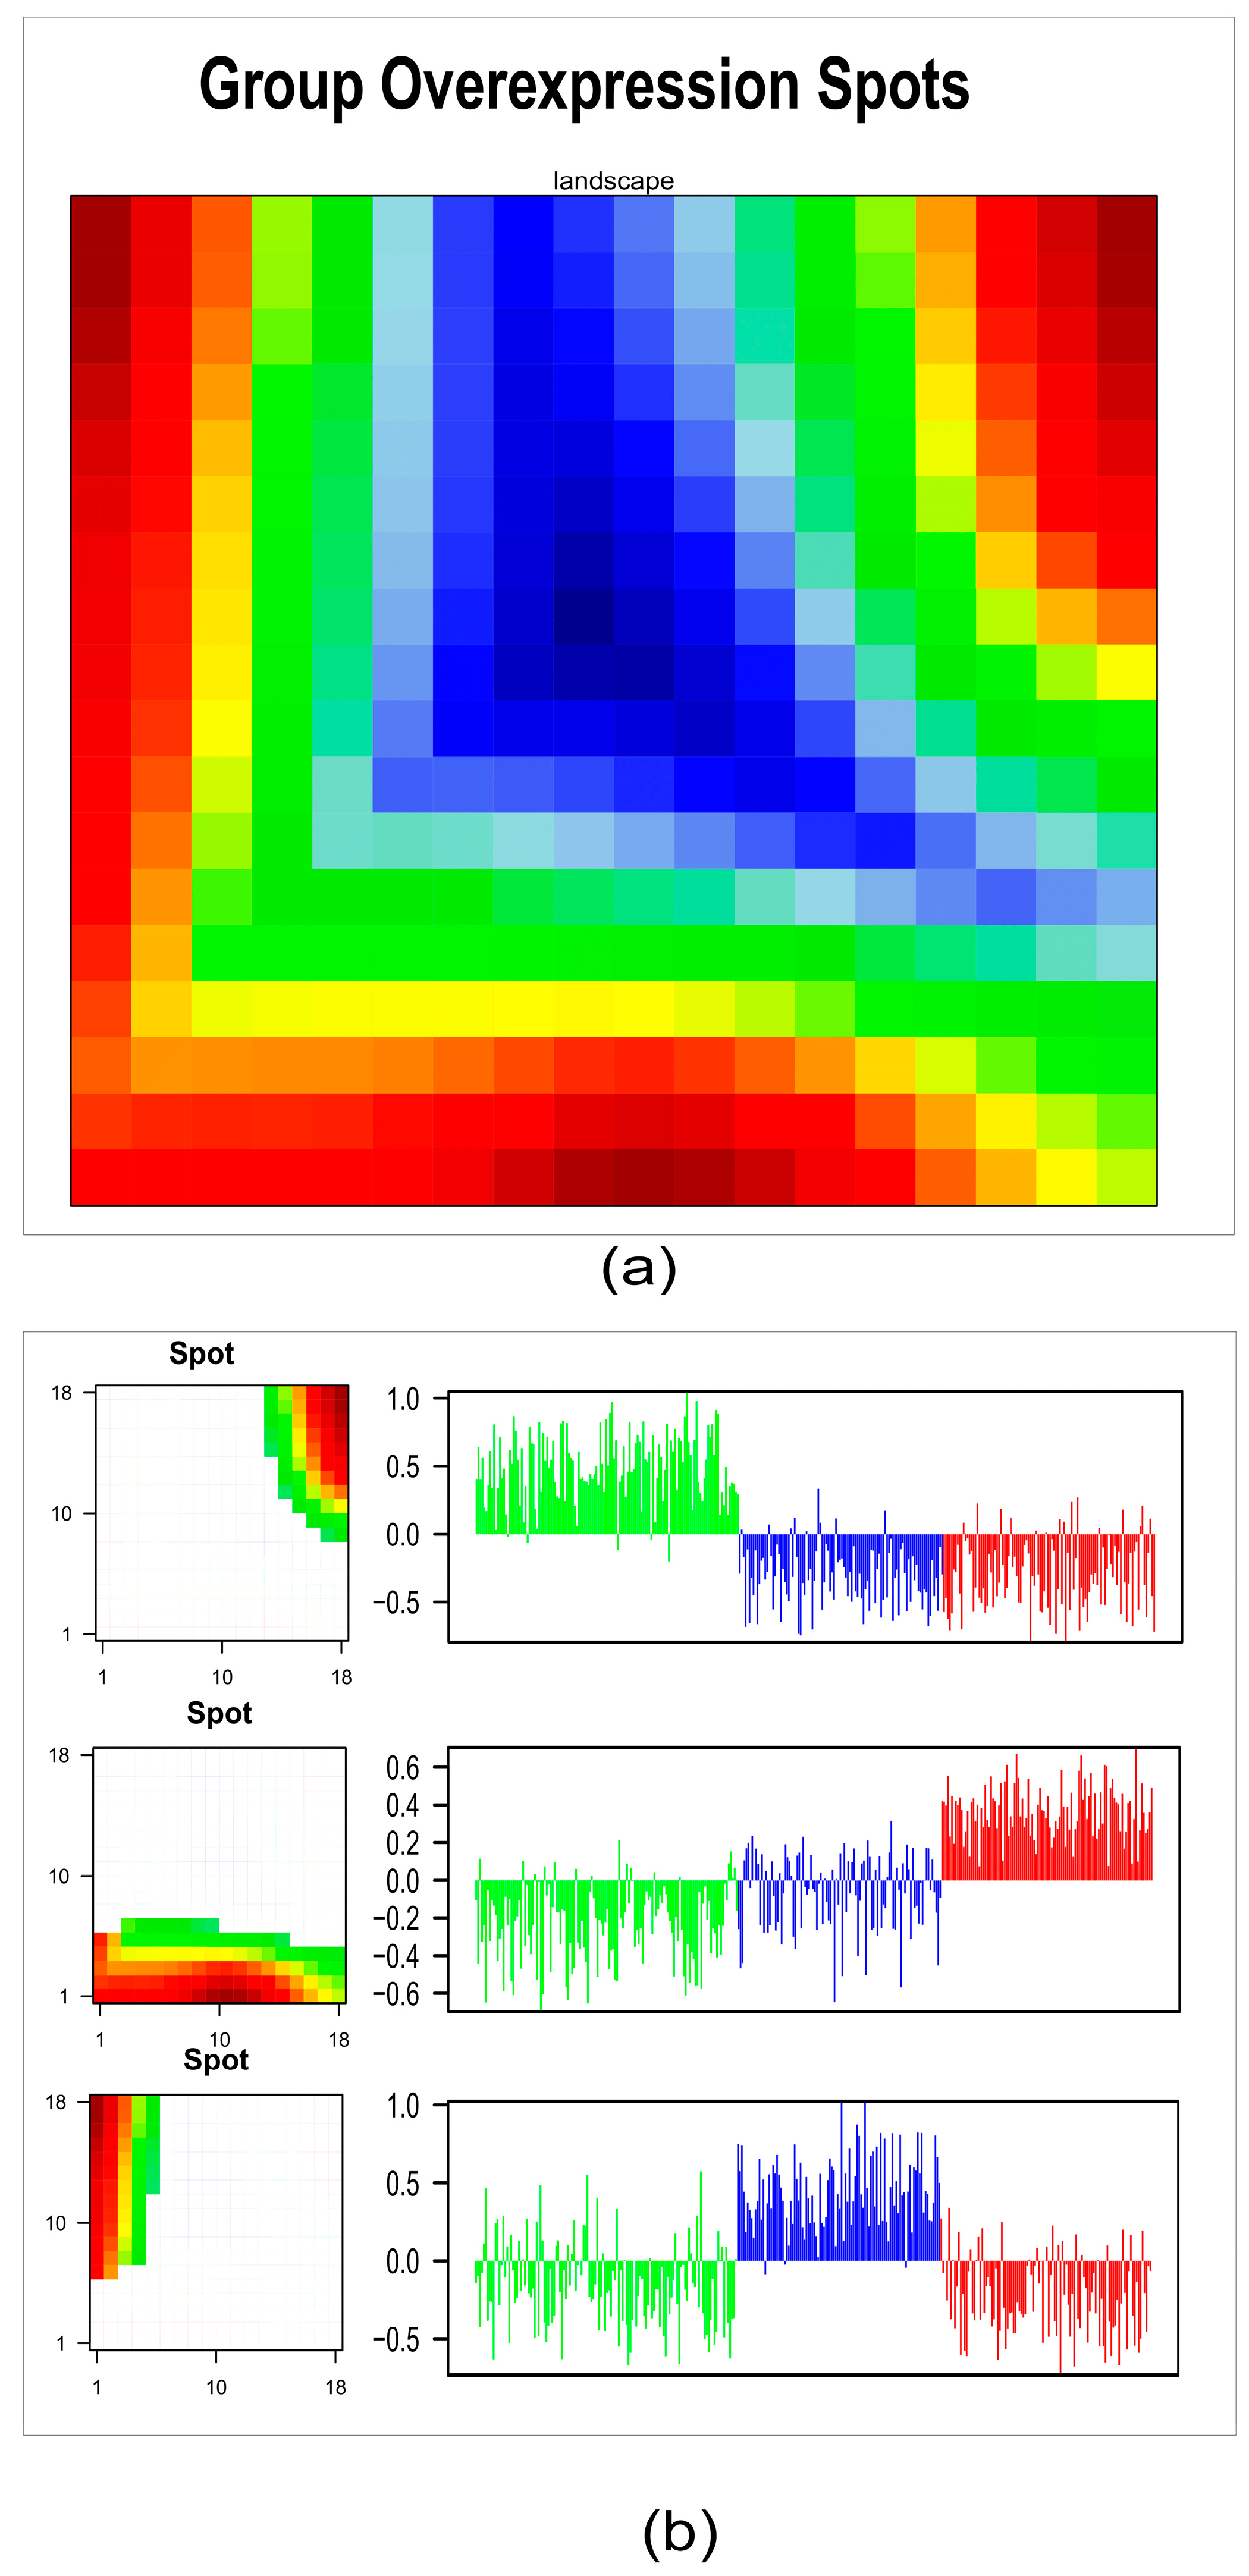
2.2. HPV-Positive HNSCC Tumor Clusters: First-Level Self-Organizing Map (SOM) and Unsupervised Clustering Analysis
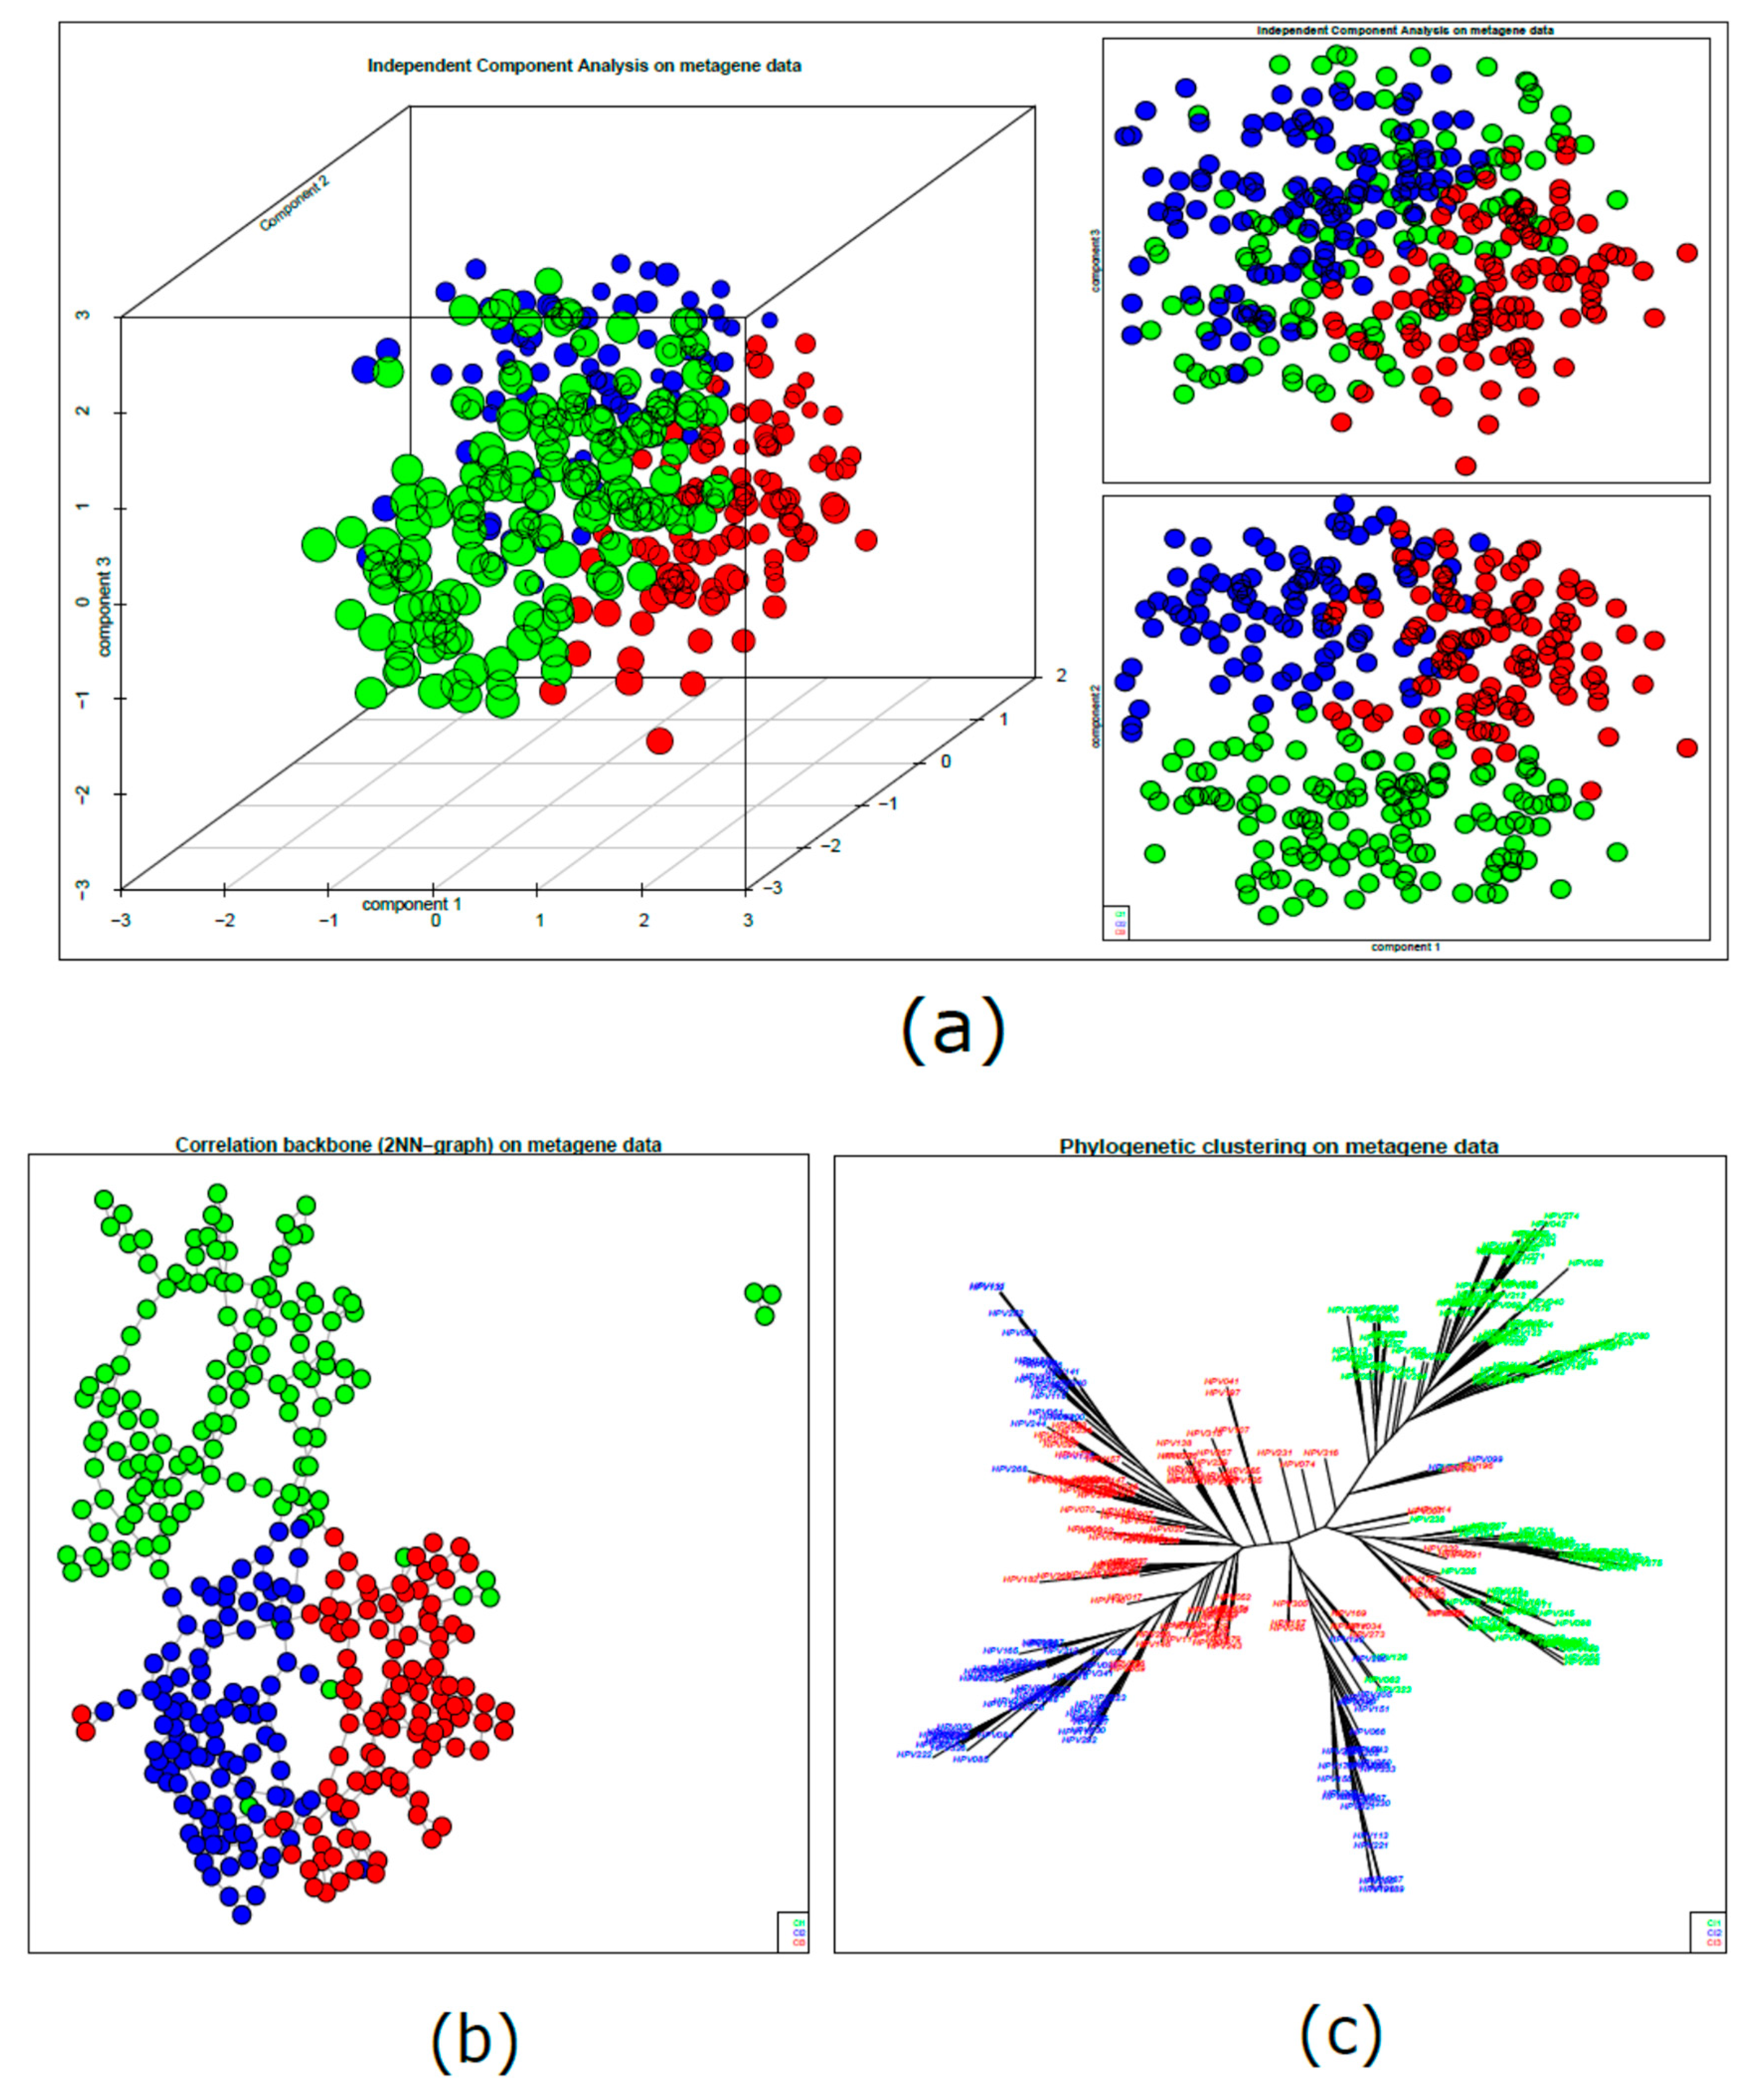
2.3. HPV-Positive HNSCC Cluster Similarity Relationships: Second-Level SOM
2.4. Tumor Microenvironment Landscape
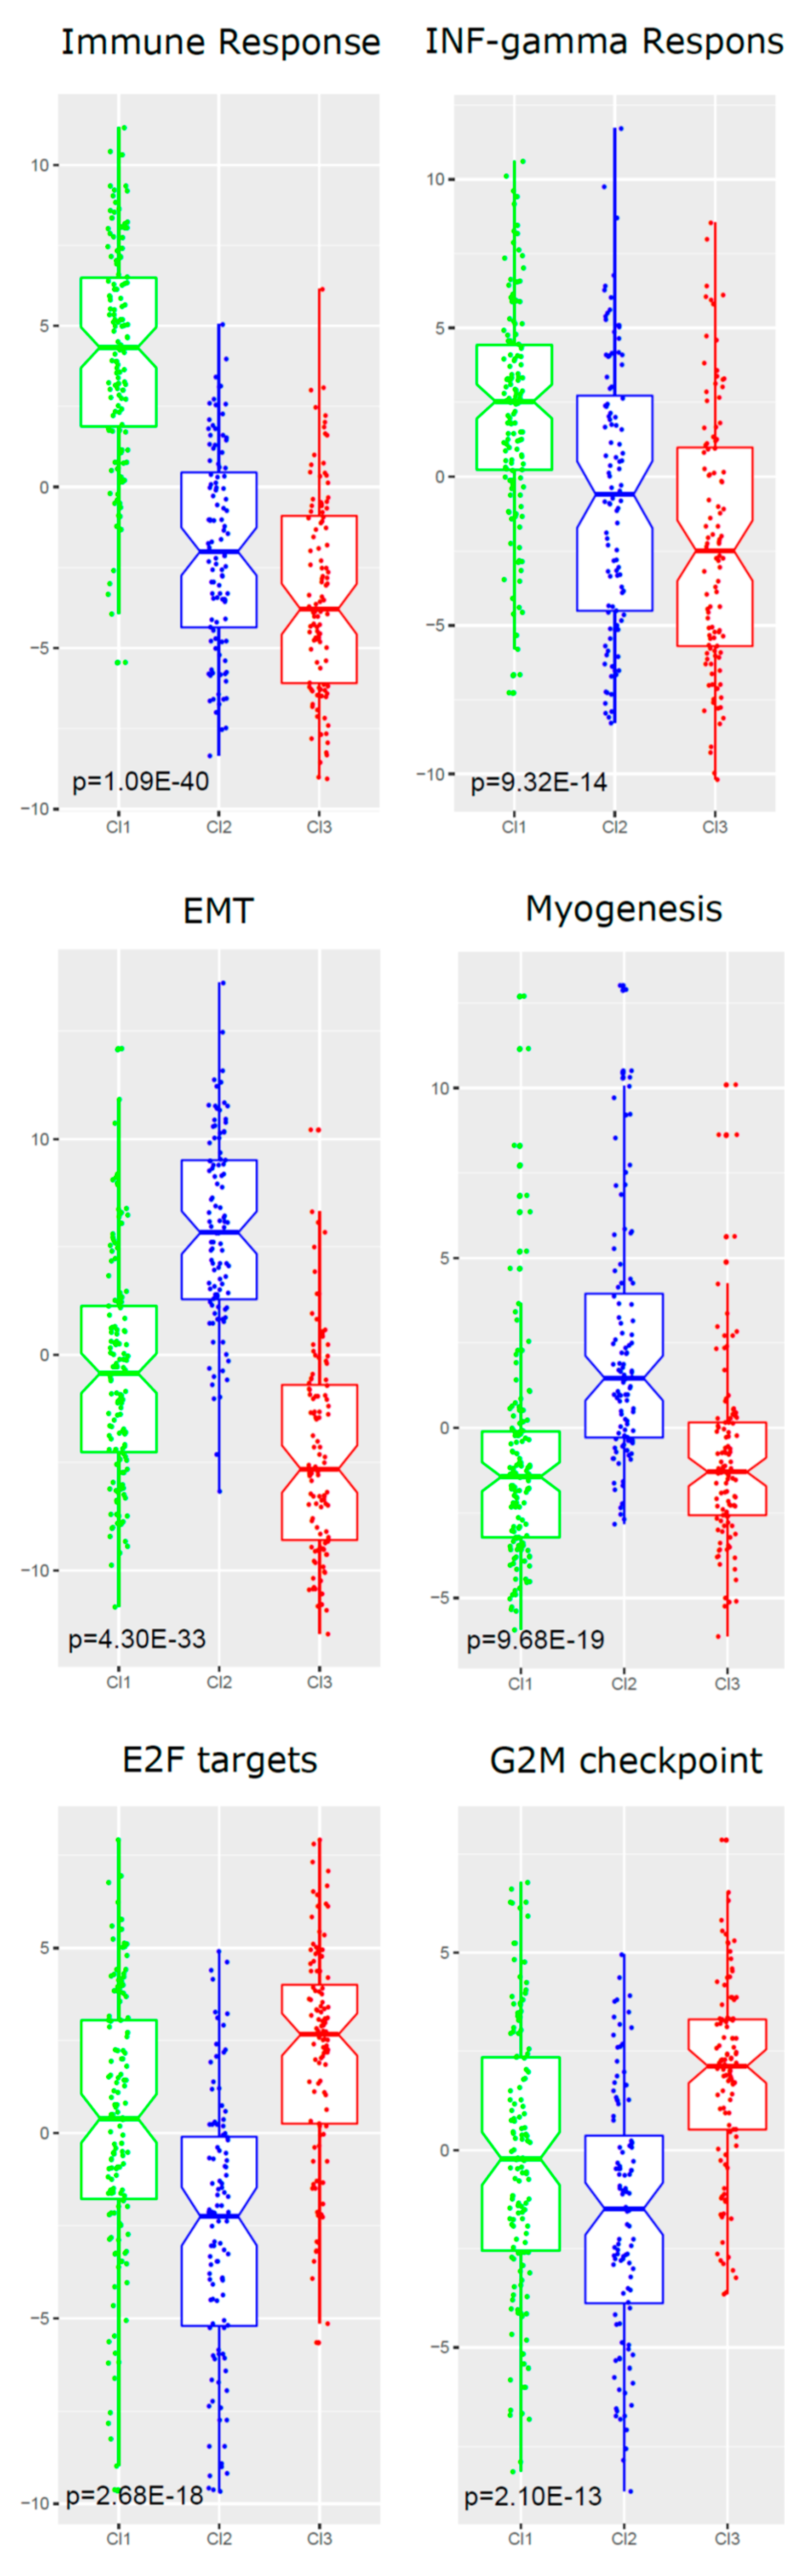
2.5. Functional Analyses of Subtypes
2.6. HPV Presence/Integration and Its Association with Clusters
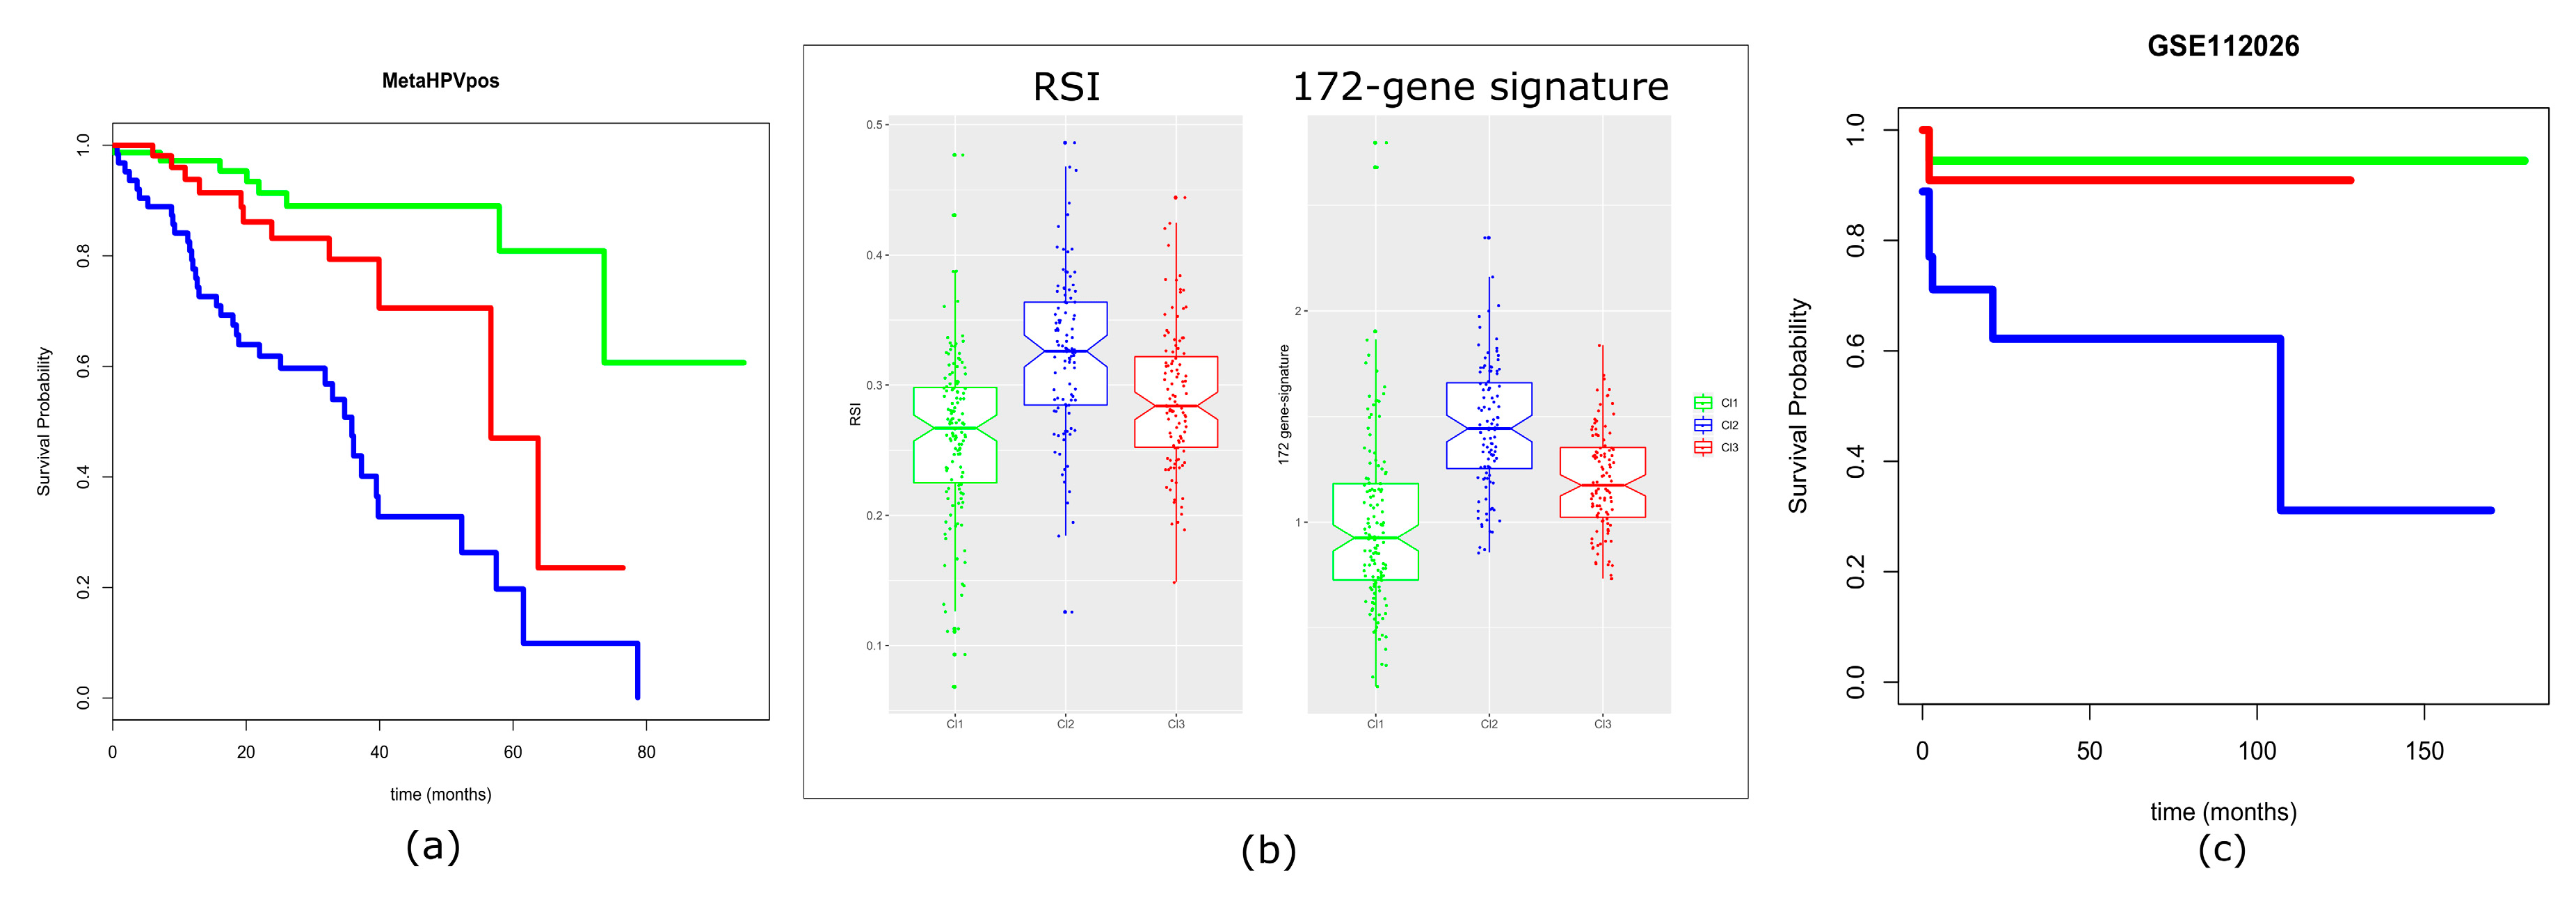
2.7. Prognostic Values of the Three-Subtype Classification
3. Discussion
4. Materials and Methods
4.1. Case Material: Gene Expression and Clinical Data
4.2. Data Preprocessing for Meta-Analysis Dataset Generation
4.3. Tumor Clusters: First-Level SOM
4.4. Tumor Clusters: Unsupervised Clustering Analysis
4.5. Cluster Similarity Relationships: Second-Level SOM Cartography
4.6. Tumor Microenvironment Landscape
4.7. Functional Analyses
4.8. Analysis of Viral Presence/Integration and Its Association with Clusters
4.9. Evaluation of Prognostic Signatures
Supplementary Materials
Author Contributions
Funding
Conflicts of Interest
References
- Fitzmaurice, C.; Allen, C.; Barber, R.M.; Barregard, L.; Bhutta, Z.A.; Brenner, H.; Dicker, D.J.; Chimed-Orchir, O.; Dandona, R.; Dandona, L.; et al. Global, regional, and national cancer incidence, mortality, years of life lost, years lived with disability, and disability-adjusted life-years for 32 cancer groups, 1990 to 2015: A systematic analysis for the global burden of disease study. JAMA Oncol. 2017, 3, 524–548. [Google Scholar] [PubMed]
- Chaturvedi, A.K.; Engels, E.A.; Anderson, W.F.; Gillison, M.L. Incidence trends for human papillomavirus-related and -unrelated oral squamous cell carcinomas in the United States. J. Clin. Oncol. 2008, 26, 612–619. [Google Scholar] [CrossRef] [PubMed]
- Rettig, E.M.; D’Souza, G. Epidemiology of head and neck cancer. Surg. Oncol. Clin. N. Am. 2015, 24, 379–396. [Google Scholar] [CrossRef] [PubMed]
- Gillison, M.L.; Castellsagué, X.; Chaturvedi, A.; Goodman, M.T.; Snijders, P.; Tommasino, M.; Arbyn, M.; Franceschi, S. Eurogin Roadmap: Comparative epidemiology of HPV infection and associated cancers of the head and neck and cervix. Int. J. Cancer 2014, 134, 497–507. [Google Scholar] [CrossRef] [PubMed]
- Marur, S.; Forastiere, A.A. Head and neck cancer: Changing epidemiology, diagnosis, and treatment. Mayo Clin. Proc. 2008, 83, 489–501. [Google Scholar] [CrossRef]
- Fakhry, C.; Westra, W.H.; Li, S.; Cmelak, A.; Ridge, J.A.; Pinto, H.; Forastiere, A.; Gillison, M.L. Improved survival of patients with human papillomavirus-positive head and neck squamous cell carcinoma in a prospective clinical trial. J. Natl. Cancer Inst. 2008, 100, 261–269. [Google Scholar] [CrossRef] [PubMed]
- Martín-Hernán, F.; Sánchez-Hernández, J.G.; Cano, J.; Campo, J.; del Romero, J. Oral cancer, HPV infection and evidence of sexual transmission. Med. Oral Patol. Oral Cir. Bucal 2013, 18, e439–e444. [Google Scholar] [CrossRef]
- Lechner, M.; Fenton, T.; West, J.; Wilson, G.; Feber, A.; Henderson, S.; Thirlwell, C.; Dibra, H.K.; Jay, A.; Butcher, L.; et al. Identification and functional validation of HPV-mediated hypermethylation in head and neck squamous cell carcinoma. Genome Med. 2013, 5, 15. [Google Scholar] [CrossRef]
- Sepiashvili, L.; Bruce, J.P.; Huang, S.H.; O’Sullivan, B.; Liu, F.F.; Kislinger, T. Novel insights into head and neck cancer using next-generation “omic” technologies. Cancer Res. 2015, 75, 480–486. [Google Scholar] [CrossRef]
- Leemans, C.R.; Snijders, P.J.F.; Brakenhoff, R.H. The molecular landscape of head and neck cancer. Nat. Rev. Cancer 2018, 18, 269–282. [Google Scholar] [CrossRef]
- Mirghani, H.; Blanchard, P. Treatment de-escalation for HPV-driven oropharyngeal cancer: Where do we stand? Clin. Transl. Radiat. Oncol. 2017, 8, 4–11. [Google Scholar] [CrossRef] [PubMed]
- Keck, M.K.; Zuo, Z.; Khattri, A.; Stricker, T.P.; Brown, C.D.; Imanguli, M.; Rieke, D.; Endhardt, K.; Fang, P.; Brägelmann, J.; et al. Integrative analysis of head and neck cancer identifies two biologically distinct HPV and three non-HPV subtypes. Clin. Cancer Res. 2015, 21, 870–881. [Google Scholar] [CrossRef] [PubMed]
- Zhang, Y.; Koneva, L.A.; Virani, S.; Arthur, A.E.; Virani, A.; Hall, P.B.; Warden, C.D.; Carey, T.E.; Chepeha, D.B.; Prince, M.E.; et al. Subtypes of HPV-Positive Head and Neck Cancers Are Associated with HPV Characteristics, Copy Number Alterations, PIK3CA Mutation, and Pathway Signatures. Clin. Cancer Res. 2016, 22, 4735–4745. [Google Scholar] [CrossRef] [PubMed] [Green Version]
- Wirth, H.; Loffler, M.; von Bergen, M.; Binder, H. Expression cartography of human tissues using self organizing maps. BMC Bioinform. 2011, 12, 306. [Google Scholar] [CrossRef] [PubMed]
- Tamayo, P.; Slonim, D.; Mesirov, J.; Zhu, Q.; Kitareewan, S.; Dmitrovsky, E.; Lander, E.S.; Golub, T.R. Interpreting patterns of gene expression with self-organizing maps: Methods and application to hematopoietic differentiation. Proc. Natl. Acad. Sci. USA 1999, 96, 2907–2912. [Google Scholar] [CrossRef] [PubMed] [Green Version]
- Törönen, P.; Kolehmainen, M.; Wong, G.; Castrén, E. Analysis of gene expression data using self-organizing maps. FEBS Lett. 1999, 451, 142–146. [Google Scholar] [CrossRef]
- Loeffler-Wirth, H.; Kreuz, M.; Hopp, L.; Arakelyan, A.; Haake, A.; Cogliatti, S.B.; Feller, A.C.; Hansmann, M.L.; Lenze, D.; Möller, P.; et al. A modular transcriptome map of mature B cell lymphomas. Genome Med. 2019, 11, 27. [Google Scholar] [CrossRef] [Green Version]
- Kunz, M.; Löffler-Wirth, H.; Dannemann, M.; Willscher, E.; Doose, G.; Kelso, J.; Kottek, T.; Nickel, B.; Hopp, L.; Landsberg, J.; et al. RNA-seq analysis identifies different transcriptomic types and developmental trajectories of primary melanomas. Oncogene 2018, 37, 6136–6151. [Google Scholar] [CrossRef]
- Venuti, A.; Paolini, F. HPV detection methods in head and neck cancer. Head Neck Pathol. 2012, 6 (Suppl. 1), S63–S74. [Google Scholar] [CrossRef]
- Koneva, L.A.; Zhang, Y.; Virani, S.; Hall, P.B.; McHugh, J.B.; Chepeha, D.B.; Wolf, G.; Carey, T.E.; Rozek, L.S.; Sartor, M.A. HPV Integration in HNSCC Correlates with Survival Outcomes, Immune Response Signatures, and Candidate Drivers. Mol. Cancer Res. 2017. [Google Scholar] [CrossRef]
- De Cecco, L.; Bossi, P.; Locati, L.; Canevari, S.; Licitra, L. Comprehensive gene expression meta-analysis of head and neck squamous cell carcinoma microarray data defines a robust survival predictor. Ann. Oncol. 2014, 25, 1628–1635. [Google Scholar] [CrossRef] [PubMed]
- Eschrich, S.A.; Pramana, J.; Zhang, H.; Zhao, H.; Boulware, D.; Lee, J.H.; Bloom, G.; Rocha-Lima, C.; Kelley, S.; Calvin, D.P.; et al. A gene expression model of intrinsic tumor radiosensitivity: Prediction of response and prognosis after chemoradiation. Int. J. Radiat. Oncol. Biol. Phys. 2009, 75, 489–496. [Google Scholar] [CrossRef]
- Ando, M.; Saito, Y.; Xu, G.; Bui, N.Q.; Medetgul-Ernar, K.; Pu, M.; Fisch, K.; Ren, S.; Sakai, A.; Fukusumi, T.; et al. Chromatin dysregulation and DNA methylation at transcription start sites associated with transcriptional repression in cancers. Nat. Commun. 2019, 10, 2188. [Google Scholar] [CrossRef]
- Gleber-Netto, F.O.; Rao, X.; Guo, T.; Xi, Y.; Gao, M.; Shen, L.; Erikson, K.; Kalu, N.N.; Ren, S.; Xu, G.; et al. Variations in HPV function are associated with survival in squamous cell carcinoma. JCI Insight 2019. [Google Scholar] [CrossRef] [PubMed]
- Ang, K.K.; Harris, J.; Wheeler, R.; Weber, R.; Rosenthal, D.I.; Nguyen-Tân, P.F.; Westra, W.H.; Chung, C.H.; Jordan, R.C.; Lu, C.; et al. Human papillomavirus and survival of patients with oropharyngeal cancer. N. Engl. J. Med. 2010, 363, 24–35. [Google Scholar] [CrossRef] [PubMed]
- Blitzer, G.C.; Smith, M.A.; Harris, S.L.; Kimple, R.J. Review of the clinical and biologic aspects of human papillomavirus-positive squamous cell carcinomas of the head and neck. Int. J. Radiat. Oncol. Biol. Phys. 2014, 88, 761–770. [Google Scholar] [CrossRef]
- Chen, Y.P.; Wang, Y.Q.; Lv, J.W.; Li, Y.Q.; Chua, M.L.K.; Le, Q.T.; Lee, N.; Colevas, A.D.; Seiwert, T.; Hayes, D.N.; et al. Identification and validation of novel microenvironment-based immune molecular subgroups of head and neck squamous cell carcinoma: Implications for immunotherapy. Ann. Oncol. 2019. [Google Scholar] [CrossRef]
- Suarez-Carmona, M.; Lesage, J.; Cataldo, D.; Gilles, C. EMT and inflammation: Inseparable actors of cancer progression. Mol. Oncol. 2017, 11, 805–823. [Google Scholar] [CrossRef]
- Nordsmark, M.; Bentzen, S.M.; Rudat, V.; Brizel, D.; Lartigau, E.; Stadler, P.; Becker, A.; Adam, M.; Molls, M.; Dunst, J.; et al. Prognostic value of tumor oxygenation in 397 head and neck tumors after primary radiation therapy. An international multi-center study. Radiother. Oncol. 2005, 77, 18–24. [Google Scholar] [CrossRef]
- Speel, E.J. HPV Integration in Head and Neck Squamous Cell Carcinomas: Cause and Consequence. Recent Results Cancer Res. 2017, 206, 57–72. [Google Scholar]
- Nulton, T.J.; Nak-Kyeong, K.; DiNardo, L.J.; Morgan, I.M.; Windle, B. Patients with integrated HPV16 in head and neck cancer show poor survival. Oral Oncol. 2018, 80, 52–55. [Google Scholar] [CrossRef] [PubMed]
- Nulton, T.J.; Olex, A.L.; Dozmorov, M.; Morgan, I.M.; Windle, B. Analysis of The Cancer Genome Atlas sequencing data reveals novel properties of the human papillomavirus 16 genome in head and neck squamous cell carcinoma. Oncotarget 2017, 17684–17699. [Google Scholar] [CrossRef]
- Li, H.; Torabi, S.J.; Yarbrough, W.G.; Mehra, S.; Osborn, H.A.; Judson, B. Association of Human Papillomavirus Status at Head and Neck Carcinoma Subsites With Overall Survival. JAMA Otolaryngol. Head Neck Surg. 2018, 144, 519–525. [Google Scholar] [CrossRef] [PubMed] [Green Version]
- Orlandi, E.; Alfieri, S.; Simon, C.; Trama, A.; Licitra, L.; RARECAREnet Working Group. Treatment challenges in and outside a network setting: Head and neck cancers. Eur. J. Surg. Oncol. 2019, 45, 40–45. [Google Scholar] [CrossRef] [PubMed]
- Brazma, A.; Hingamp, P.; Quackenbush, J.; Sherlock, G.; Spellman, P.; Stoeckert, C.; Aach, J.; Ansorge, W.; Ball, C.A.; Causton, H.C.; et al. Minimum information about a microarray experiment (MIAME)-toward standards for microarray data. Nat. Genet. 2001, 29, 365–371. [Google Scholar] [CrossRef]
- Slebos, R.J.; Yi, Y.; Ely, K.; Carter, J.; Evjen, A.; Zhang, X.; Shyr, Y.; Murphy, B.M.; Cmelak, A.J.; Burkey, B.B.; et al. Gene expression differences associated with human papillomavirus status in head and neck squamous cell carcinoma. Clin. Cancer Res. 2006, 12 Pt 1, 701–709. [Google Scholar] [CrossRef]
- Pyeon, D.; Newton, M.A.; Lambert, P.F.; den Boon, J.A.; Sengupta, S.; Marsit, C.J.; Woodworth, C.D.; Connor, J.P.; Haugen, T.H.; Smith, E.M.; et al. Fundamental differences in cell cycle deregulation in human papillomavirus-positive and human papillomavirus-negative head/neck and cervical cancers. Cancer Res. 2007, 67, 4605–4619. [Google Scholar] [CrossRef]
- Walter, V.; Yin, X.; Wilkerson, M.D.; Cabanski, C.R.; Zhao, N.; Du, Y.; Ang, M.K.; Hayward, M.C.; Salazar, A.H.; Hoadley, K.A.; et al. Molecular subtypes in head and neck cancer exhibit distinct patterns of chromosomal gain and loss of canonical cancer genes. PLoS ONE 2013, 8, e56823. [Google Scholar] [CrossRef]
- Sun, W.; Gaykalova, D.A.; Ochs, M.F.; Mambo, E.; Arnaoutakis, D.; Liu, Y.; Loyo, M.; Agrawal, N.; Howard, J.; Li, R.; et al. Activation of the NOTCH pathway in head and neck cancer. Cancer Res. 2014, 74, 1091–1104. [Google Scholar] [CrossRef]
- Thibodeau, B.J.; Geddes, T.J.; Fortier, L.E.; Ahmed, S.; Pruetz, B.L.; Wobb, J.; Chen, P.; Wilson, G.D.; Akervall, J.A. Gene Expression Characterization of HPV Positive Head and Neck Cancer to Predict Response to Chemoradiation. Head Neck Pathol. 2015, 9, 345–353. [Google Scholar] [CrossRef]
- Tomar, S.; Graves, C.A.; Altomare, D.; Kowli, S.; Kassler, S.; Sutkowski, N.; Gillespie, M.B.; Creek, K.E.; Pirisi, L. Human papillomavirus status and gene expression profiles of oropharyngeal and oral cancers from European American and African American patients. Head Neck 2016, 38 (Suppl. 1), E694–E704. [Google Scholar] [CrossRef]
- Wichmann, G.; Rosolowski, M.; Krohn, K.; Kreuz, M.; Boehm, A.; Reiche, A.; Scharrer, U.; Halama, D.; Bertolini, J.; Bauer, U.; et al. The role of HPV RNA transcription, immune response-related gene expression and disruptive TP53 mutations in diagnostic and prognostic profiling of head and neck cancer. Int. J. Cancer 2015, 137, 2846–2857. [Google Scholar] [CrossRef]
- Mirghani, H.; Ugolin, N.; Ory, C.; Lefèvre, M.; Baulande, S.; Hofman, P.; St Guily, J.L.; Chevillard, S.; Lacave, R. A predictive transcriptomic signature of oropharyngeal cancer according to HPV16 status exclusively. Oral Oncol. 2014, 50, 1025–1034. [Google Scholar] [CrossRef]
- Thurlow, J.K.; Peña Murillo, C.L.; Hunter, K.D.; Buffa, F.M.; Patiar, S.; Betts, G.; West, C.M.; Harris, A.L.; Parkinson, E.K.; Harrison, P.R.; et al. Spectral clustering of microarray data elucidates the roles of microenvironment remodeling and immune responses in survival of head and neck squamous cell carcinoma. J. Clin. Oncol. 2010, 28, 2881–2888. [Google Scholar] [CrossRef]
- Cancer Genome Atlas Network. Comprehensive genomic characterization of head and neck squamous cell carcinomas. Nature 2015, 517, 576–582. [Google Scholar] [CrossRef] [Green Version]
- Edgar, R.; Domrachev, M.; Lash, A.E. Gene Expression Omnibus: NCBI gene expression and hybridization array data repository. Nucleic Acids Res. 2002, 30, 207–210. [Google Scholar] [CrossRef] [Green Version]
- Kolesnikov, N.; Hastings, E.; Keays, M.; Melnichuk, O.; Tang, Y.A.; Williams, E.; Dylag, M.; Kurbatova, N.; Brandizi, M.; Burdett, T.; et al. ArrayExpress update—Simplifying data submissions. Nucleic Acids Res. 2015, 43, D1113–D1116. [Google Scholar] [CrossRef]
- BIOINFORMATICS @ MANCHESTER. Available online: http://bioinformatics.picr.man.ac.uk/vice/Welcome.vice (accessed on 31 March 2016).
- National Cancer Institute GDC Data Portal. Available online: https://portal.gdc.cancer.gov/repository (accessed on 30 April 2018).
- De Cecco, L.; Nicolau, M.; Giannoccaro, M.; Daidone, M.G.; Bossi, P.; Locati, L.; Licitra, L.; Canevari, S. Head and neck cancer subtypes with biological and clinical relevance: Meta-analysis of gene-expression data. Oncotarget 2015, 6, 9627–9642. [Google Scholar] [CrossRef] [Green Version]
- Simon, R.; Lam, A.; Li, M.C.; Ngan, M.; Menenzes, S.; Zhao, Y. Analysis of gene expression data using BRB-ArrayTools. Cancer Inform. 2007, 3, 11–17. [Google Scholar] [CrossRef]
- Langfelder, P.; Horvath, S. WGCNA: An R package for weighted correlation network analysis. BMC Bioinform. 2008, 9, 559. [Google Scholar] [CrossRef]
- Johnson, W.E.; Li, C.; Rabinovic, A. Adjusting batch effects in microarray expression data using empirical Bayes methods. Biostatistics 2007, 8, 118–127. [Google Scholar] [CrossRef]
- Kohonen, T. Self-organized formation of topologically correct feature maps. Biol. Cybern. 1982, 43, 59–69. [Google Scholar] [CrossRef]
- Löffler-Wirth, H.; Kalcher, M.; Binder, H. oposSOM: R-package for high-dimensional portraying of genome-wide expression landscapes on bioconductor. Bioinformatics 2015, 31, 3225–3227. [Google Scholar] [CrossRef]
- Yan, J. Som: Self-Organizing Map. 2010 R Package. Available online: Cran.r-project.org/web/packages/som (accessed on 30 November 2018).
- National Cancer Institute. Available online: https://brb.nci.nih.gov/BRB-ArrayTools/index.html (accessed on 30 November 2018).
- Wilkerson, M.D.; Hayes, D.N. ConsensusClusterPlus: A class discovery tool with confidence assessments and item tracking. Bioinformatics 2010, 26, 1572–1573. [Google Scholar] [CrossRef]
- Kaufman, L.; Rousseeuw, P. Clustering by Means of Medoids. In Proceedings of the Statistical Data Analysis Based on the L1 Norm and Related Methods, Neuchâtel, Switzerland, 31 August–4 September 1987; Dodge, Y., Ed.; Elsevier Science Pub. Co.: Amsterdam, The Netherlands, 1987; pp. 405–416. [Google Scholar]
- Monti, S.; Tamayo, P.; Mesirov, J.; Todd, G. Consensus Clustering: A Resampling-Based Method for Class Discovery and Visualization of Gene Expression Microarray Data. Mach. Learn. 2003, 52, 91–118. [Google Scholar] [CrossRef]
- Warnes, G.; Liu, P.; Li, F. Ssize: Estimate Microarray Sample Size. R Package Version 1.54.0. Available online: http://bioconductor.org/packages/release/bioc/html/ssize.html (accessed on 31 May 2017).
- Rosvall, M.; Bergstrom, C.T. Mapping Change in Large Networks. PLoS ONE 2010, 5, e8694. [Google Scholar] [CrossRef]
- Hoffman, G.E.; Schadt, E.E. variancePartition: Interpreting drivers of variation in complex gene expression studies. BMC Bioinform. 2016, 17. [Google Scholar] [CrossRef]
- Hyvärinen, A.; Oja, E. Independent component analysis: Algorithms and applications. Neural Netw. 2000, 13, 411–430. [Google Scholar] [CrossRef]
- FastICA. Available online: https://CRAN.R-project.org/package=fastICA (accessed on 30 November 2018).
- Paradis, E.; Claude, J.; Strimmer, K. APE: Analyses of Phylogenetics and Evolution in R language. Bioinformatics 2004, 20, 289–290. [Google Scholar] [CrossRef] [Green Version]
- Saitou, N.; Nei, M. The neighbor-joining method: A new method for reconstructing phylogenetic trees. Mol. Biol. Evol. 1987, 4, 406–425. [Google Scholar]
- xCell. Available online: http://xcell.ucsf.edu/ (accessed on 28 February 2019).
- Aran, D.; Hu, Z.; Butte, A.J. xCell: Digitally portraying the tissue cellular heterogeneity landscape. Genome Biol. 2017, 18, 220. [Google Scholar] [CrossRef]
- Krijthe, J.H. Rtsne: T-Distributed Stochastic Neighbor Embedding Using a Barnes-Hut Implementation. Available online: https://github.com/jkrijthe/Rtsne (accessed on 28 February 2019).
- van der Maaten, L.; Hinton, G. Visualizing data using t-SNE. J. Mach. Learn. Res. 2008, 9, 2579–2605. [Google Scholar]
- Törönen, P.; Ojala, P.J.; Marttinen, P.; Holm, L. Robust extraction of functional signals from gene set analysis using a generalized threshold free scoring function. BMC Bioinform. 2009, 10, 307. [Google Scholar] [CrossRef]
- Chen, Y.; Yao, H.; Thompson, E.J.; Tannir, N.M.; Weinstein, J.N.; Su, X. VirusSeq: Software to identify viruses and their integration sites using next-generation sequencing of human cancer tissue. Bioinformatics 2013, 29, 266–267. [Google Scholar] [CrossRef]
- Law, C.W.; Chen, Y.; Shi, W.; Smyth, G.K. voom: Precision weights unlock linear model analysis tools for RNA-seq read counts. Genome Biol. 2014, 15, R29. [Google Scholar] [CrossRef]
- Hänzelmann, S.; Castelo, R.; Guinney, J. GSVA: Gene set variation analysis for microarray and RNA-Seq data. BMC Bioinform. 2013, 14, 7. [Google Scholar] [CrossRef]
- R Development Core Team. R: A Language and Environment for Statistical Computing. Vienna, Austria: R Foundation for Statistical Computing 2007. Available online: http://www.R-project.org (accessed on 30 September 2018).
- Gentleman, R.C.; Carey, V.J.; Bates, D.M.; Bolstad, B.; Dettling, M.; Dudoit, S.; Ellis, B.; Gautier, L.; Ge, Y.; Gentry, J.; et al. Bioconductor: Open software development for computational biology and bioinformatics. Genome Biol. 2004, 5, R80. [Google Scholar] [CrossRef]


| Characteristics | No. | % |
|---|---|---|
| Age, years | ||
| (median; range) | 57 (35–87) | 77% |
| Not available | 78 | 23% |
| Gender (male:female ratio) | 287/59 | 83%/17% |
| Subsite | ||
| Oropharynx | 235 | 68% |
| Oral cavity | 59 | 17% |
| Larynx | 20 | 6% |
| Hypopharynx | 10 | 3% |
| Not available | 22 | 6% |
| Stage according to TNM edition 7 | ||
| Stage I–II | 35 | 10% |
| Stage III–IV | 229 | 66% |
| Not available | 82 | 24% |
| Smoking | ||
| Smoker | 169 | 49% |
| Not smoker | 76 | 22% |
| Not available | 101 | 29% |
| Availability of follow-up data | ||
| Yes | 197 | 57% |
| No | 149 | 43% |
| Total | 346 | 100% |
| Gene-set ID | HALLMARK Gene-Set Name | Genes a | NES b | Nom p-Value | FDR q-val |
|---|---|---|---|---|---|
| Cl1 vs. Cl2 and Cl3 | |||||
| GS-1 | ALLOGRAFT REJECTION (immune resp) | 130 | 2.89 | <0.00001 | <0.00001 |
| GS-2 | INTERFERON GAMMA RESPONSE | 151 | 2.18 | <0.00001 | <0.00001 |
| GS-3 | IL6 JAK STAT3 SIGNALING | 60 | 1.94 | <0.00001 | <0.00001 |
| GS-4 | INFLAMMATORY RESPONSE | 132 | 1.76 | <0.00001 | 0.0018 |
| GS-5 | KRAS SIGNALING UP | 114 | 1.75 | <0.00001 | 0.0019 |
| Cl2 vs. Cl1 and Cl3 | |||||
| GS-1 | EPITHELIAL MESENCHYMAL TRANSITION | 140 | 3.01 | <0.00001 | <0.00001 |
| GS-2 | MYOGENESIS | 119 | 2.42 | <0.00001 | <0.00001 |
| GS-3 | COAGULATION | 77 | 2.23 | <0.00001 | <0.00001 |
| GS-4 | ANGIOGENESIS | 19 | 2.02 | <0.00001 | <0.00001 |
| GS-5 | HYPOXIA | 133 | 1.90 | <0.00001 | <0.00001 |
| GS-6 | HEDGEHOG SIGNALING | 17 | 1.89 | 0.0020 | <0.00001 |
| GS-7 | UV RESPONSE DN | 97 | 1.78 | <0.00001 | 0.0020 |
| GS-8 | APICAL JUNCTION | 137 | 1.78 | <0.00001 | 0.0020 |
| Cl3 vs. Cl1 and Cl2 | |||||
| GS-1 | E2F TARGETS | 143 | 2.56 | <0.00001 | <0.00001 |
| GS-2 | G2M CHECKPOINT | 150 | 2.24 | <0.00001 | 0.0020 |
© 2019 by the authors. Licensee MDPI, Basel, Switzerland. This article is an open access article distributed under the terms and conditions of the Creative Commons Attribution (CC BY) license (http://creativecommons.org/licenses/by/4.0/).
Share and Cite
Locati, L.D.; Serafini, M.S.; Iannò, M.F.; Carenzo, A.; Orlandi, E.; Resteghini, C.; Cavalieri, S.; Bossi, P.; Canevari, S.; Licitra, L.; et al. Mining of Self-Organizing Map Gene-Expression Portraits Reveals Prognostic Stratification of HPV-Positive Head and Neck Squamous Cell Carcinoma. Cancers 2019, 11, 1057. https://doi.org/10.3390/cancers11081057
Locati LD, Serafini MS, Iannò MF, Carenzo A, Orlandi E, Resteghini C, Cavalieri S, Bossi P, Canevari S, Licitra L, et al. Mining of Self-Organizing Map Gene-Expression Portraits Reveals Prognostic Stratification of HPV-Positive Head and Neck Squamous Cell Carcinoma. Cancers. 2019; 11(8):1057. https://doi.org/10.3390/cancers11081057
Chicago/Turabian StyleLocati, Laura D., Mara S. Serafini, Maria F. Iannò, Andrea Carenzo, Ester Orlandi, Carlo Resteghini, Stefano Cavalieri, Paolo Bossi, Silvana Canevari, Lisa Licitra, and et al. 2019. "Mining of Self-Organizing Map Gene-Expression Portraits Reveals Prognostic Stratification of HPV-Positive Head and Neck Squamous Cell Carcinoma" Cancers 11, no. 8: 1057. https://doi.org/10.3390/cancers11081057
APA StyleLocati, L. D., Serafini, M. S., Iannò, M. F., Carenzo, A., Orlandi, E., Resteghini, C., Cavalieri, S., Bossi, P., Canevari, S., Licitra, L., & De Cecco, L. (2019). Mining of Self-Organizing Map Gene-Expression Portraits Reveals Prognostic Stratification of HPV-Positive Head and Neck Squamous Cell Carcinoma. Cancers, 11(8), 1057. https://doi.org/10.3390/cancers11081057