A Simulation Study of Debris Removal Process in Ultrasonic Vibration Assisted Electrical Discharge Machining (EDM) of Deep Holes †


Abstract
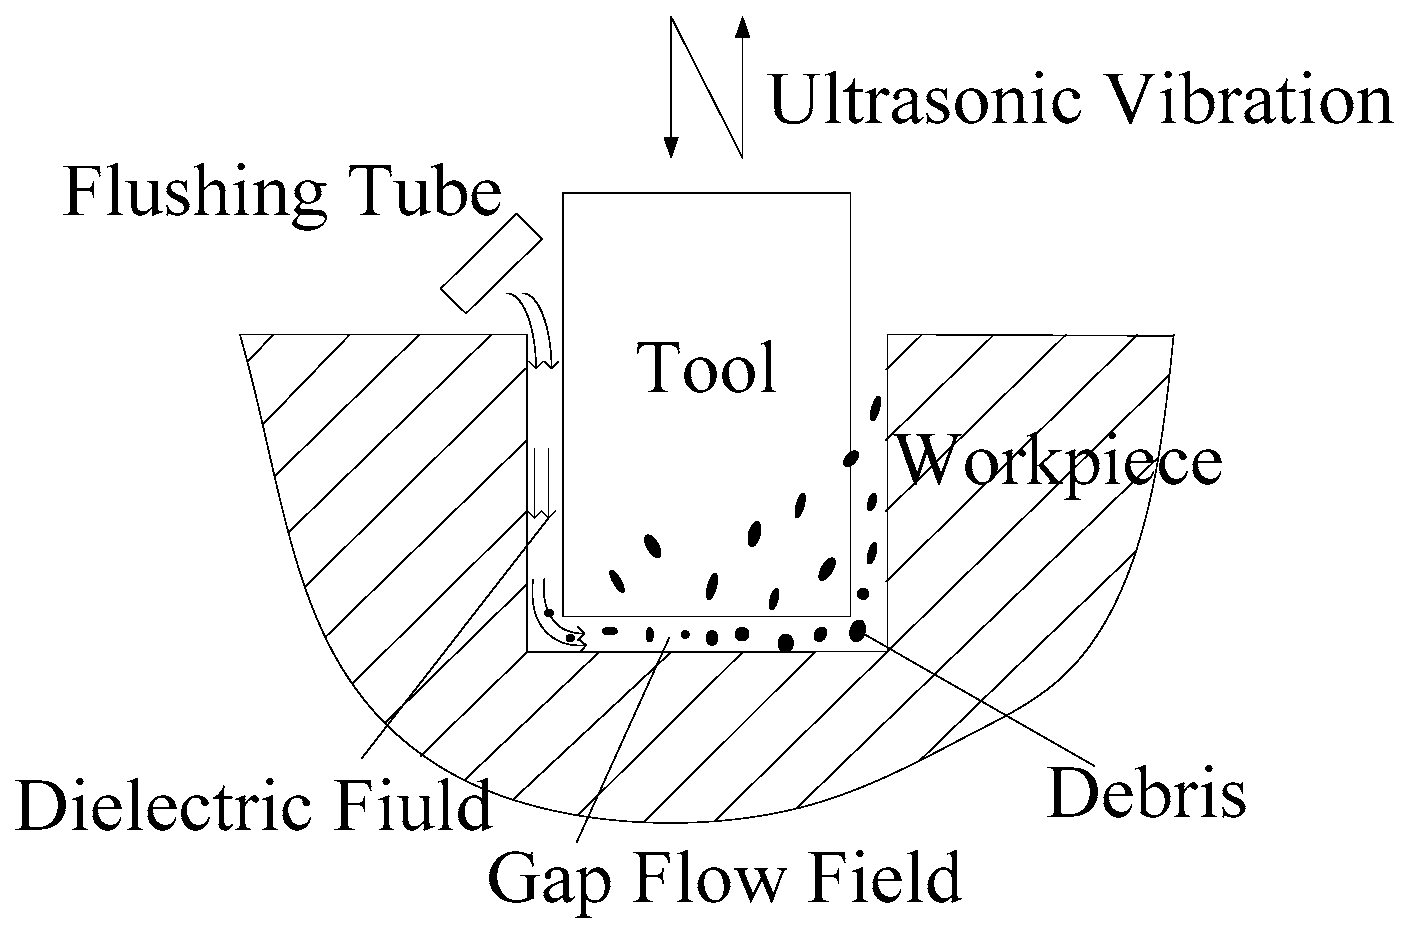
:1. Introduction
2. Establishing for the Model of Inter-Electrode Gap Field
2.1. Mathematical Model of Inter-Electrode Gap Flow Field
- Particle (debris) is considered to be spherical.
- The ambient temperature is considered as a constant and the simulation is not heat dissipates or exchanges.
- The fluid field is considered to be infinite, inviscid and uncompressible. Fluid flows around the particles.
2.1.1. The Fluid Speed along Radial and Circumferential Direction
2.1.2. The Fluid Speed along X Axis
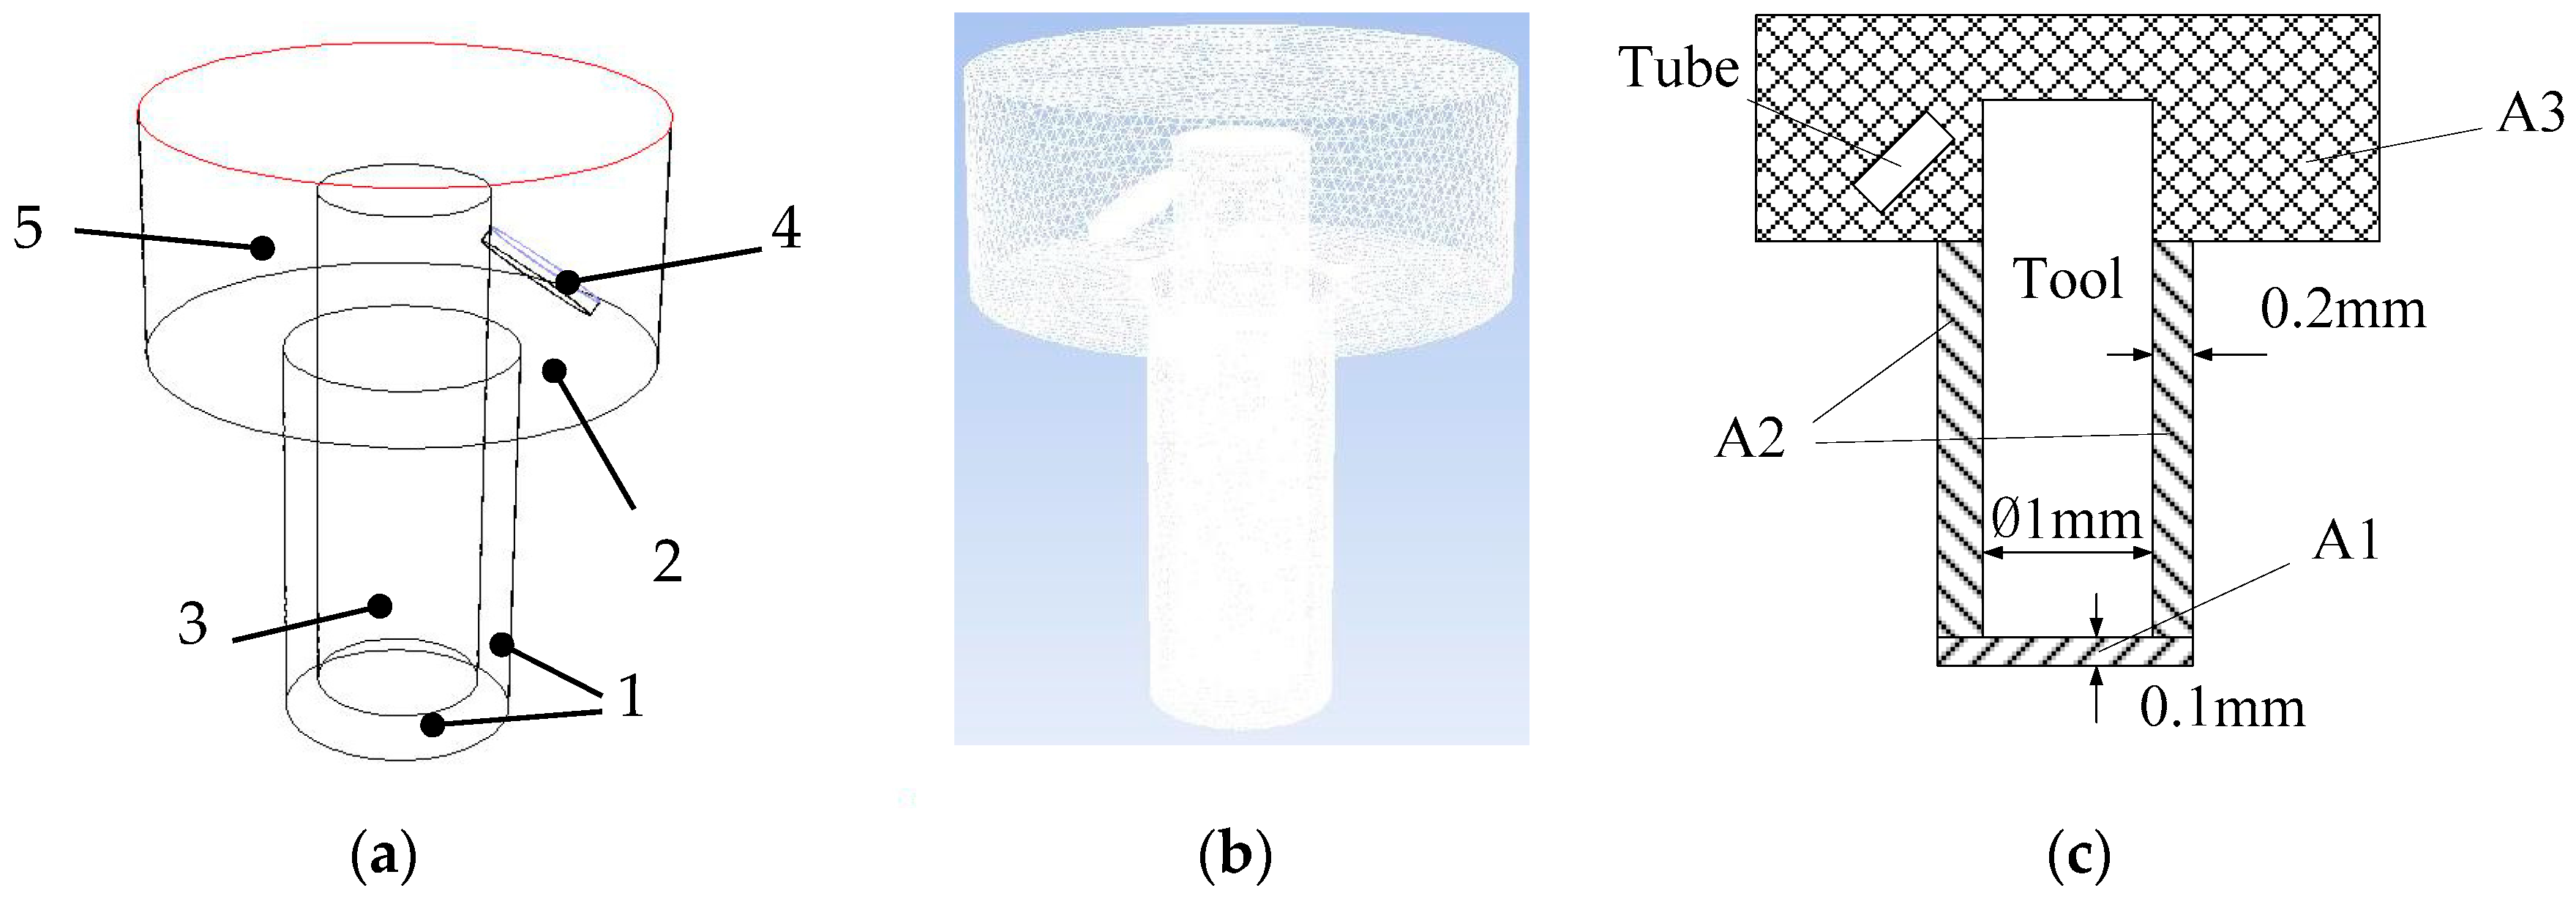
2.2. Modeling for the Inter-Electrode Gap Flow Field
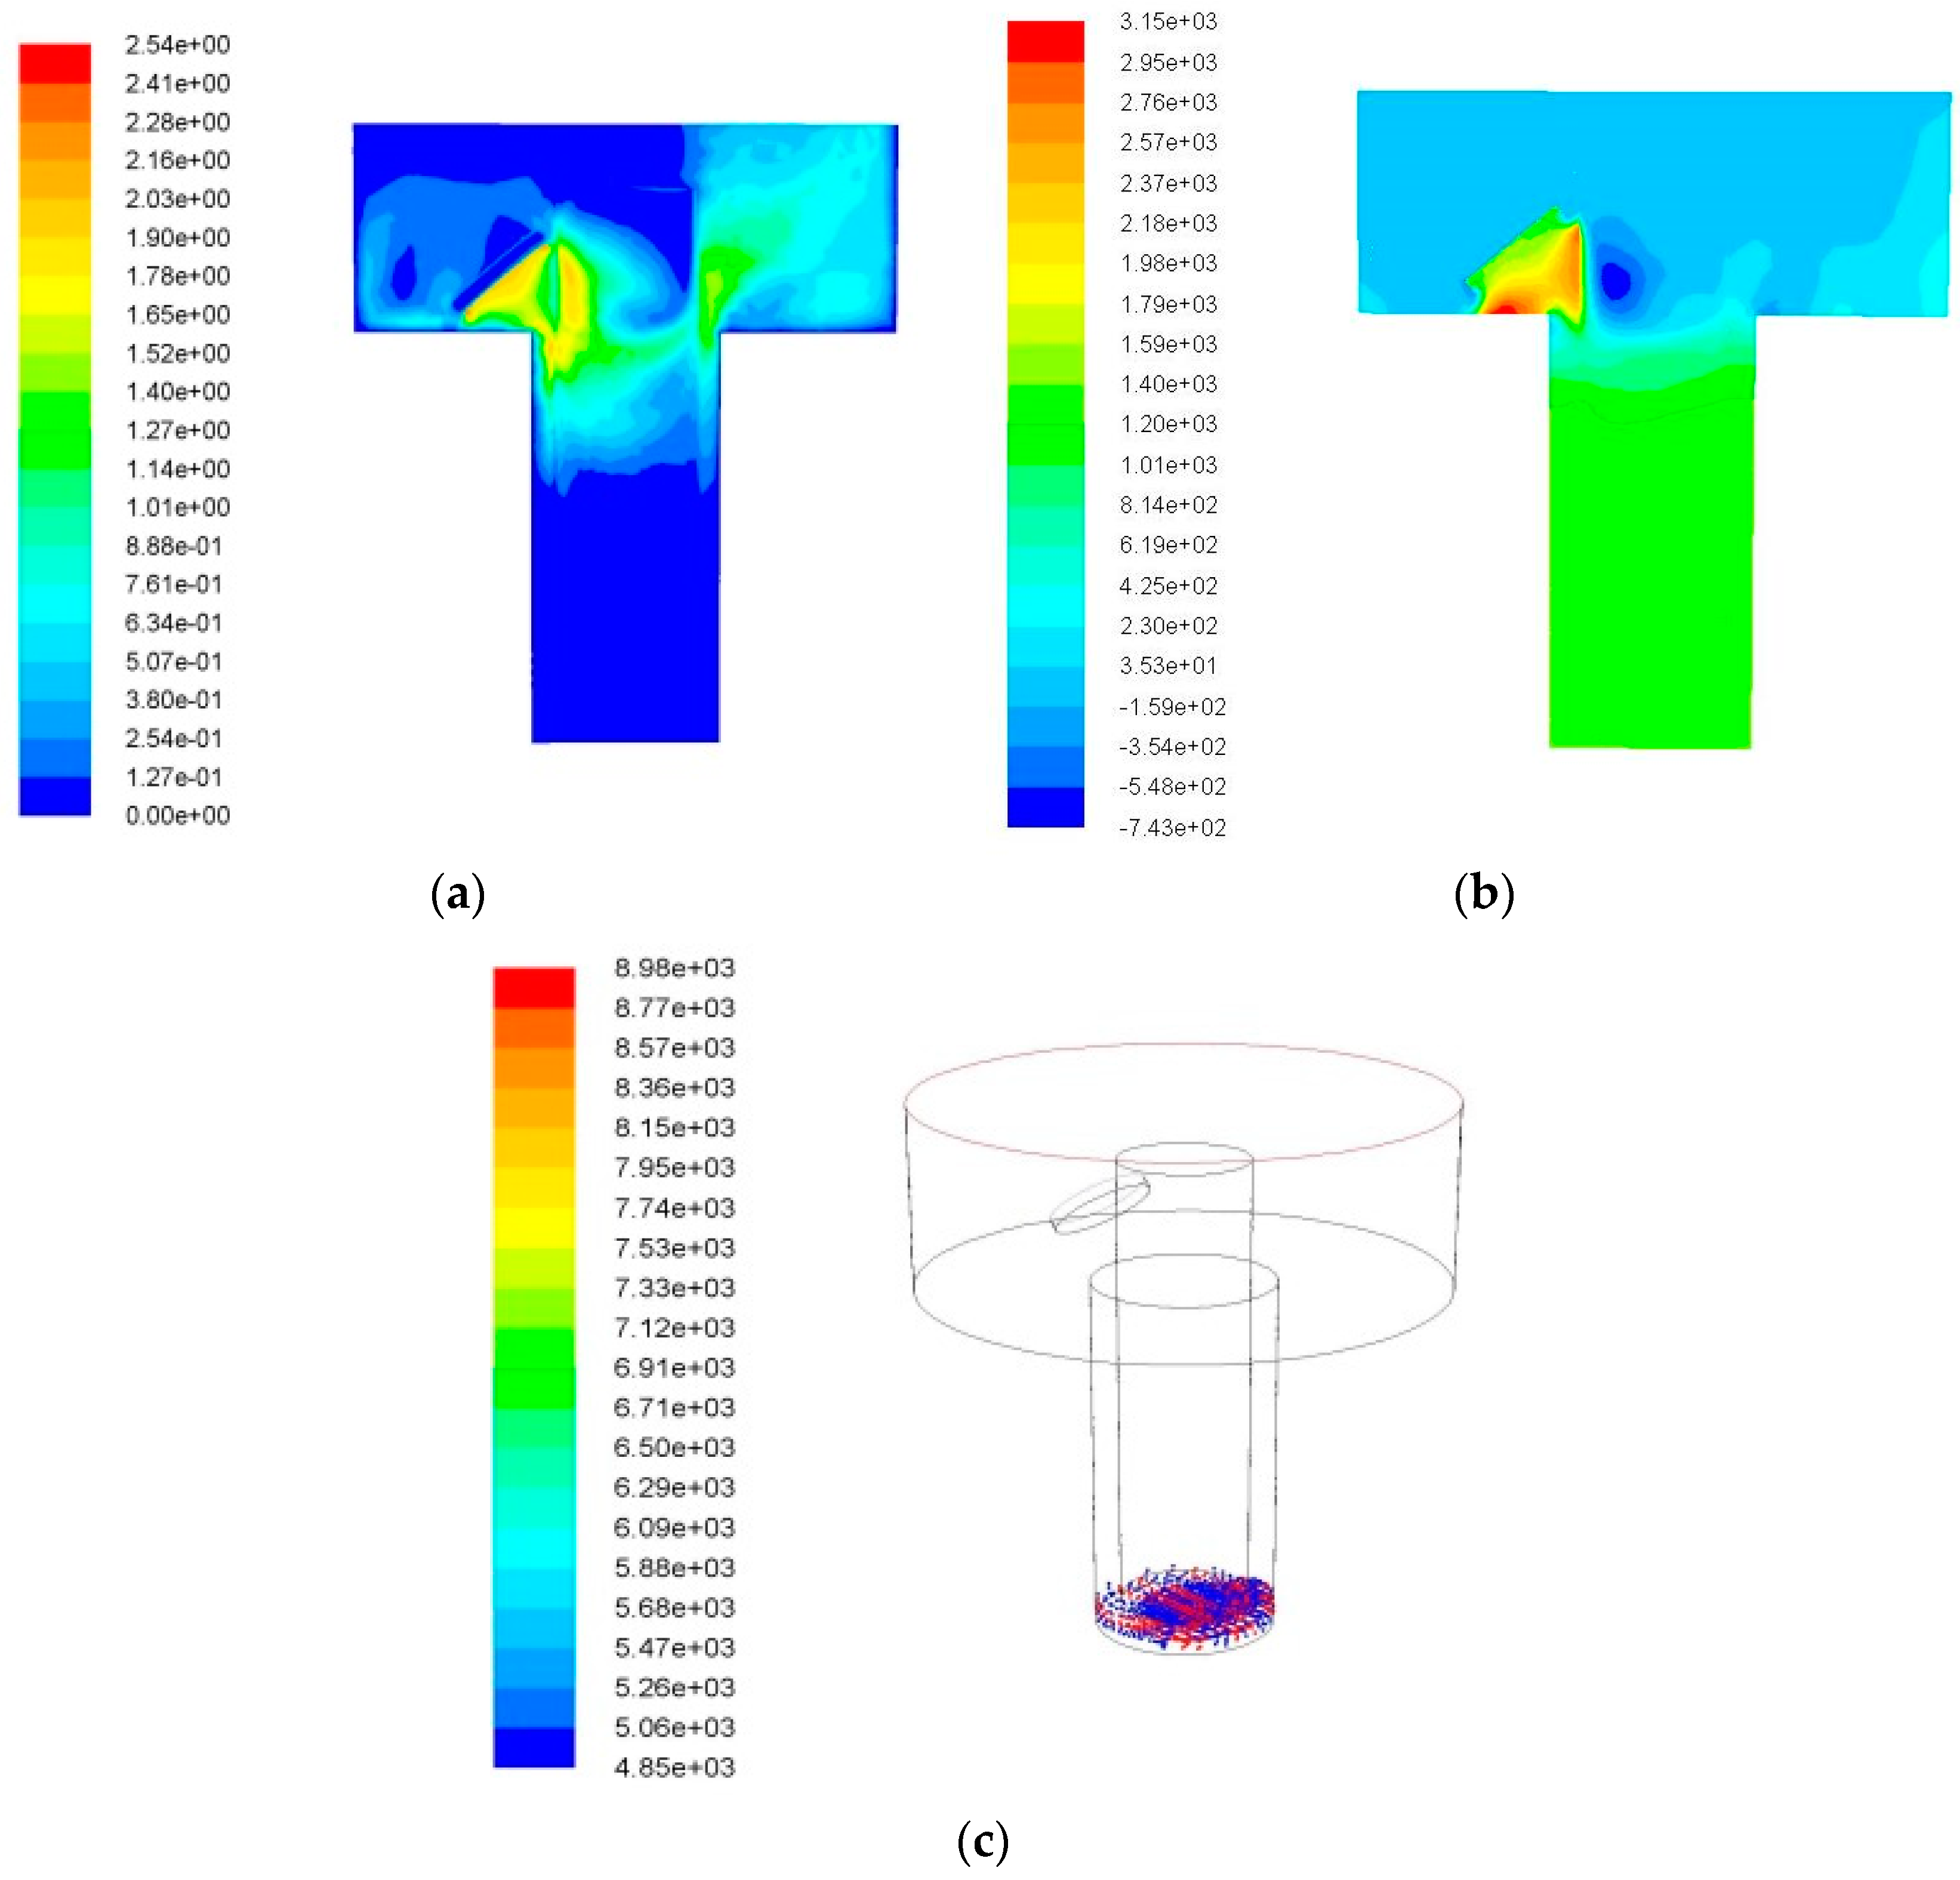
3. Simulation Results and Analysis
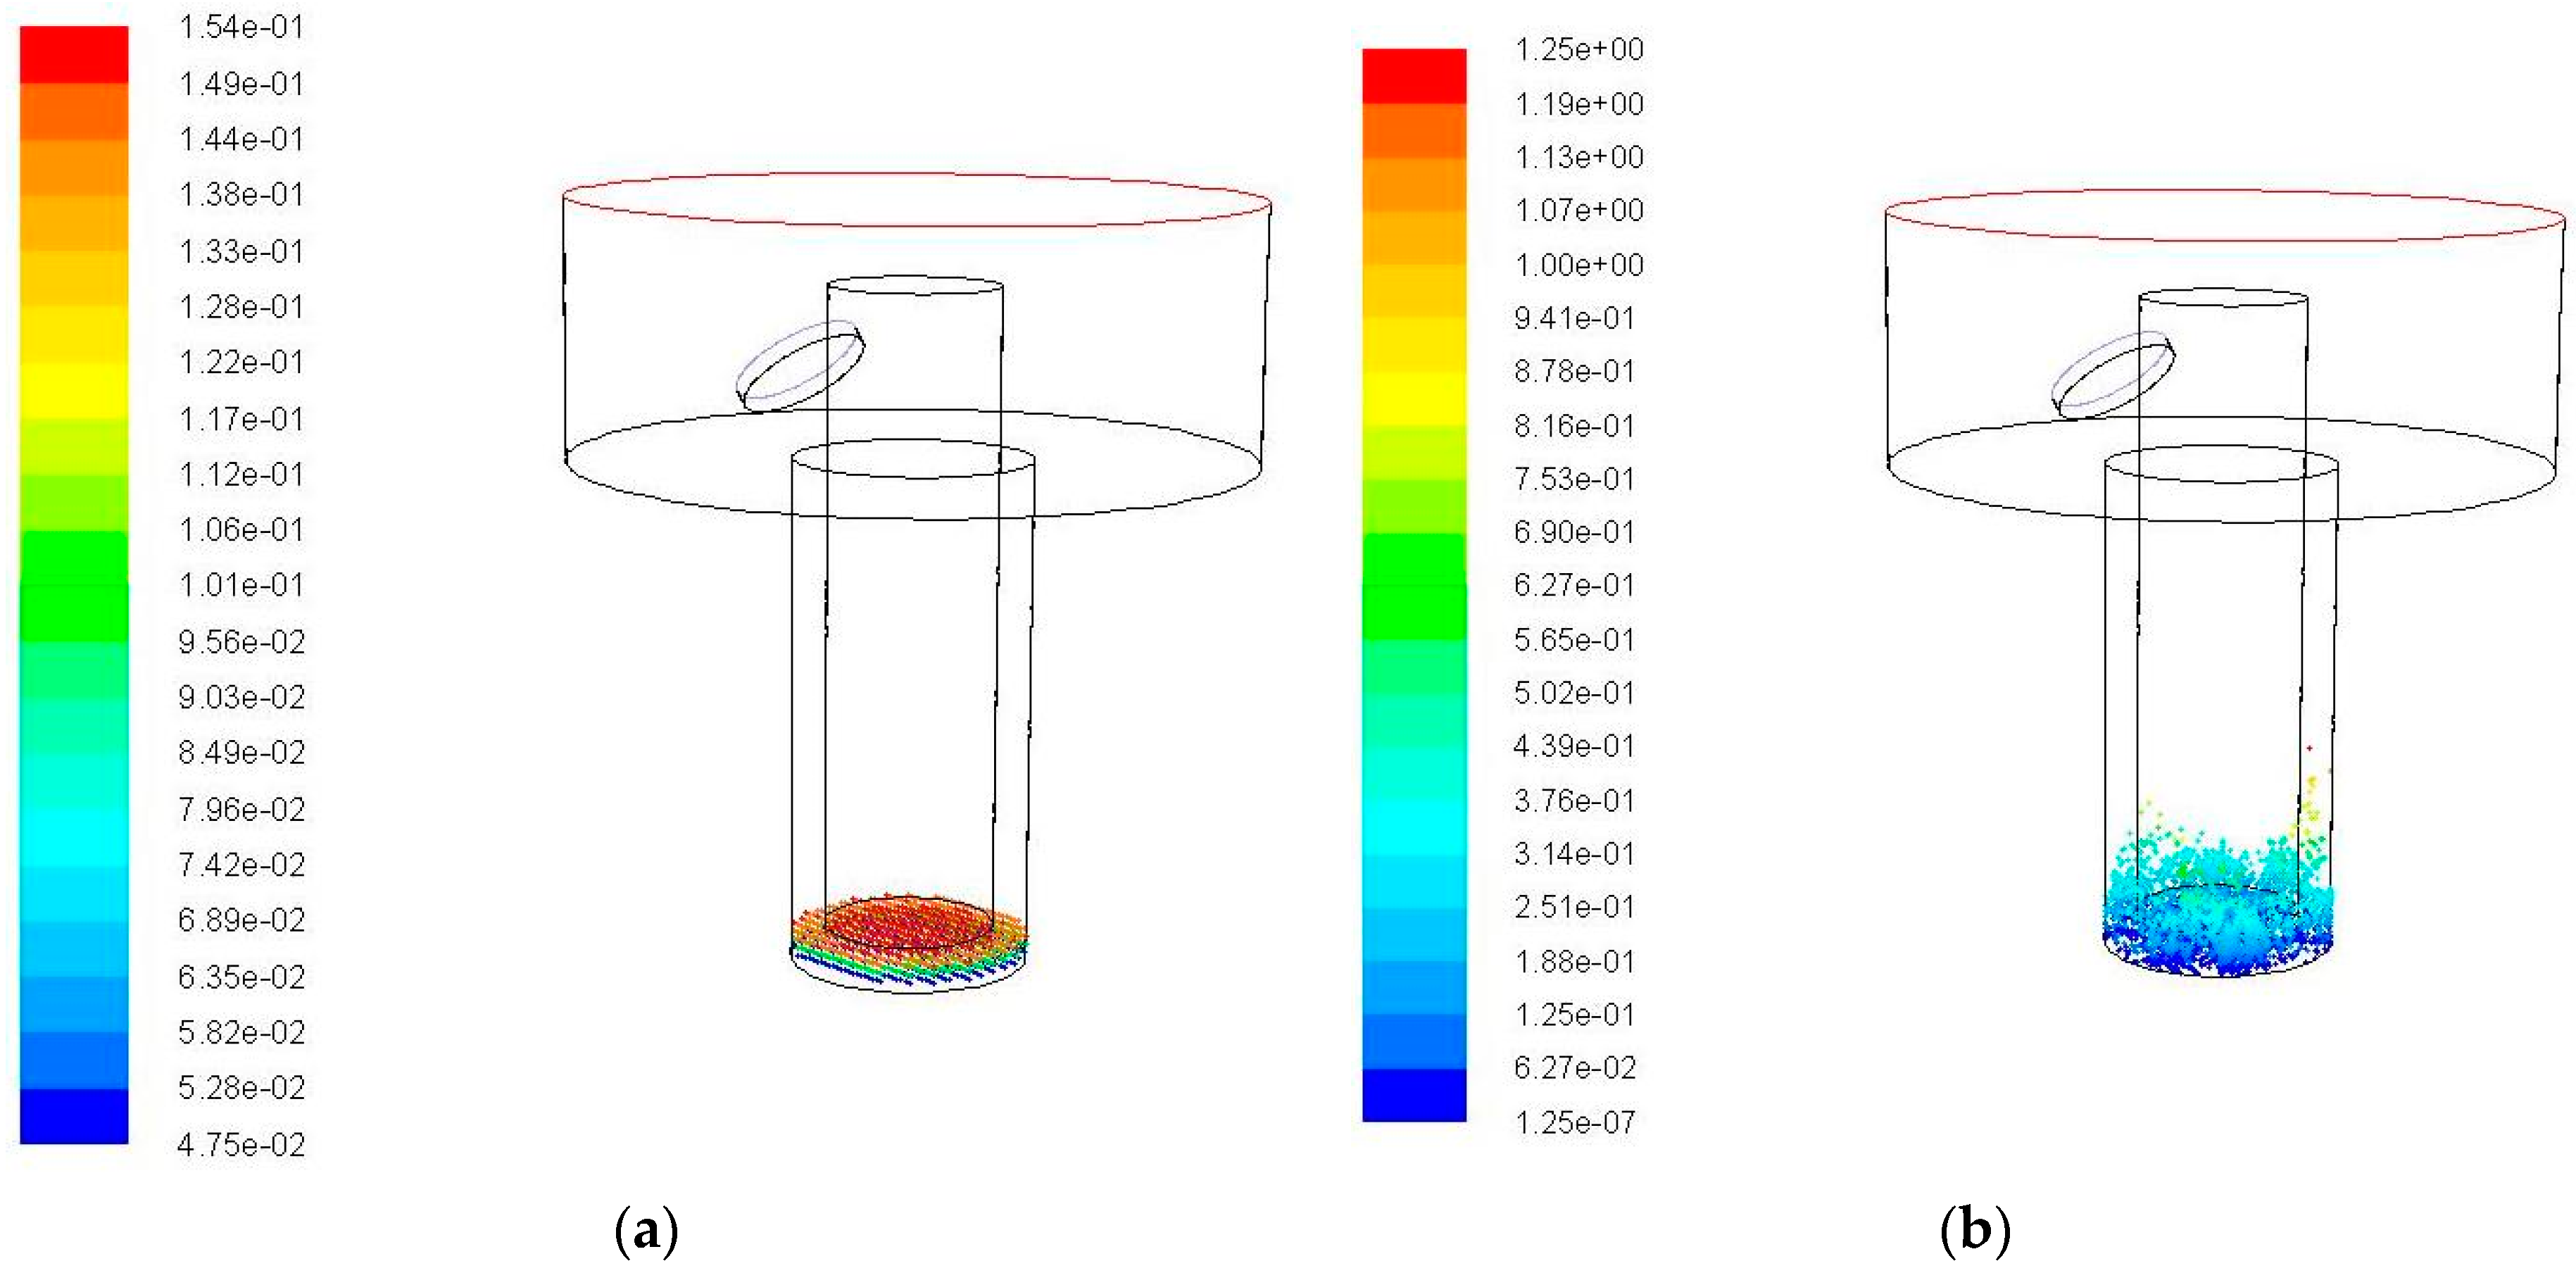
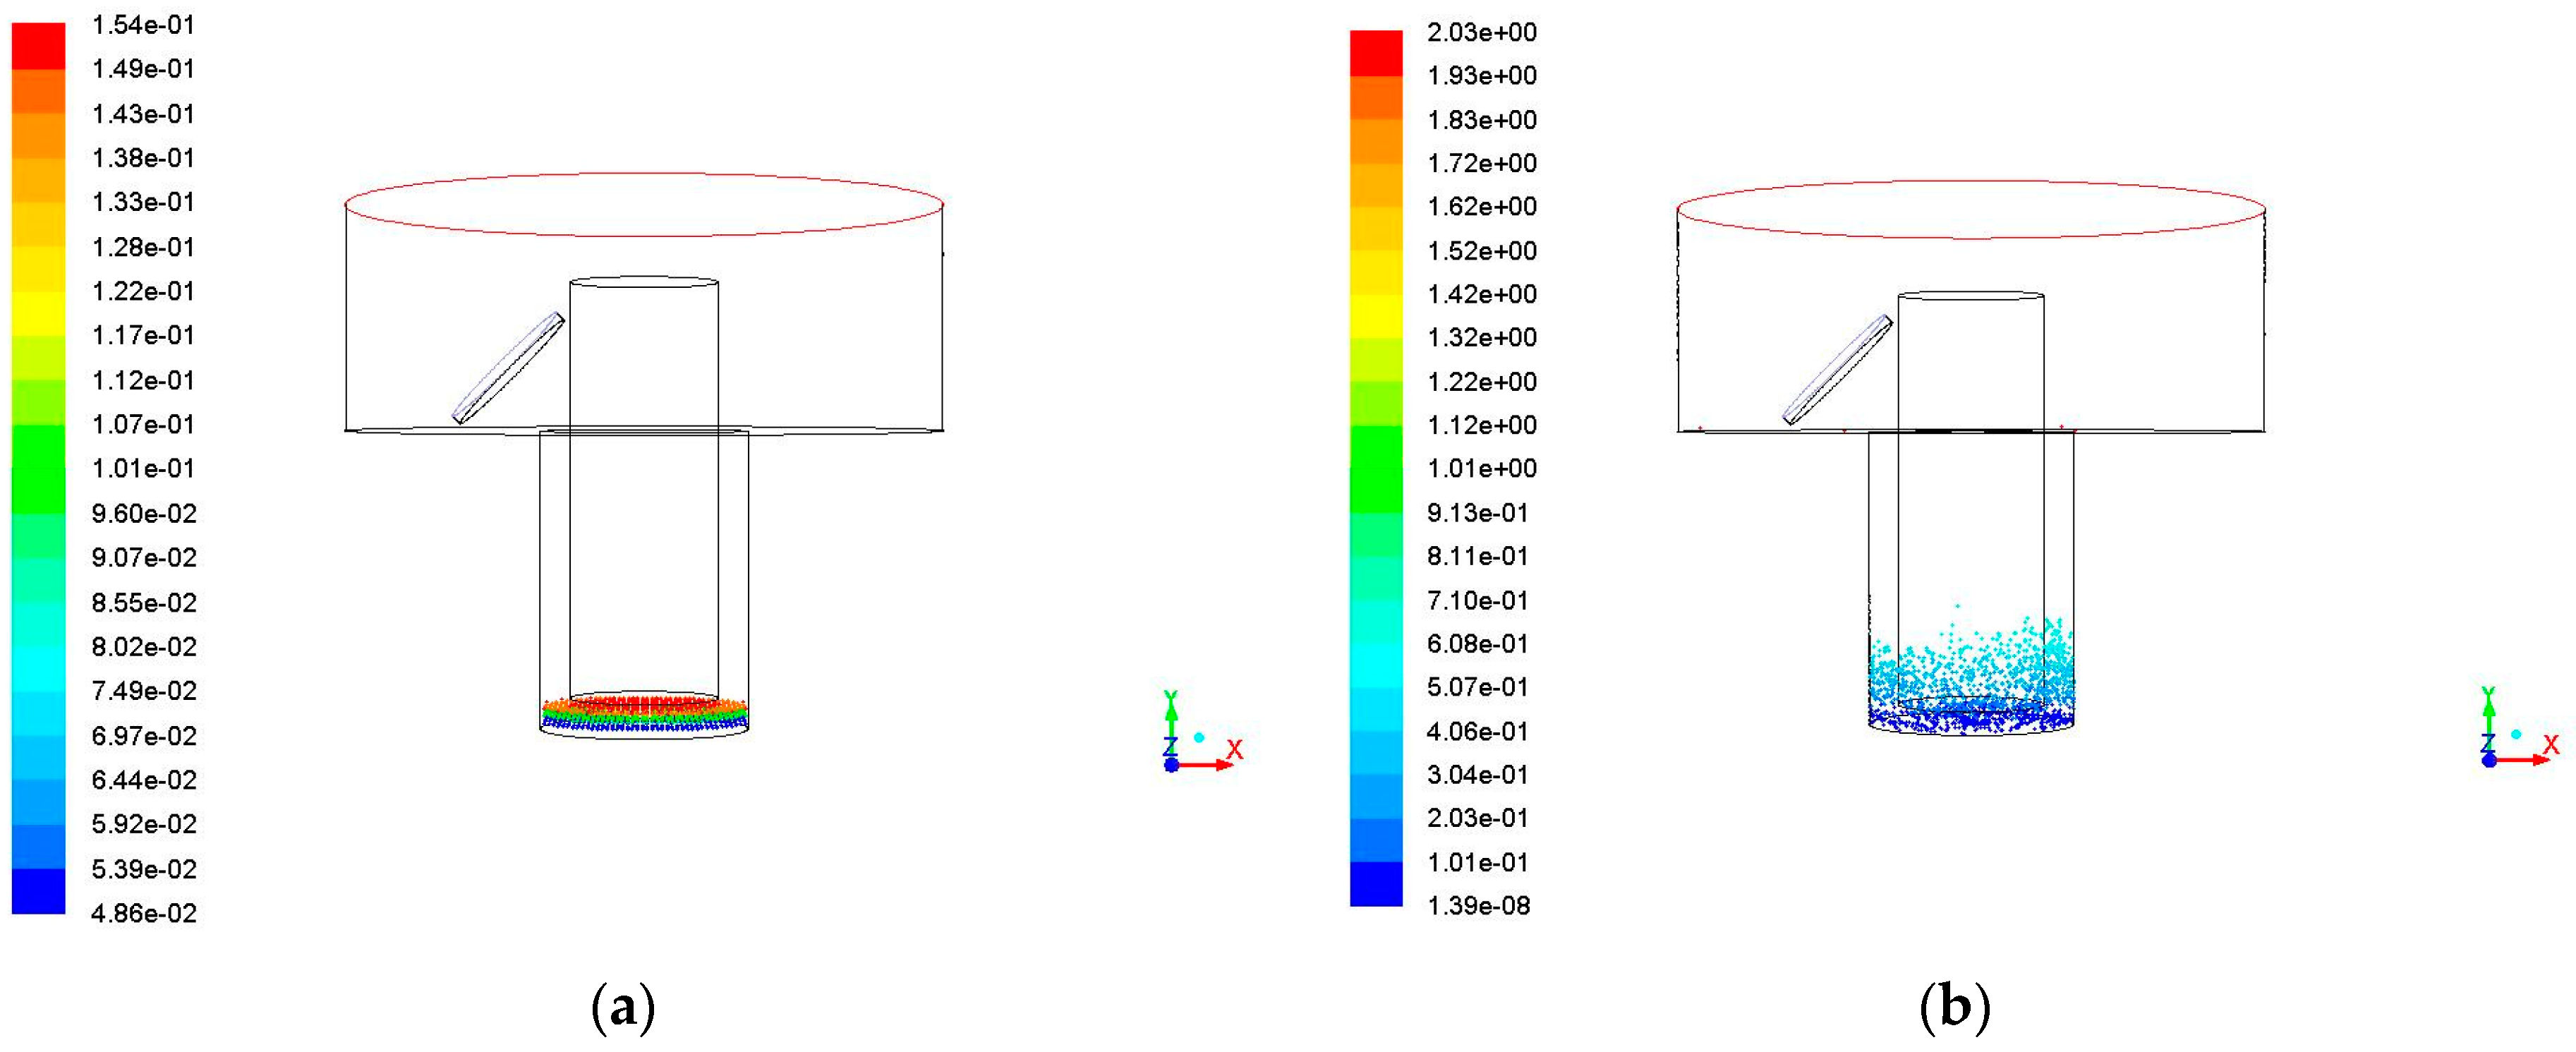
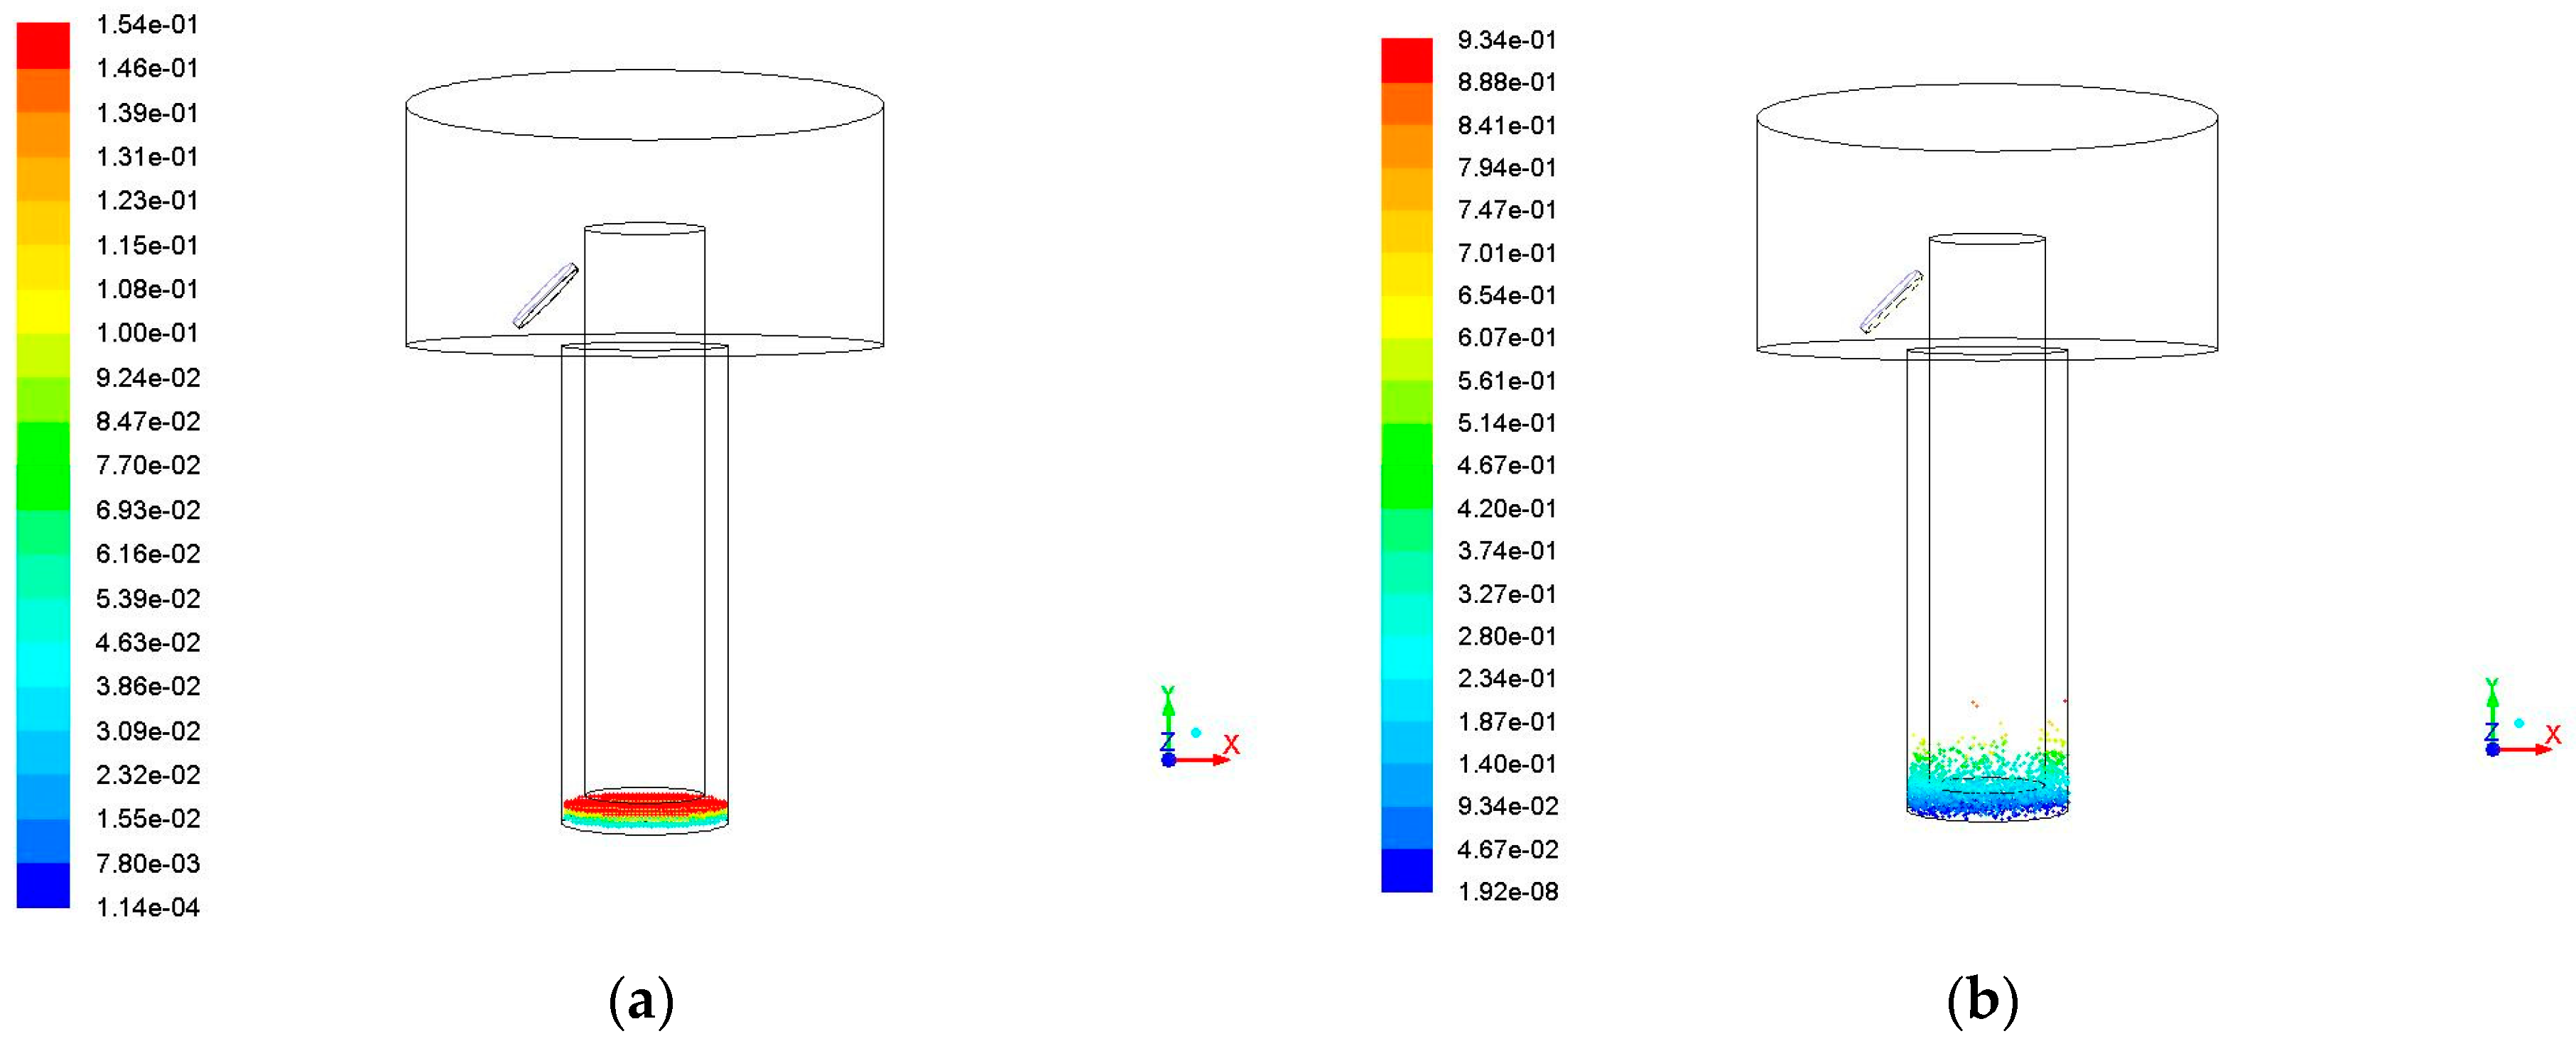
3.1. Impact of Side Flushing on the Debris Removal
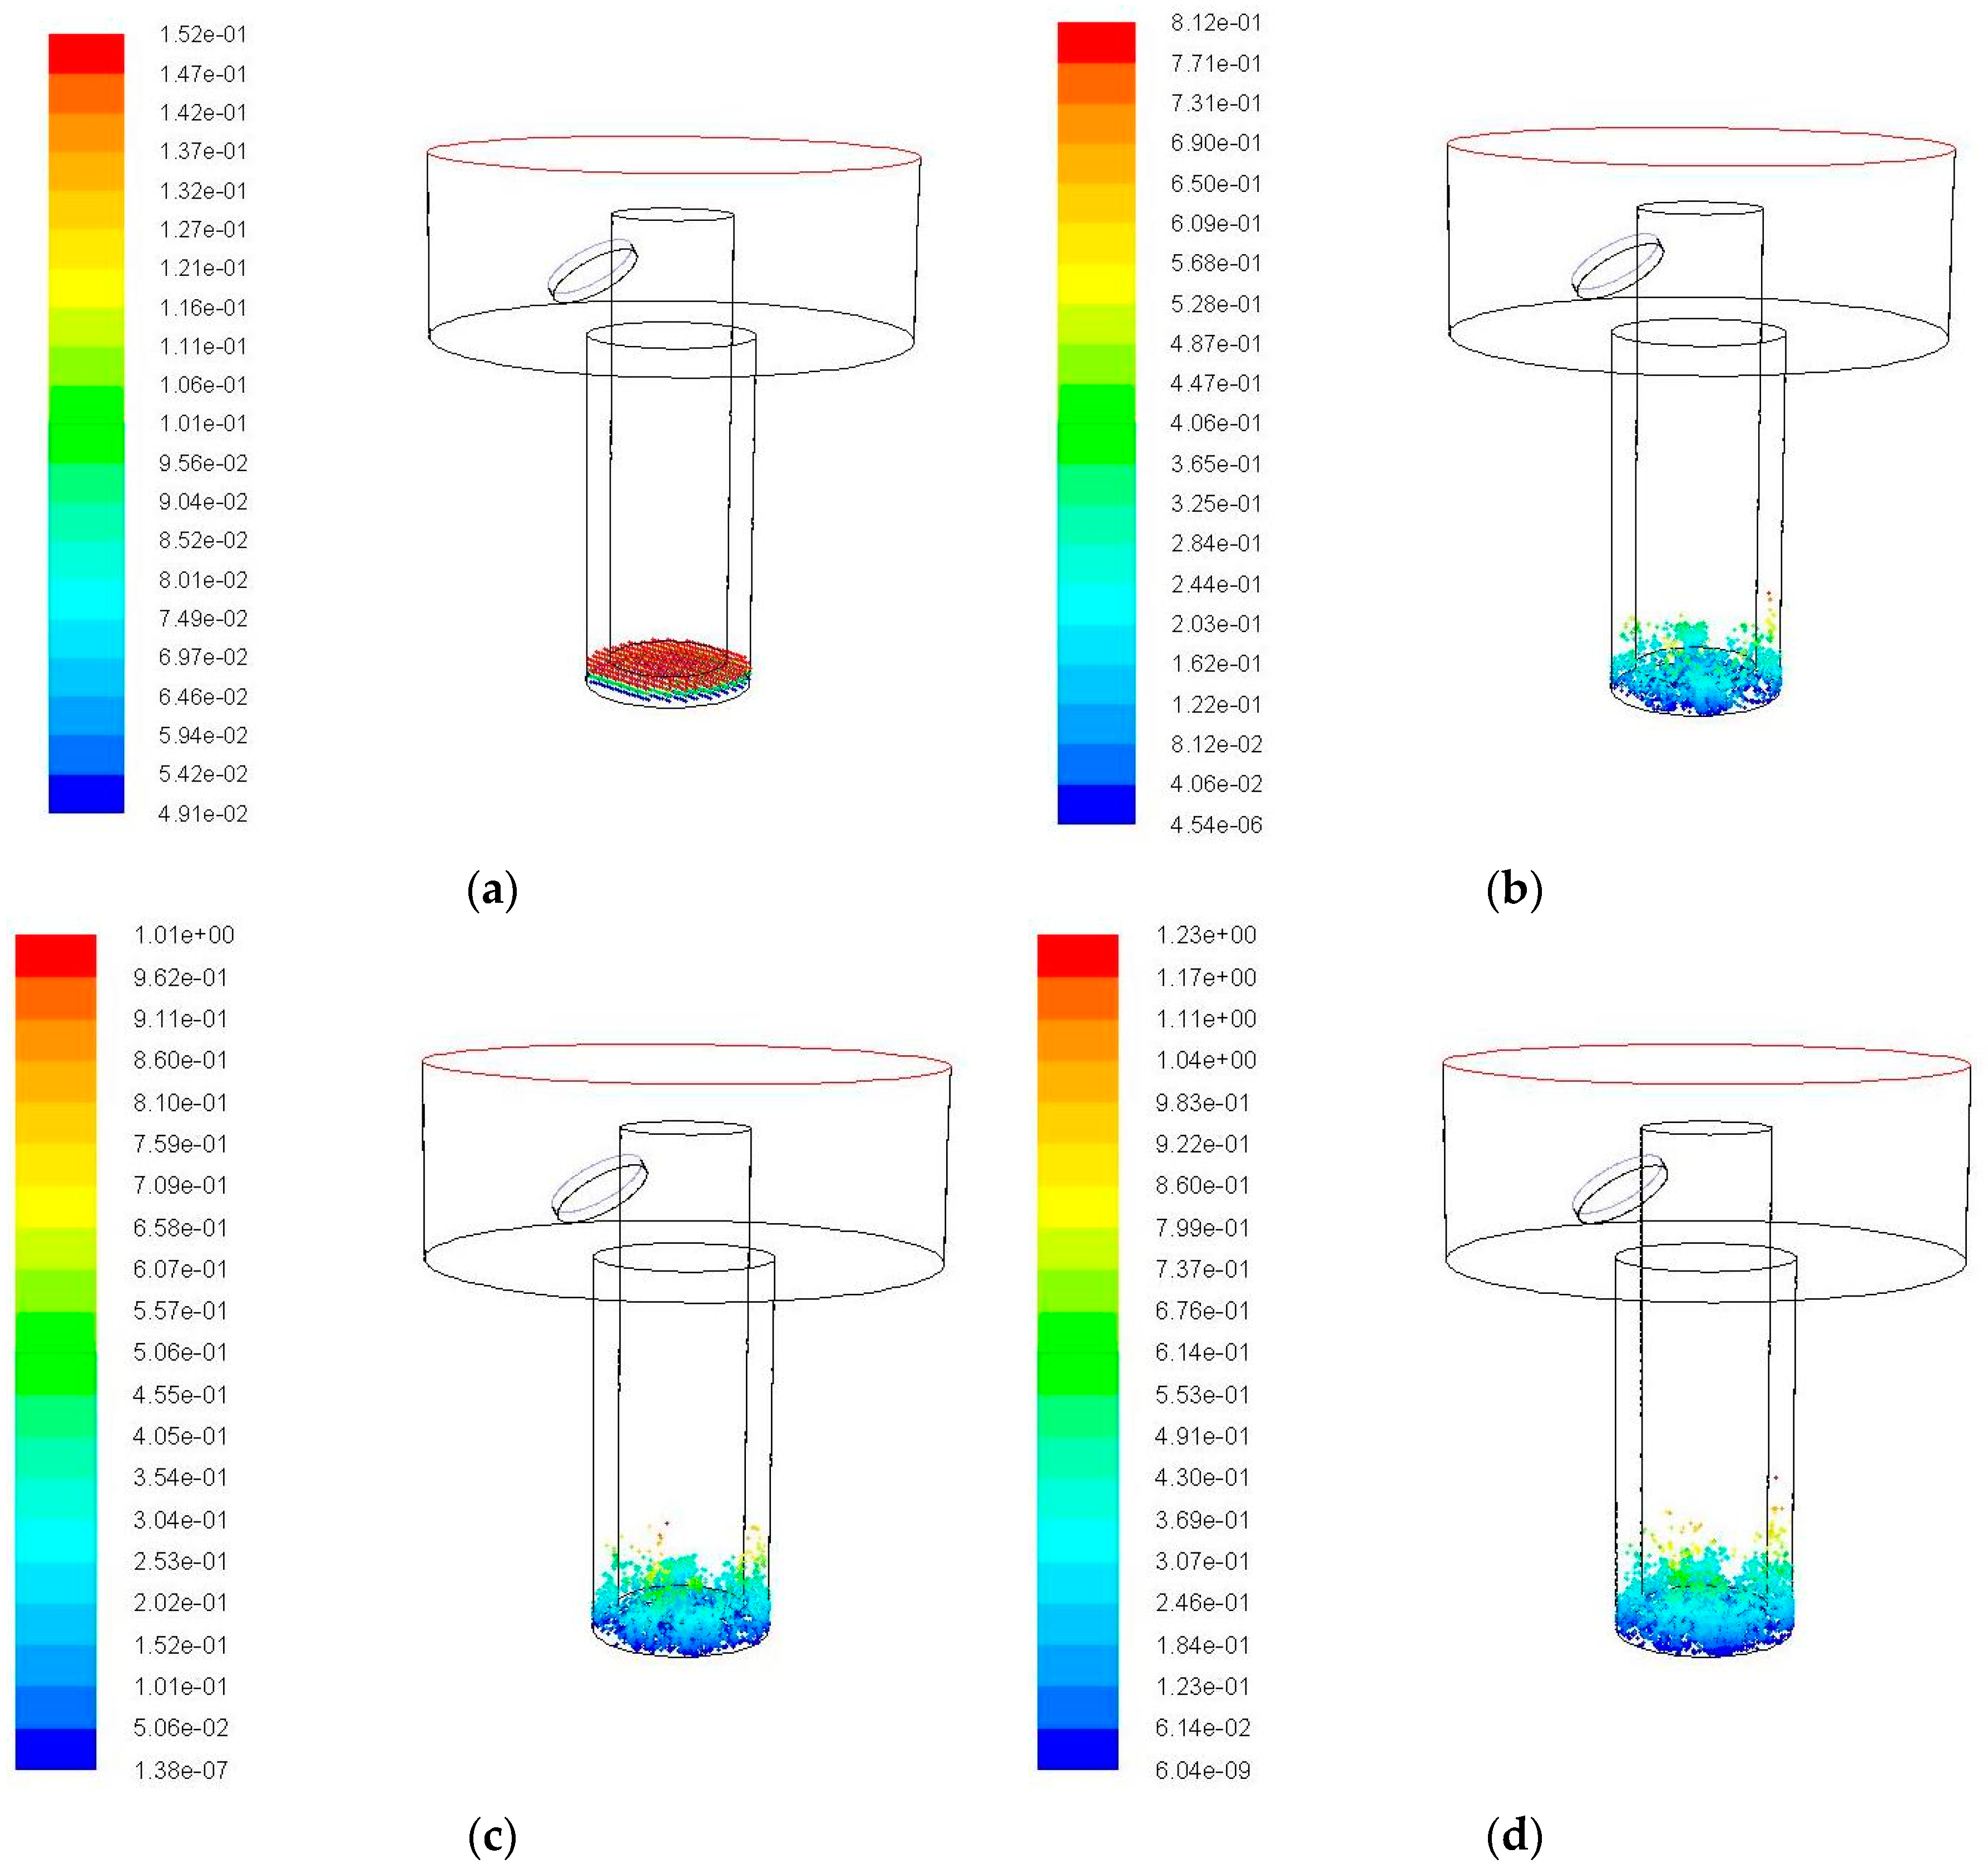
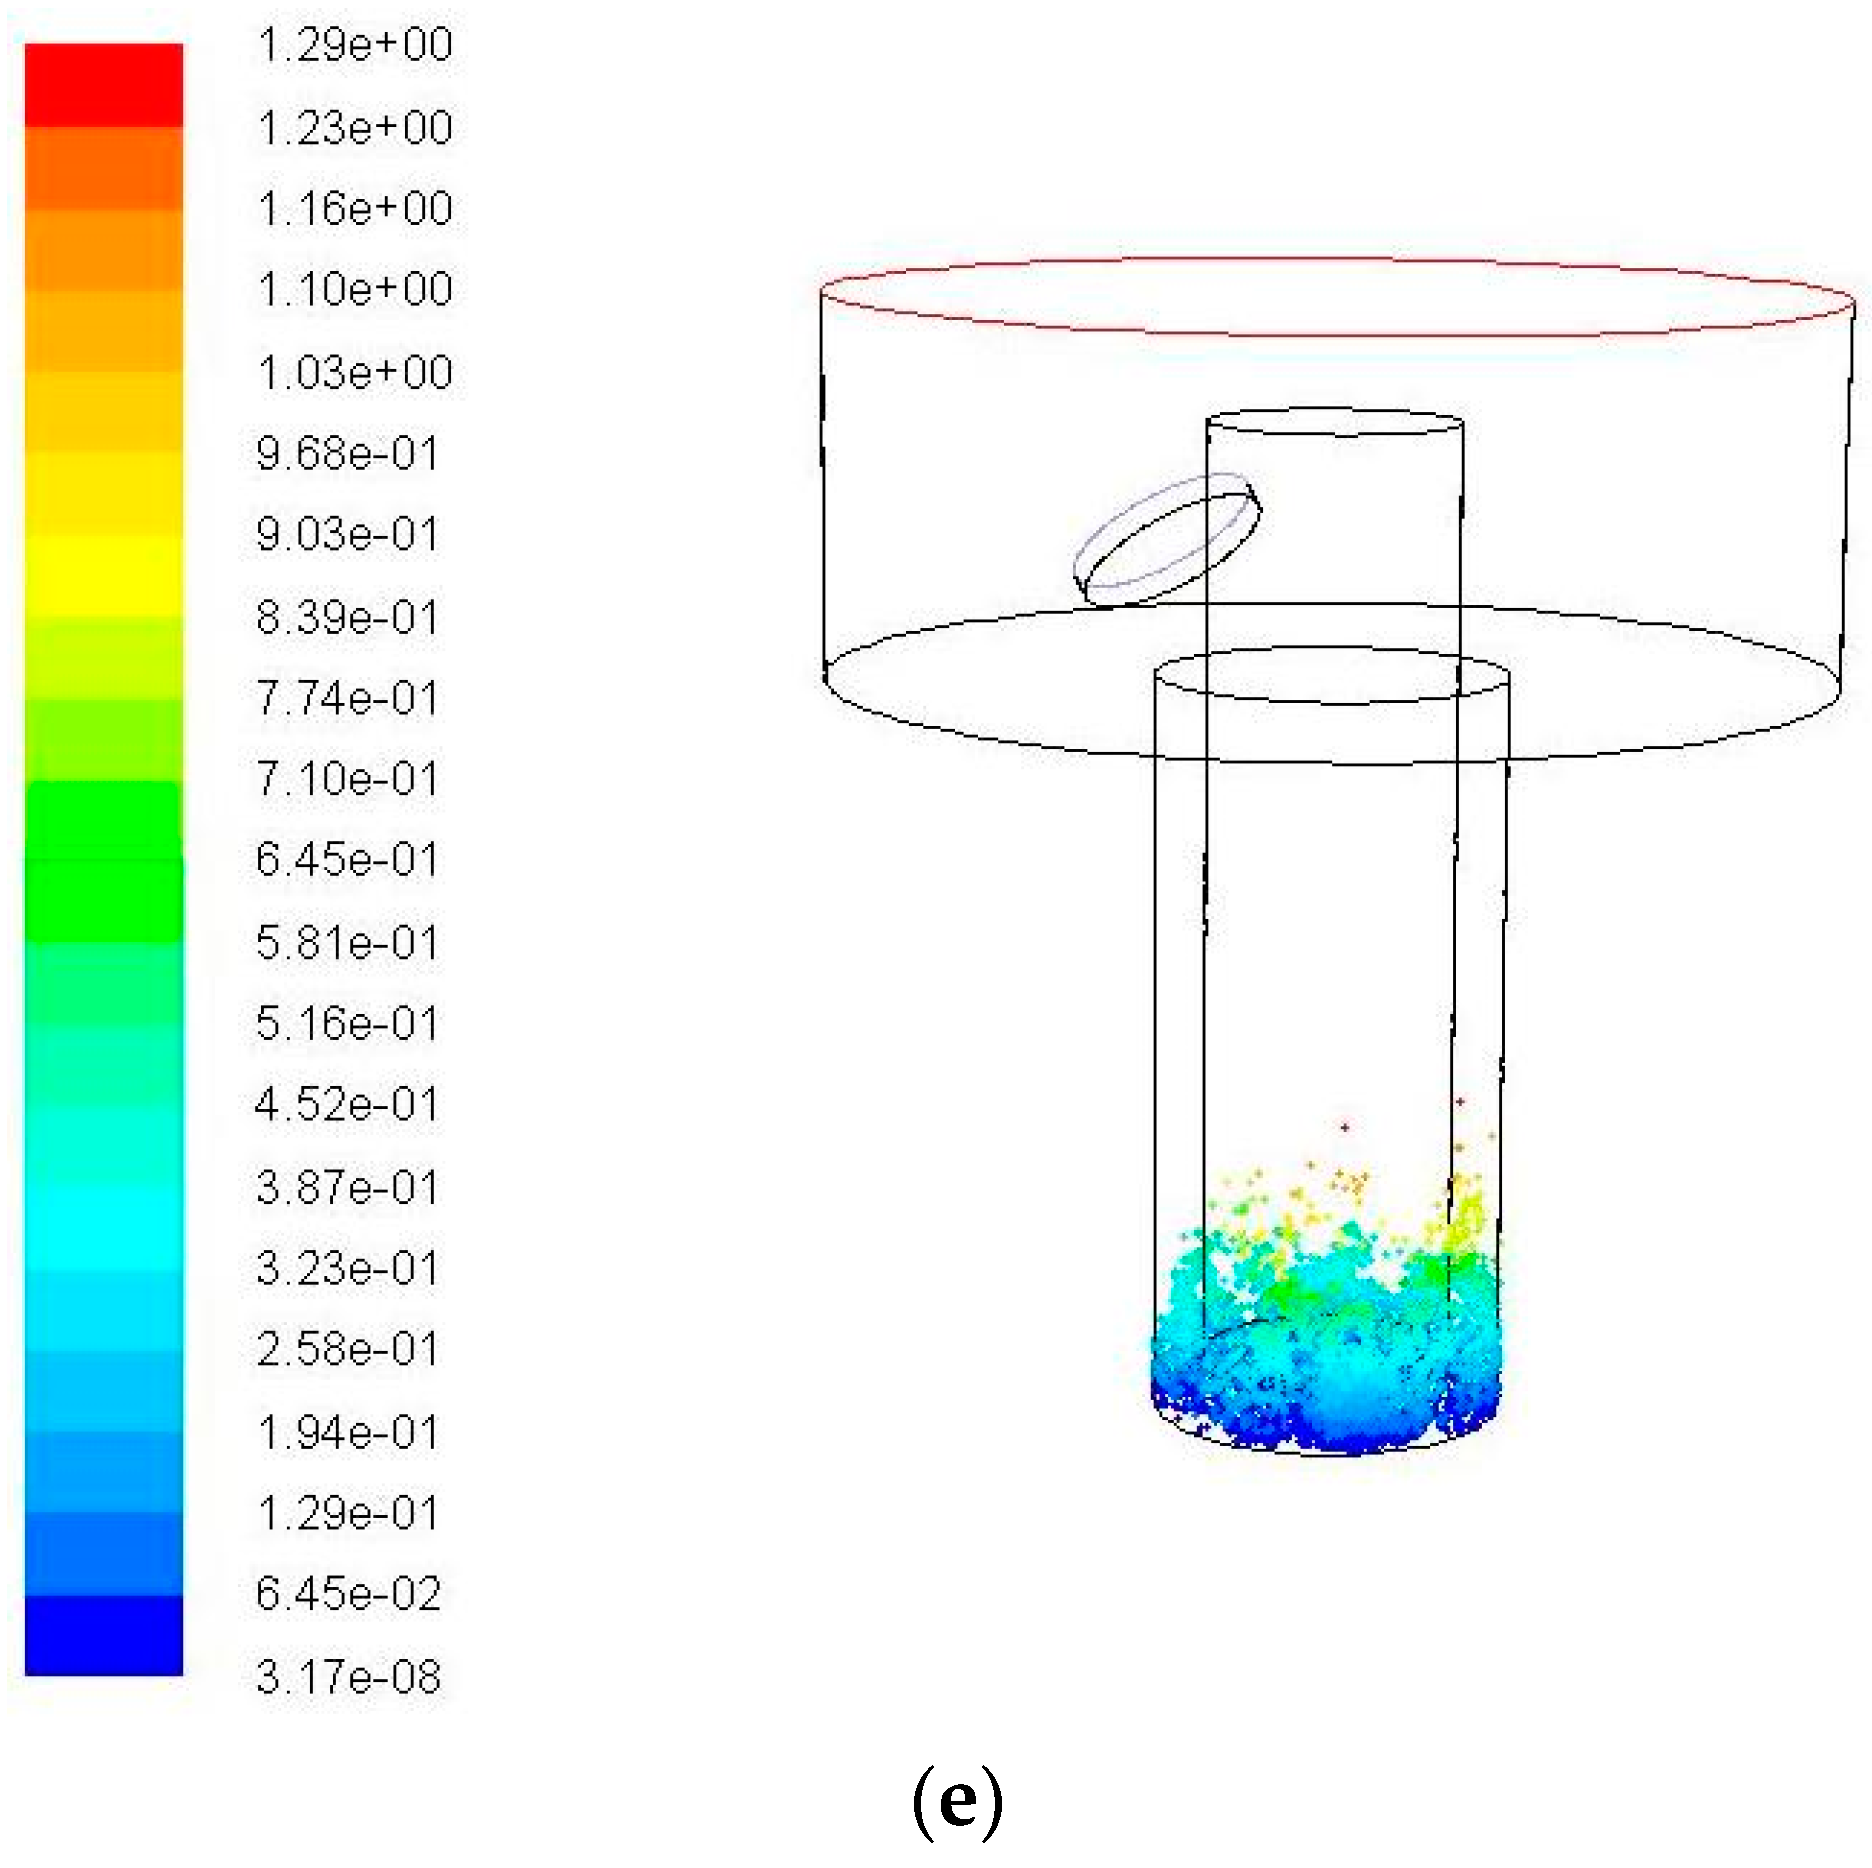
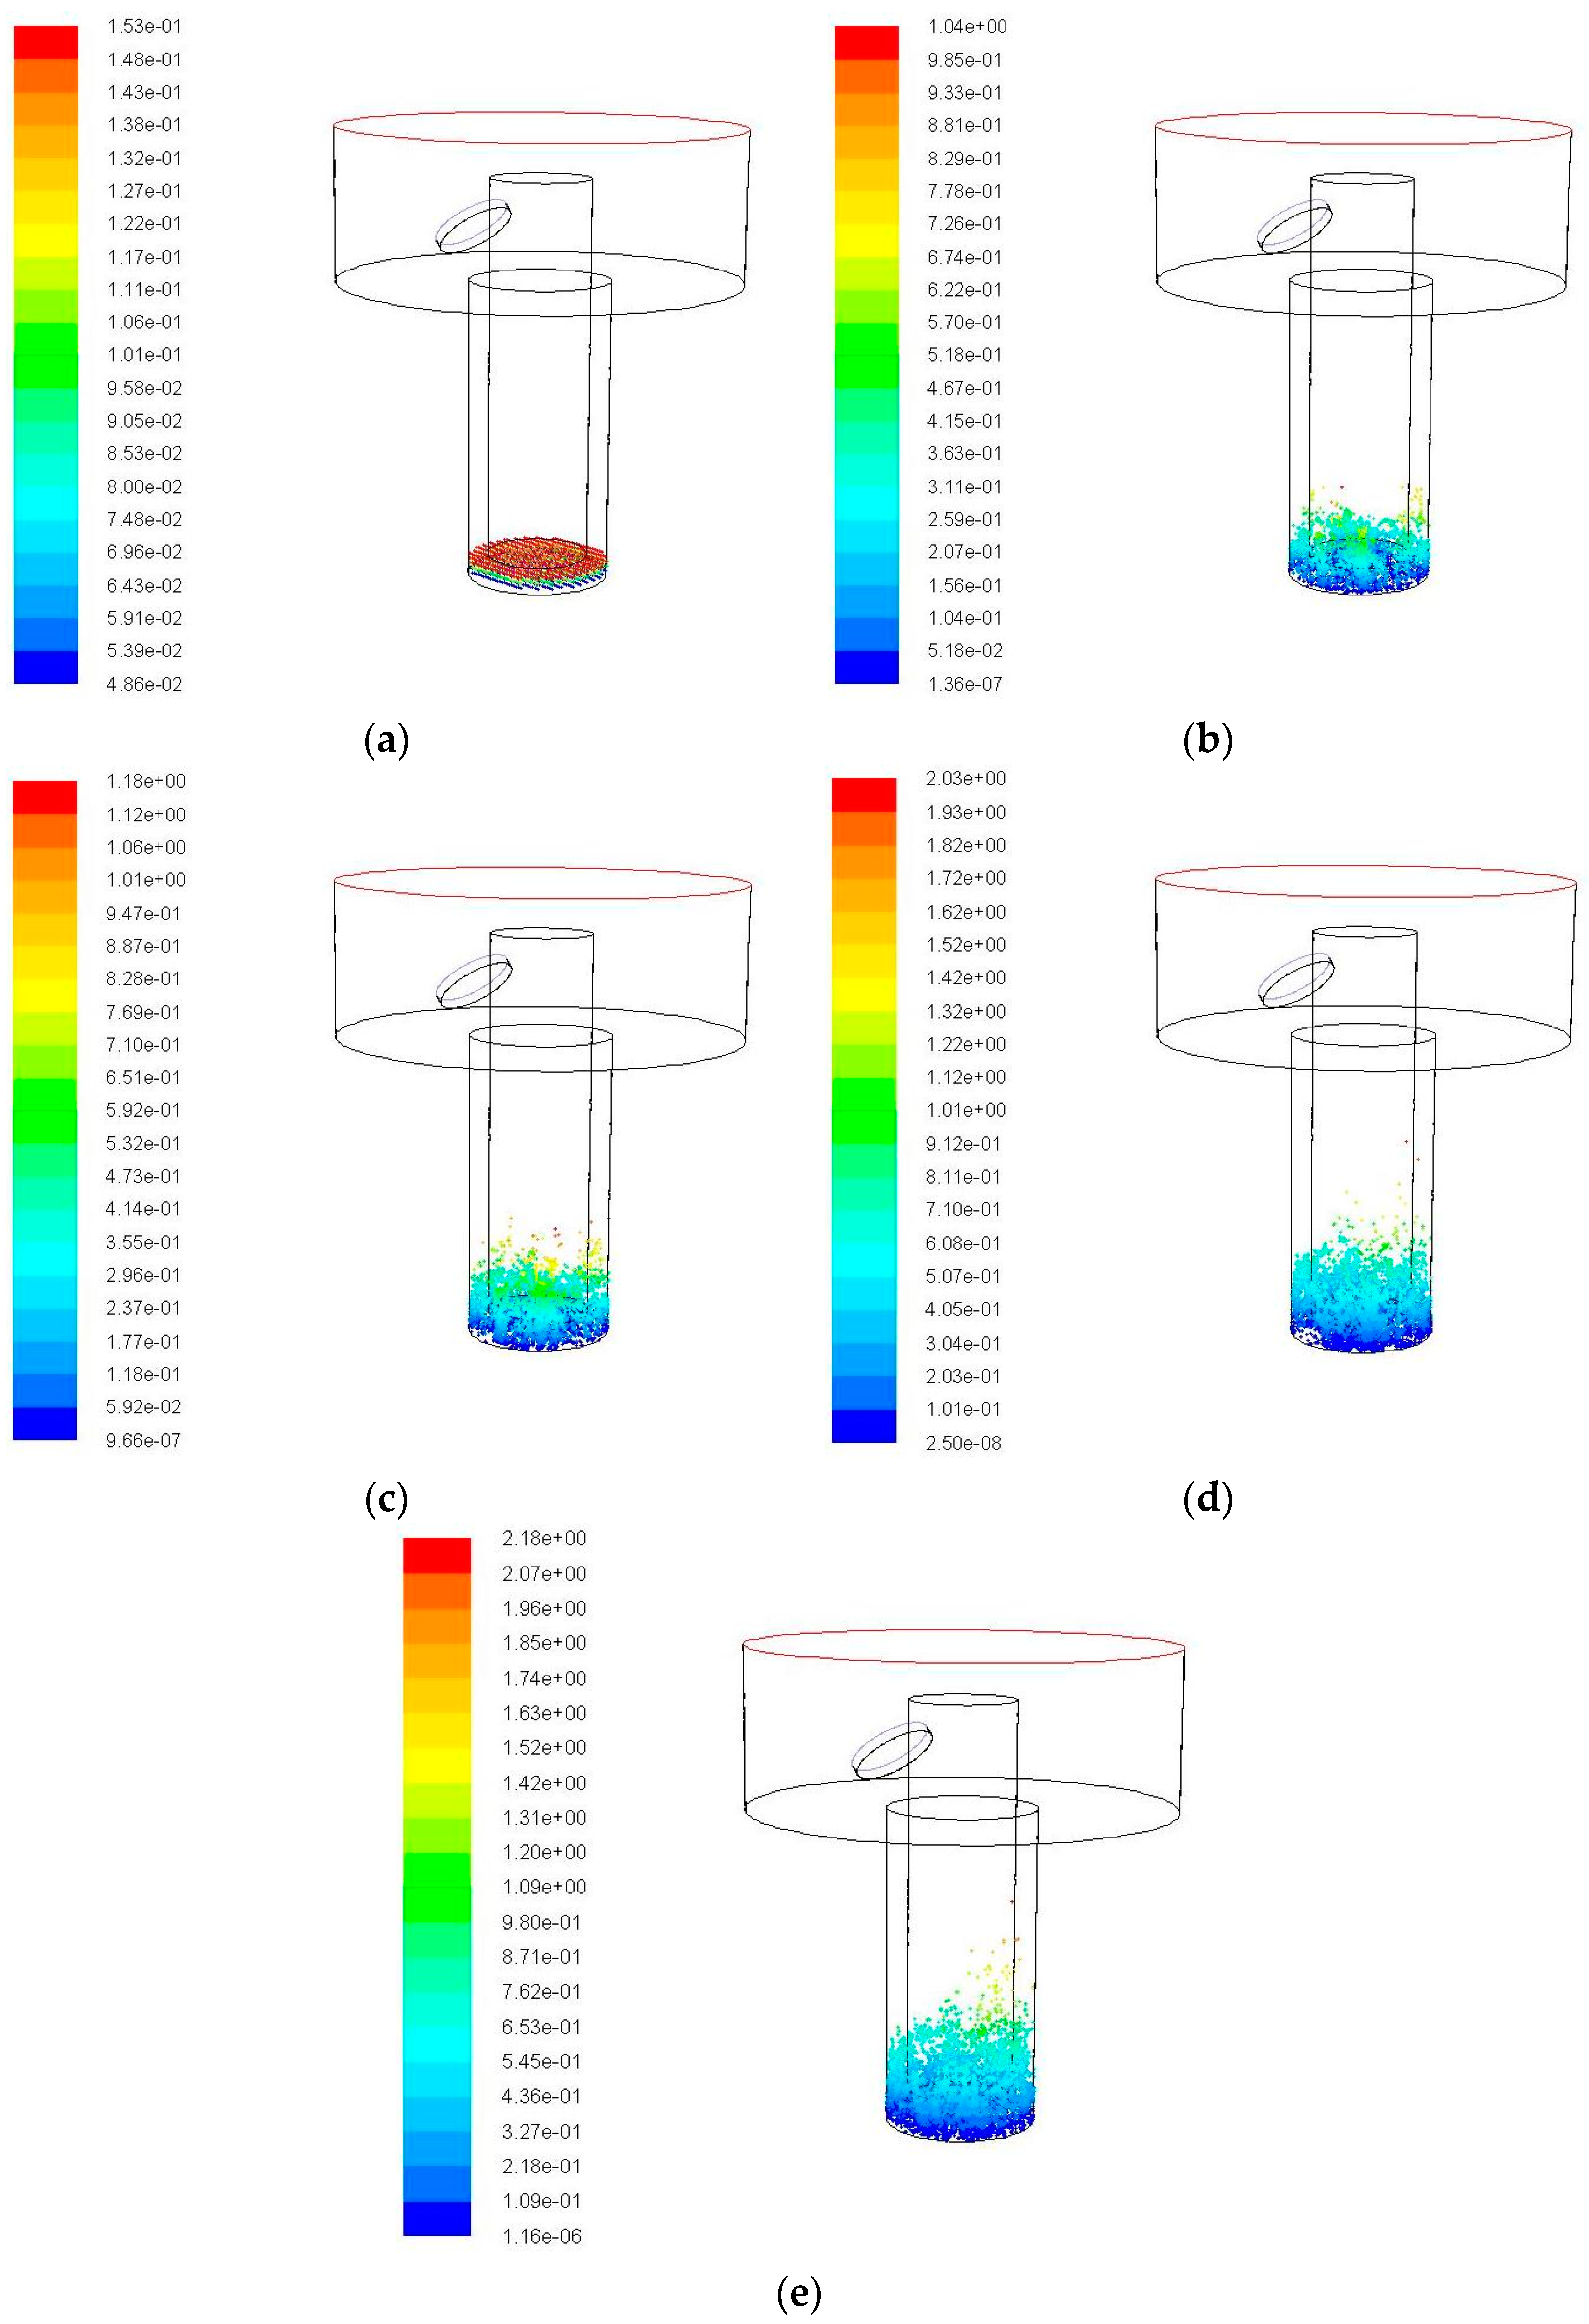
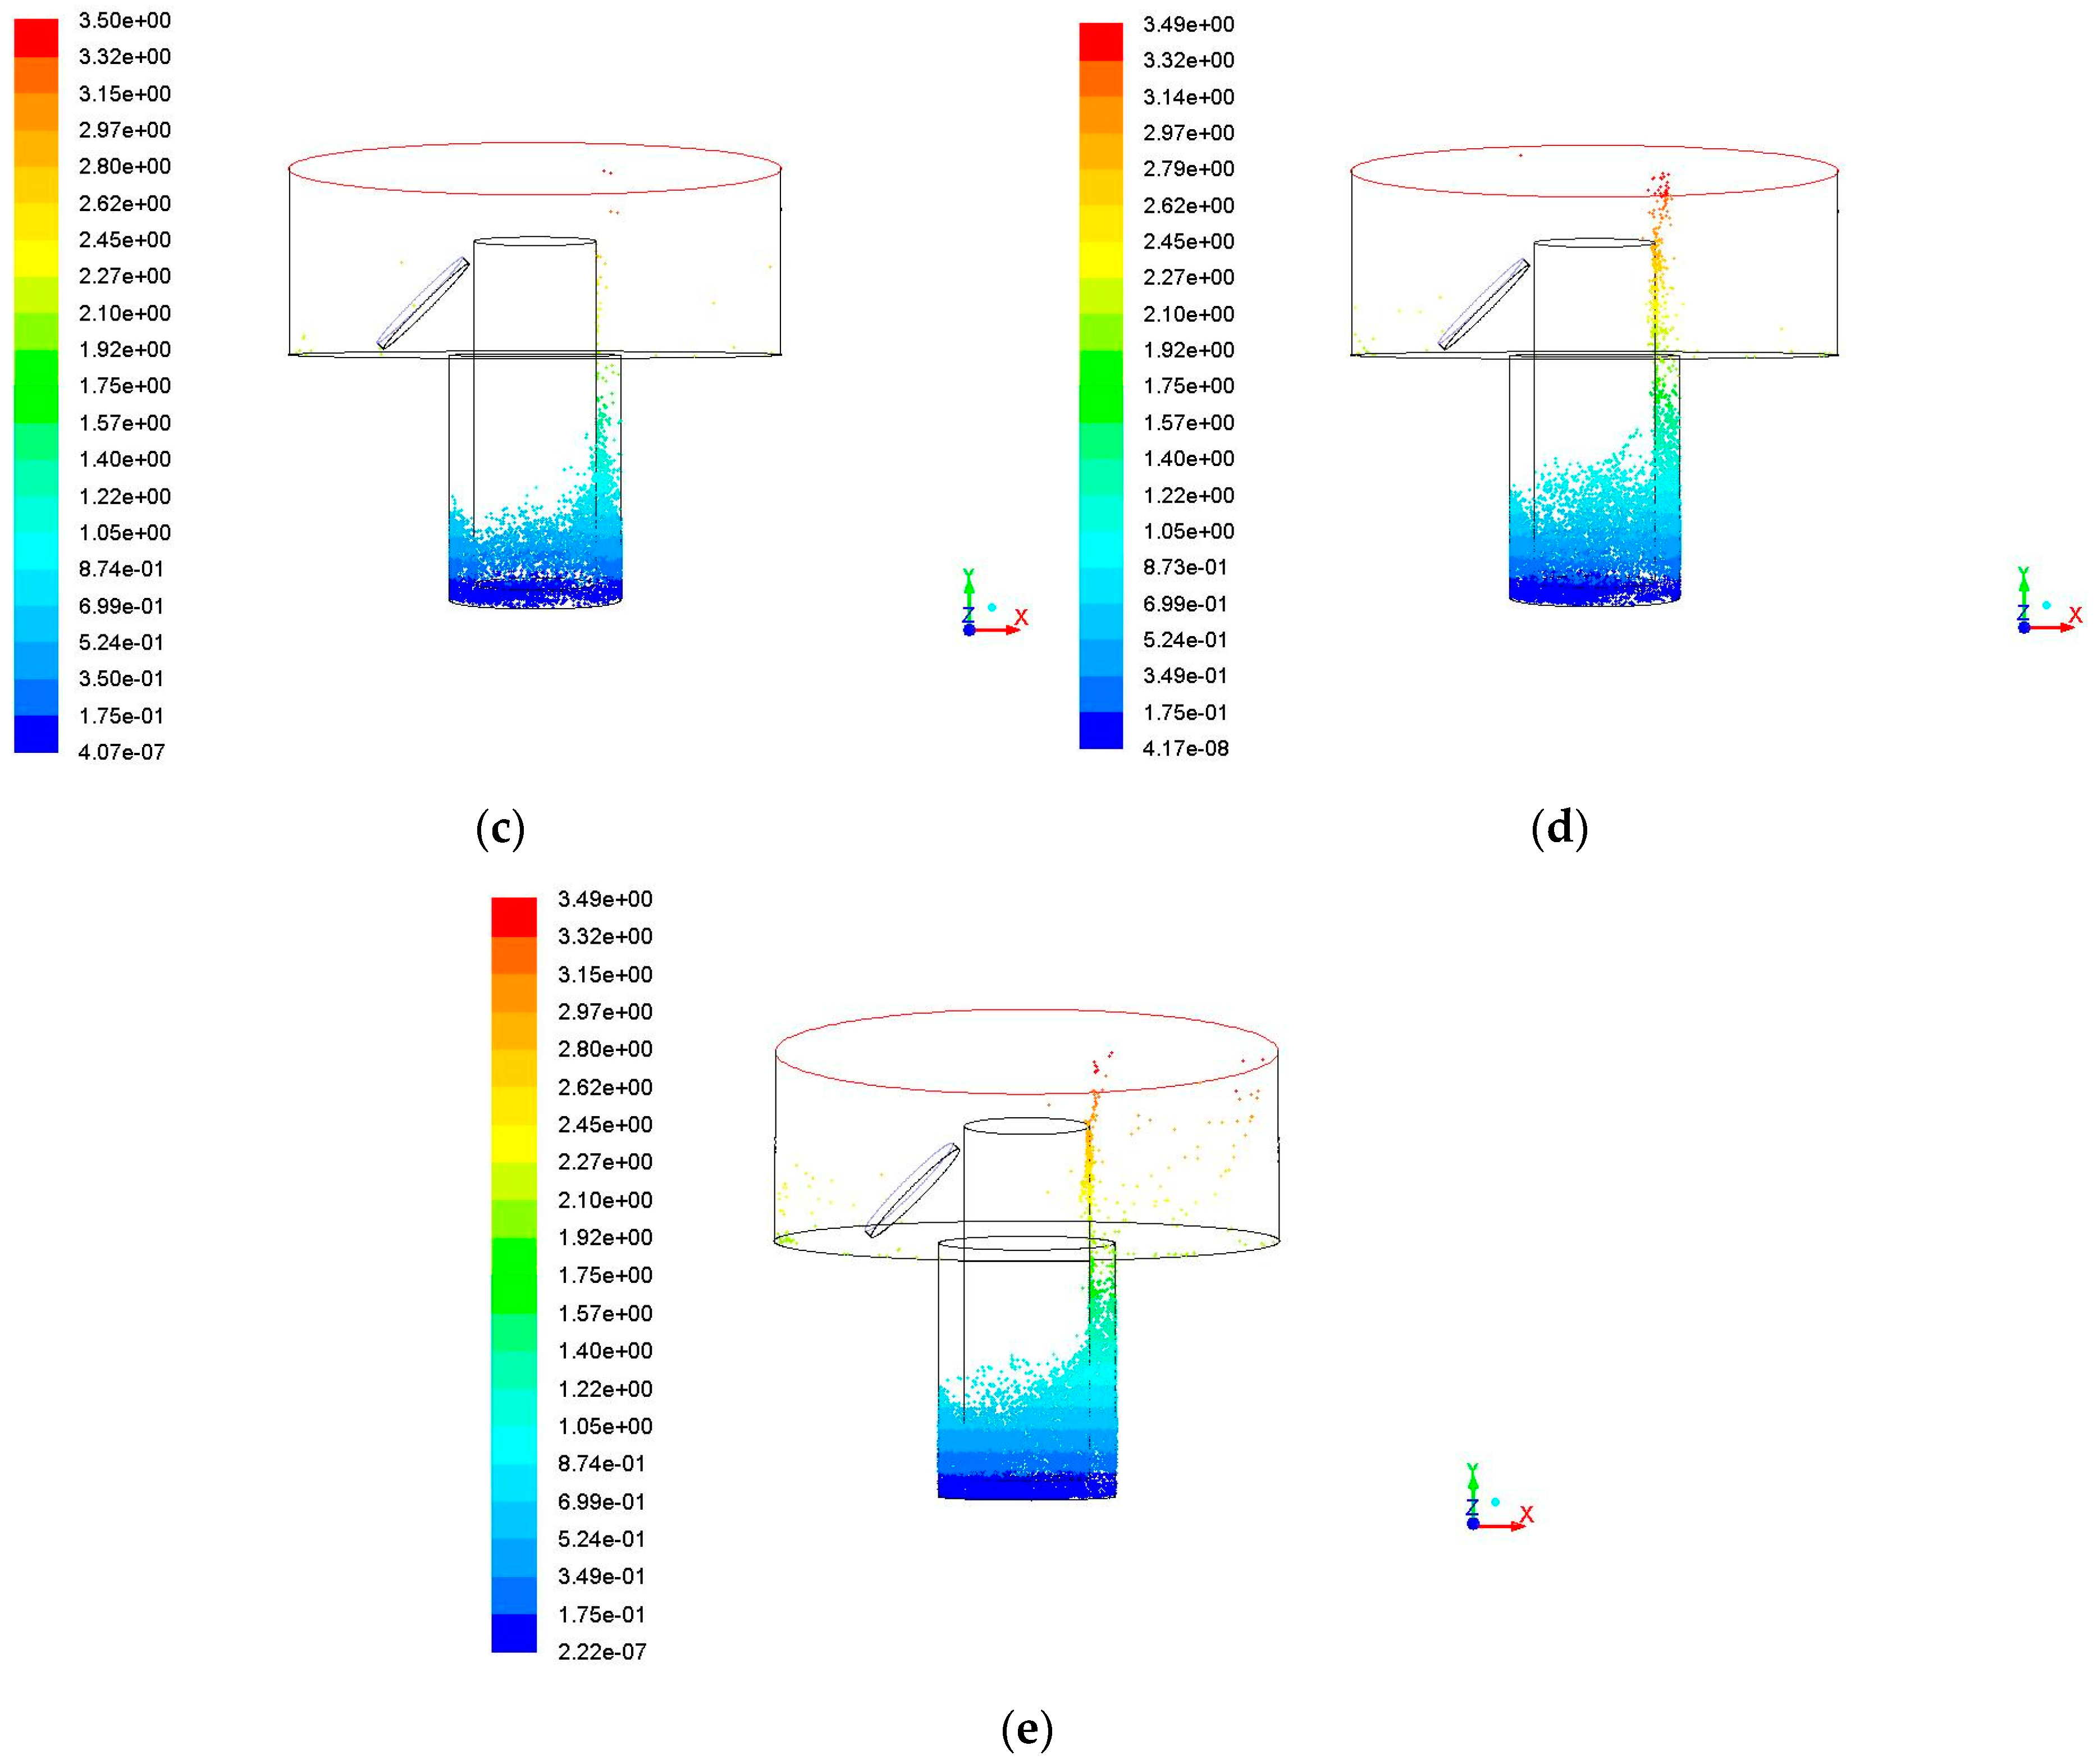
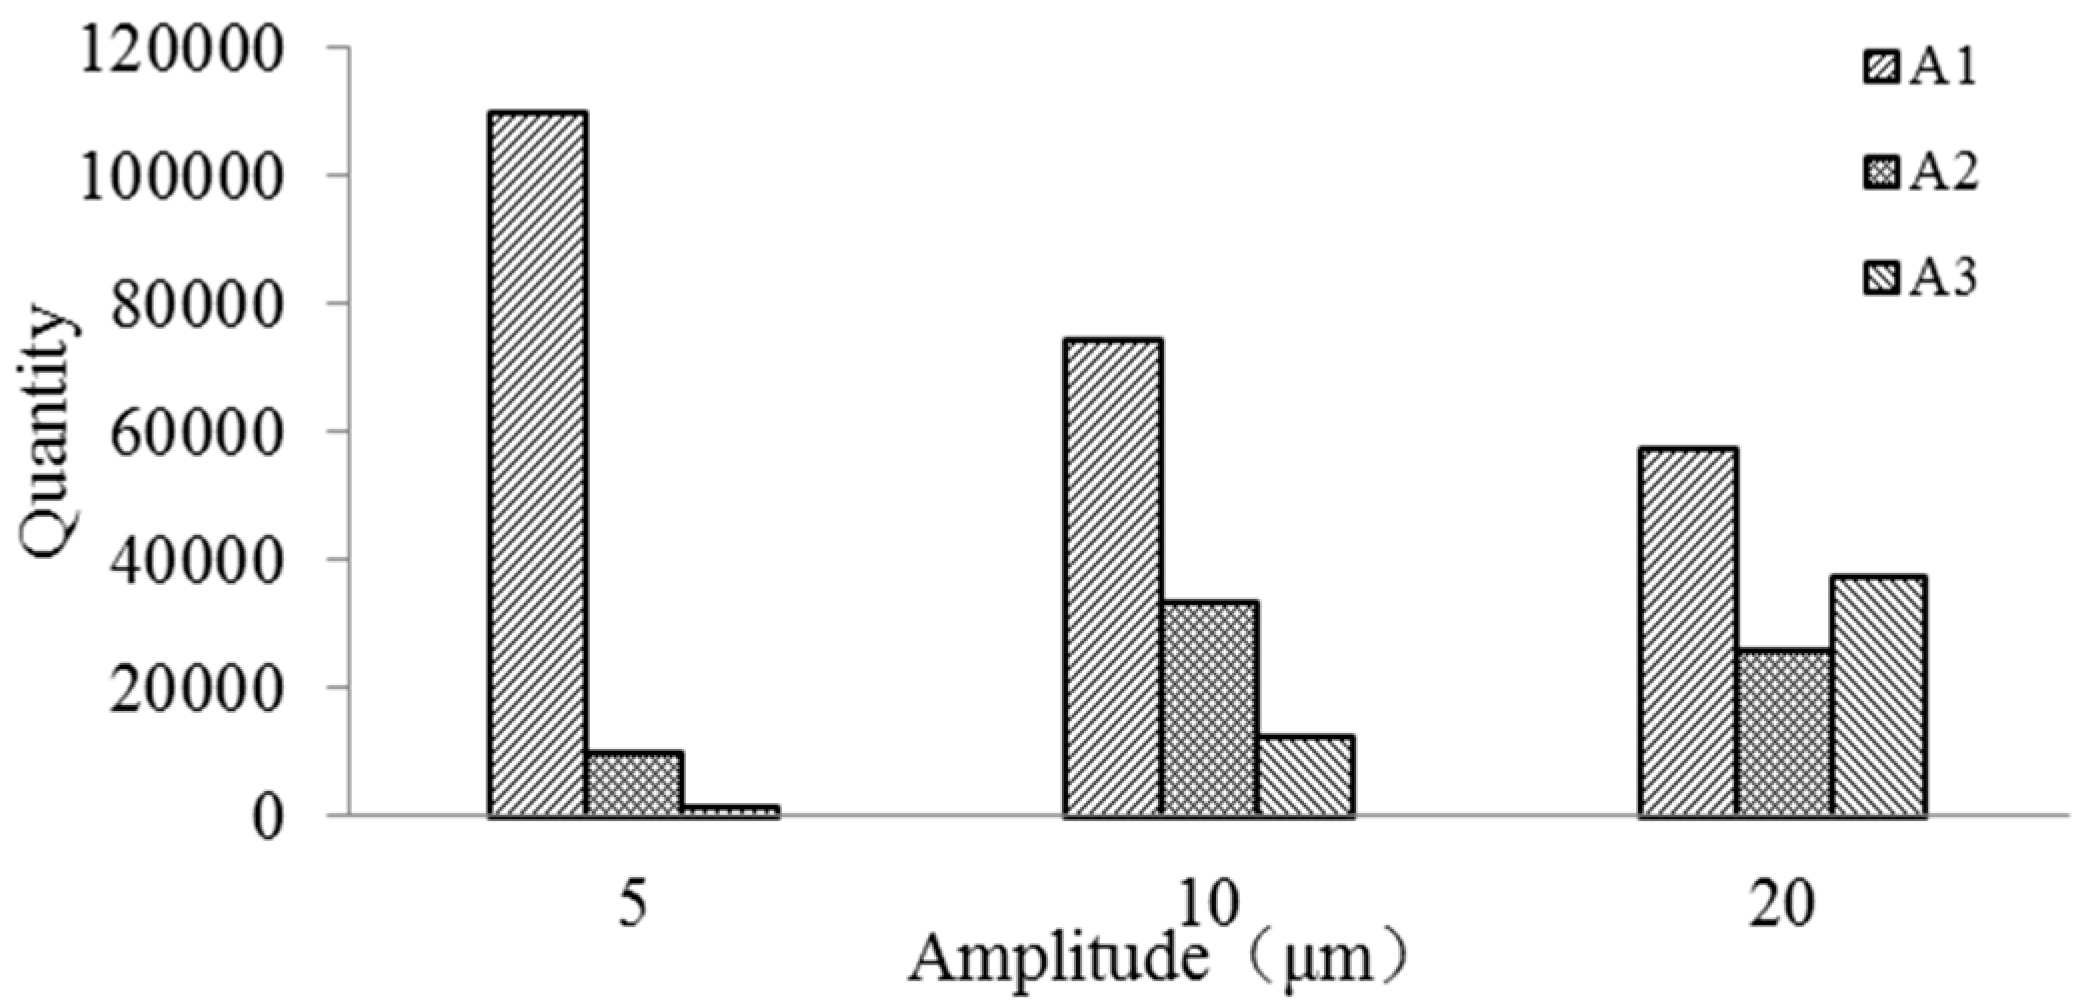
3.2. Impact of Vibration Amplitude on the Debris Removal
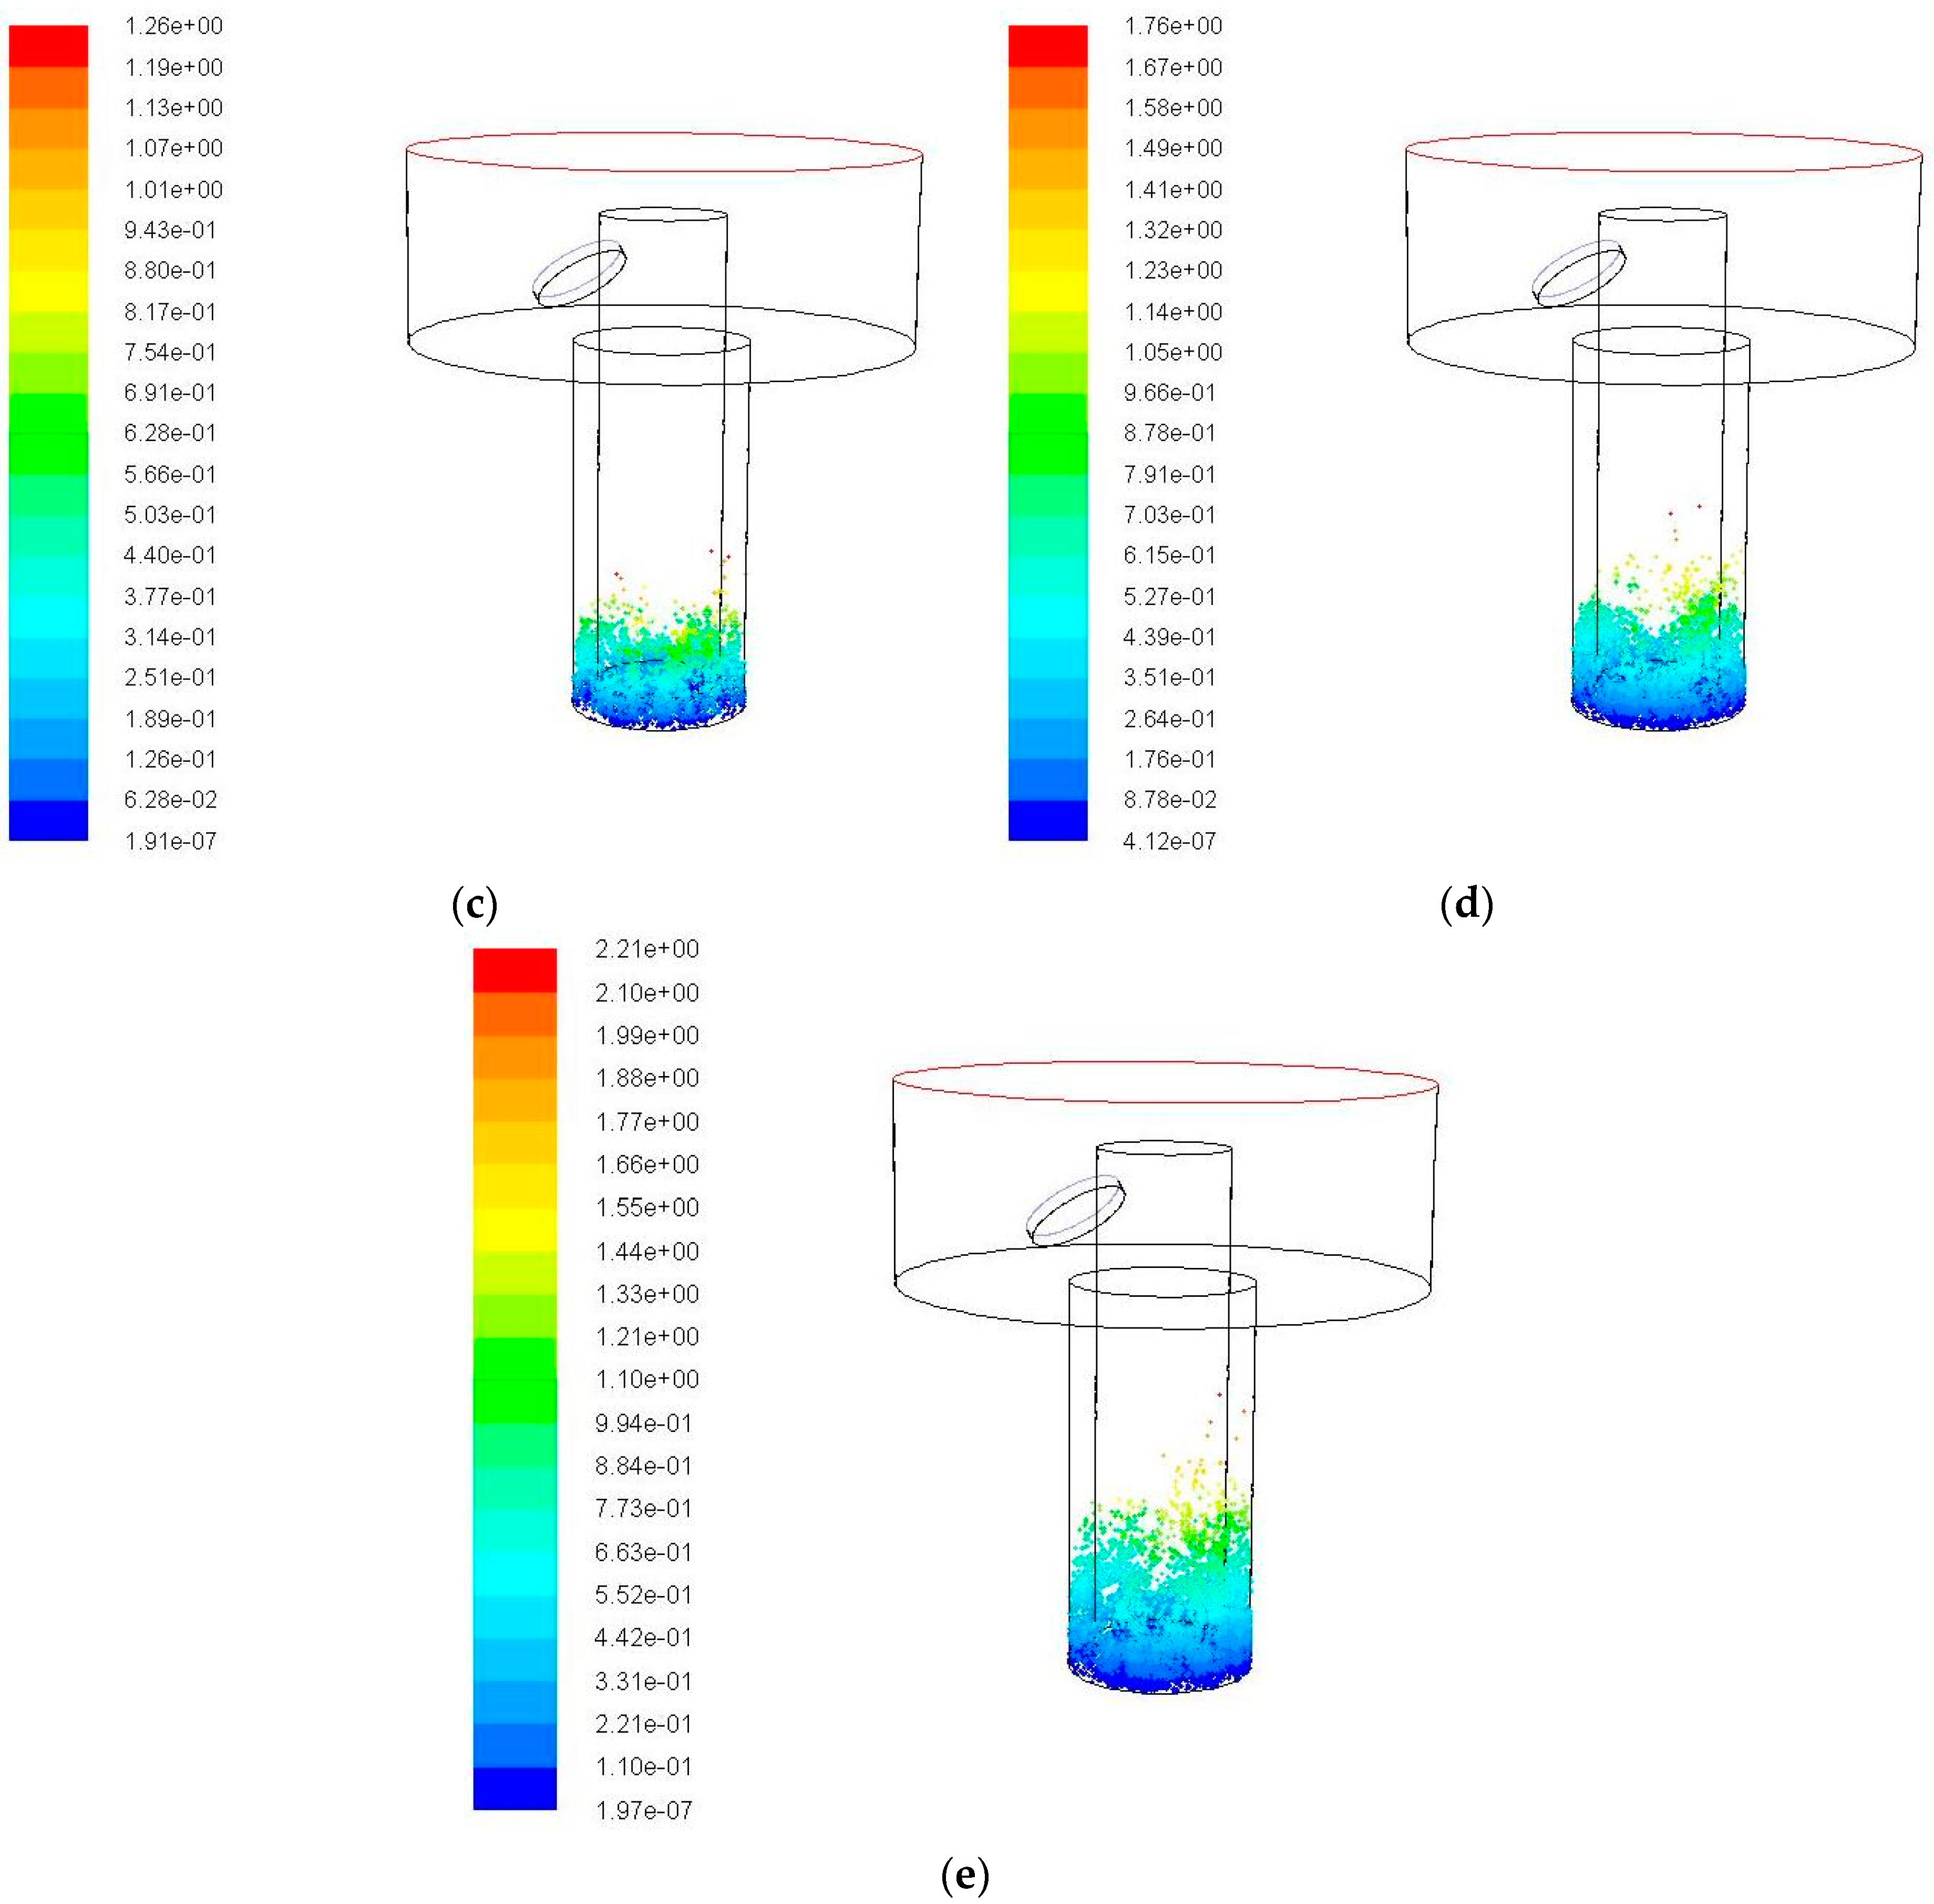
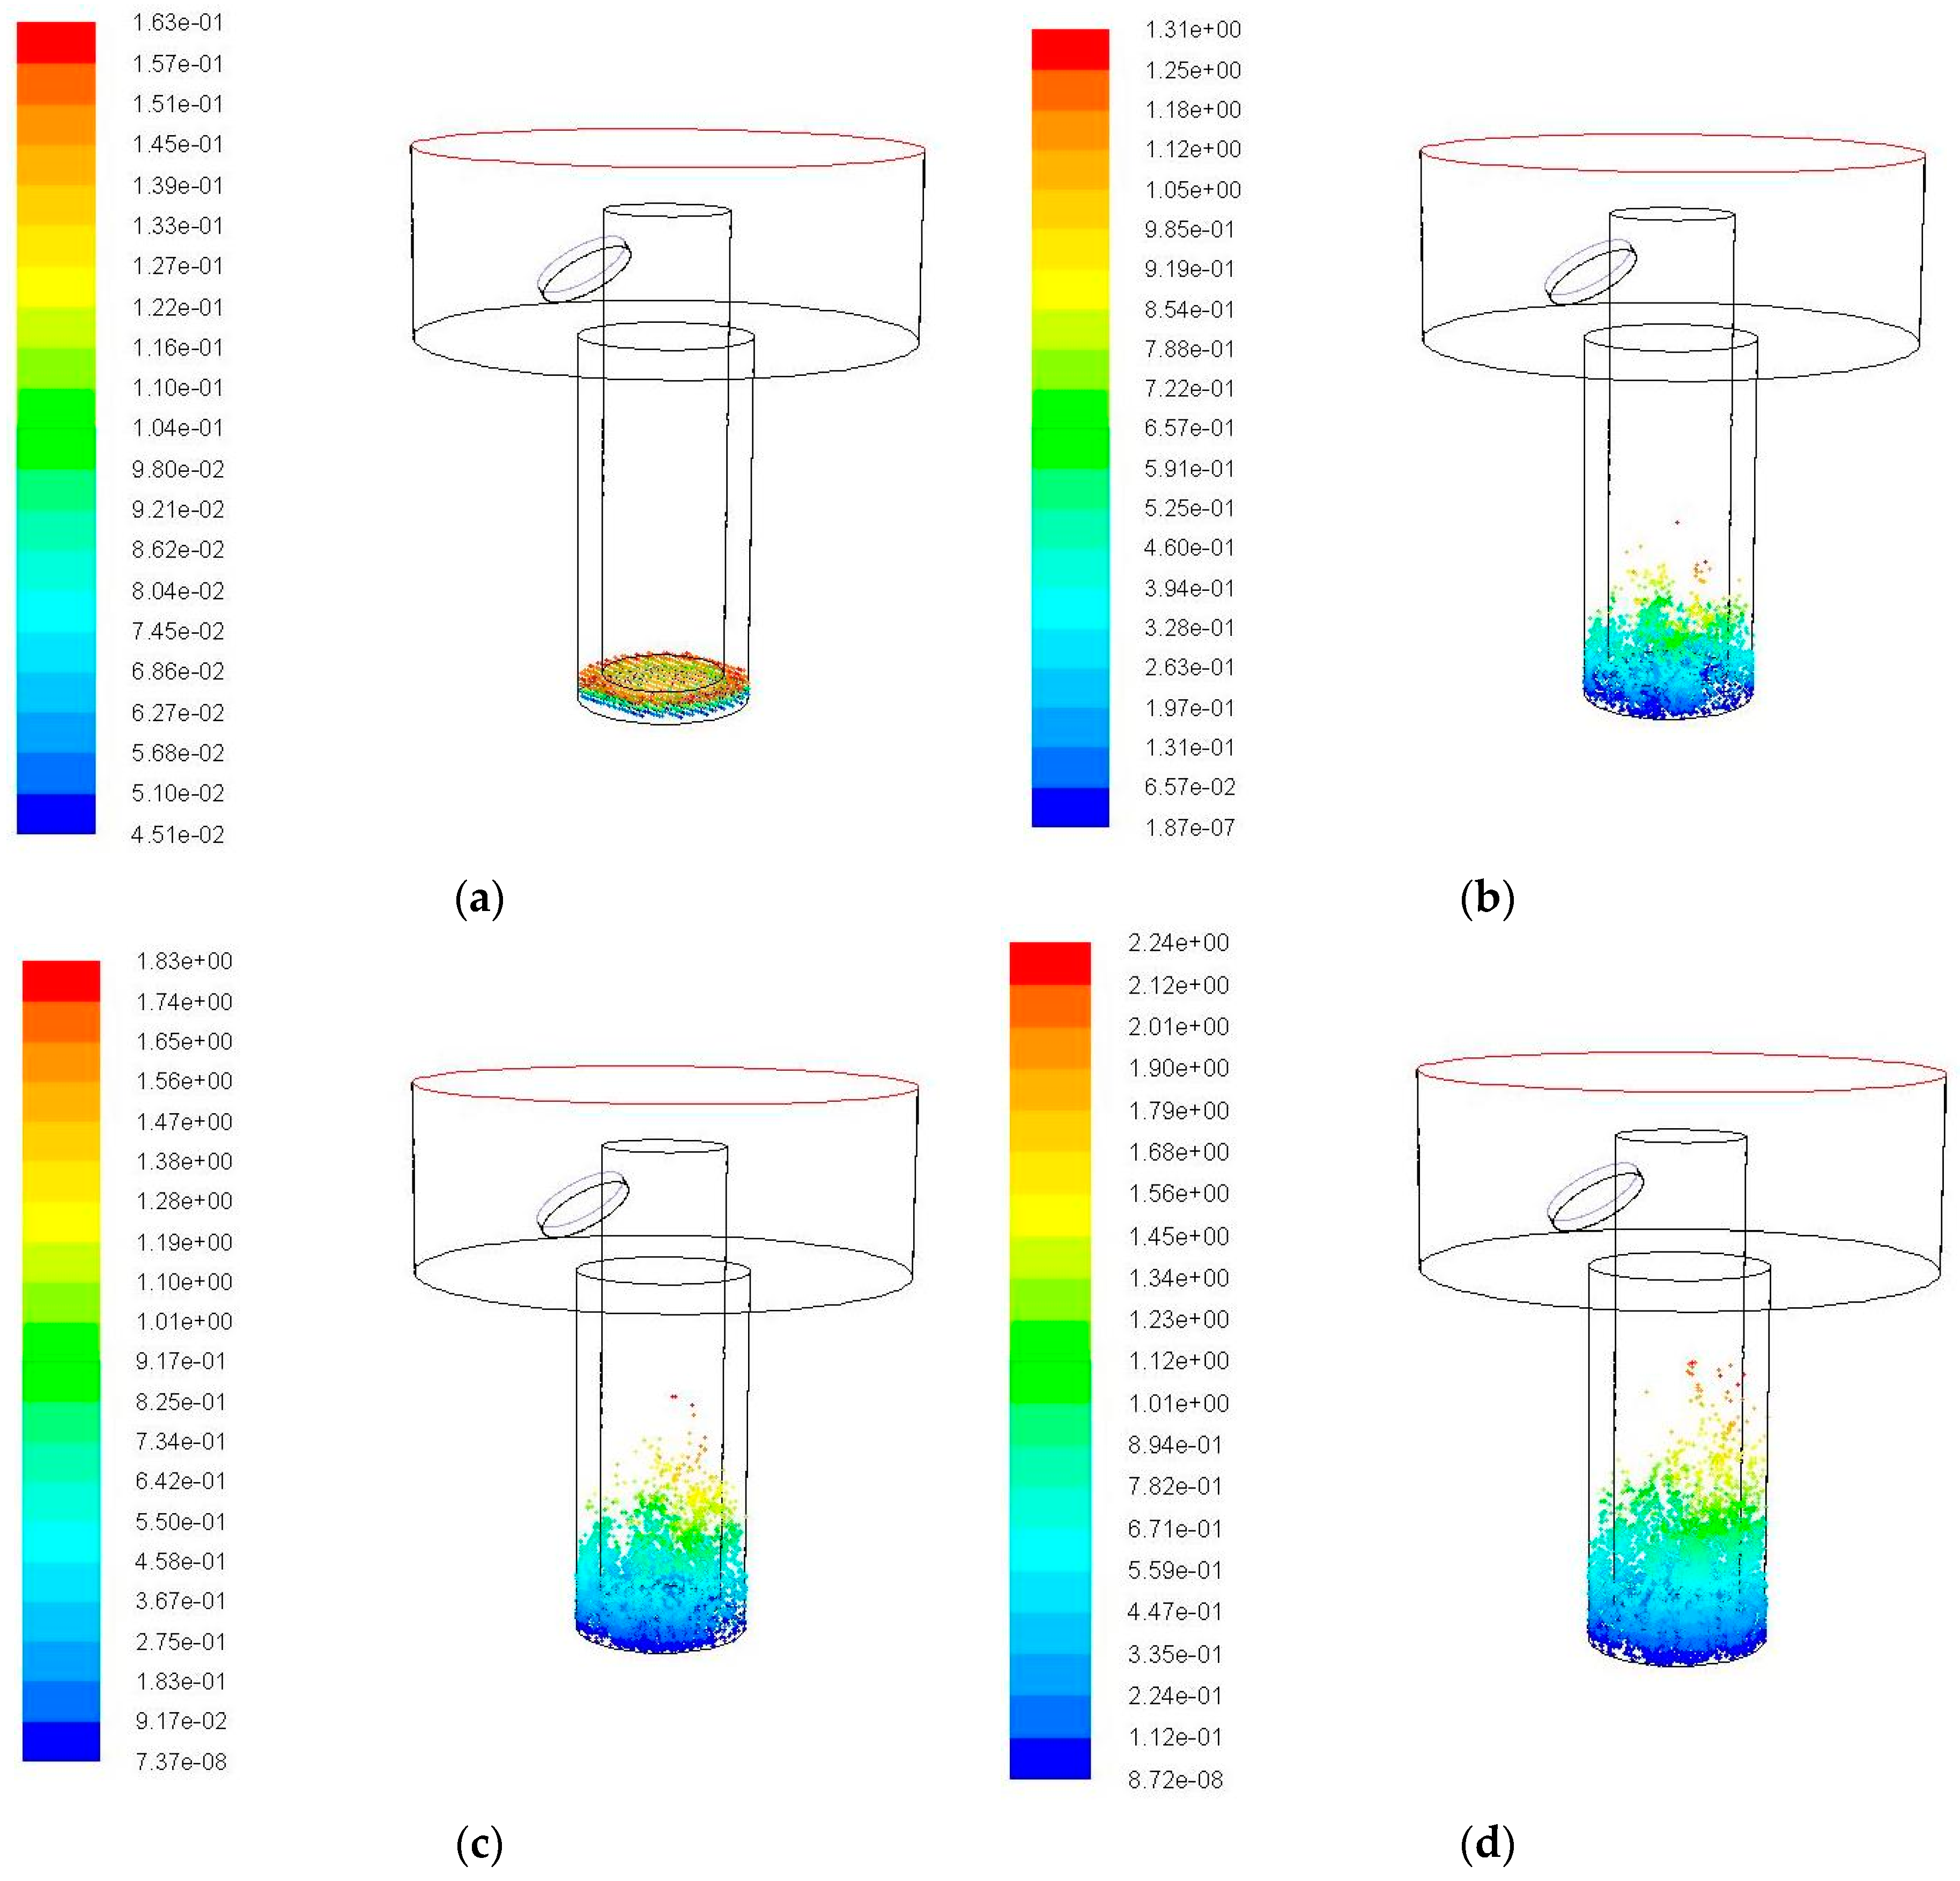
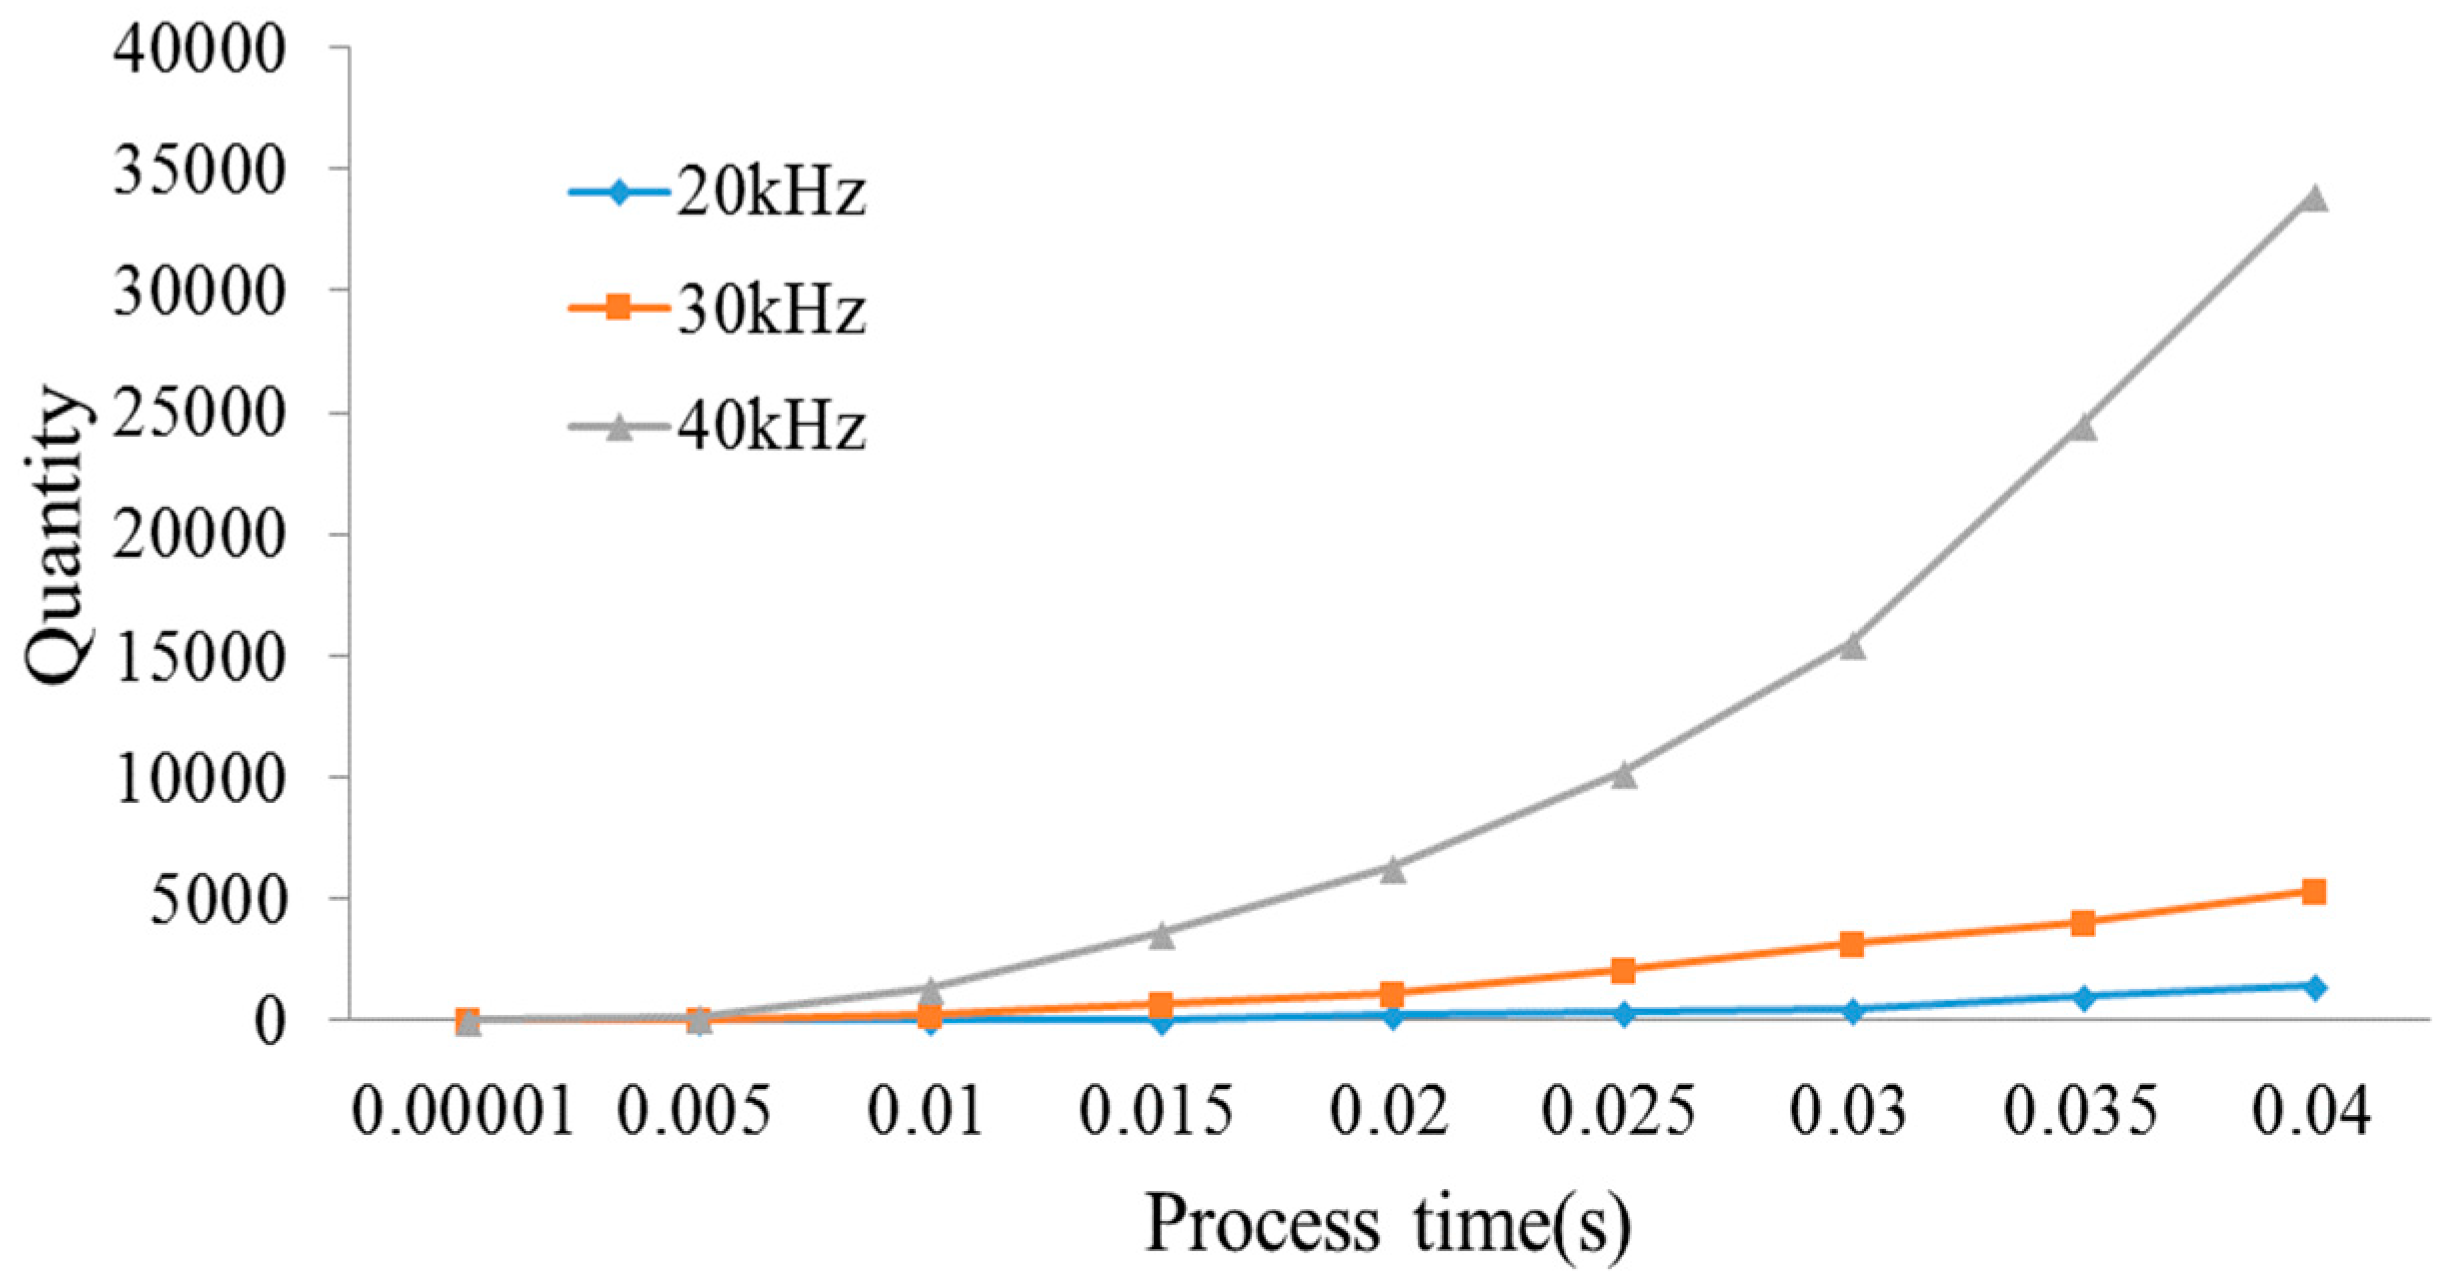
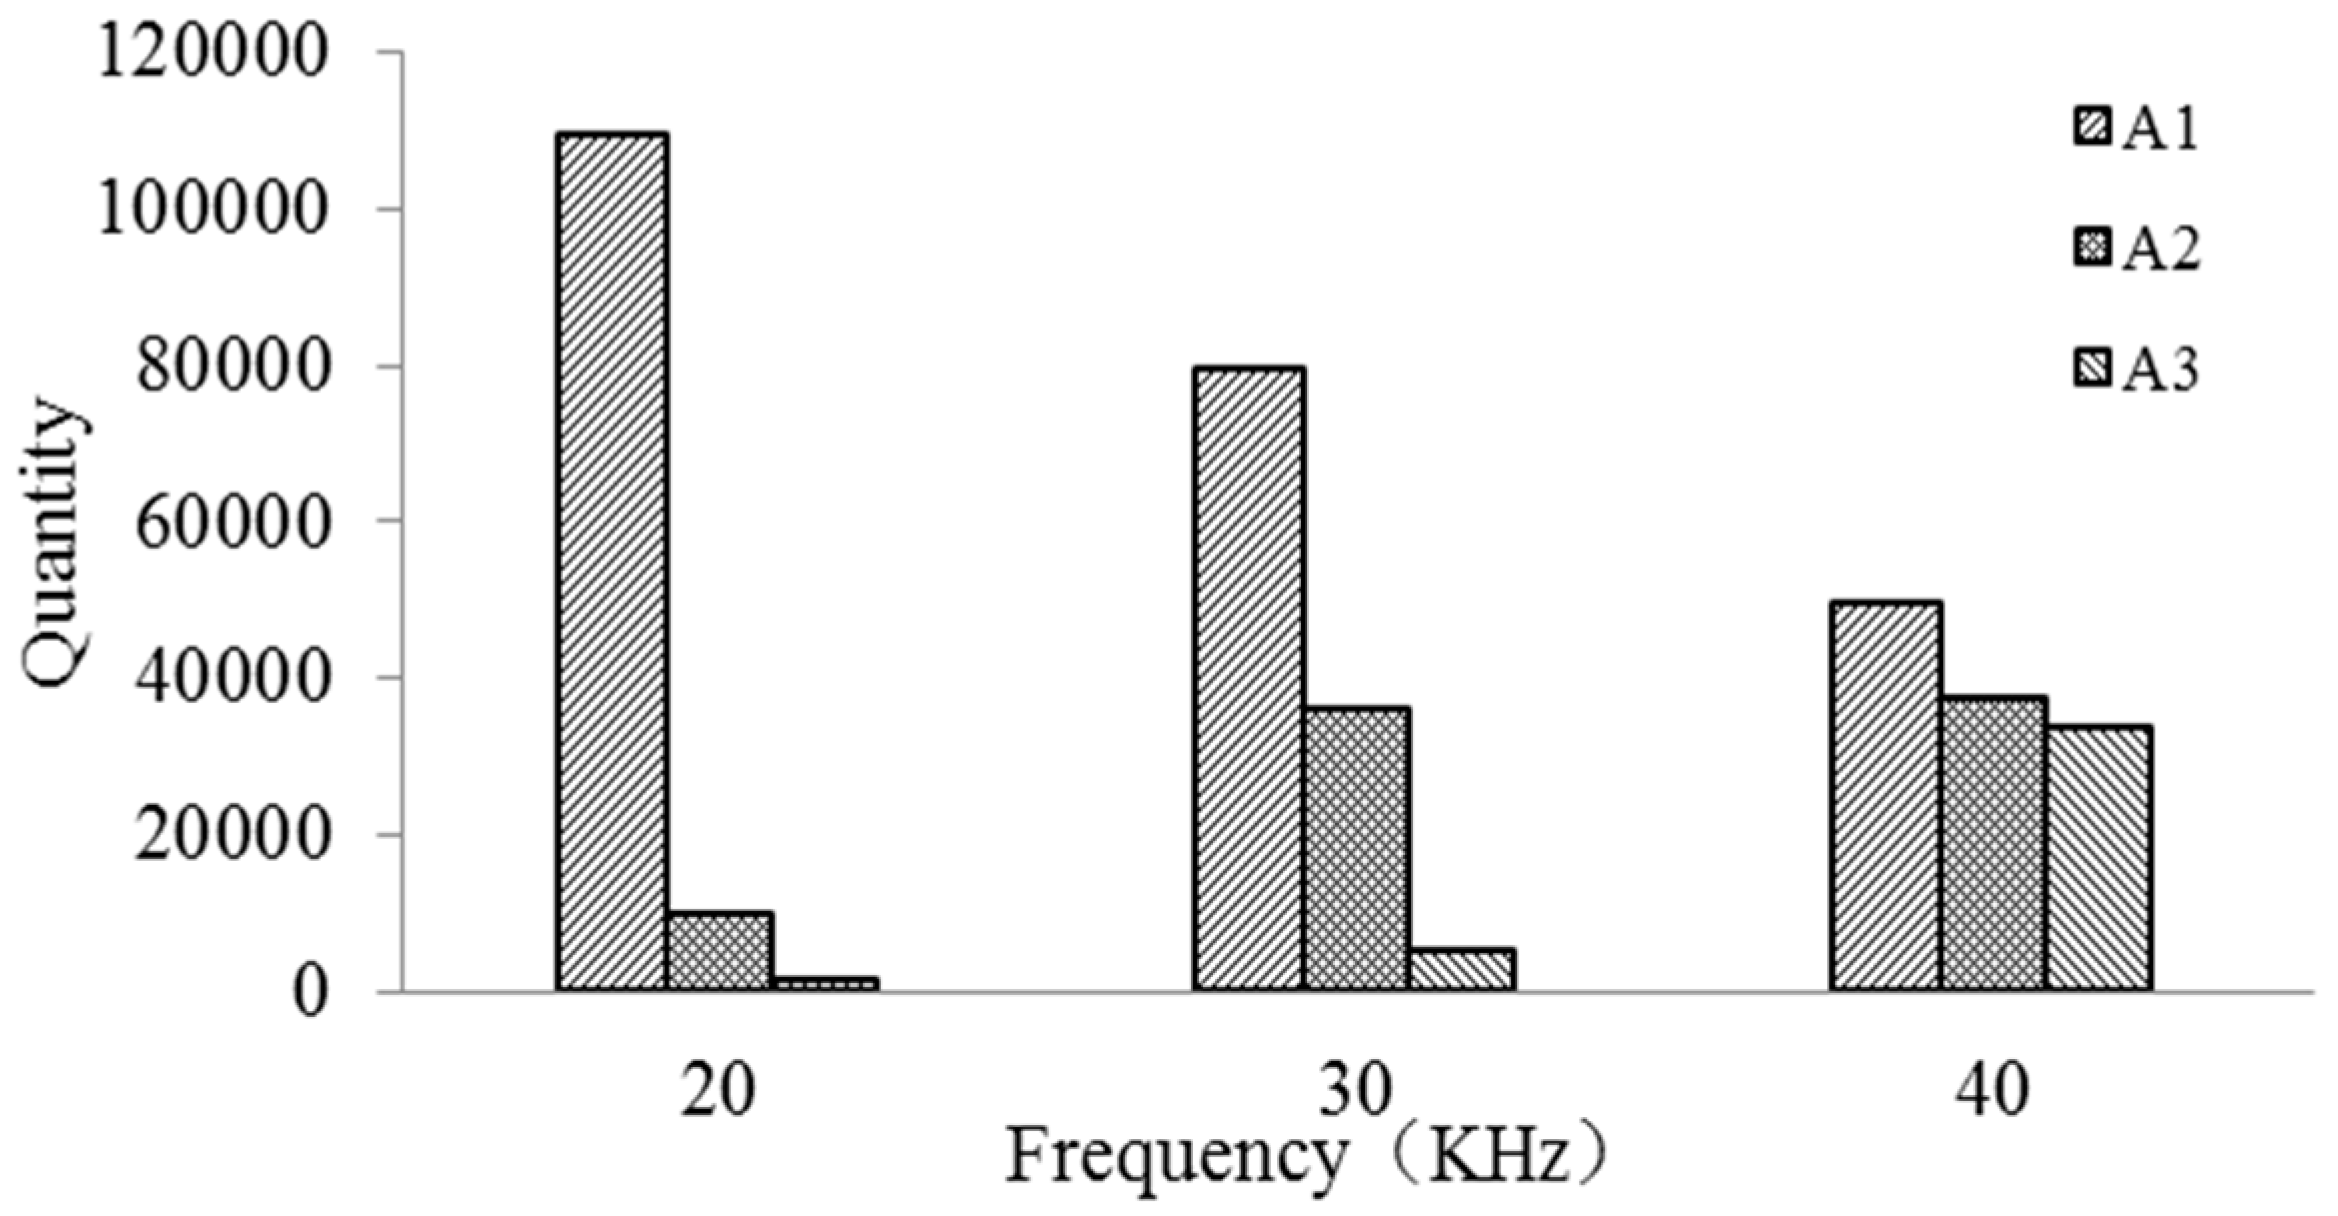
3.3. Impact of Vibration Frequency on the Debris Removal
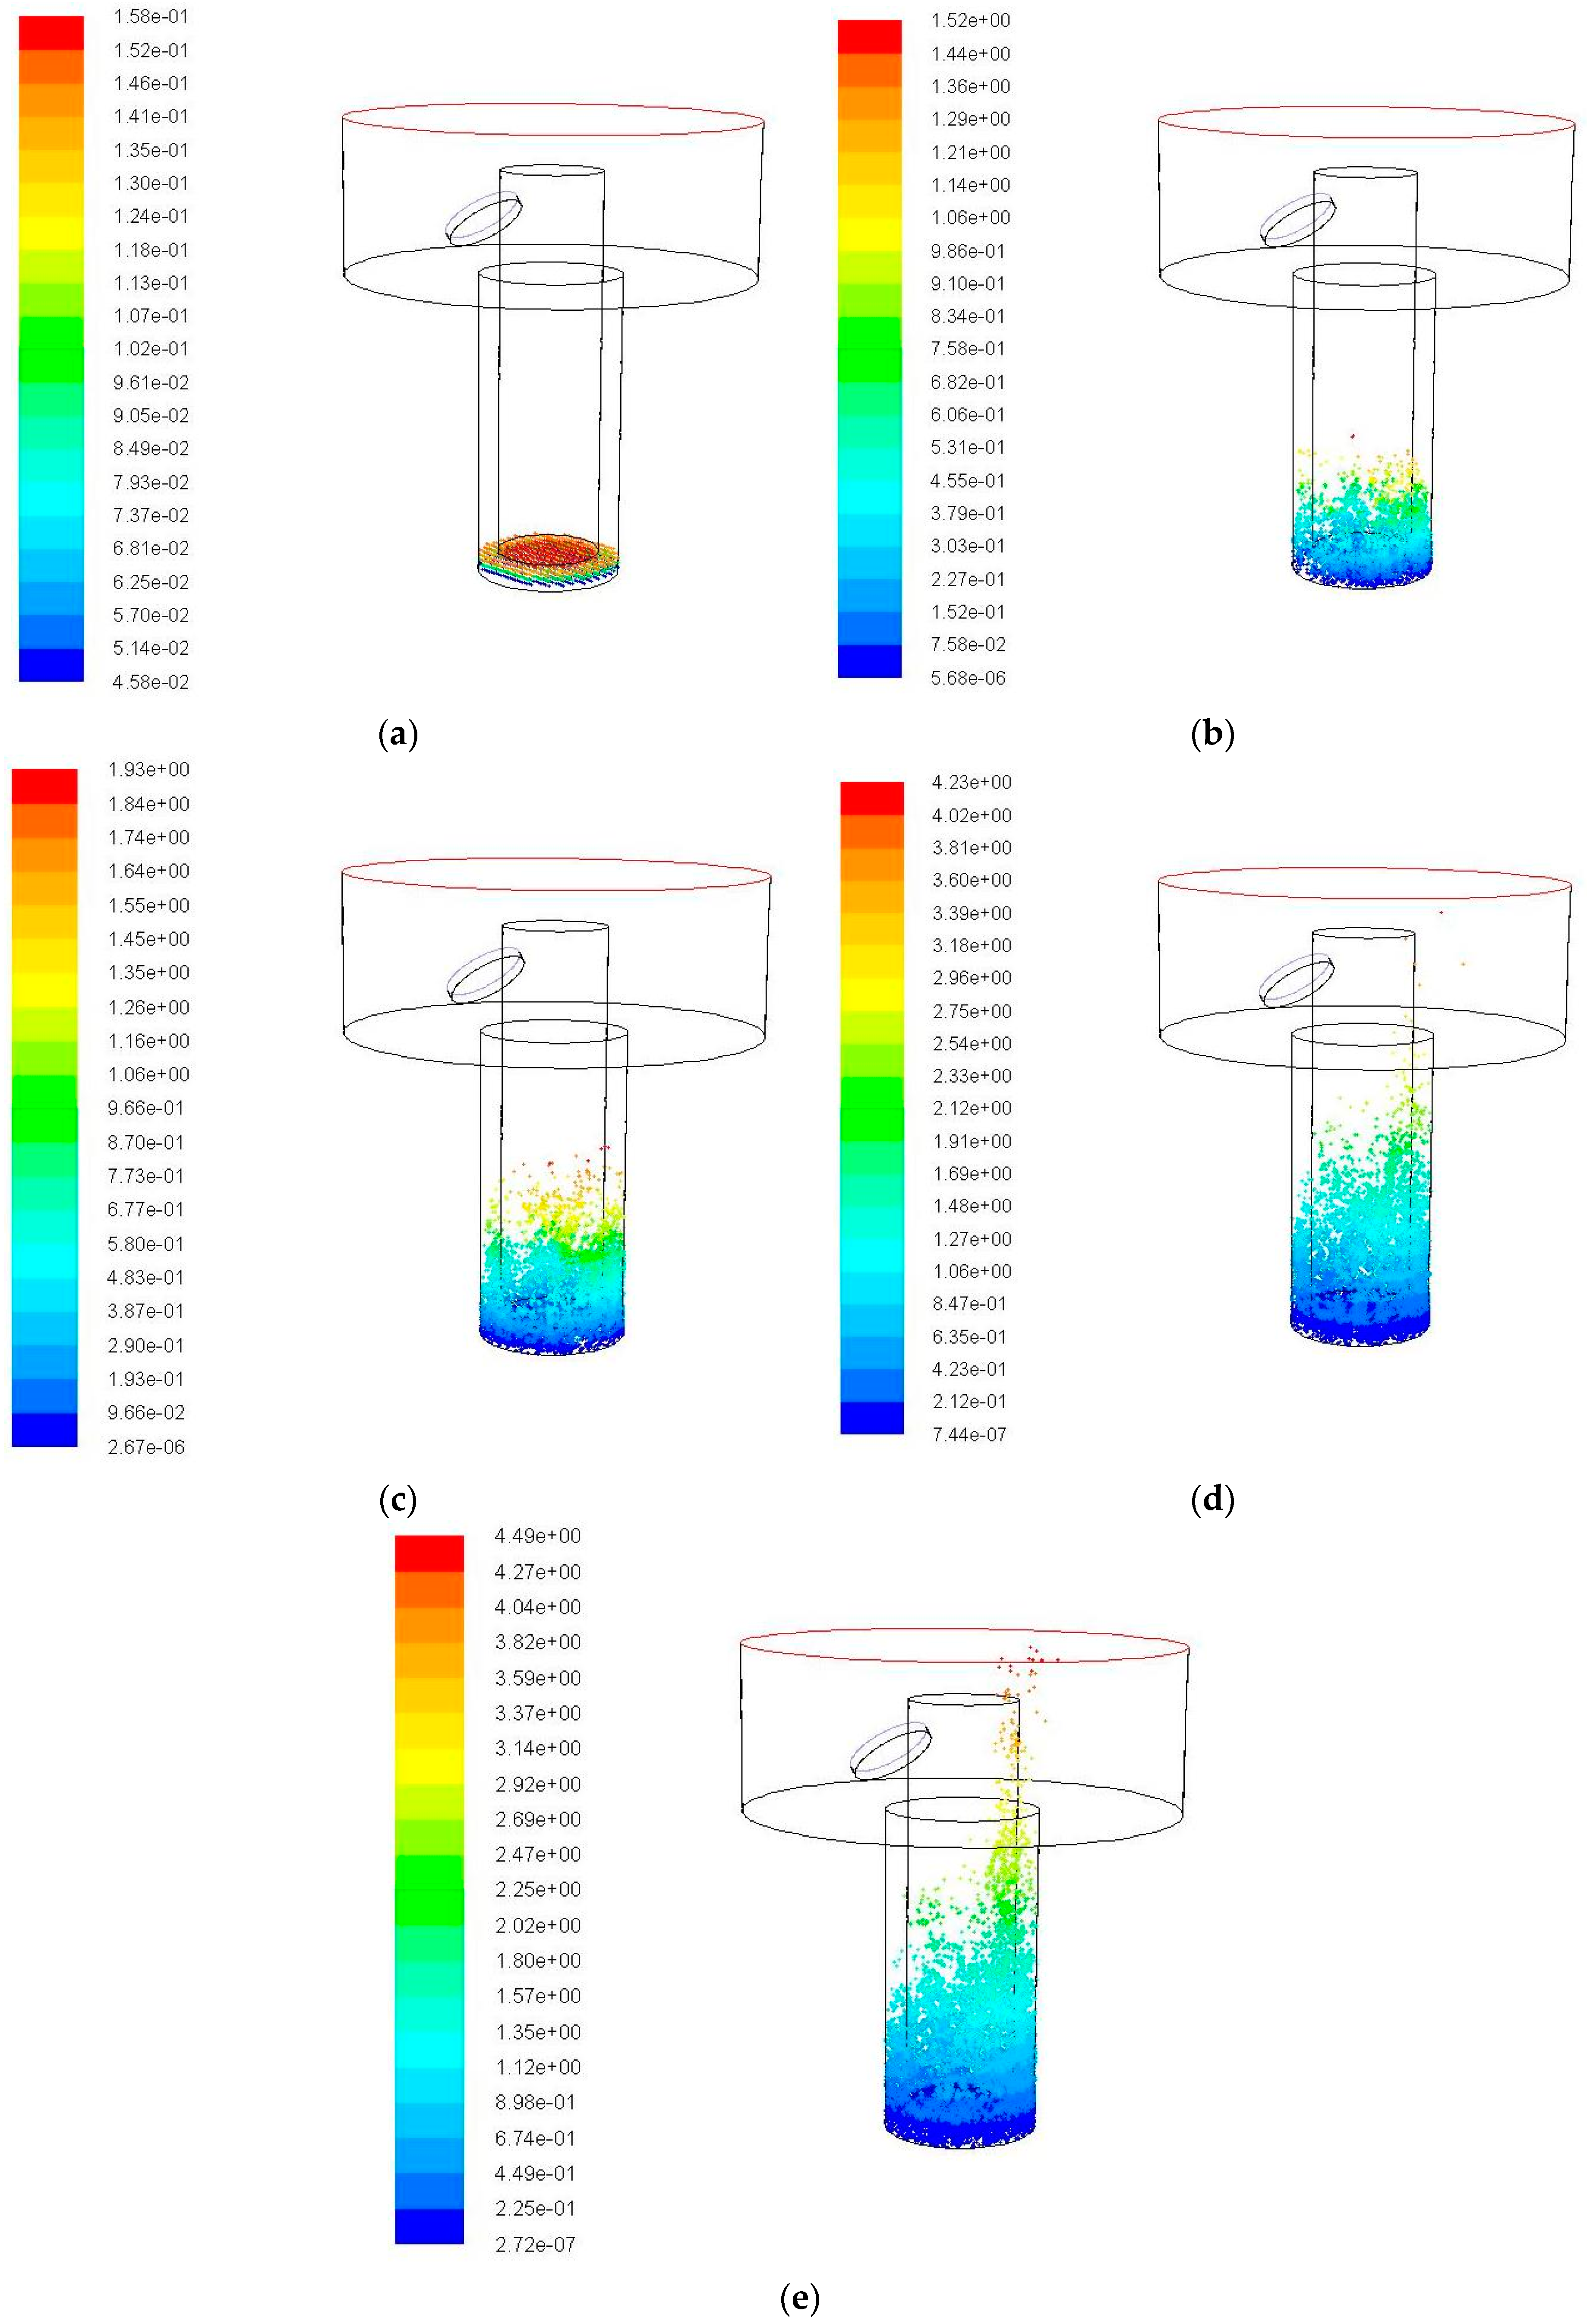
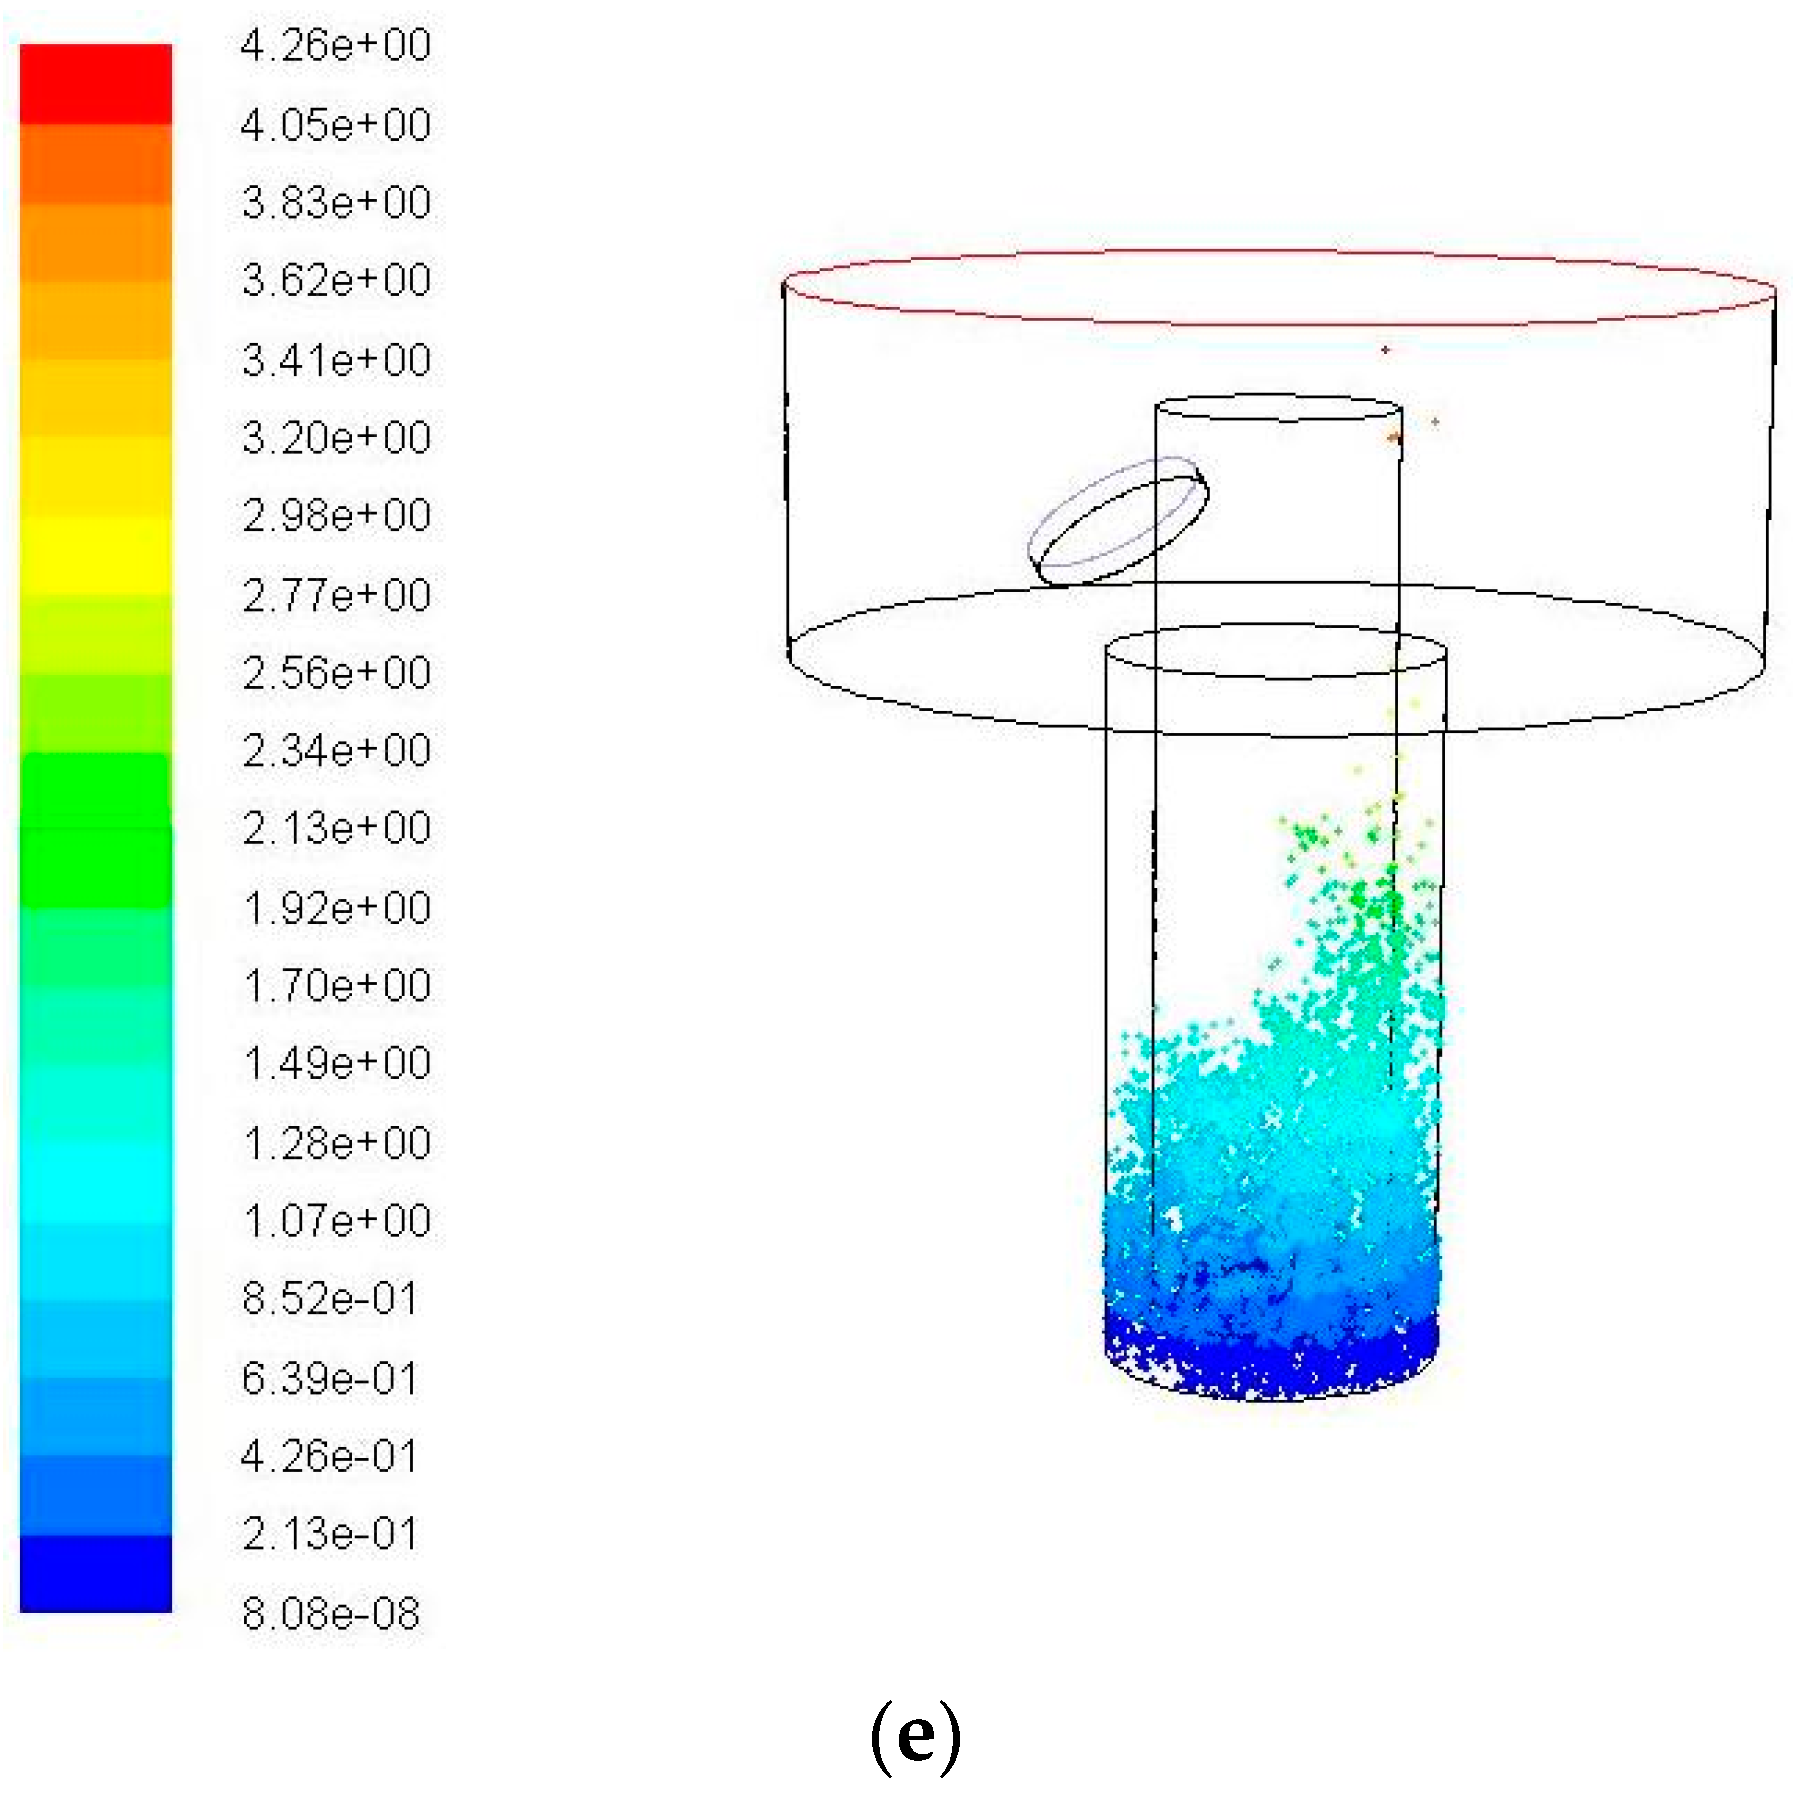
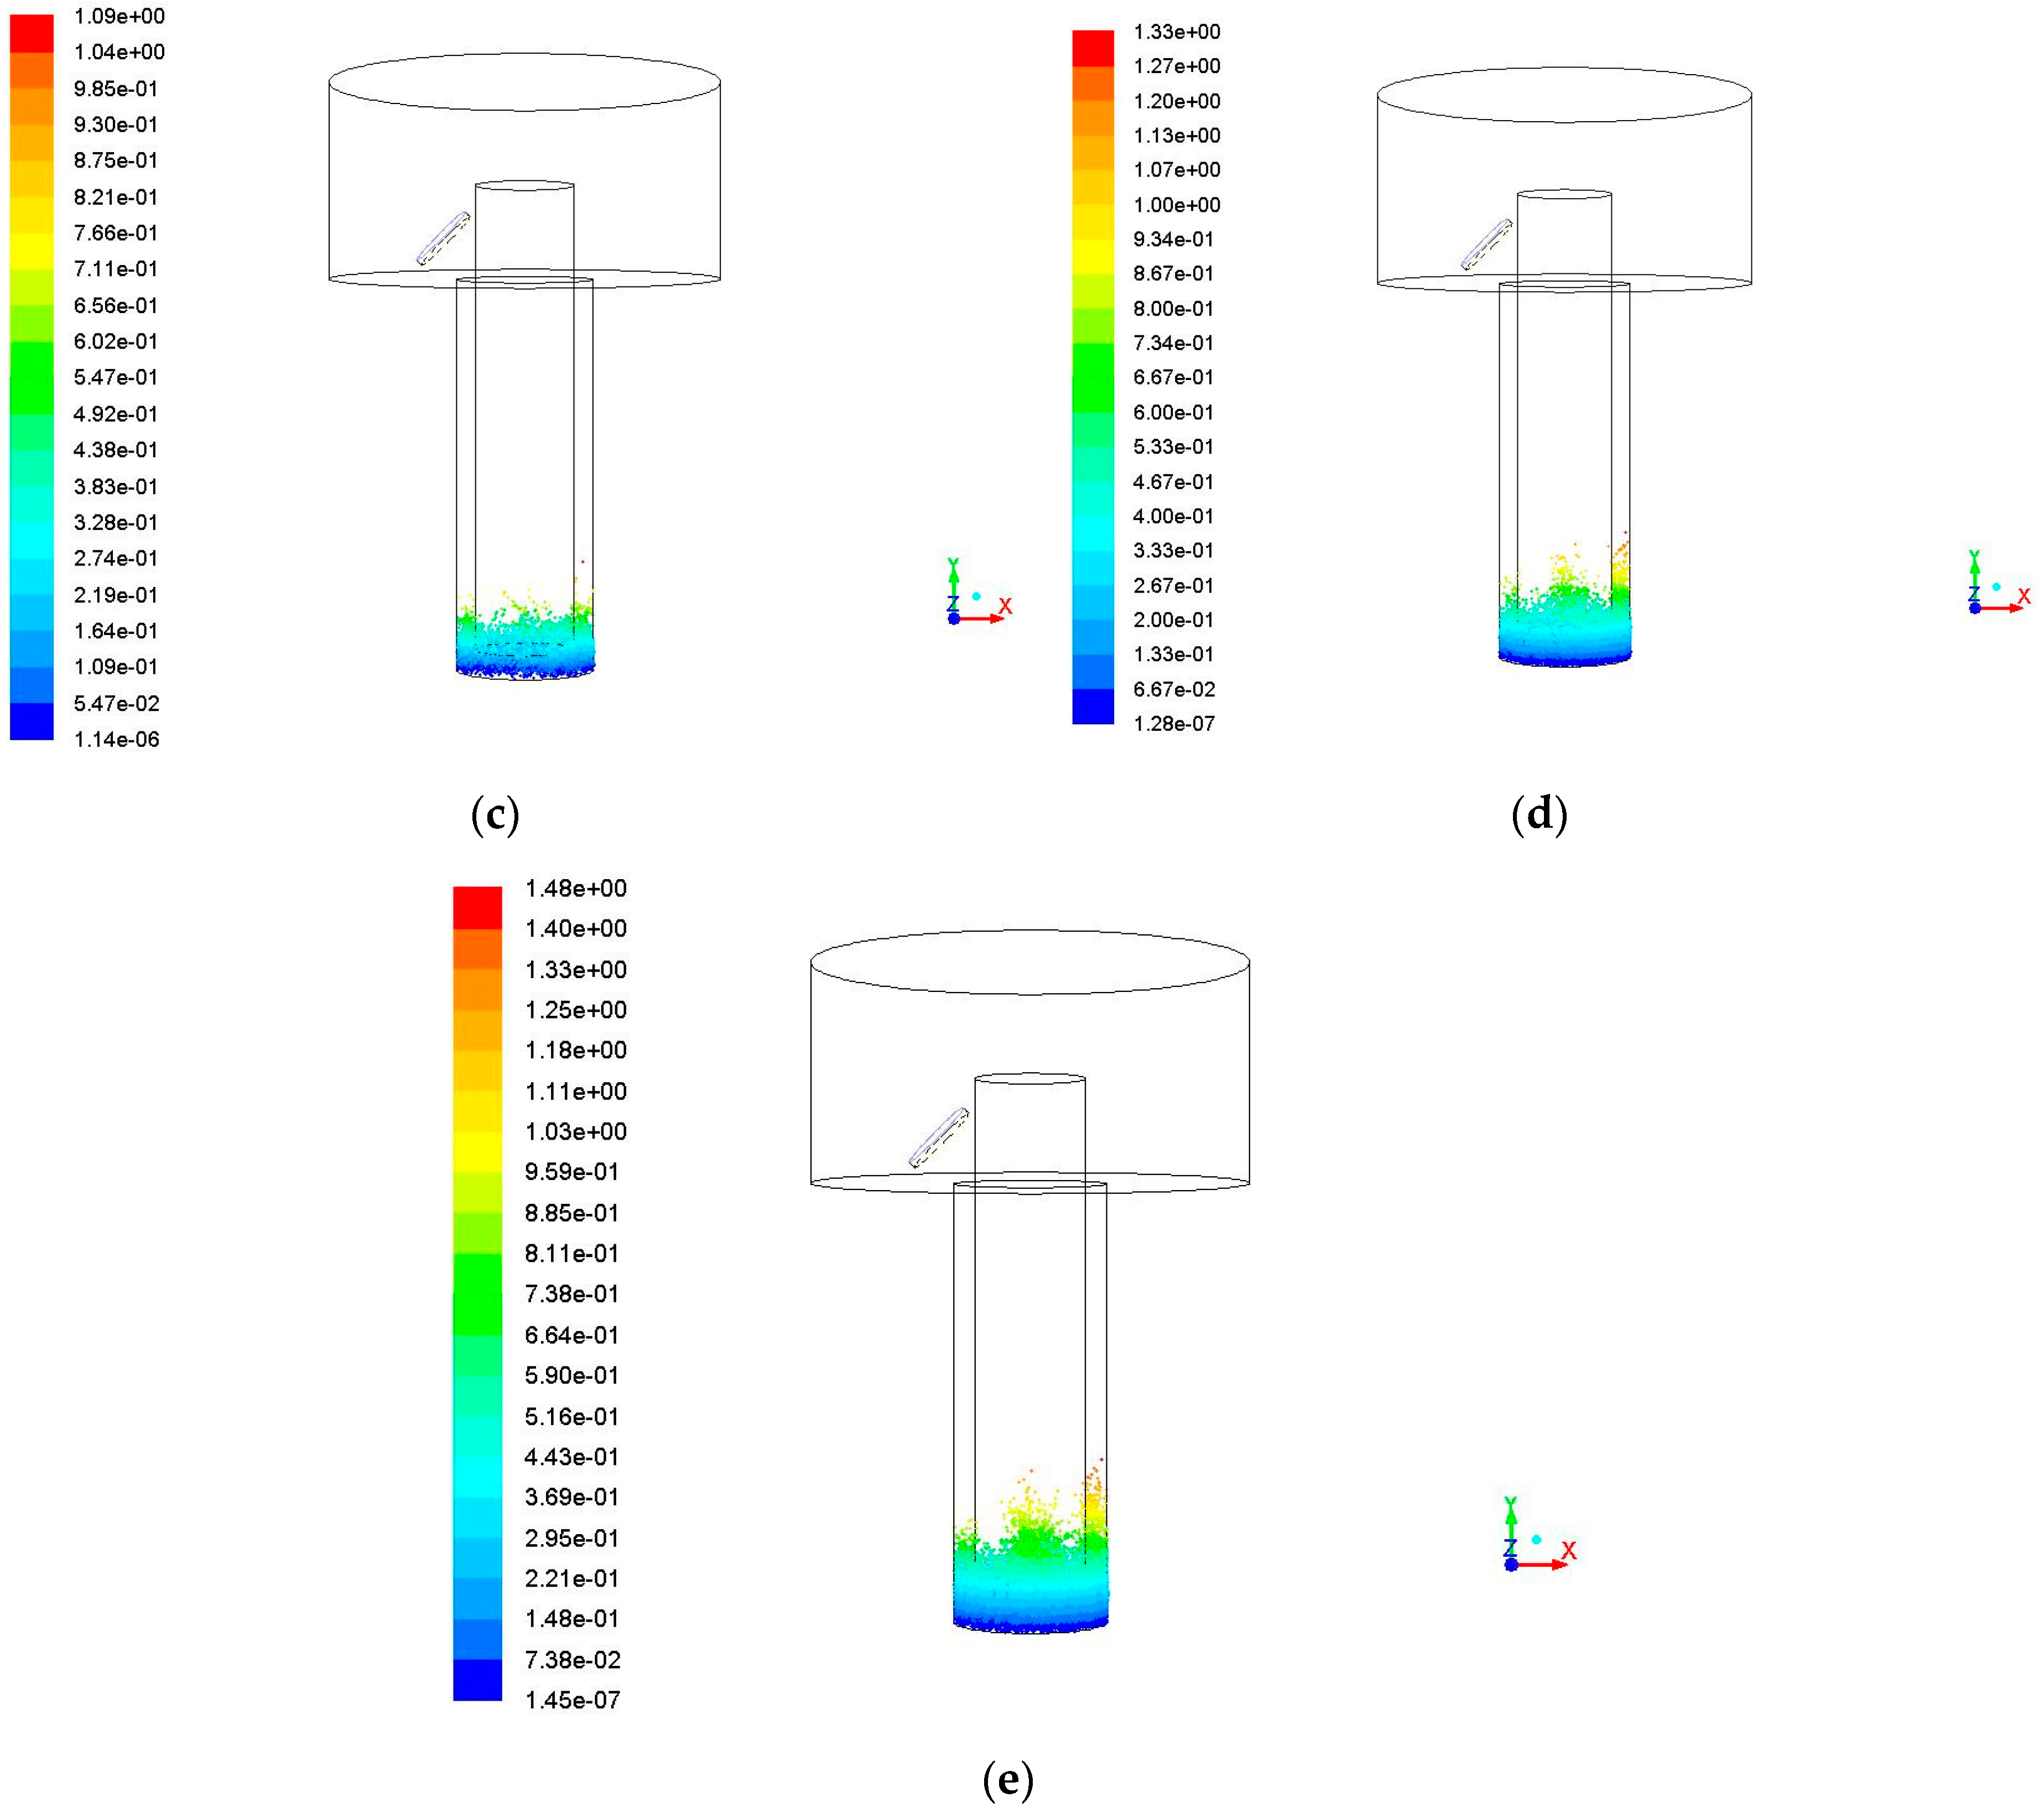
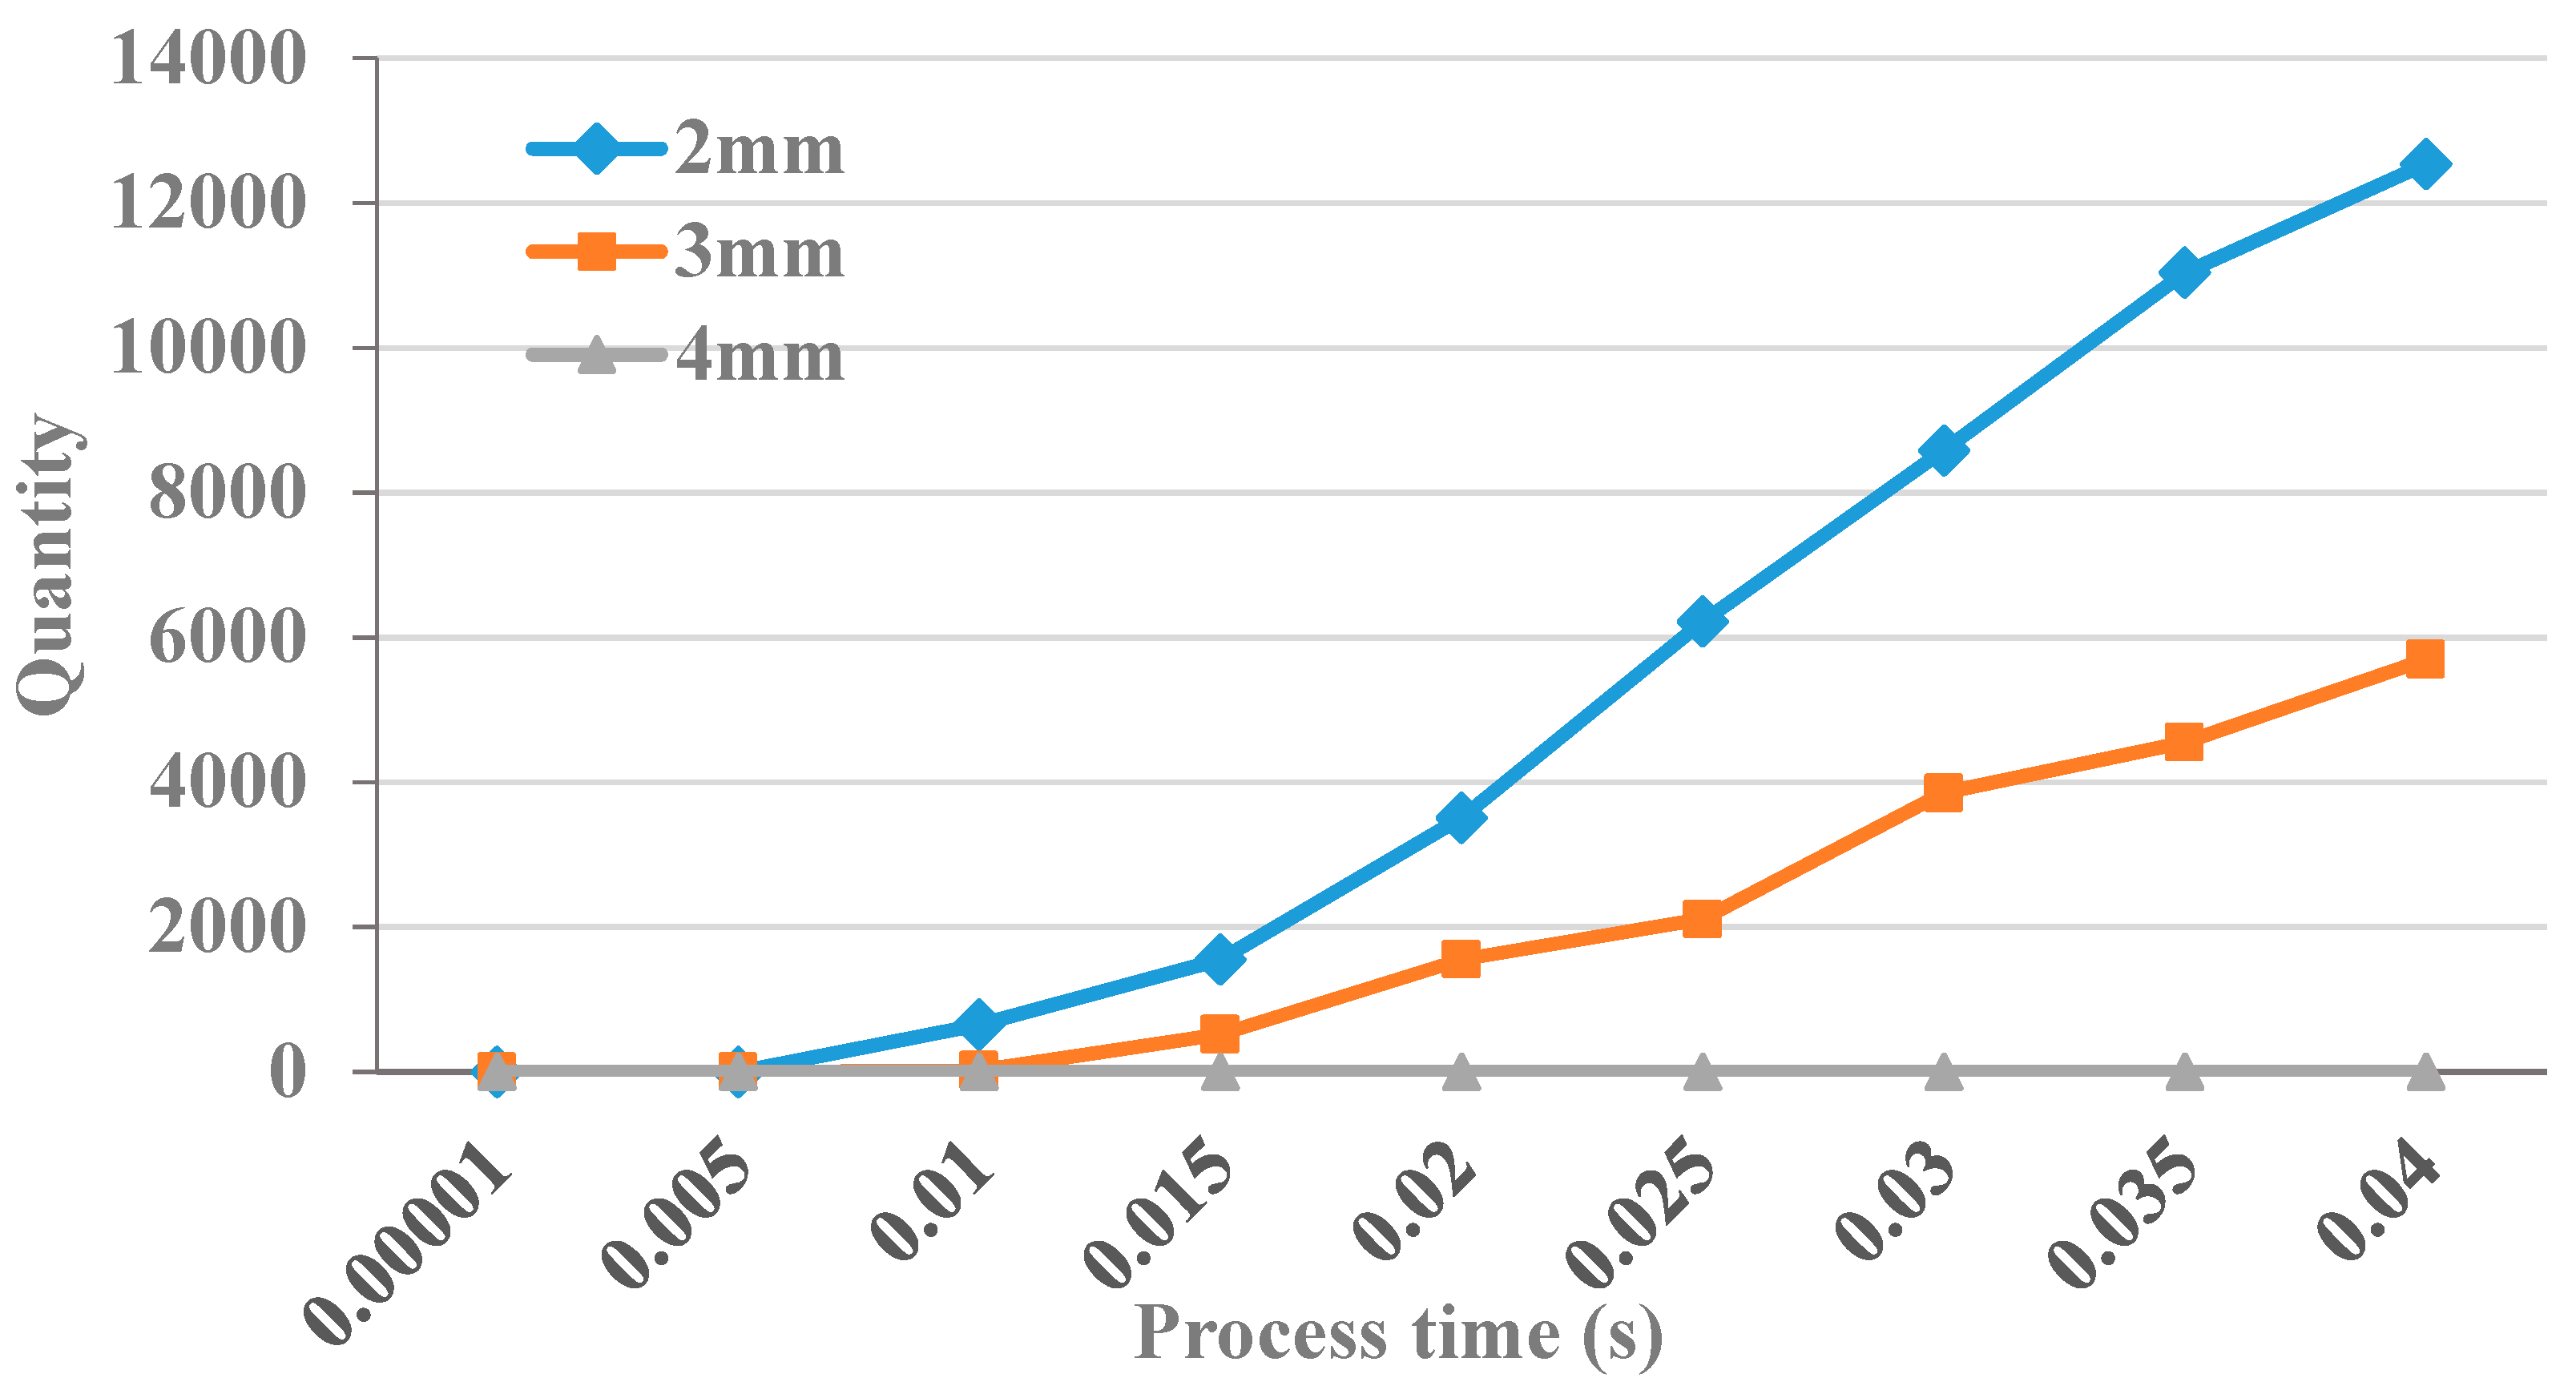
3.4. Debris Removal under Different Hole Depths
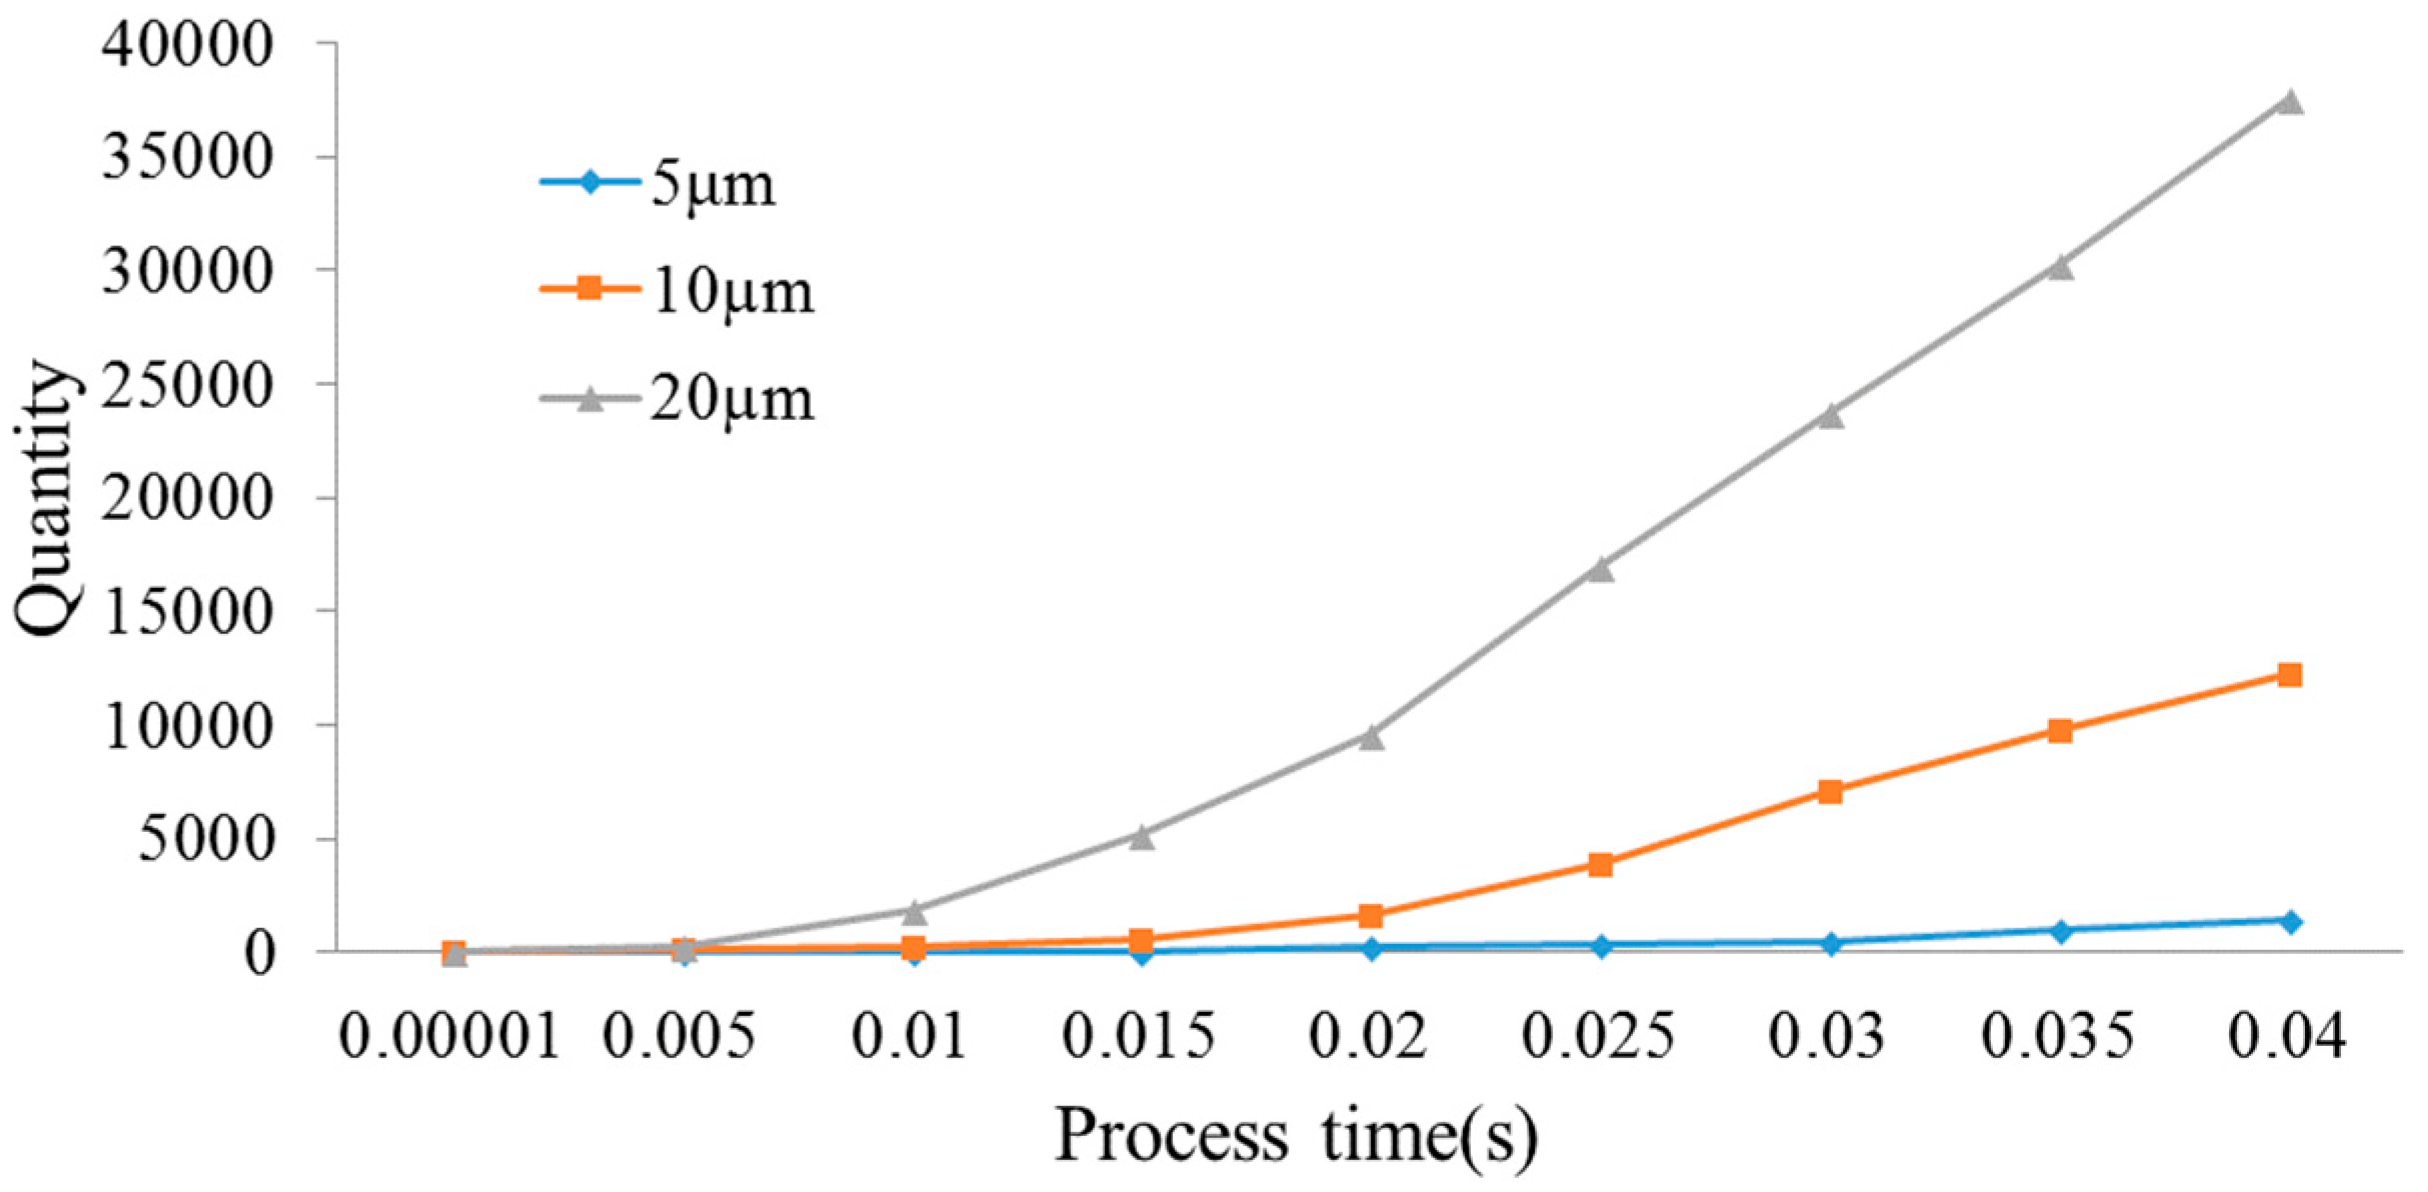
4. Statistics and Analysis of Debris Distribution
4.1. Impact of Vibration Amplitude on the Debris Distribution
4.2. Impact of Vibration Frequency on the Debris Distribution
4.3. Effect of Hole Depth on the Distribution of Debris
5. Conclusions
Author Contributions
Acknowledgments
Conflicts of Interest
References
- Pradhan, B.B.; Masanta, M.; Sarkar, B.R.; Bhattacharyya, B. Investigation of electro-discharge micro-machining of titanium super alloy. Int. J. Adv. Manuf. Technol. 2009, 41, 1094–1106. [Google Scholar] [CrossRef]
- Zhang, W.; Liu, Y.; Zhang, S.; Ma, F.; Wang, P.; Yan, C. Research on the Gap Flow Simulation of Debris Removal Process for Small Hole EDM Machining with Ti Alloy. Adv. Comput. Sci. Res. 2015, 39, 2121–2126. [Google Scholar]
- Cetin, S.; Okada, A.; Uno, Y. Effect of Debris Distribution on Wall Concavity in Deep-Hole EDM. JSME Int. J. 2004, 47, 553–559. [Google Scholar] [CrossRef] [Green Version]
- Wang, J.; Wang, Y.G.; Zhao, F.L. Simulation of Debris Movement in Micro Electrical Discharge Machining of Deep Holes. Mater. Sci. Forum 2009, 626–627, 267–272. [Google Scholar] [CrossRef]
- Wang, J.; Han, F. Simulation model of debris and bubble movement in consecutive-pulse discharge of electrical discharge machining. Int. J. Mach. Tools Manuf. 2014, 77, 56–65. [Google Scholar] [CrossRef]
- Wang, Y.Q.; Bai, J.C.; Guo, Y.F.; Huang, H.; Cao, M.R.; Mei, J.H. Numerical Simulation of the debris distribution in Liquid-Solid Two-Phase Flow Field of High Speed Small Hole EDM drilling. In Proceedings of the 13th National Academic Conference on Non Traditional Machining, Nanchang, China, 24 October 2009. (In Chinese). [Google Scholar]
- Ekmekci, B.; Sayar, A. Debris and consequences in micro electric discharge machining of micro-holes. Int. J. Mach. Tools Manuf. 2013, 65, 58–67. [Google Scholar] [CrossRef]
- Mastud, S.A.; Kothari, N.S.; Singh, R.K.; Joshi, S.S. Modeling Debris Motion in Vibration Assisted Reverse Micro Electrical Discharge Machining Process (R-MEDM). J. Microelectromech. Syst. 2015, 24, 661–676. [Google Scholar] [CrossRef]
- Chang, W.; Chen, Y.; Zhang, J.; Gu, X.; Fang, M. Ultrasonic vibration aided electrical-discharge milling flow field and debris distribution field simulation. J. Basic Sci. Eng. 2015, s1, 151–157. (In Chinese) [Google Scholar]
- Murray, J.W.; Sun, J.; Patil, D.V.; Wood, T.A.; Clare, A.T. Physical and electrical characteristics of EDM debris. J. Mater. Process. Technol. 2016, 229, 54–60. [Google Scholar] [CrossRef]
- Pattabhiraman, A.; Marla, D.; Kapoor, S. A computational model to investigate the flushing of electric discharge machining. J. Micro Nano Manuf. 2016, 4, 031002. [Google Scholar] [CrossRef]
- Tanjilul, M.; Ahmed, A.; Kumar, A.S.; Rahman, M. A study on EDM debris particle size and flushing mechanism for efficient debris removal in EDM-drilling of Inconel 718. J. Mater. Process. Technol. 2018, 255, 263–274. [Google Scholar] [CrossRef]
- Ferraris, E.; Castiglioni, V.; Ceyssens, F.; Annoni, M.; Lauwers, B.; Reynaerts, D. EDM drilling of ultra-high aspect ratio micro holes with insulated tools. CIRP Ann. 2013, 62, 191–194. [Google Scholar] [CrossRef]
- D’Urso, G.; Maccarini, G.; Quarto, M.; Ravasio, C. Investigation on power discharge in micro-EDM stainless steel drilling using different electrodes. J. Mech. Sci. Technol. 2015, 29, 4341–4349. [Google Scholar] [CrossRef]
- D’Urso, G.; Maccarini, G.; Ravasio, C. Influence of electrode material in micro-EDM drilling of stainless steel and tungsten carbide. Int. J. Adv. Manuf. Technol. 2016, 85, 2013–2025. [Google Scholar] [CrossRef]
- Bellotti, M.; Qian, J.; Reynaerts, D. Enhancement of the micro-EDM process for drilling through-holes. Procedia CIRP 2018, 68, 610–615. [Google Scholar] [CrossRef]
- Kliuev, M.; Baumgart, C.; Wegener, K. Fluid Dynamics in Electrode Flushing Channel and Electrode-Workpiece Gap During EDM Drilling. Procedia CIRP 2018, 68, 254–259. [Google Scholar] [CrossRef]
- Liang, Z.Q.; Zeng, L.W. Hydromechanics; Chongqing University Press: Chongqing, China, 2002. [Google Scholar]
- Munson, B.R.; Young, D.F.; Okiishi, T.H. Fundamentals of Fluid Mechanics; WILEY-INTERSCIENCE Publishing: New York, NY, USA, 1998. [Google Scholar]
- Fluent Inc. FLUENT 6.3 User’s Guide: Fluent Documentation; Fluent Incorporated Publishing: Lebanon, NH, USA, 2006. [Google Scholar]


| Solver | Time | Working Fluid | Velocity of Flushing | Ultrasonic Vibration | Flow Field Model | Time Step | Steps |
|---|---|---|---|---|---|---|---|
| Pressure | Transient | Deionized Water | 2 m/s | Call the DEFINE_CG_MOTION Macro Function. | Laminar-Model | 0.00001 | 4000 |
© 2018 by the authors. Licensee MDPI, Basel, Switzerland. This article is an open access article distributed under the terms and conditions of the Creative Commons Attribution (CC BY) license (http://creativecommons.org/licenses/by/4.0/).
Share and Cite
Liu, Y.; Chang, H.; Zhang, W.; Ma, F.; Sha, Z.; Zhang, S. A Simulation Study of Debris Removal Process in Ultrasonic Vibration Assisted Electrical Discharge Machining (EDM) of Deep Holes †. Micromachines 2018, 9, 378. https://doi.org/10.3390/mi9080378
Liu Y, Chang H, Zhang W, Ma F, Sha Z, Zhang S. A Simulation Study of Debris Removal Process in Ultrasonic Vibration Assisted Electrical Discharge Machining (EDM) of Deep Holes †. Micromachines. 2018; 9(8):378. https://doi.org/10.3390/mi9080378
Chicago/Turabian StyleLiu, Yu, Hao Chang, Wenchao Zhang, Fujian Ma, Zhihua Sha, and Shengfang Zhang. 2018. "A Simulation Study of Debris Removal Process in Ultrasonic Vibration Assisted Electrical Discharge Machining (EDM) of Deep Holes †" Micromachines 9, no. 8: 378. https://doi.org/10.3390/mi9080378