Deformation of Red Blood Cells, Air Bubbles, and Droplets in Microfluidic Devices: Flow Visualizations and Measurements

 , , and
Abstract
:1. Introduction
2. Deformation of RBCs in Microfluidic Devices
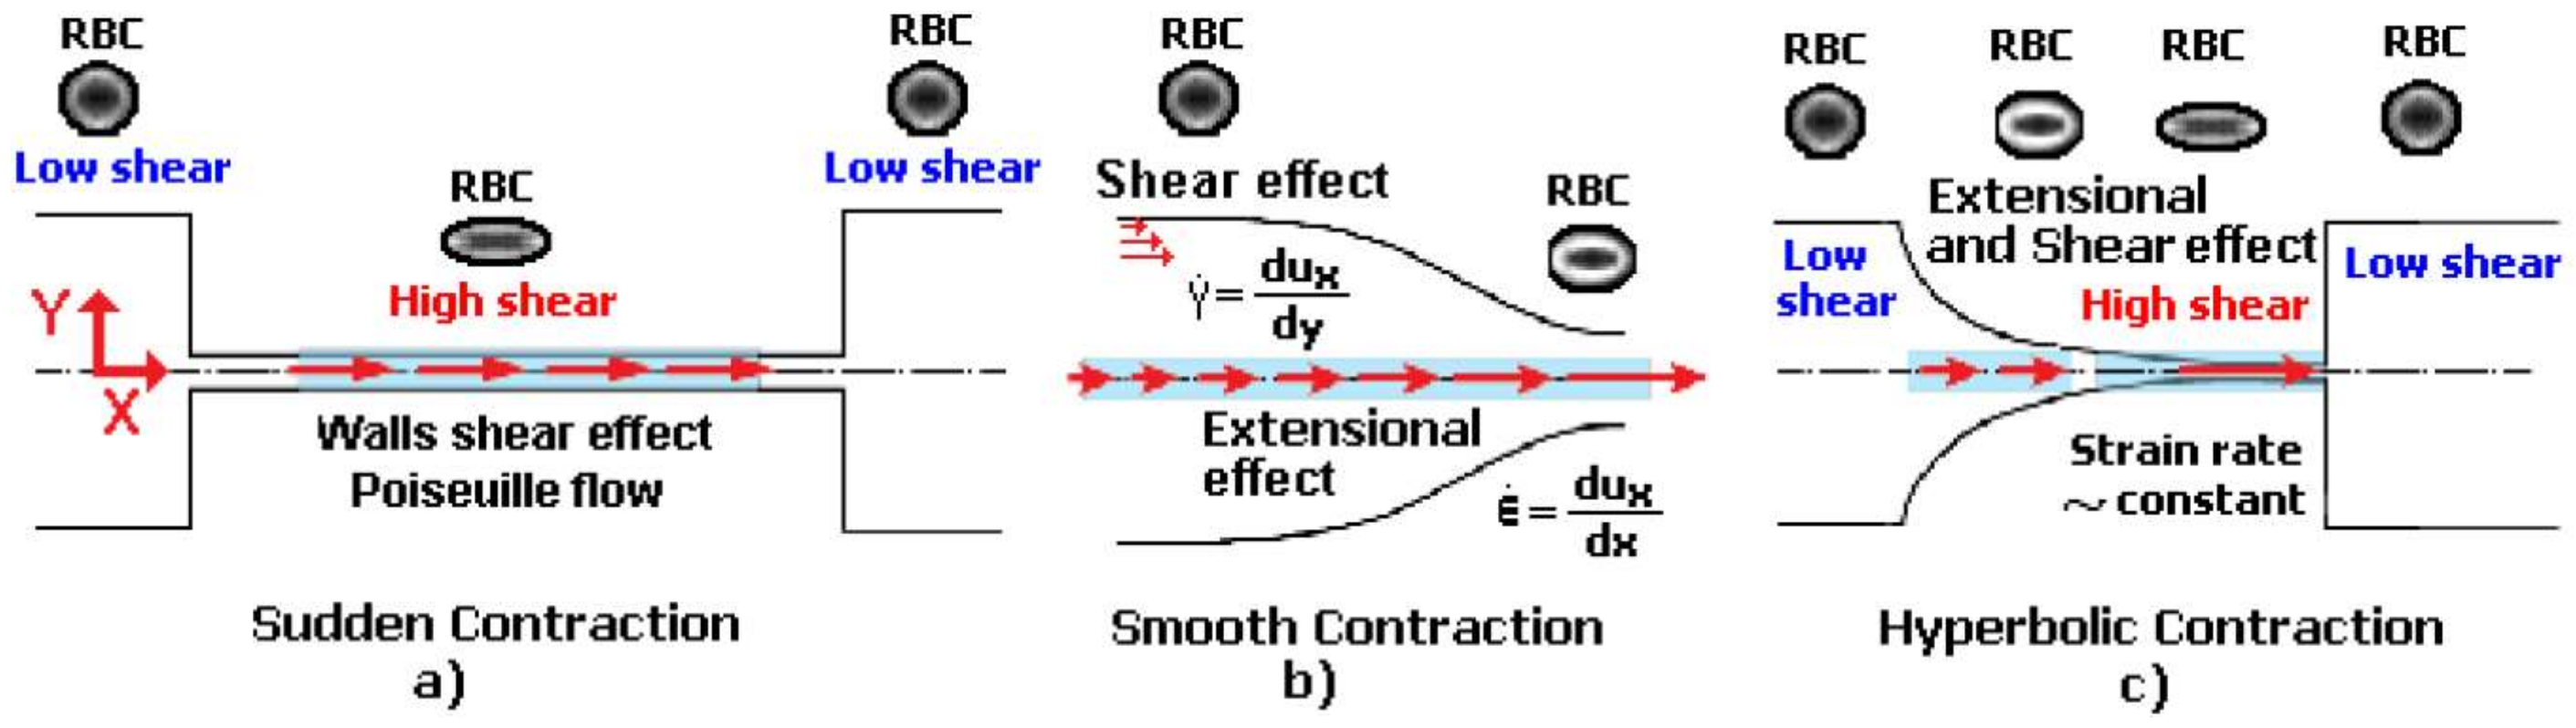
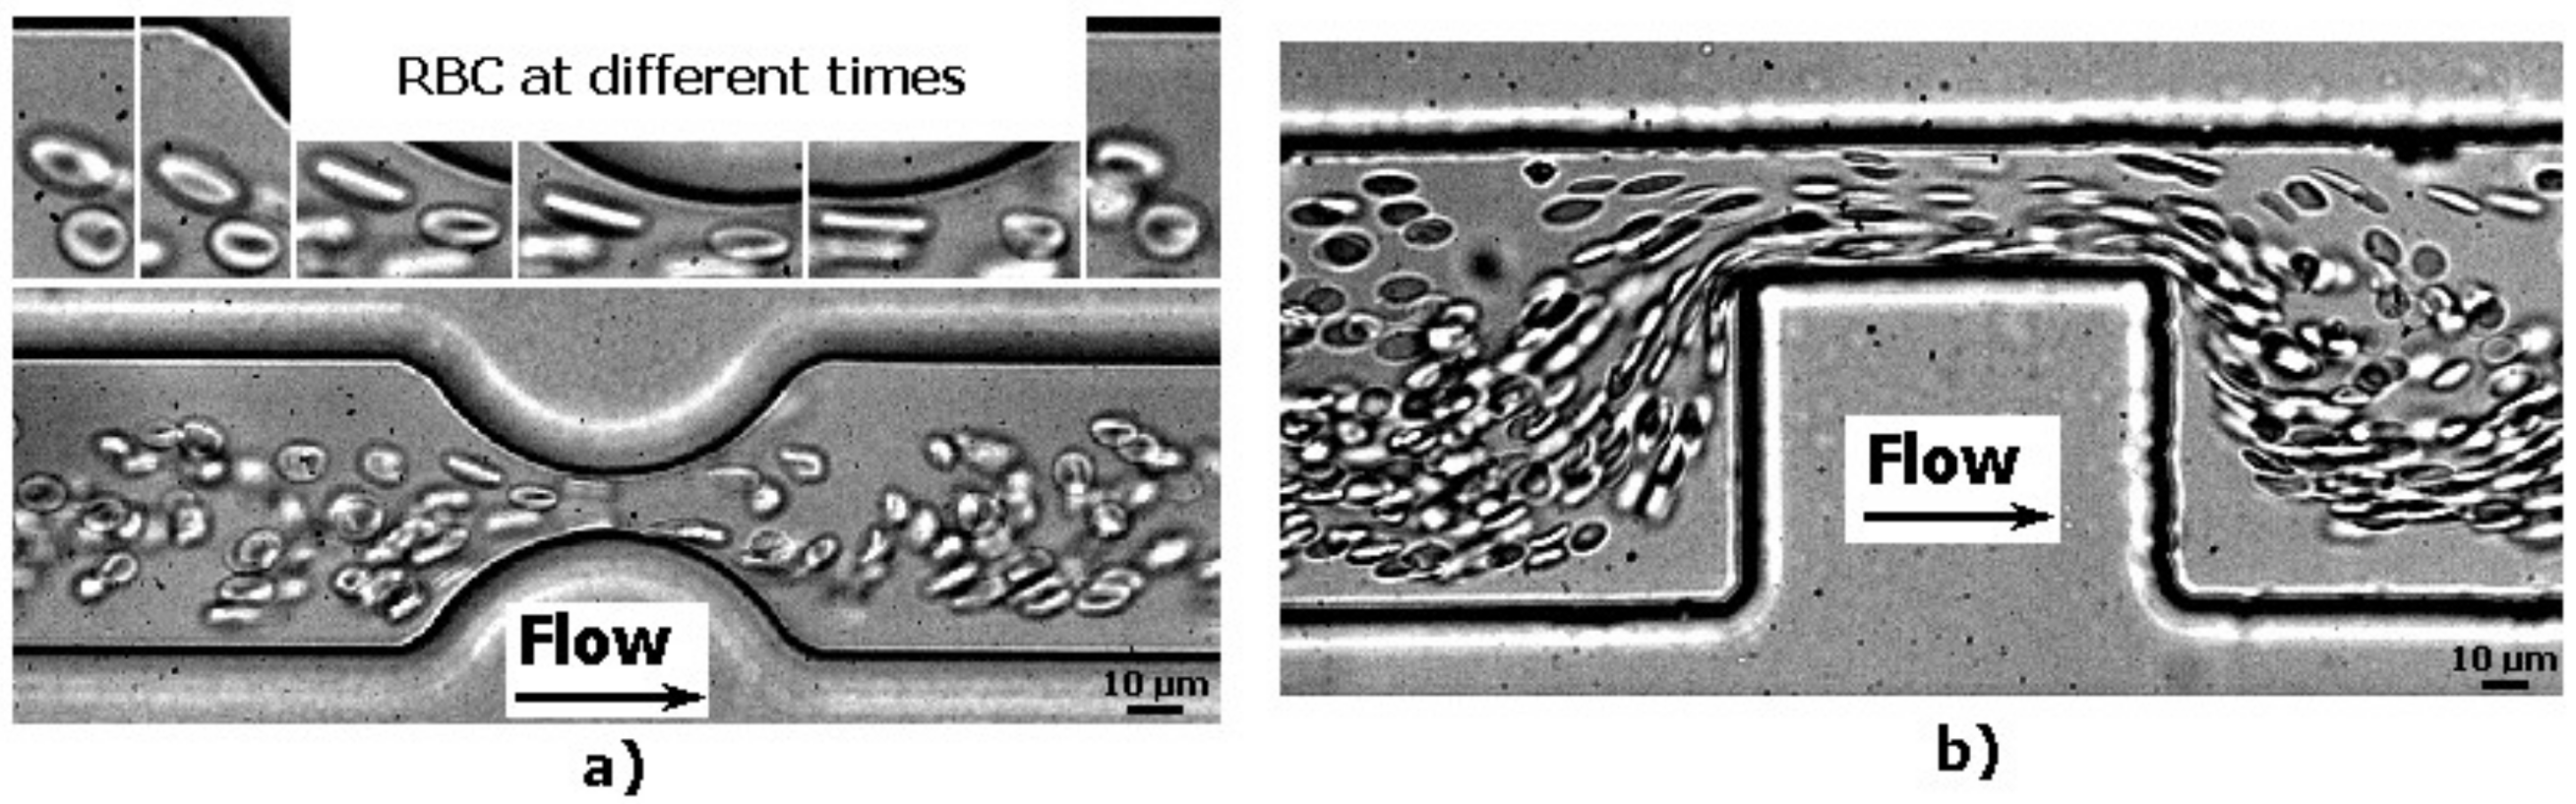
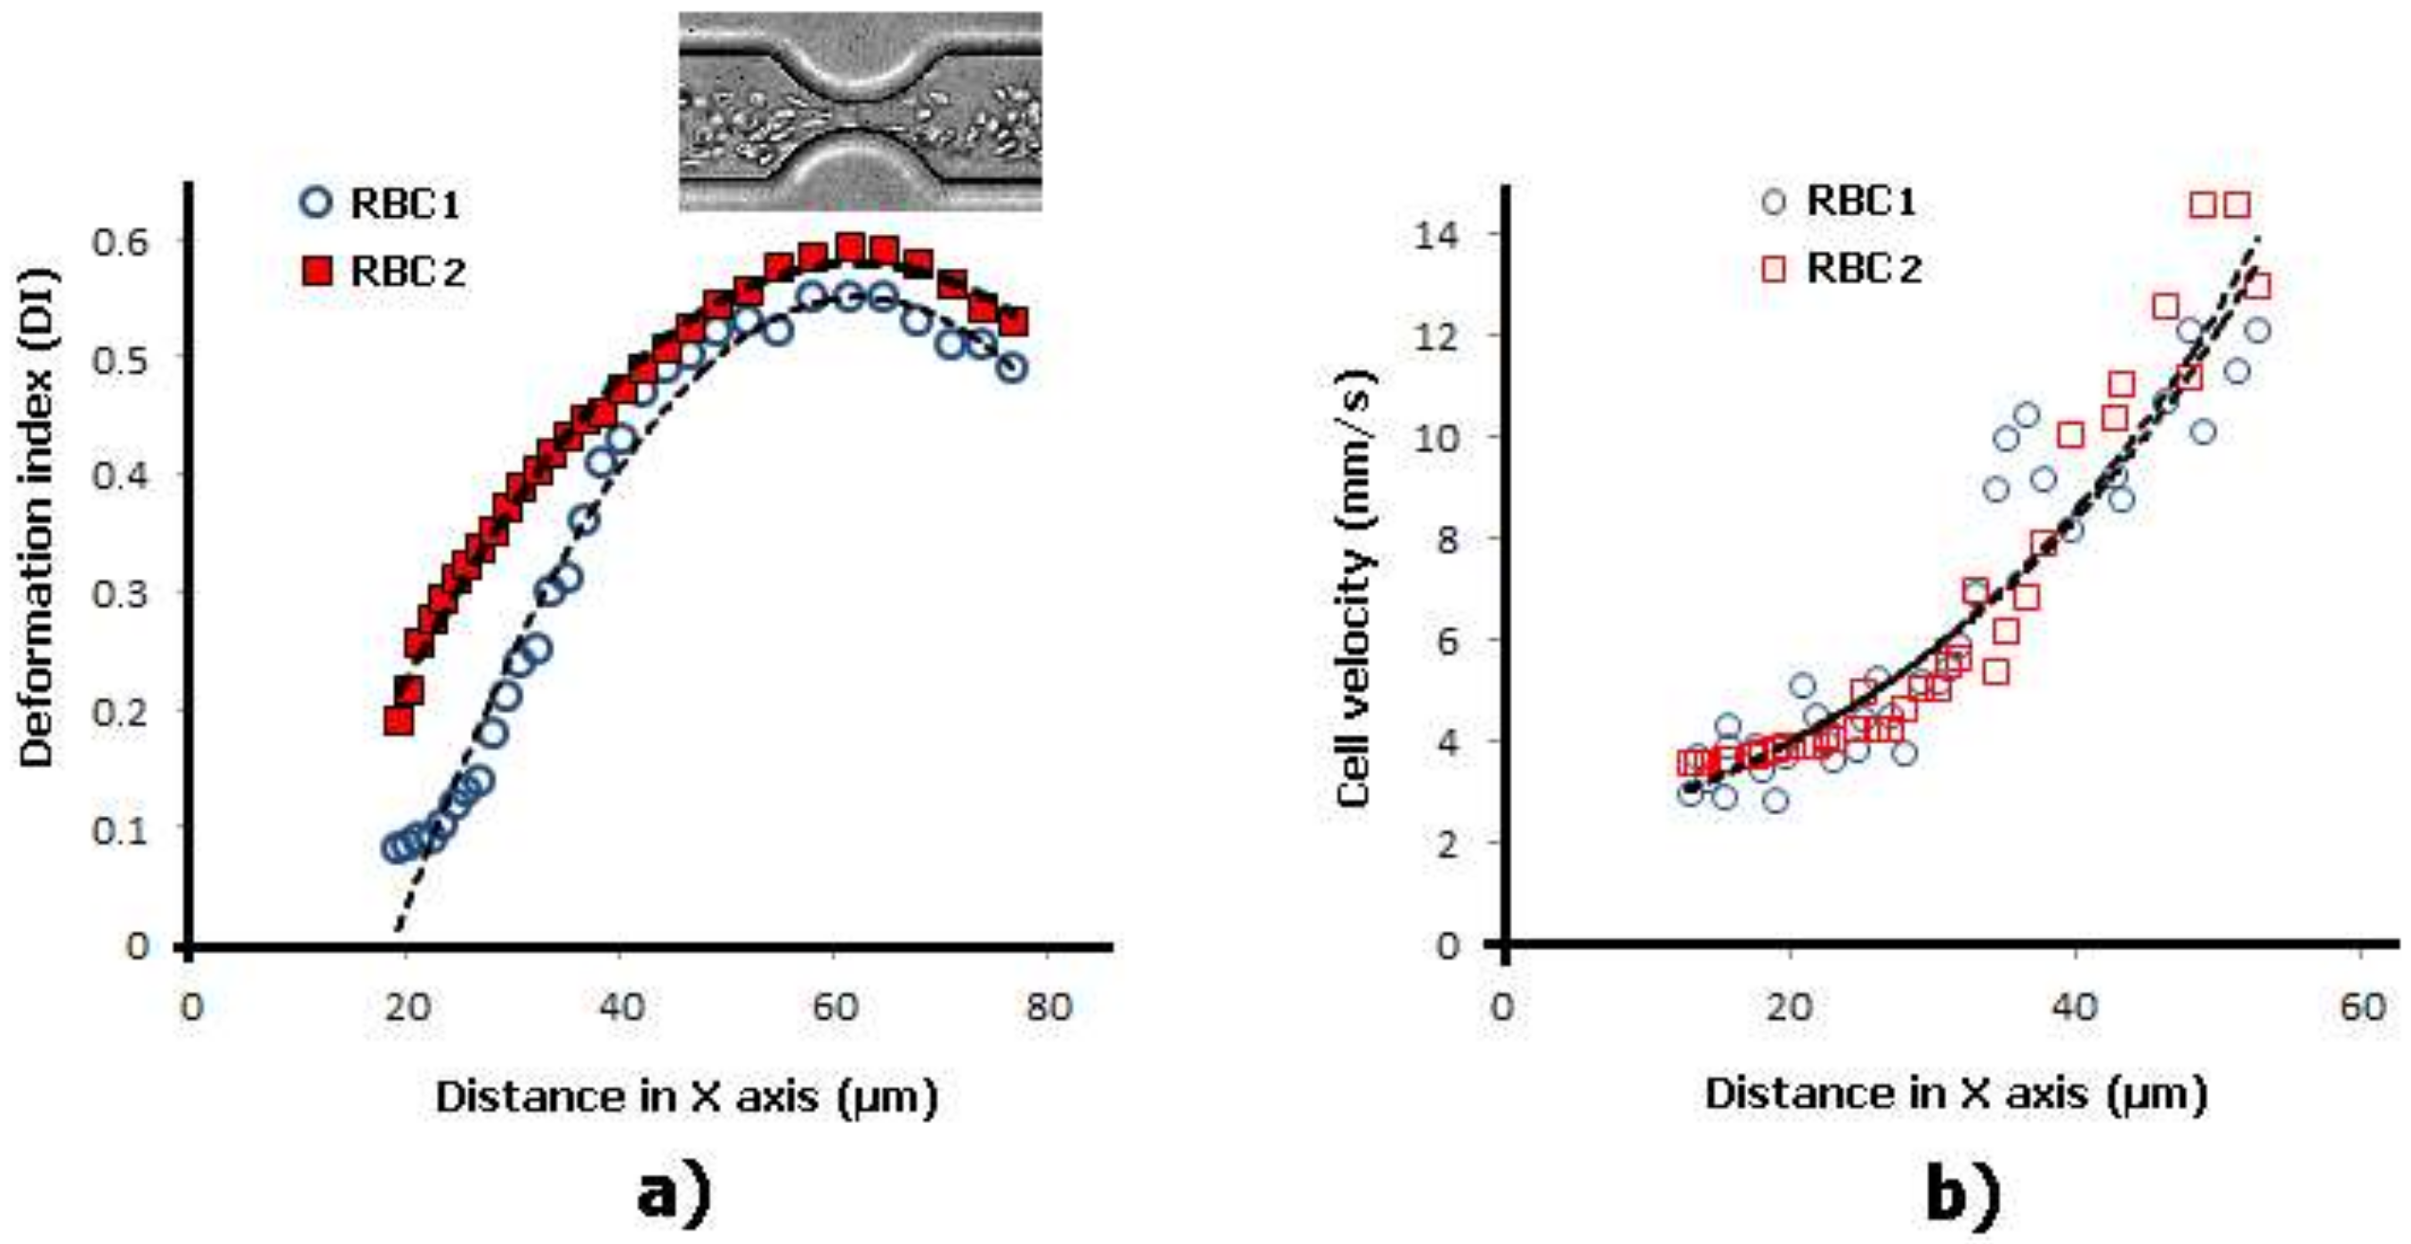
2.1. Deformation of RBCs in Hyperbolic Contractions
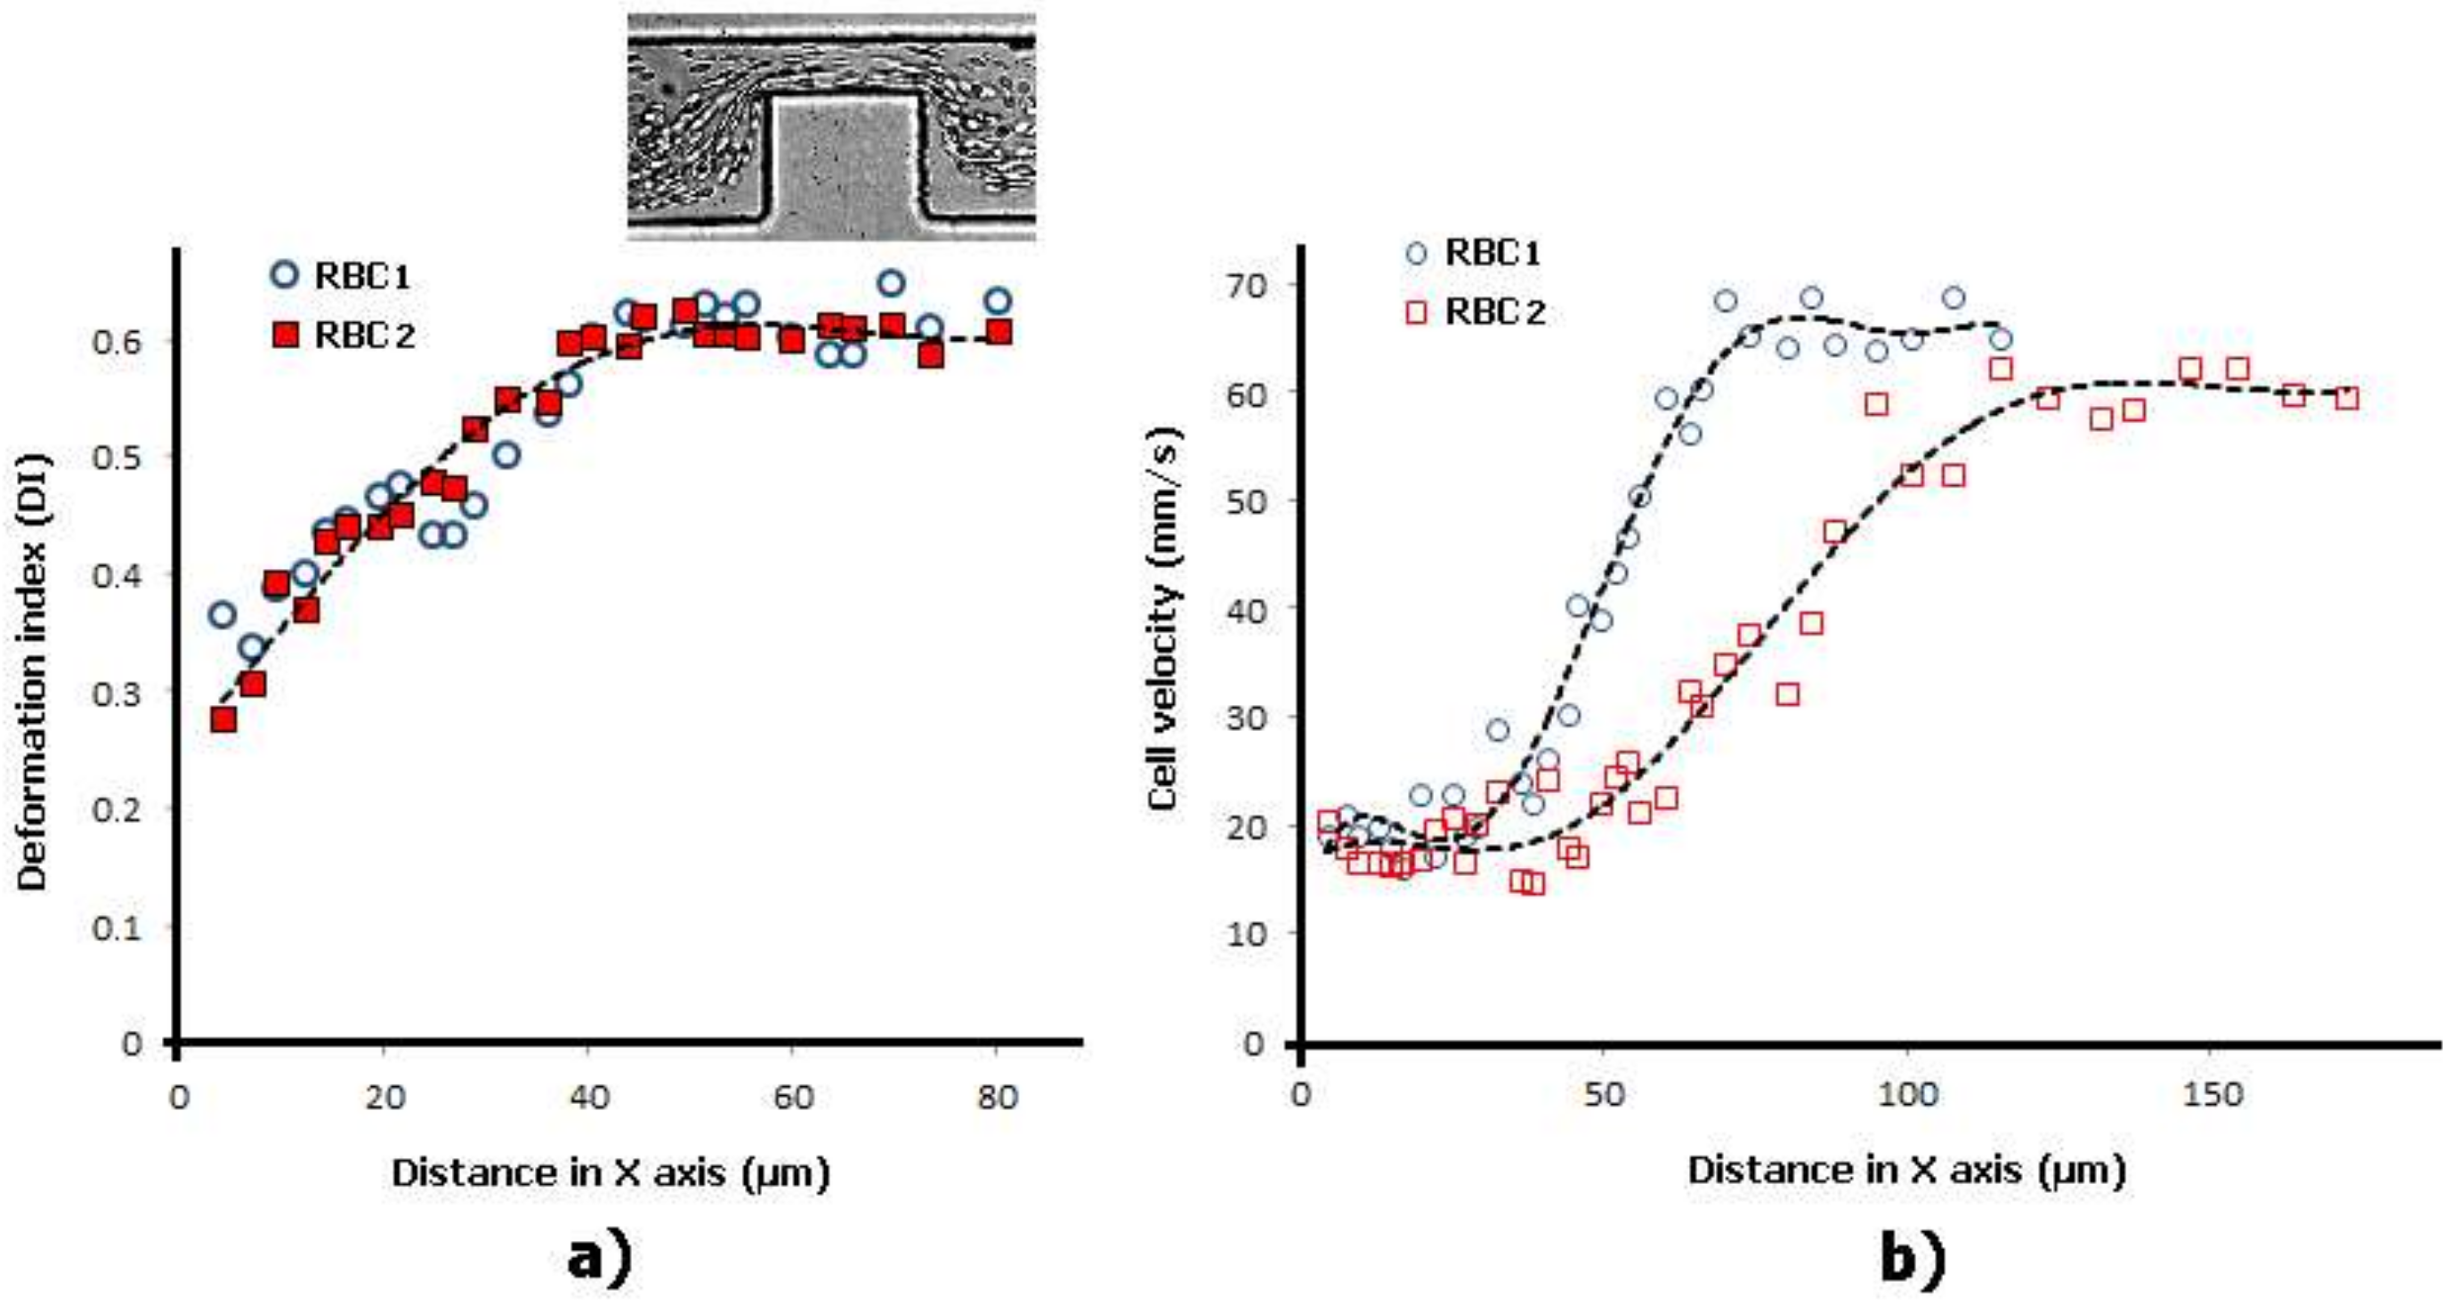
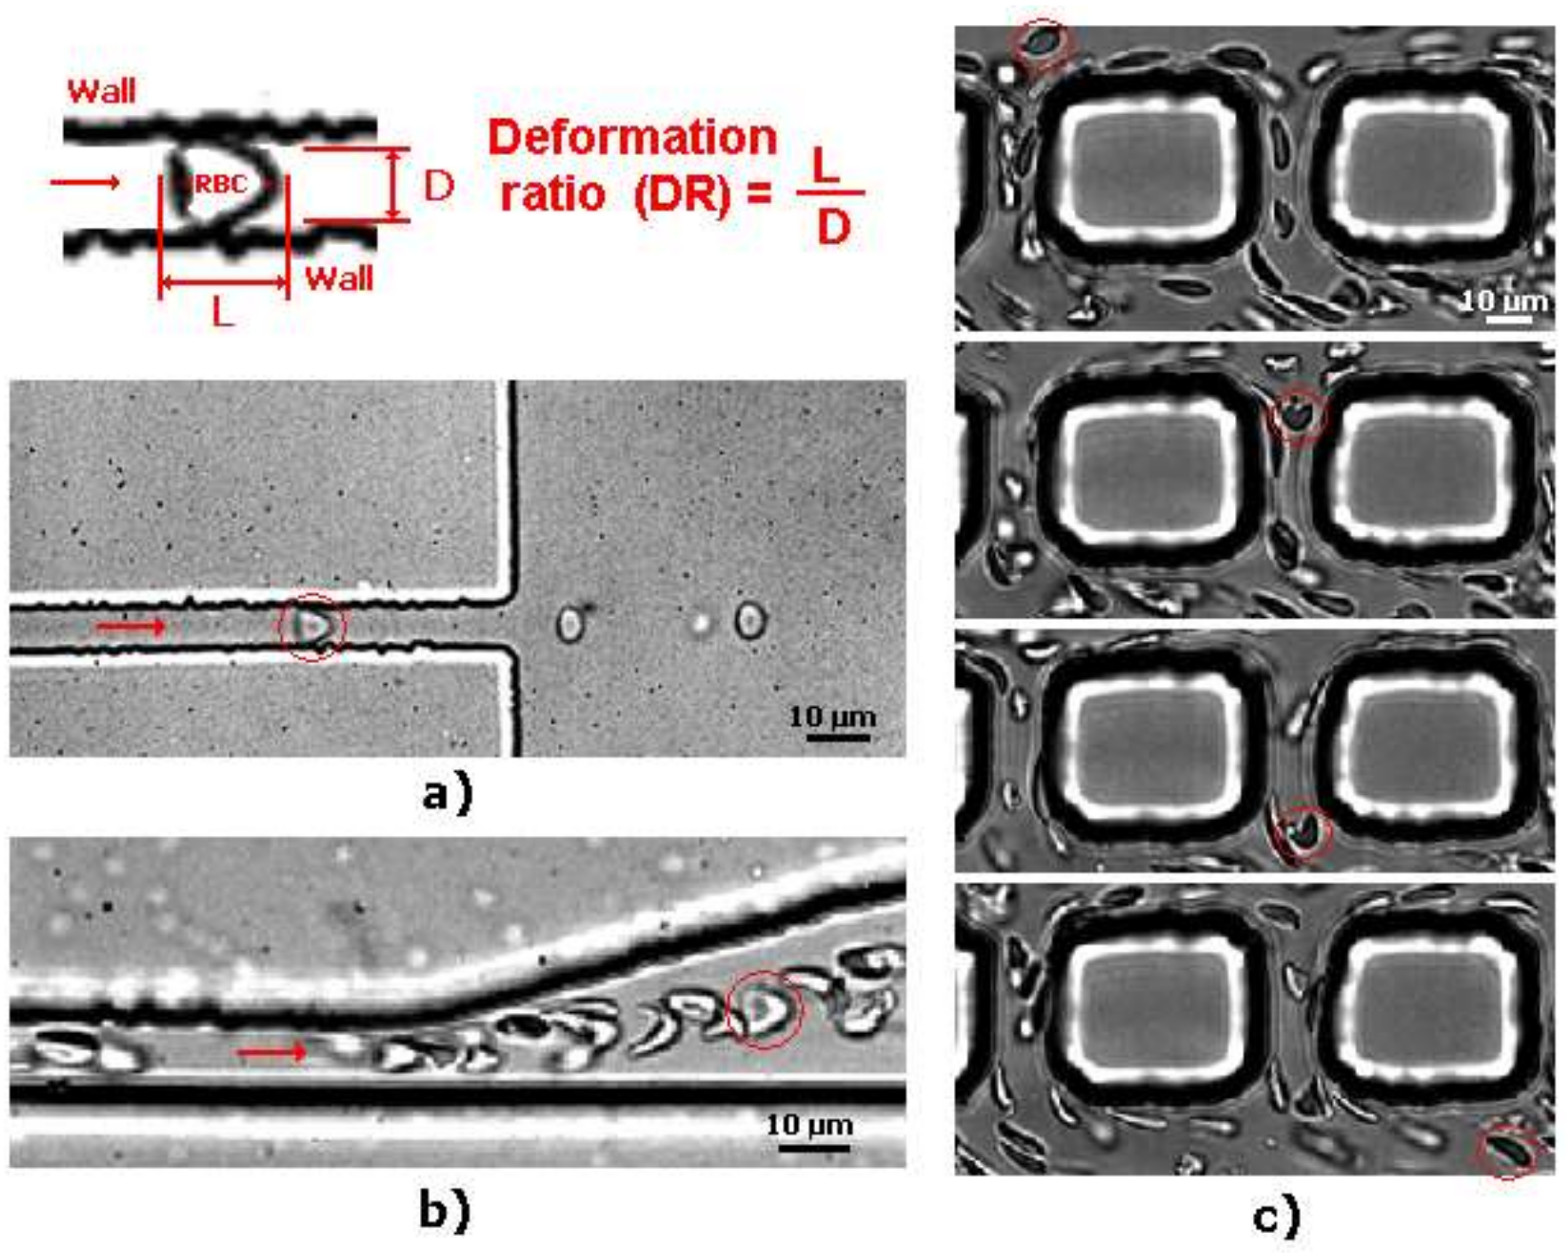
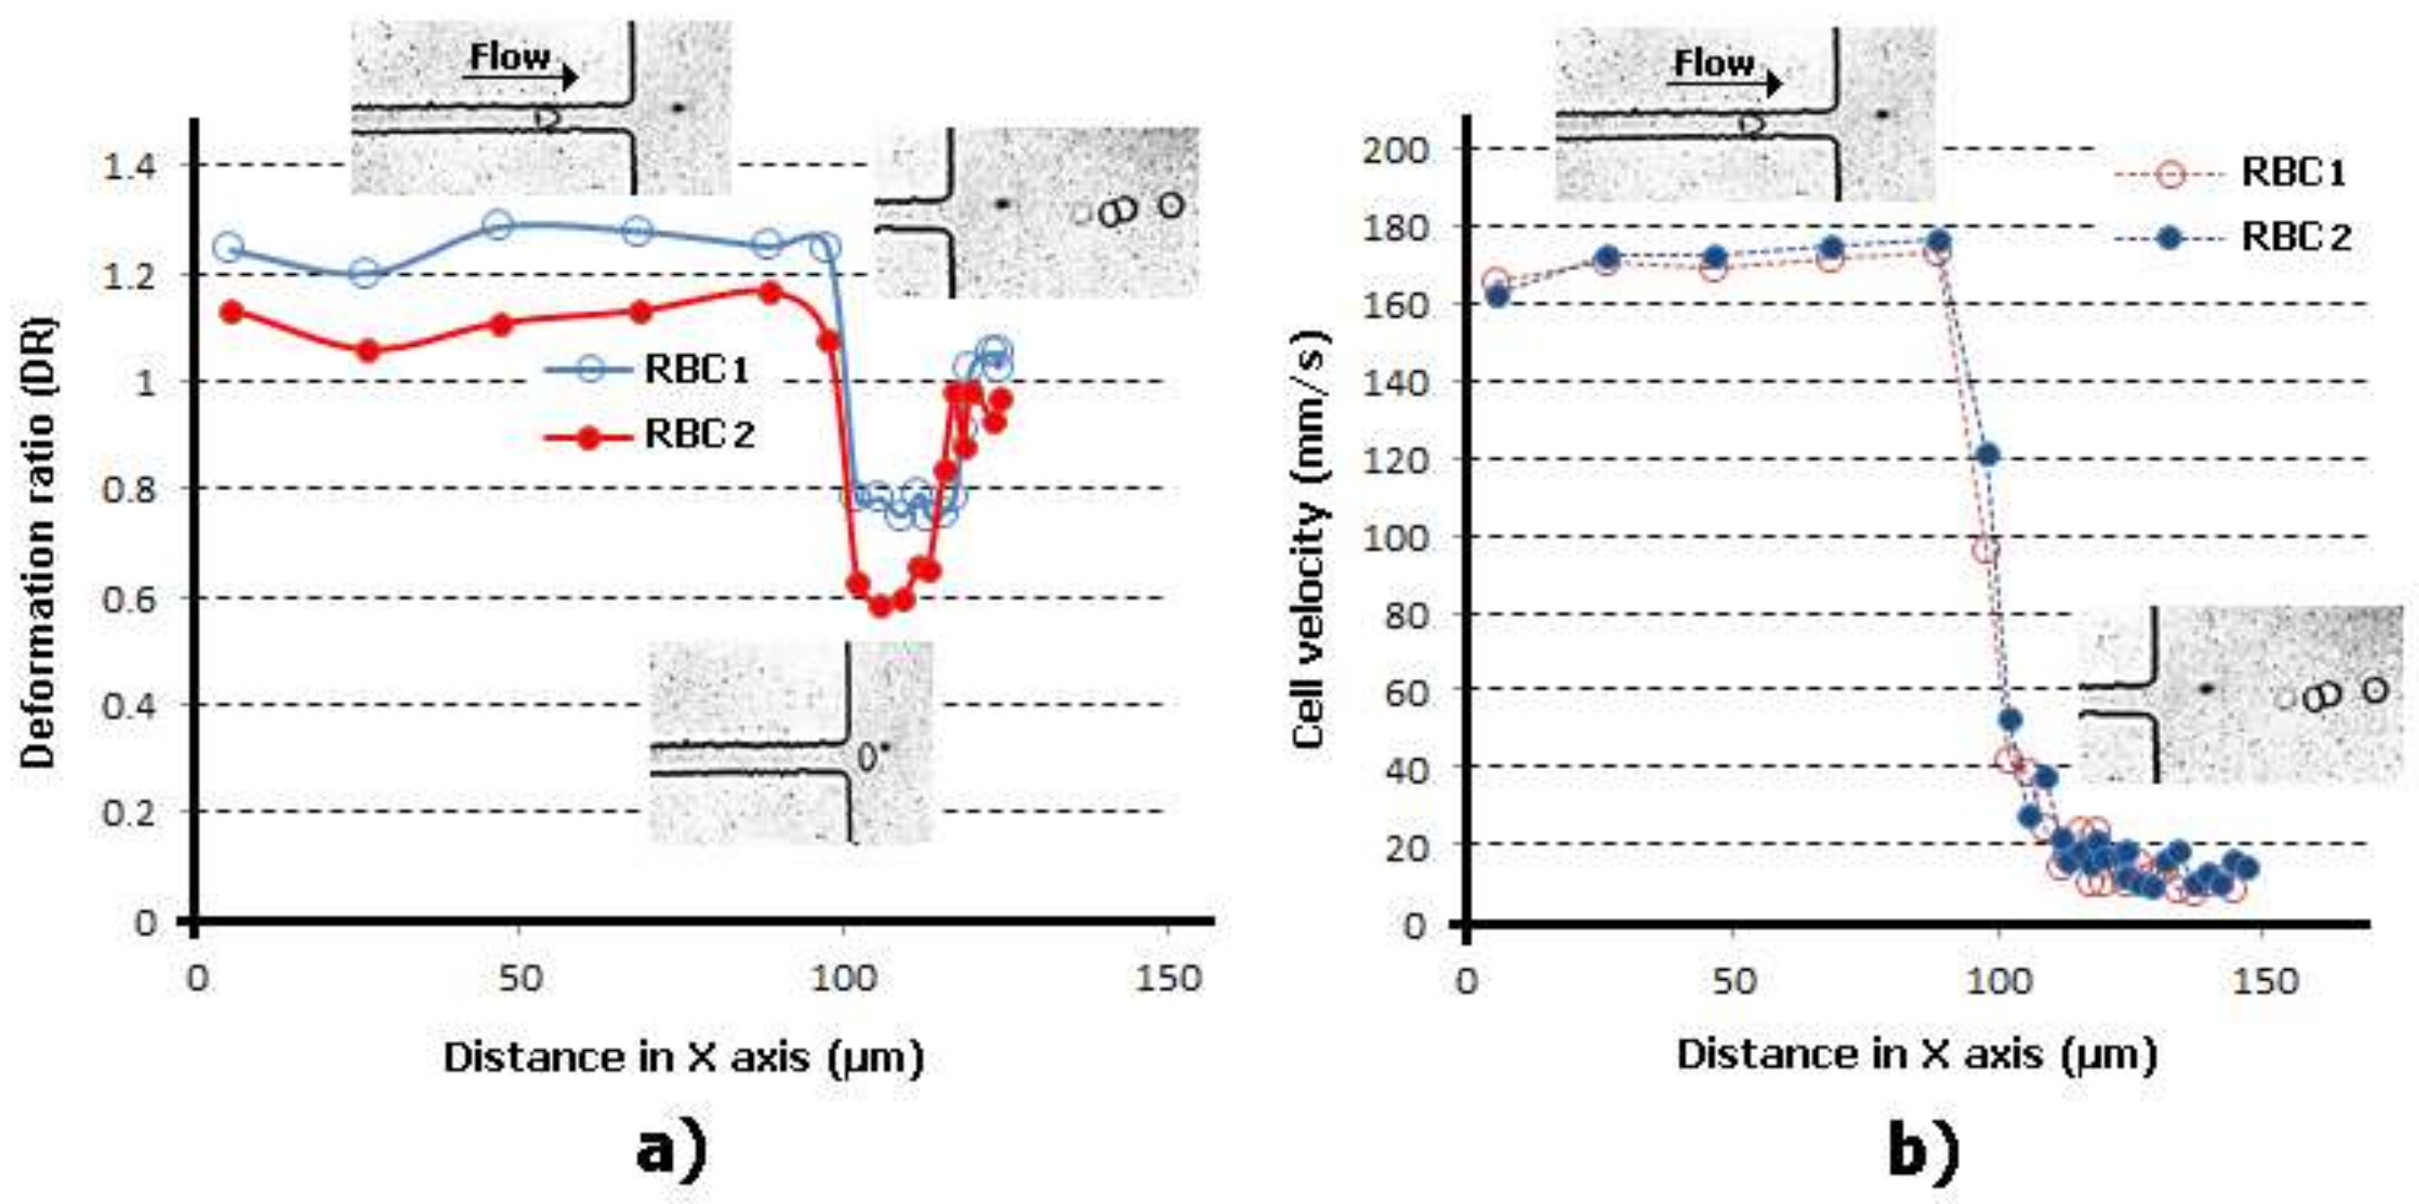
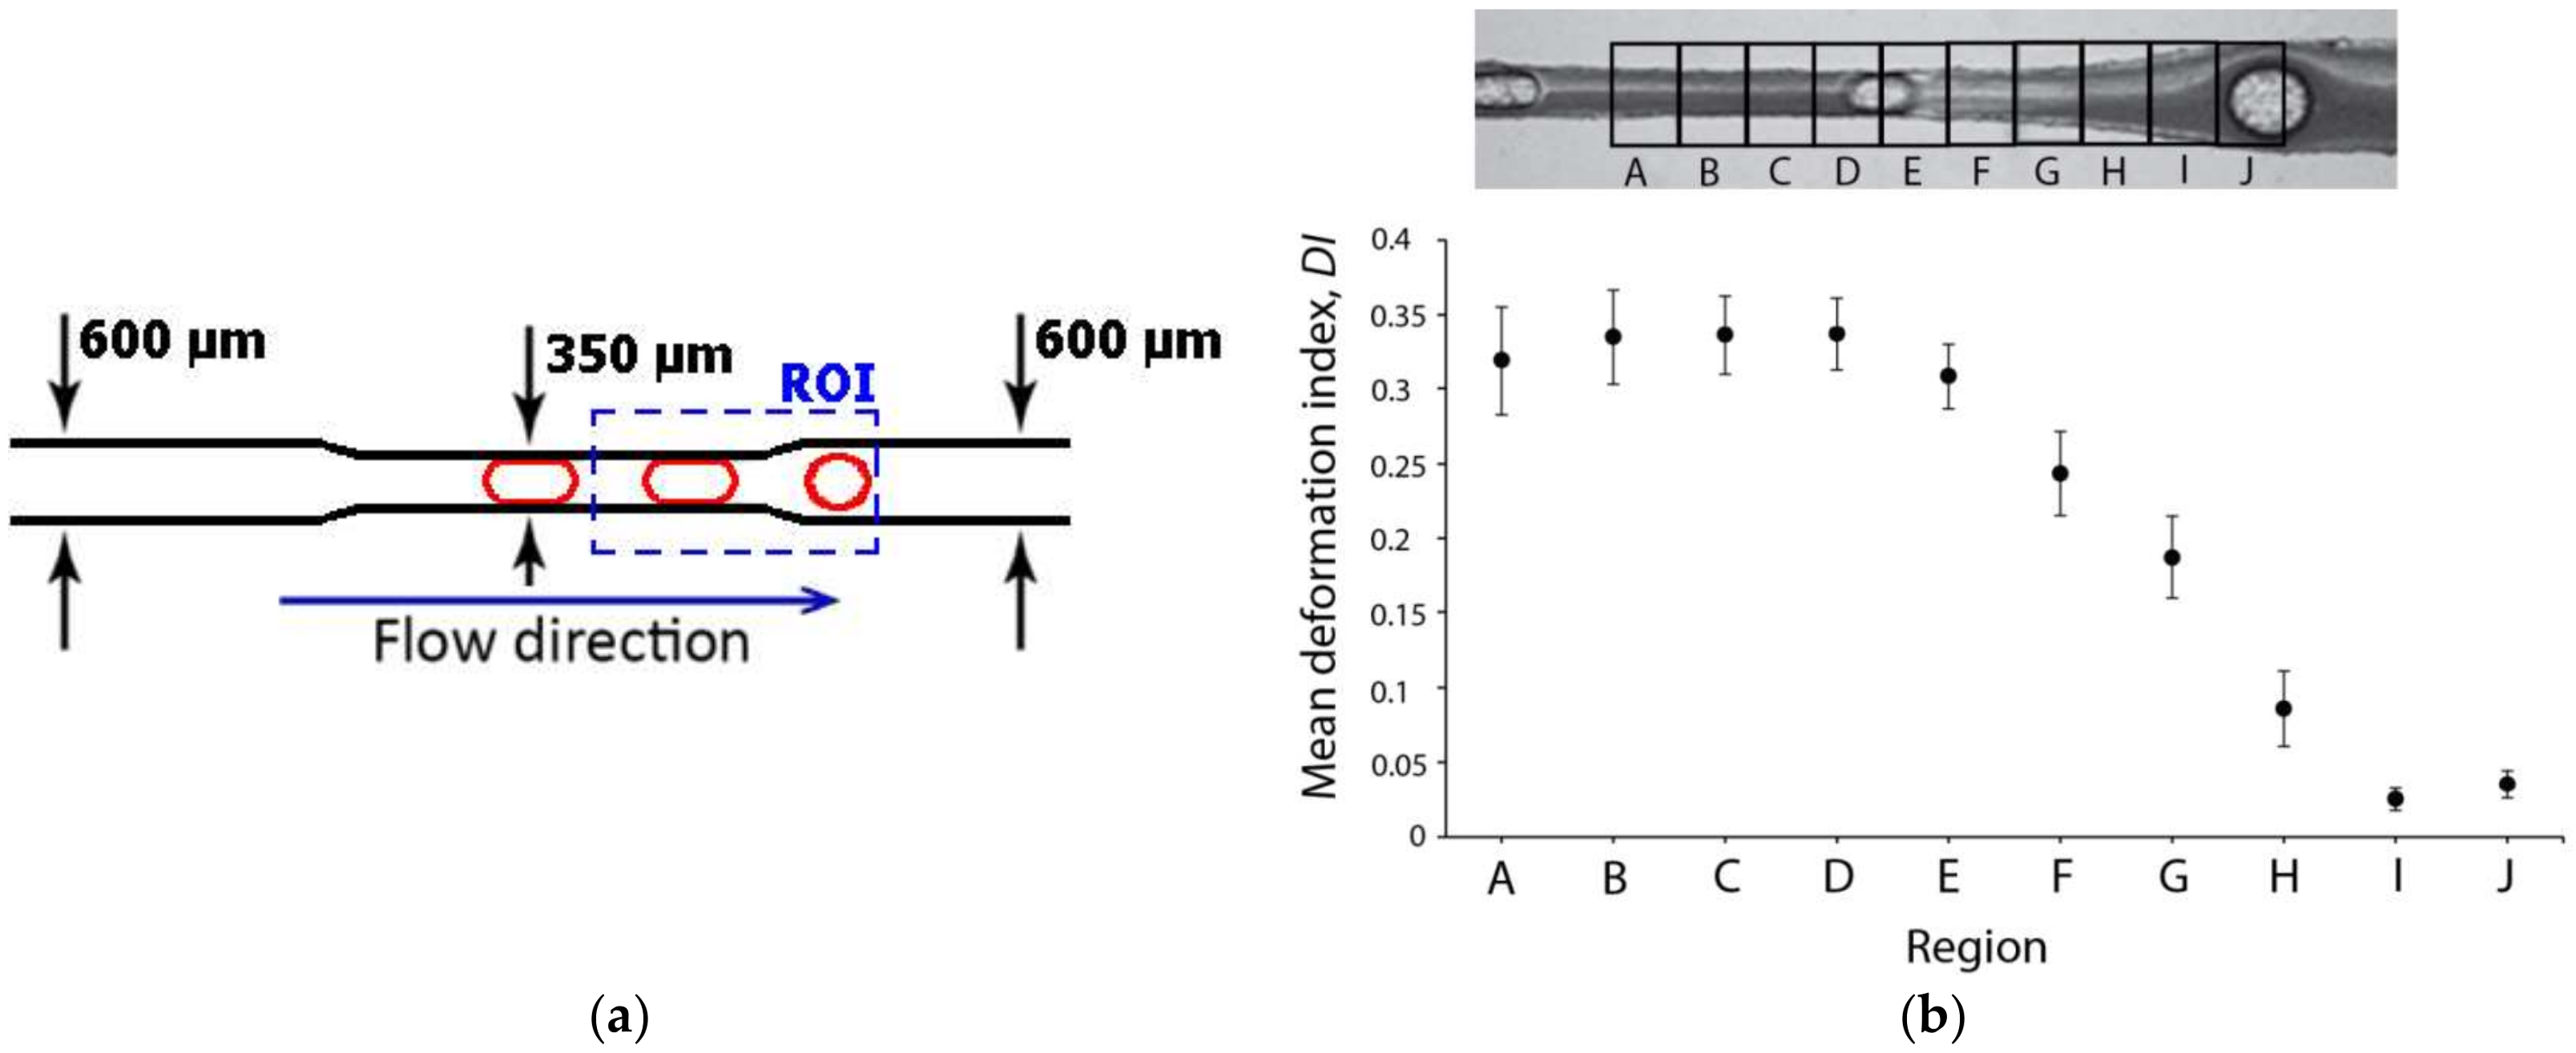
2.2. Deformability in Smooth and Sudden Contractions
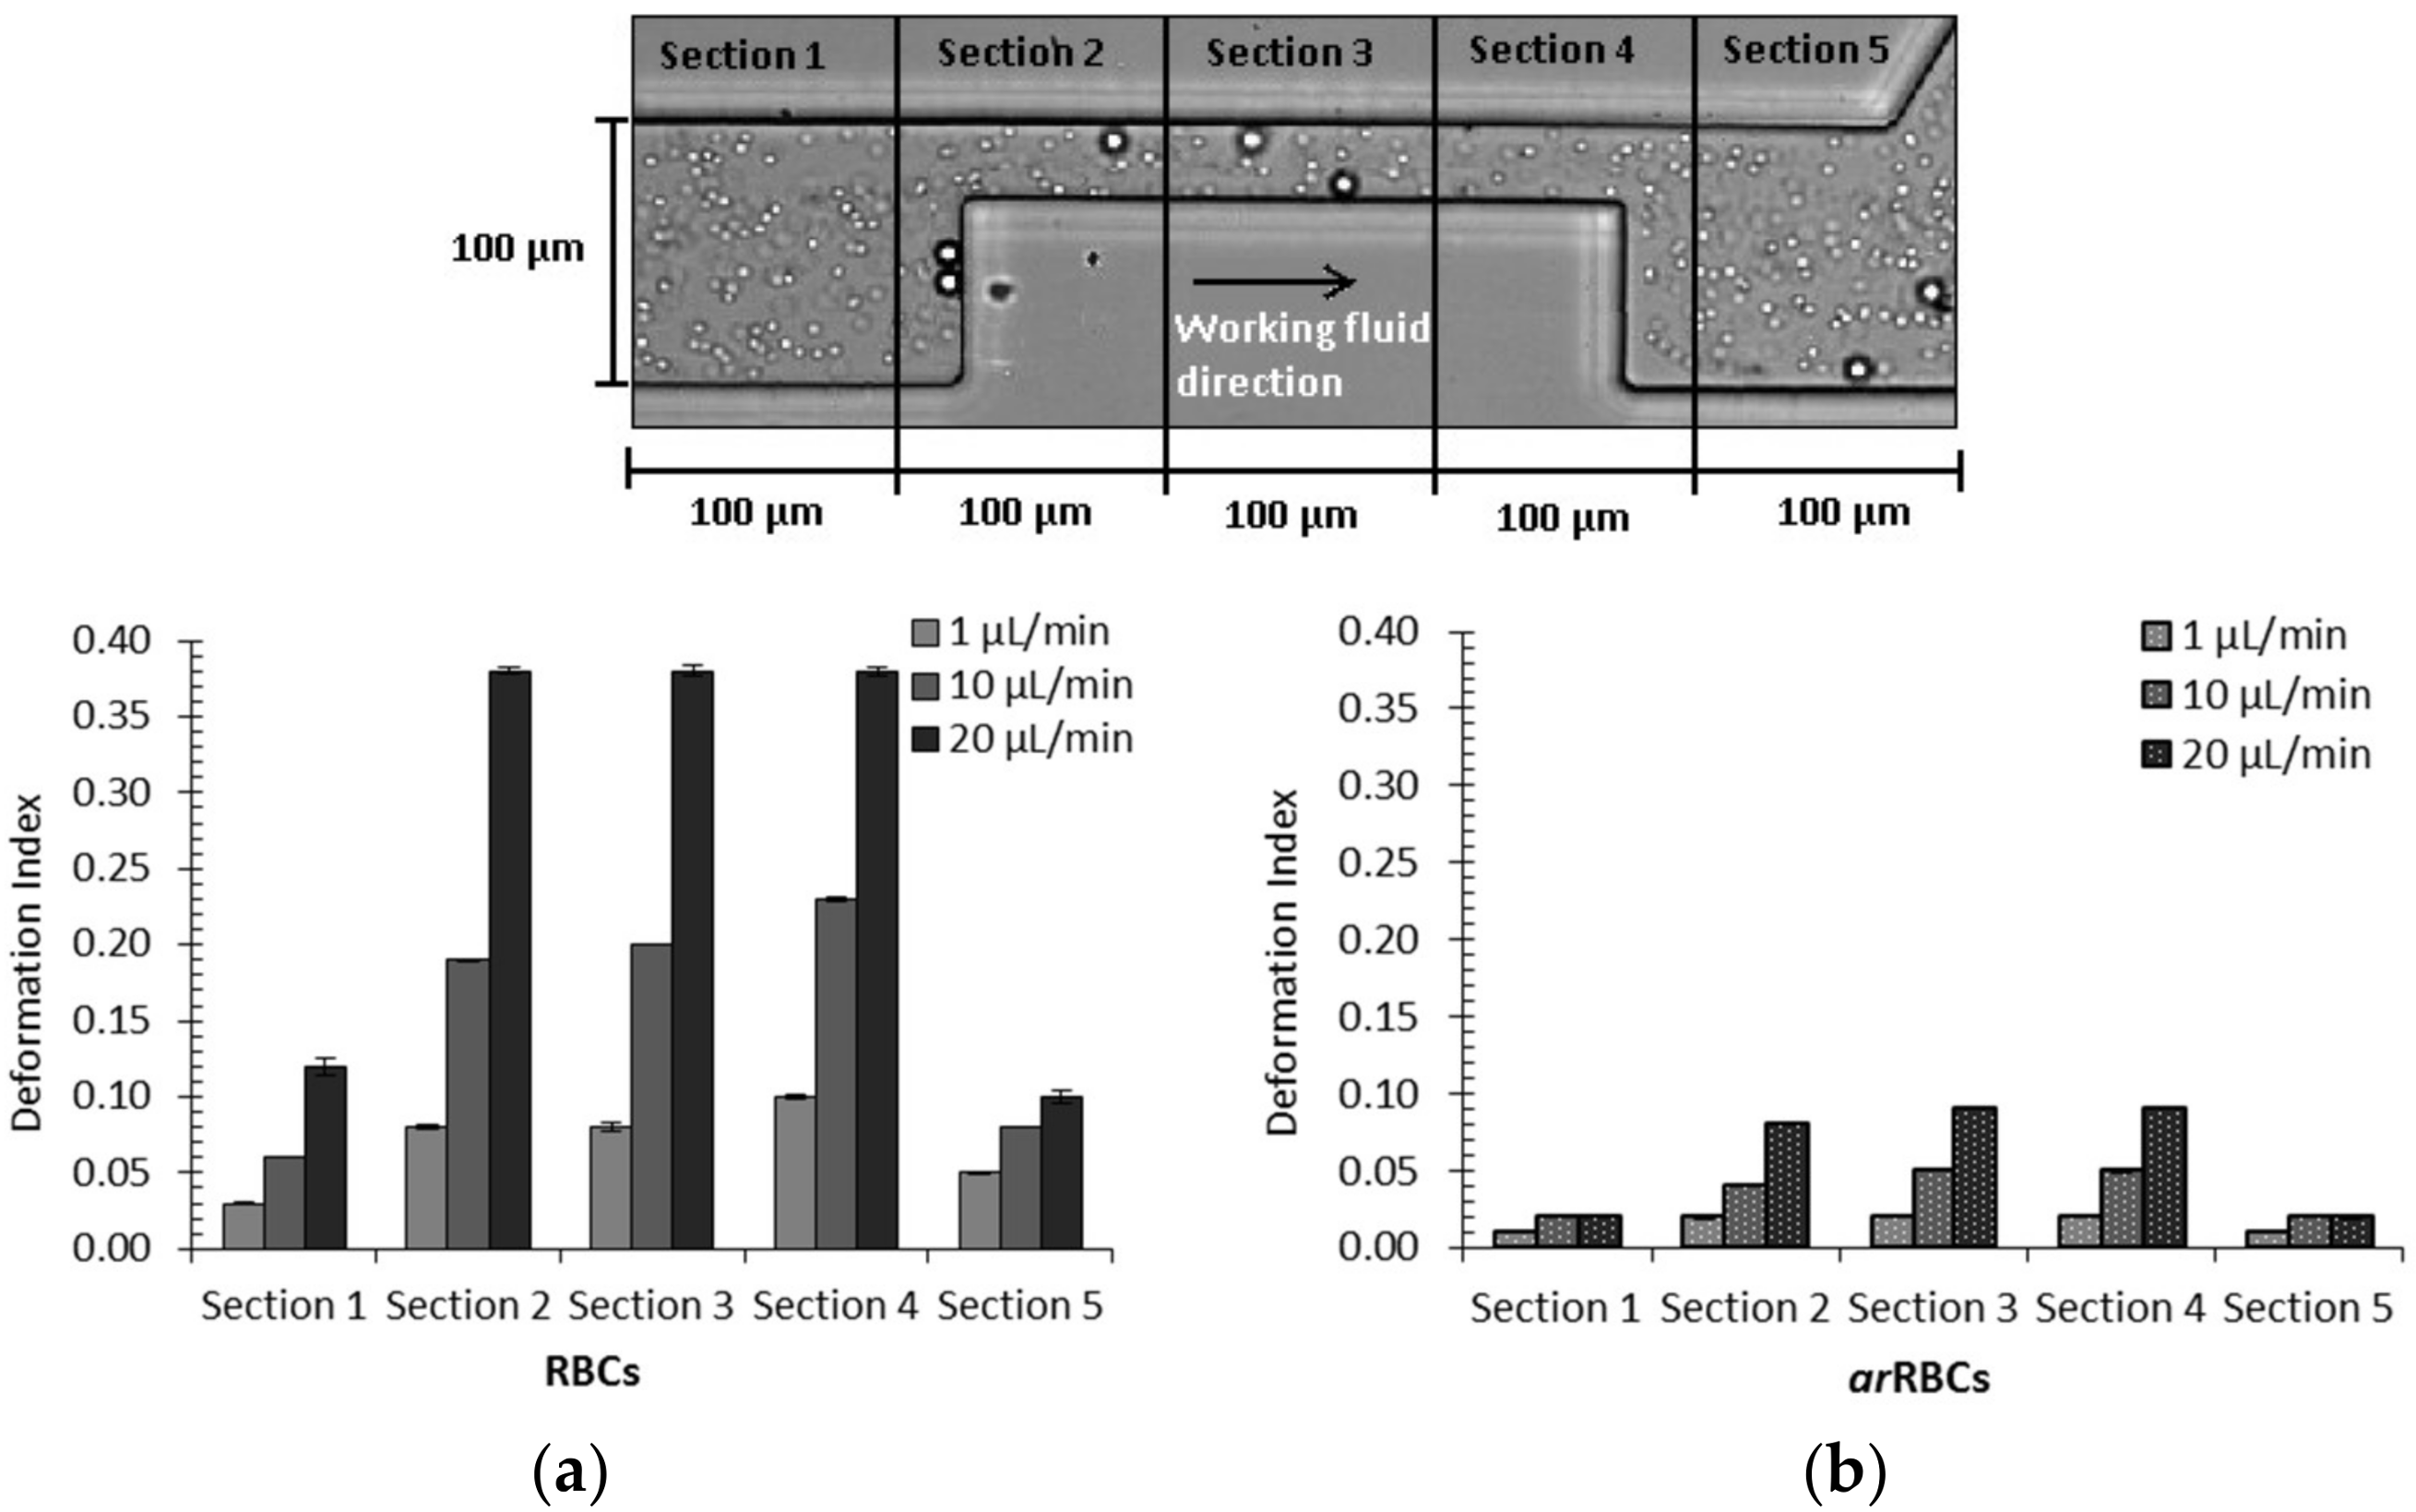
2.3. Deformability in Rectangular PDMS Microcapillaries and Micropillars
2.4. Comparison of Cells’ Deformability Studies
3. Deformation of Bubbles and Droplets
4. Conclusions and Future Directions
Acknowledgments
Author Contributions
Conflicts of Interest
References
- Mokken, F.C.; Kedaria, M.; Henny, C.P.; Hardeman, M.R.; Gelb, A.W. The clinical importance of erythrocyte deformability, a hemorrheological parameter. Ann. Hematol. 1992, 64, 113–122. [Google Scholar] [CrossRef] [PubMed]
- Lee, G.Y.; Lim, C.T. Biomechanics approaches to studying human diseases. Trends Biotechnol. 2007, 25, 111–118. [Google Scholar] [CrossRef] [PubMed]
- Musielak, M. Red blood cell deformability measurement: Review of techniques. Clin. Hemorheol. Microcirc. 2009, 42, 47–64. [Google Scholar] [PubMed]
- Kim, Y.; Kim, K.; Park, Y. Measurement techniques for red blood cell deformability: Recent advances. In Blood Cell—An Overview of Studies in Hematology; InTech: London, UK, 2012. [Google Scholar]
- Manouk, A.; Magalie, F.; Renita, H.; Kristian, S.; Catherine, A.B.-P.; Howard, A.S. Cellular-scale hydrodynamics. Biomed. Mater. 2008, 3, 034011. [Google Scholar]
- Faustino, V.; Catarino, S.O.; Lima, R.; Minas, G. Biomedical microfluidic devices by using low-cost fabrication techniques: A review. J. Biomech. 2016, 49, 2280–2292. [Google Scholar] [CrossRef] [PubMed]
- Zheng, Y.; Nguyen, J.; Wei, Y.; Sun, Y. Recent advances in microfluidic techniques for single-cell biophysical characterization. Lab Chip 2013, 13, 2464–2483. [Google Scholar] [CrossRef] [PubMed]
- Tomaiuolo, G. Biomechanical properties of red blood cells in health and disease towards microfluidics. Biomicrofluidics 2014, 8, 051501. [Google Scholar] [CrossRef]
- Xue, C.; Wang, J.; Zhao, Y.; Chen, D.; Yue, W.; Chen, J. Constriction channel based single-cell mechanical property characterization. Micromachines 2015, 6, 1794–1804. [Google Scholar] [CrossRef]
- Nash, G.; O’Brien, E.; Gordon-Smith, E.; Dormandy, J. Abnormalities in the mechanical properties of red blood cells caused by plasmodium falciparum. Blood 1989, 74, 855–861. [Google Scholar] [PubMed]
- Paulitschke, M.; Nash, G. Membrane rigidity of red blood cells parasitized by different strains of plasmodium falciparum. J. Lab. Clin. Med. 1993, 122, 581–589. [Google Scholar] [PubMed]
- Glenister, F.K.; Coppel, R.L.; Cowman, A.F.; Mohandas, N.; Cooke, B.M. Contribution of parasite proteins to altered mechanical properties of malaria-infected red blood cells. Blood 2002, 99, 1060–1063. [Google Scholar] [CrossRef] [PubMed]
- Suresh, S.; Spatz, J.; Mills, J.; Micoulet, A.; Dao, M.; Lim, C.; Beil, M.; Seufferlein, T. Connections between single-cell biomechanics and human disease states: Gastrointestinal cancer and malaria. Acta Biomater. 2005, 1, 15–30. [Google Scholar] [CrossRef] [PubMed]
- Agrawal, R.; Smart, T.; Nobre-Cardoso, J.; Richards, C.; Bhatnagar, R.; Tufail, A.; Shima, D.; Jones, P.H.; Pavesio, C. Assessment of red blood cell deformability in type 2 diabetes mellitus and diabetic retinopathy by dual optical tweezers stretching technique. Sci. Rep. 2016, 6, 15873. [Google Scholar] [CrossRef] [PubMed]
- Dulińska, I.; Targosz, M.; Strojny, W.; Lekka, M.; Czuba, P.; Balwierz, W.; Szymoński, M. Stiffness of normal and pathological erythrocytes studied by means of atomic force microscopy. J. Biochem. Biophys. Methods 2006, 66, 1–11. [Google Scholar] [CrossRef] [PubMed]
- Fornal, M.; Lekka, M.; Pyka-Fościak, G.; Lebed, K.; Grodzicki, T.; Wizner, B.; Styczeń, J. Erythrocyte stiffness in diabetes mellitus studied with atomic force microscope. Clin. Hemorheol. Microcirc. 2006, 35, 273–276. [Google Scholar] [PubMed]
- Maciaszek, J.L.; Lykotrafitis, G. Sickle cell trait human erythrocytes are significantly stiffer than normal. J. Biomech. 2011, 44, 657–661. [Google Scholar] [CrossRef] [PubMed]
- Shin, S.; Ku, Y.-H.; Ho, J.-X.; Kim, Y.-K.; Suh, J.-S.; Singh, M. Progressive impairment of erythrocyte deformability as indicator of microangiopathy in type 2 diabetes mellitus. Clin. Hemorheol. Microcirc. 2007, 36, 253–261. [Google Scholar] [PubMed]
- Pinho, D.; Campo-Deaño, L.; Lima, R.; Pinho, F.T. In vitro particulate analogue fluids for experimental studies of rheological and hemorheological behavior of glucose-rich RBC suspensions. Biomicrofluidics 2017, 11, 054105. [Google Scholar] [CrossRef] [PubMed]
- Tsukada, K.; Sekizuka, E.; Oshio, C.; Minamitani, H. Direct measurement of erythrocyte deformability in diabetes mellitus with a transparent microchannel capillary model and high-speed video camera system. Microvasc. Res. 2001, 61, 231–239. [Google Scholar] [CrossRef] [PubMed]
- Shelby, J.P.; White, J.; Ganesan, K.; Rathod, P.K.; Chiu, D.T. A microfluidic model for single-cell capillary obstruction by plasmodium falciparum-infected erythrocytes. Proc. Natl. Acad. Sci. USA 2003, 100, 14618–14622. [Google Scholar] [CrossRef] [PubMed]
- Hou, H.W.; Li, Q.; Lee, G.; Kumar, A.; Ong, C.; Lim, C.T. Deformability study of breast cancer cells using microfluidics. Biomed. Microdevices 2009, 11, 557–564. [Google Scholar] [CrossRef] [PubMed]
- Huang, S.; Undisz, A.; Diez-Silva, M.; Bow, H.; Dao, M.; Han, J. Dynamic deformability of plasmodium falciparum-infected erythrocytes exposed to artesunate in vitro. Integr. Biol. 2013, 5, 414–422. [Google Scholar] [CrossRef] [PubMed]
- Zeng, N.F.; Mancuso, J.E.; Zivkovic, A.M.; Smilowitz, J.T.; Ristenpart, W.D. Red blood cells from individuals with abdominal obesity or metabolic abnormalities exhibit less deformability upon entering a constriction. PLoS ONE 2016, 11, e0156070. [Google Scholar] [CrossRef] [PubMed]
- Zhao, R.; Antaki, J.F.; Naik, T.; Bachman, T.N.; Kameneva, M.V.; Wu, Z.J. Microscopic investigation of erythrocyte deformation dynamics. Biorheology 2006, 43, 747–765. [Google Scholar] [PubMed]
- Tomaiuolo, G.; Barra, M.; Preziosi, V.; Cassinese, A.; Rotoli, B.; Guido, S. Microfluidics analysis of red blood cell membrane viscoelasticity. Lab Chip 2011, 11, 449–454. [Google Scholar] [CrossRef] [PubMed]
- Sousa, P.C.; Pinho, F.T.; Oliveira, M.S.; Alves, M.A. Extensional flow of blood analog solutions in microfluidic devices. Biomicrofluidics 2011, 5, 14108. [Google Scholar] [CrossRef] [PubMed] [Green Version]
- Lee, S.S.; Yim, Y.; Ahn, K.H.; Lee, S.J. Extensional flow-based assessment of red blood cell deformability using hyperbolic converging microchannel. Biomed. Microdevices 2009, 11, 1021–1027. [Google Scholar] [CrossRef] [PubMed]
- Yaginuma, T.; Oliveira, M.S.N.; Lima, R.; Ishikawa, T.; Yamaguchi, T. Human red blood cell behavior under homogeneous extensional flow in a hyperbolic-shaped microchannel. Biomicrofluidics 2013, 7, 054110. [Google Scholar] [CrossRef] [PubMed] [Green Version]
- Rodrigues, R.O.; Lopes, R.; Pinho, D.; Pereira, A.I.; Garcia, V.; Gassmann, S.; Sousa, P.C.; Lima, R. In vitro blood flow and cell-free layer in hyperbolic microchannels: Visualizations and measurements. BioChip J. 2016, 10, 9–15. [Google Scholar] [CrossRef]
- Rodrigues, R.O.; Pinho, D.; Faustino, V.; Lima, R. A simple microfluidic device for the deformability assessment of blood cells in a continuous flow. Biomed. Microdevices 2015, 17, 108. [Google Scholar] [CrossRef] [PubMed]
- Rodrigues, R.O.; Bañobre-López, M.; Gallo, J.; Tavares, P.B.; Silva, A.M.; Lima, R.; Gomes, H.T. Haemocompatibility of iron oxide nanoparticles synthesized for theranostic applications: A high-sensitivity microfluidic tool. J. Nanopart. Res. 2016, 18, 194. [Google Scholar] [CrossRef]
- Faustino, V.; Pinho, D.; Yaginuma, T.; Calhelha, R.C.; Ferreira, I.C.F.R.; Lima, R. Extensional flow-based microfluidic device: Deformability assessment of red blood cells in contact with tumor cells. BioChip J. 2014, 8, 42–47. [Google Scholar] [CrossRef]
- Calejo, J.; Pinho, D.; Galindo-Rosales, F.; Lima, R.; Campo-Deaño, L. Particulate blood analogues reproducing the erythrocytes cell-free layer in a microfluidic device containing a hyperbolic contraction. Micromachines 2016, 7, 4. [Google Scholar] [CrossRef]
- Gossett, D.R.; Henry, T.; Lee, S.A.; Ying, Y.; Lindgren, A.G.; Yang, O.O.; Rao, J.; Clark, A.T.; Di Carlo, D. Hydrodynamic stretching of single cells for large population mechanical phenotyping. Proc. Natl. Acad. Sci. USA 2012, 109, 7630–7635. [Google Scholar] [CrossRef] [PubMed]
- Henon, Y.; Sheard, G.J.; Fouras, A. Erythrocyte deformation in a microfluidic cross-slot channel. RSC Adv. 2014, 4, 36079–36088. [Google Scholar] [CrossRef]
- Guillou, L.; Dahl, J.B.; Lin, J.-M.G.; Barakat, A.I.; Husson, J.; Muller, S.J.; Kumar, S. Measuring cell viscoelastic properties using a microfluidic extensional flow device. Biophys. J. 2016, 111, 2039–2050. [Google Scholar] [CrossRef] [PubMed]
- Faustino, V.; Pinho, D.; Yaginuma, T.; Calhelha, R.; Oliveira, M.; Ferreira, I.; Lima, R. Flow of red blood cells suspensions through hyperbolic microcontractions. Visualization and simulation of complex flows in biomedical engineering. In Visualization and Simulation of Complex Flows in Biomedical Engineering Lecture Notes in Computational Vision and Biomechanics; Springer: Berlin, Germany, 2014; Volume 12, pp. 151–163. [Google Scholar]
- Jeong, J.H.; Sugii, Y.; Minamiyama, M.; Okamoto, K. Measurement of rbc deformation and velocity in capillaries in vivo. Microvasc. Res. 2006, 71, 212–217. [Google Scholar] [CrossRef] [PubMed]
- Yaginuma, T.; Oliveira, M.; Lima, R.; Ishikawa, T.; Yamaguchi, T. Red blood cell deformation in flows through a pdms hyperbolic microchanne. In Proceedings of the Techconnect World 2011—Microtech Conference and Expo, Boston, MA, USA, 13–16 June 2011; p. 505. [Google Scholar]
- Muñoz-Sánchez, B.; Silva, S.; Pinho, D.; Vega, E.; Lima, R. Generation of micro-sized pdms particles by a flow focusing technique for biomicrofluidics applications. Biomicrofluidics 2016, 10, 014122. [Google Scholar] [CrossRef] [PubMed]
- Pinho, D.; Rodrigues, R.O.; Faustino, V.; Yaginuma, T.; Exposto, J.; Lima, R. Red blood cells radial dispersion in blood flowing through microchannels: The role of temperature. J. Biomech. 2016, 49, 2293–2298. [Google Scholar] [CrossRef] [PubMed]
- Sousa, P.C.; Pinho, F.T.; Alves, M.A.; Oliveira, M.S. A review of hemorheology: Measuring techniques and recent advances. Korea-Aust. Rheol. J. 2016, 28, 1–22. [Google Scholar] [CrossRef] [Green Version]
- Wong, K.H.; Chan, J.M.; Kamm, R.D.; Tien, J. Microfluidic models of vascular functions. Ann. Rev. Biomed. Eng. 2012, 14, 205–230. [Google Scholar] [CrossRef] [PubMed]
- Rodrigues, R.O.; Lima, R.; Gomes, H.T.; Silva, A.M. Polymer microfluidic devices: An overview of fabrication methods. U. Porto J. Eng. 2015, 1, 67–79. [Google Scholar]
- Kim, G.B.; Lee, S.J. X-ray piv measurements of blood flows without tracer particles. Exp. Fluids 2006, 41, 195–200. [Google Scholar] [CrossRef]
- Lima, R.; Wada, S.; Tsubota, K.-i.; Yamaguchi, T. Confocal micro-piv measurements of three-dimensional profiles of cell suspension flow in a square microchannel. Measur. Sci. Technol. 2006, 17, 797–808. [Google Scholar] [CrossRef]
- Vennemann, P.; Kiger, K.T.; Lindken, R.; Groenendijk, B.C.; Stekelenburg-de Vos, S.; ten Hagen, T.L.; Ursem, N.T.; Poelmann, R.E.; Westerweel, J.; Hierck, B.P. In vivo micro particle image velocimetry measurements of blood-plasma in the embryonic avian heart. J. Biomech. 2006, 39, 1191–1200. [Google Scholar] [CrossRef] [PubMed]
- Lima, R.; Wada, S.; Tanaka, S.; Takeda, M.; Ishikawa, T.; Tsubota, K.; Imai, Y.; Yamaguchi, T. In vitro blood flow in a rectangular pdms microchannel: Experimental observations using a confocal micro-PIV system. Biomed. Microdevices 2008, 10, 153–167. [Google Scholar] [CrossRef] [PubMed]
- Lima, R.; Ishikawa, T.; Imai, Y.; Takeda, M.; Wada, S.; Yamaguchi, T. Measurement of individual red blood cell motions under high hematocrit conditions using a confocal micro-PTV system. Ann. Biomed. Eng. 2009, 37, 1546–1559. [Google Scholar] [CrossRef] [PubMed]
- Williams, S.J.; Park, C.; Wereley, S.T. Advances and applications on microfluidic velocimetry techniques. Microfluid. Nanofluid. 2010, 8, 709–726. [Google Scholar] [CrossRef]
- Kikuchi, K.; Mochizuki, O. Micro-piv (micro particle image velocimetry) visualization of red blood cells (rbcs) sucked by a female mosquito. Measur. Sci. Technol. 2011, 22, 064002. [Google Scholar] [CrossRef]
- Garcia, V.; Dias, R.; Lima, R. In vitro blood flow behaviour in microchannels with simple and complex geometries. In Applied Biological Engineering-Principles and Practice; InTech: London, UK, 2012. [Google Scholar]
- Lima, R.; Ishikawa, T.; Imai, Y.; Yamaguchi, T. Blood flow behavior in microchannels: Past, current and future trends. Single Two-Phase Flows Chem. Biomed. Eng. 2012, 513–547. [Google Scholar]
- Pitts, K.; Mehri, R.; Mavriplis, C.; Fenech, M. Micro-particle image velocimetry measurement of blood flow: Validation and analysis of data pre-processing and processing methods. Measur. Sci. Technol. 2012, 23, 105302. [Google Scholar] [CrossRef]
- Sackmann, E.K.; Fulton, A.L.; Beebe, D.J. The present and future role of microfluidics in biomedical research. Nature 2014, 507, 181. [Google Scholar] [CrossRef] [PubMed]
- Stauber, H.; Waisman, D.; Korin, N.; Sznitman, J. Red blood cell dynamics in biomimetic microfluidic networks of pulmonary alveolar capillaries. Biomicrofluidics 2017, 11, 014103. [Google Scholar] [CrossRef] [PubMed]
- Kim, S.; Kong, R.L.; Popel, A.S.; Intaglietta, M.; Johnson, P.C. A computer-based method for determination of the cell-free layer width in microcirculation. Microcirculation 2006, 13, 199–207. [Google Scholar] [CrossRef] [PubMed]
- Pinho, D.; Lima, R.; Pereira, A.I.; Gayubo, F. Automatic tracking of labeled red blood cells in microchannels. Int. J. Numer. Methods Biomed. Eng. 2013, 29, 977–987. [Google Scholar] [CrossRef] [PubMed]
- Chenouard, N.; Smal, I.; De Chaumont, F.; Maška, M.; Sbalzarini, I.F.; Gong, Y.; Cardinale, J.; Carthel, C.; Coraluppi, S.; Winter, M. Objective comparison of particle tracking methods. Nat. Methods 2014, 11, 281. [Google Scholar] [CrossRef] [PubMed] [Green Version]
- Taboada, B.; Monteiro, F.; Lima, R. Automatic tracking and deformation measurements of red blood cells flowing through a microchannel with a microstenosis: The keyhole model. Comput. Methods Biomech. Biomed. Eng. Imaging Vis. 2016, 4, 229–237. [Google Scholar] [CrossRef]
- Bento, D.; Pereira, A.; Lima, J.; Miranda, J.; Lima, R. Cell-free layer measurements of in vitro blood flow in a microfluidic network: An automatic and manual approach. Comput. Methods Biomech. Biomed. Eng. Imaging Vis. 2017, 1–9. [Google Scholar] [CrossRef]
- Mehri, R.; Niazi, E.; Mavriplis, C.; Fenech, M. An automated method for dynamic red blood cell aggregate detection in microfluidic flow. Physiol. Meas. 2018, 39, 01NT02. [Google Scholar] [CrossRef] [PubMed]
- Forsyth, A.M.; Wan, J.; Owrutsky, P.D.; Abkarian, M.; Stone, H.A. Multiscale approach to link red blood cell dynamics, shear viscosity, and atp release. Proc. Natl. Acad. Sci. USA 2011, 108, 10986–10991. [Google Scholar] [CrossRef] [PubMed]
- Pinho, D.; Yaginuma, T.; Lima, R. A microfluidic device for partial cell separation and deformability assessment. BioChip J. 2013, 7, 367–374. [Google Scholar] [CrossRef]
- Rosenbluth, M.J.; Lam, W.A.; Fletcher, D.A. Analyzing cell mechanics in hematologic diseases with microfluidic biophysical flow cytometry. Lab Chip 2008, 8, 1062–1070. [Google Scholar] [CrossRef] [PubMed]
- Forsyth, A.M.; Wan, J.; Ristenpart, W.D.; Stone, H.A. The dynamic behavior of chemically “stiffened” red blood cells in microchannel flows. Microvasc. Res. 2010, 80, 37–43. [Google Scholar] [CrossRef] [PubMed]
- Fujiwara, H.; Ishikawa, T.; Lima, R.; Matsuki, N.; Imai, Y.; Kaji, H.; Nishizawa, M.; Yamaguchi, T. Red blood cell motions in high-hematocrit blood flowing through a stenosed microchannel. J. Biomech. 2009, 42, 838–843. [Google Scholar] [CrossRef] [PubMed]
- Zeng, N.F.; Ristenpart, W.D. Mechanical response of red blood cells entering a constriction. Biomicrofluidics 2014, 8, 064123. [Google Scholar] [CrossRef] [PubMed]
- Pinho, D.; Rodrigues, R.O.; Yaginuma, T.; Faustino, V.; Bento, D.; Fernandes, C.S.; Garcia, V.; Pereira, A.I.; Lima, R. Motion of rigid particles flowing in a microfluidic device with a pronounced stenosis: Trajectories and deformation index. In Proceedings of the 11th World Congress on Computational Mechanics, 5th European Conference on Computational Mechanics and 6th European Conference on Computational Fluid Dynamics, Barcelona, Spain, 20–25 July 2014; pp. 6234–6240. [Google Scholar]
- Yamaguchi, T.; Ishikawa, T.; Tsubota, K.; Imai, Y.; Nakamura, M.; Fukui, T. Computational blood flow analysis—New trends and methods. J. Biomech. Sci. Eng. 2006, 1, 29–50. [Google Scholar] [CrossRef]
- Lima, R.; Fernandes, C.S.; Dias, R.; Ishikawa, T.; Imai, Y.; Yamaguchi, T. Microscale flow dynamics of red blood cells in microchannels: An experimental and numerical analysis. In Computational Vision and Medical Image Processing; Springer: Dordrecht, The Netherlands, 2009; pp. 203–220. [Google Scholar]
- Nakamura, M.; Bessho, S.; Wada, S. Spring-network-based model of a red blood cell for simulating mesoscopic blood flow. Int. J. Numer. Methods Biomed. Eng. 2013, 29, 114–128. [Google Scholar] [CrossRef] [PubMed]
- Bento, D.; Lima, R.; M Miranda, J. Computation of a three-dimensional flow in a square microchannel: A comparison between a particle method and a finite volume method. Micro Nanosyst. 2015, 7, 142–147. [Google Scholar] [CrossRef]
- Omori, T.; Imai, Y.; Kikuchi, K.; Ishikawa, T.; Yamaguchi, T. Hemodynamics in the microcirculation and in microfluidics. Ann. Biomed. Eng. 2015, 43, 238–257. [Google Scholar] [CrossRef] [PubMed]
- Gambaruto, A.M. Flow structures and red blood cell dynamics in arteriole of dilated or constricted cross section. J. Biomech. 2016, 49, 2229–2240. [Google Scholar] [CrossRef] [PubMed]
- Imai, Y.; Omori, T.; Shimogonya, Y.; Yamaguchi, T.; Ishikawa, T. Numerical methods for simulating blood flow at macro, micro, and multi scales. J. Biomech. 2016, 49, 2221–2228. [Google Scholar] [CrossRef] [PubMed]
- Ye, T.; Phan-Thien, N.; Lim, C.T. Particle-based simulations of red blood cells—A review. J. Biomech. 2016, 49, 2255–2266. [Google Scholar] [CrossRef] [PubMed]
- Müller-Fischer, N.; Tobler, P.; Dressler, M.; Fischer, P.; Windhab, E.J. Single bubble deformation and breakup in simple shear flow. Exp. Fluids 2008, 45, 917–926. [Google Scholar] [CrossRef]
- Anderl, D.; Bauer, M.; Rauh, C.; Rüde, U.; Delgado, A. Numerical simulation of bubbles in shear flow. PAMM 2014, 14, 667–668. [Google Scholar] [CrossRef]
- Wei, Y.k.; Qian, Y.; Xu, H. Lattice boltzmann simulations of single bubble deformation and breakup in a shear flow. J. Comput. Multiph. Flows 2012, 4, 111–117. [Google Scholar] [CrossRef]
- Fu, T.; Ma, Y.; Funfschilling, D.; Li, H.Z. Dynamics of bubble breakup in a microfluidic T-junction divergence. Chem. Eng. Sci. 2011, 66, 4184–4195. [Google Scholar] [CrossRef]
- Liu, X.; Zhang, C.; Yu, W.; Deng, Z.; Chen, Y. Bubble breakup in a microfluidic T-junction. Sci. Bull. 2016, 61, 811–824. [Google Scholar] [CrossRef]
- Rocha, L.A.M.; Miranda, J.M.; Campos, J.B.L.M. Wide range simulation study of taylor bubbles in circular milli and microchannels. Micromachines 2017, 8, 154. [Google Scholar] [CrossRef]
- Bento, D.; Sousa, L.; Yaginuma, T.; Garcia, V.; Lima, R.; Miranda, J.M. Microbubble moving in blood flow in microchannels: Effect on the cell-free layer and cell local concentration. Biomed. Microdevices 2017, 19, 6. [Google Scholar] [CrossRef] [PubMed]
- Pinto, E.; Faustino, V.; Rodrigues, R.; Pinho, D.; Garcia, V.; Miranda, J.; Lima, R. A rapid and low-cost nonlithographic method to fabricate biomedical microdevices for blood flow analysis. Micromachines 2014, 6, 121–135. [Google Scholar] [CrossRef]
- Hoang, D.; Portela, L.; Kleijn, C.; Kreutzer, M.; Van Steijn, V. Dynamics of droplet breakup in a T-junction. J. Fluid Mech. 2013, 717. [Google Scholar] [CrossRef]
- Sibillo, V.; Pasquariello, G.; Simeone, M.; Cristini, V.; Guido, S. Drop deformation in microconfined shear flow. Phys. Rev. Lett. 2006, 97, 054502. [Google Scholar] [CrossRef] [PubMed]
- Ulloa, C.; Ahumada, A.; Cordero, M.L. Effect of confinement on the deformation of microfluidic drops. Phys. Rev. E 2014, 89, 033004. [Google Scholar] [CrossRef] [PubMed]
- Mulligan, M.K.; Rothstein, J.P. Deformation and breakup of micro-and nanoparticle stabilized droplets in microfluidic extensional flows. Langmuir 2011, 27, 9760–9768. [Google Scholar] [CrossRef] [PubMed]
- Mulligan, M.K.; Rothstein, J.P. The effect of confinement-induced shear on drop deformation and breakup in microfluidic extensional flows. Phys. Fluids 2011, 23, 022004. [Google Scholar] [CrossRef]

| Measurement Technique | Human Diseases | Main Key Features | References |
|---|---|---|---|
| Micropipette aspiration | Sickle cell anemia, malaria | Enables accurate mechanical response of single RBCs, labor-intensive, time-consuming, and involves a typically difficult process of manipulation. | [4,10,11,12] |
| Optical tweezers | Malaria, sickle cell anemia, diabetes mellitus | Ability to obtain a mechanical response of single RBCs down to the piconewton level; labor-intensive, time-consuming and special human technical skills are required. | [4,13,14] |
| Atomic force microscopy | Cancer, spherocytosis, thalassemia, diabetes mellitus, sickle cell anemia | Ability to apply forces to RBC surfaces at the nanoscale level; labor-intensive; time-consuming, and requires expensive equipment. | [4,15,16,17] |
| Microfluidic ektacytometer | Diabetes mellitus | Homogenous flow, ability to differentiate healthy and diseased cells, labor-intensive and time-consuming process. It is required to label the RBCs to identify them. This latter process may change the RBCs‘ mechanical properties. | [18,19] |
| Microfluidic constriction channel | Diabetes mellitus, malaria, cancer, abdominal obesity and metabolic syndrome | Reduced space, homogenous flow, label-free, ability to measure a large amount of cells in one single run, potential to precisely control and detect small deformability changes, needs a high-speed video microscopy system combined with an image analysis technique; blockage is likely to happen at constriction microchannels with dimensions similar to the RBC diameter. | [18,19,20,21,22,23,24] |
| Microfluidic Technique | Cell Types | Main Flow Phenomenon | Approach to Measure the Degree of Deformability | Main Advantages | Main Disadvantages | References |
|---|---|---|---|---|---|---|
| Fluid-induced deformation channel | Human RBCs | Poiseuille flow |  | Homogenous flow; ability to measure large amount of cells in one single run. | The extensional flow is not homogenous; expensive micro-visualization equipment. | [25] |
| Fluid-induced deformation channel | Human&rabbit RBCs, WBCs | Extensional flow (hyperbolic channel) | 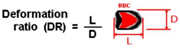 | Homogenous extensional flow; high-sensitivity tool; potential to precisely control&detect small deformability changes; ability to measure large amount of cells in one single run. | Expensive micro-visualization equipment. | [19,28,29,32,33,38,40] |
| Fluid-induced deformation channel | RBCs and WBCs | Extensional flow (cross slot channel) | 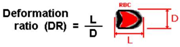 | Extensional flow; capacity to differentiate healthy and diseased cells; ability to measure large amount of cells in one single run. | Expensive micro-visualization equipment; the numerical models may need to be validated with in vitro experiments. | [35,36] |
| Fluid-induced deformation channel | RBCs | Poiseuille flow | 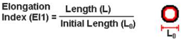 | Homogenous flow; ability to measure large amount of cells in one single run. | The extensional flow is not homogenous; expensive micro-visualization equipment. | [67,69] |
| Structure-induced deformation channel | RBCs | Poiseuille flow |  | Homogenous flow; ability to differentiate healthy and diseased cells. | Complex to control the flow; difficult fabrication; blockage is likely to happen; expensive micro-visualization equipment. | [20,26] |
| Structure-induced deformation channel | Cancer cells | Poiseuille flow |  | Homogenous flow; ability to differentiate healthy and diseased cells. | Complex to control the flow; difficult fabrication; blockage is likely to happen; expensive micro-visualization equipment. | [22] |
| Microfluidic Technique | Fluid | Main Flow Phenomenon | Configuration | References |
|---|---|---|---|---|
| parallel band/plate apparatus | Bubbles and drops | Shear flow |  | [79,80,88] |
| T-junction divergence | Bubbles and drops | Extensional flow | 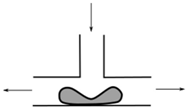 | [82,83,87] |
| Fluid-induced deformation channel | Drops | Extensional flow (hyperbolic channel) | 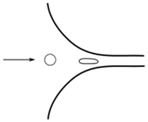 | [90,91] |
| Fluid-induced deformation channel | Drops | Extensional flow | 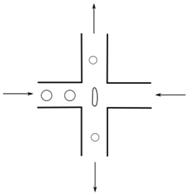 | [89] |
© 2018 by the authors. Licensee MDPI, Basel, Switzerland. This article is an open access article distributed under the terms and conditions of the Creative Commons Attribution (CC BY) license (http://creativecommons.org/licenses/by/4.0/).
Share and Cite
Bento, D.; Rodrigues, R.O.; Faustino, V.; Pinho, D.; Fernandes, C.S.; Pereira, A.I.; Garcia, V.; Miranda, J.M.; Lima, R. Deformation of Red Blood Cells, Air Bubbles, and Droplets in Microfluidic Devices: Flow Visualizations and Measurements. Micromachines 2018, 9, 151. https://doi.org/10.3390/mi9040151
Bento D, Rodrigues RO, Faustino V, Pinho D, Fernandes CS, Pereira AI, Garcia V, Miranda JM, Lima R. Deformation of Red Blood Cells, Air Bubbles, and Droplets in Microfluidic Devices: Flow Visualizations and Measurements. Micromachines. 2018; 9(4):151. https://doi.org/10.3390/mi9040151
Chicago/Turabian StyleBento, David, Raquel O. Rodrigues, Vera Faustino, Diana Pinho, Carla S. Fernandes, Ana I. Pereira, Valdemar Garcia, João M. Miranda, and Rui Lima. 2018. "Deformation of Red Blood Cells, Air Bubbles, and Droplets in Microfluidic Devices: Flow Visualizations and Measurements" Micromachines 9, no. 4: 151. https://doi.org/10.3390/mi9040151