Shear Mode Bulk Acoustic Resonator Based on Inclined c-Axis AlN Film for Monitoring of Human Hemostatic Parameters

Abstract
:
1. Introduction
2. Experimental Studies
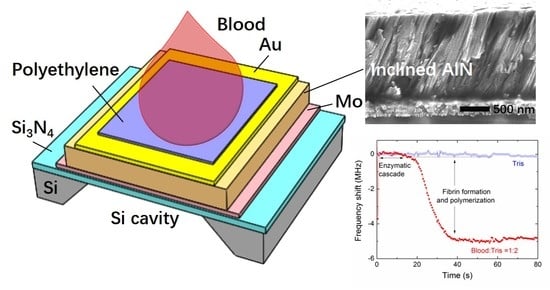
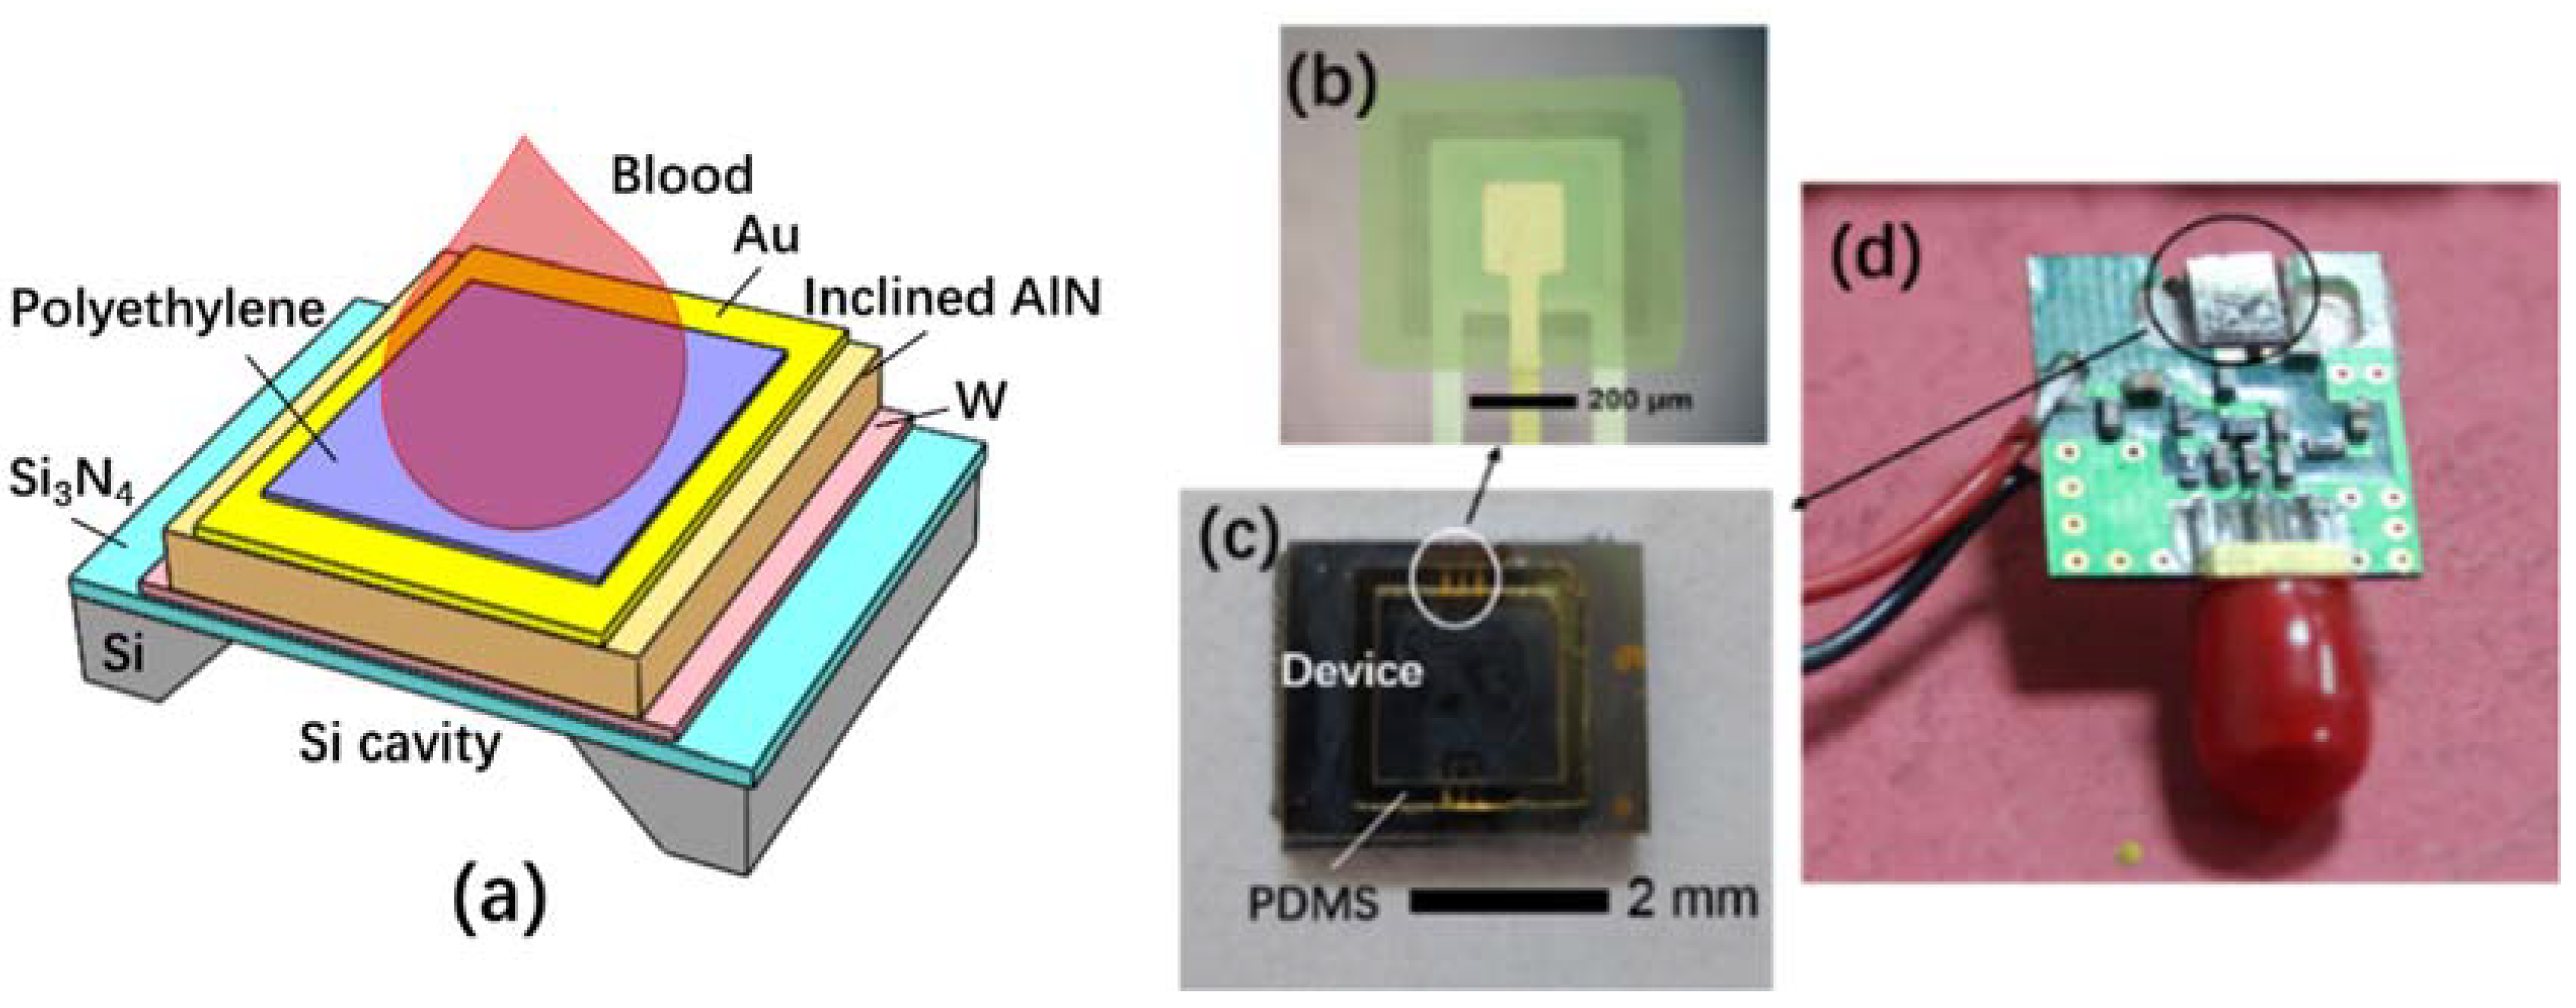
2.1. Device Structure
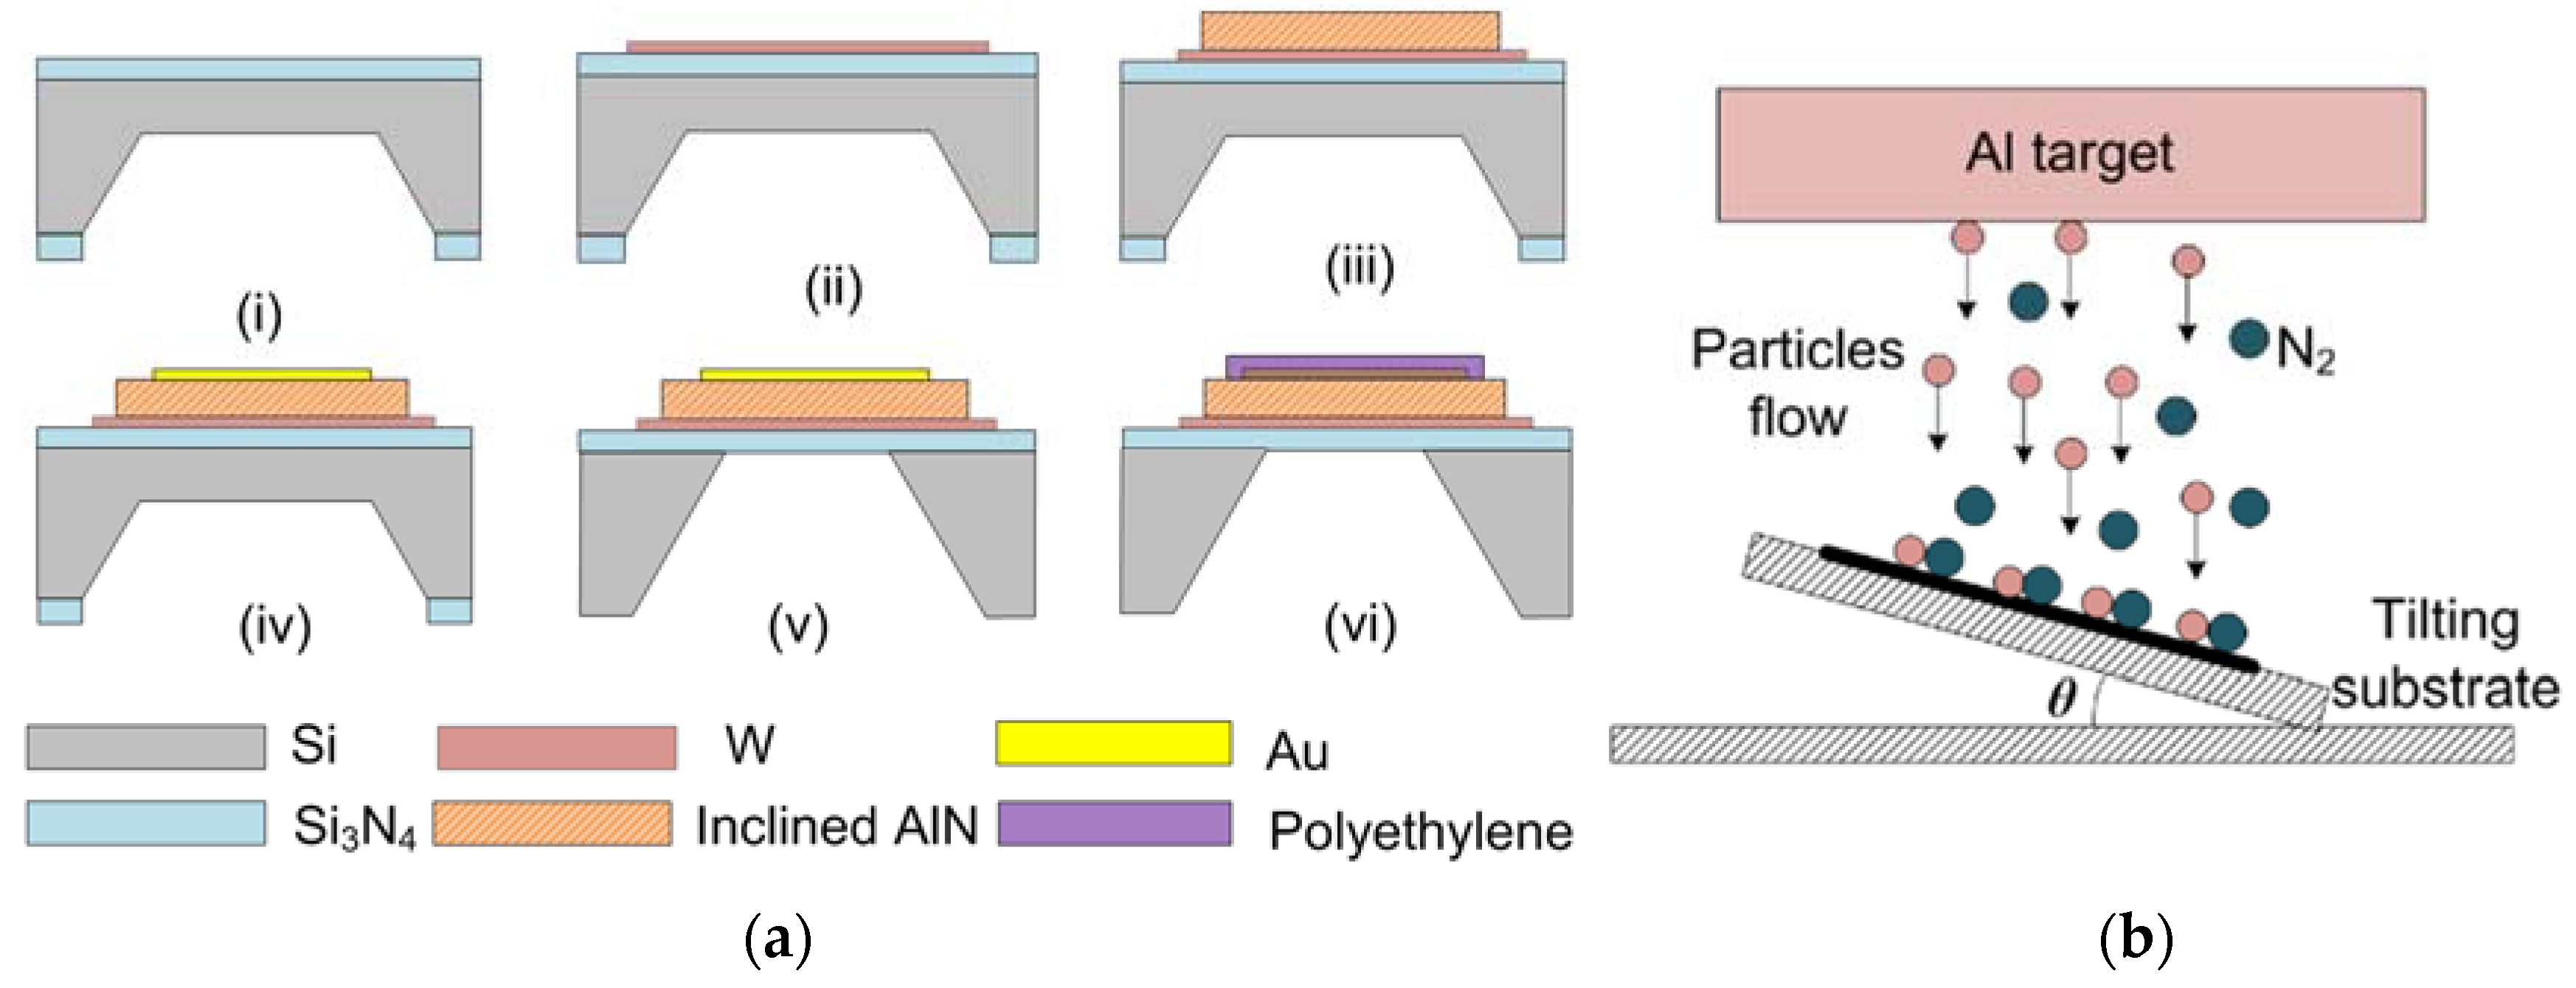
2.2. Device Fabrication
2.3. Measurement Procedure
3. Results and Discussion
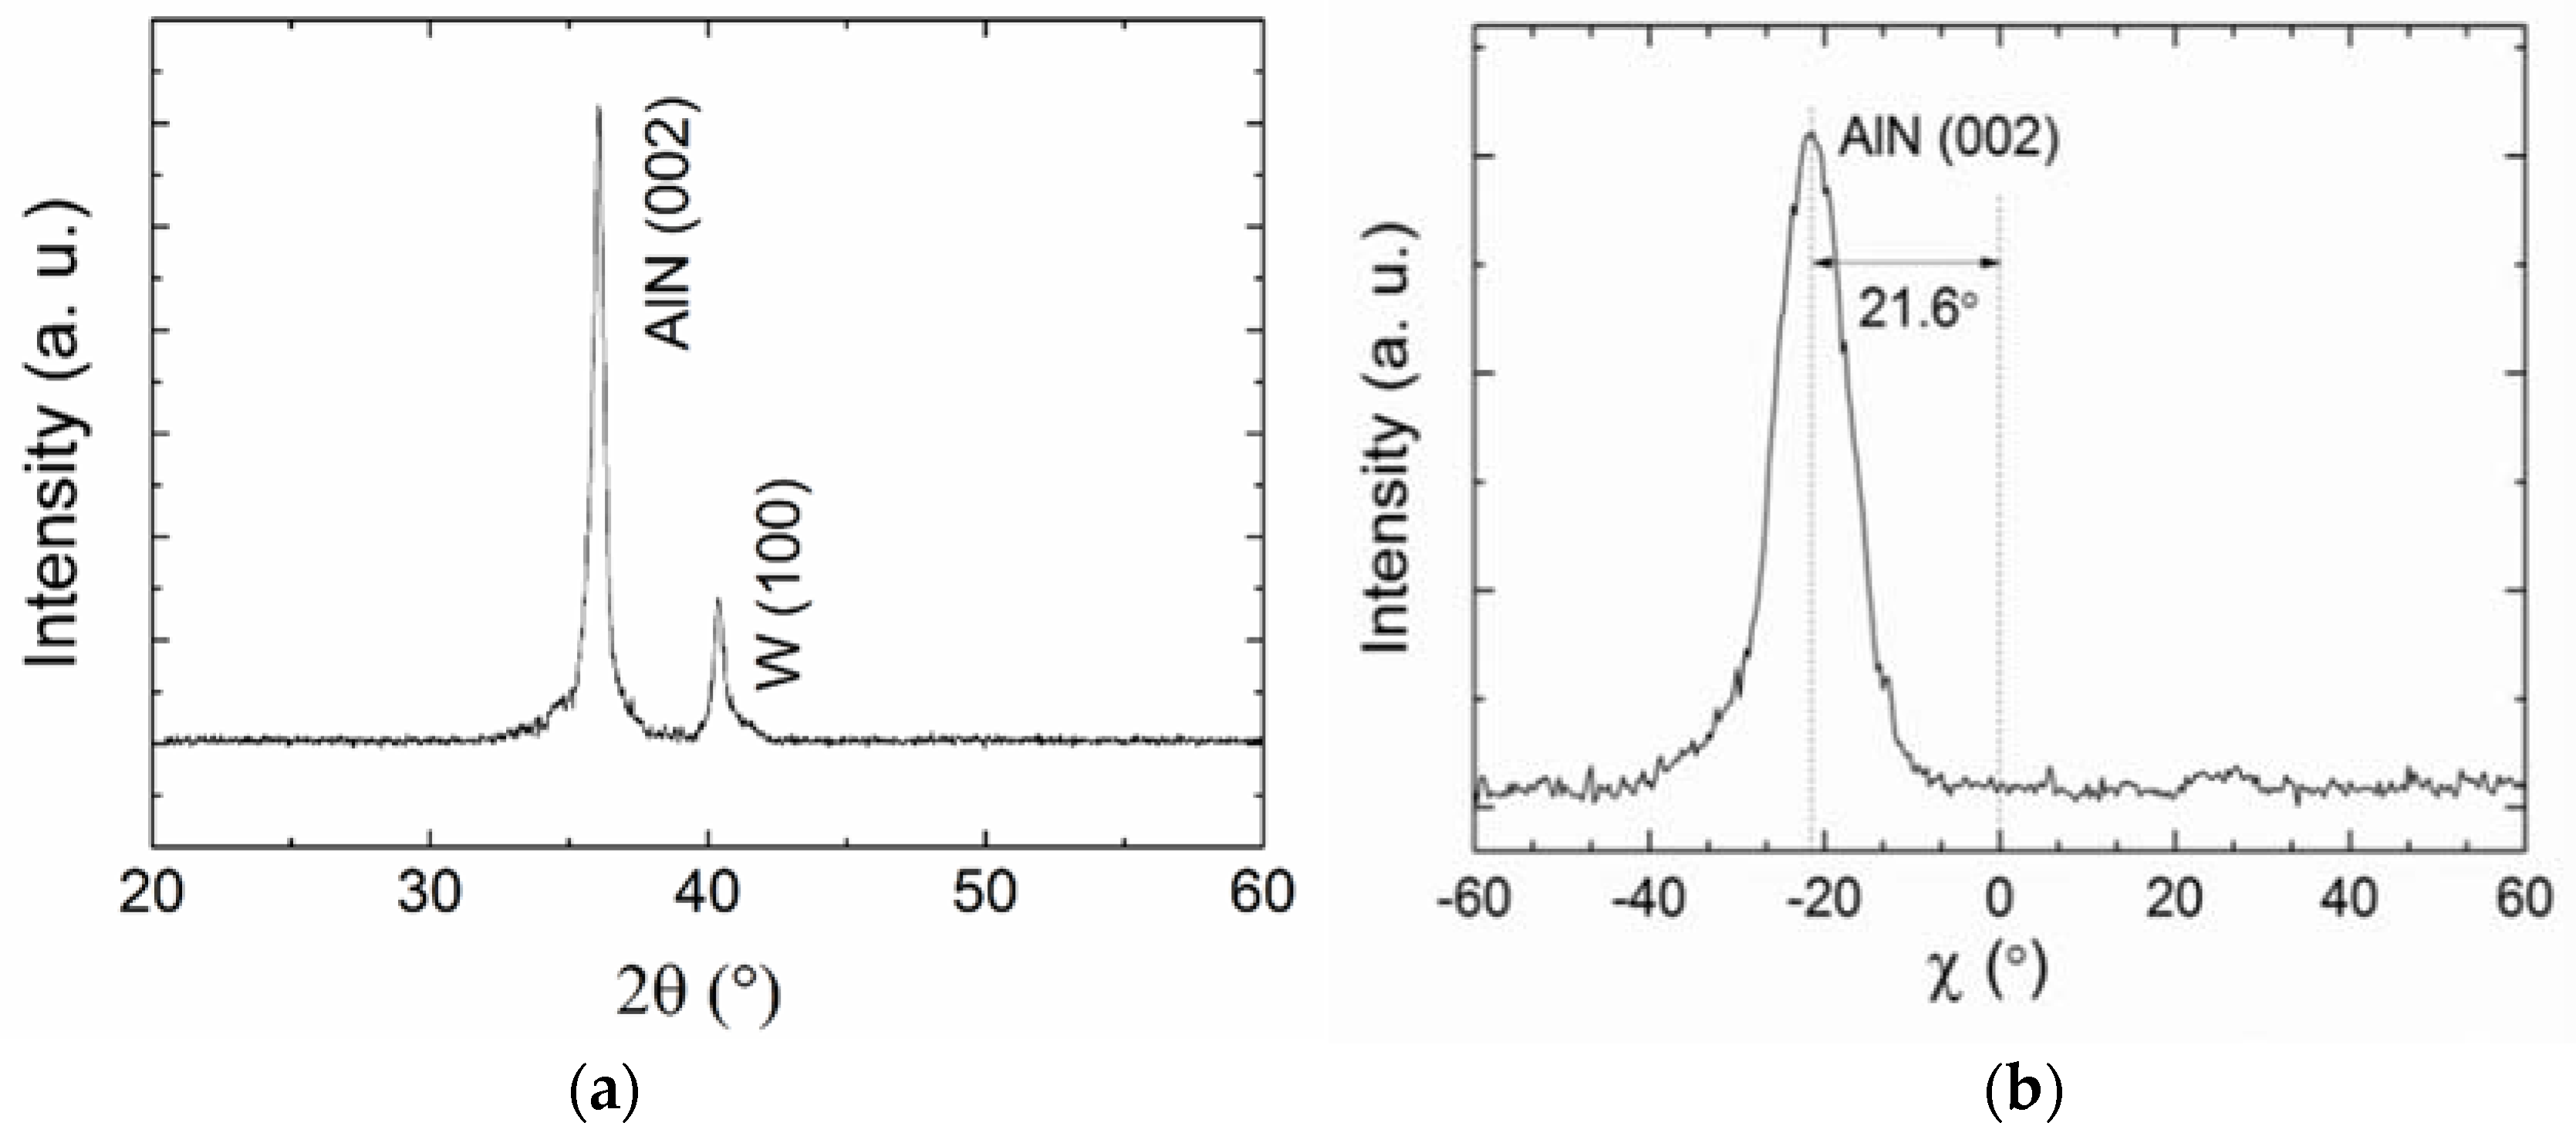
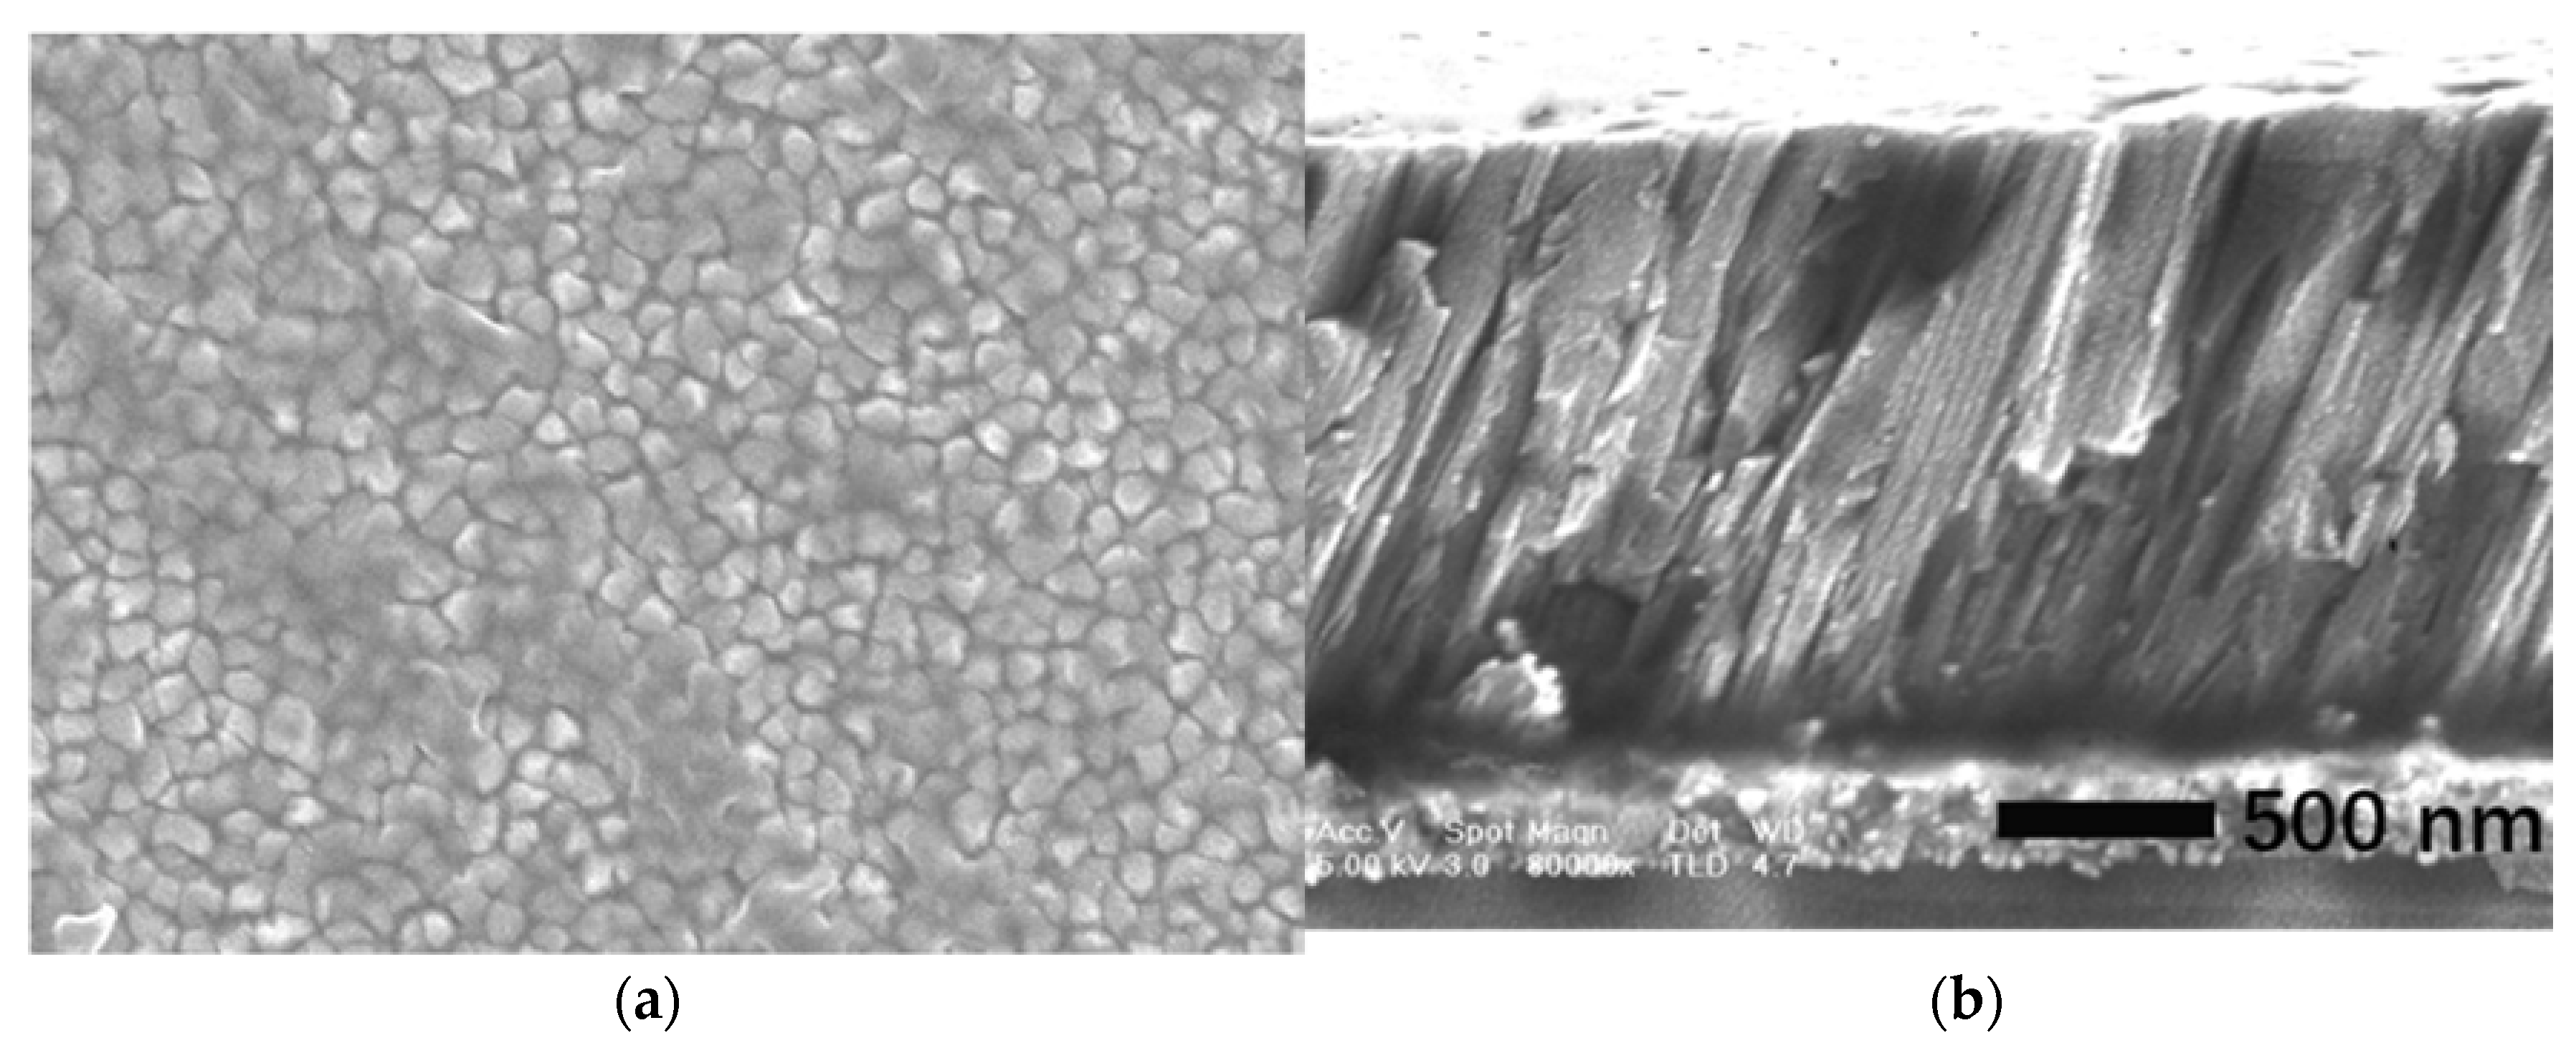
3.1. Characterization of the AlN Film with Inclined c-Axis
3.2. Electro-Acoustic Response in Air, Water and Blood
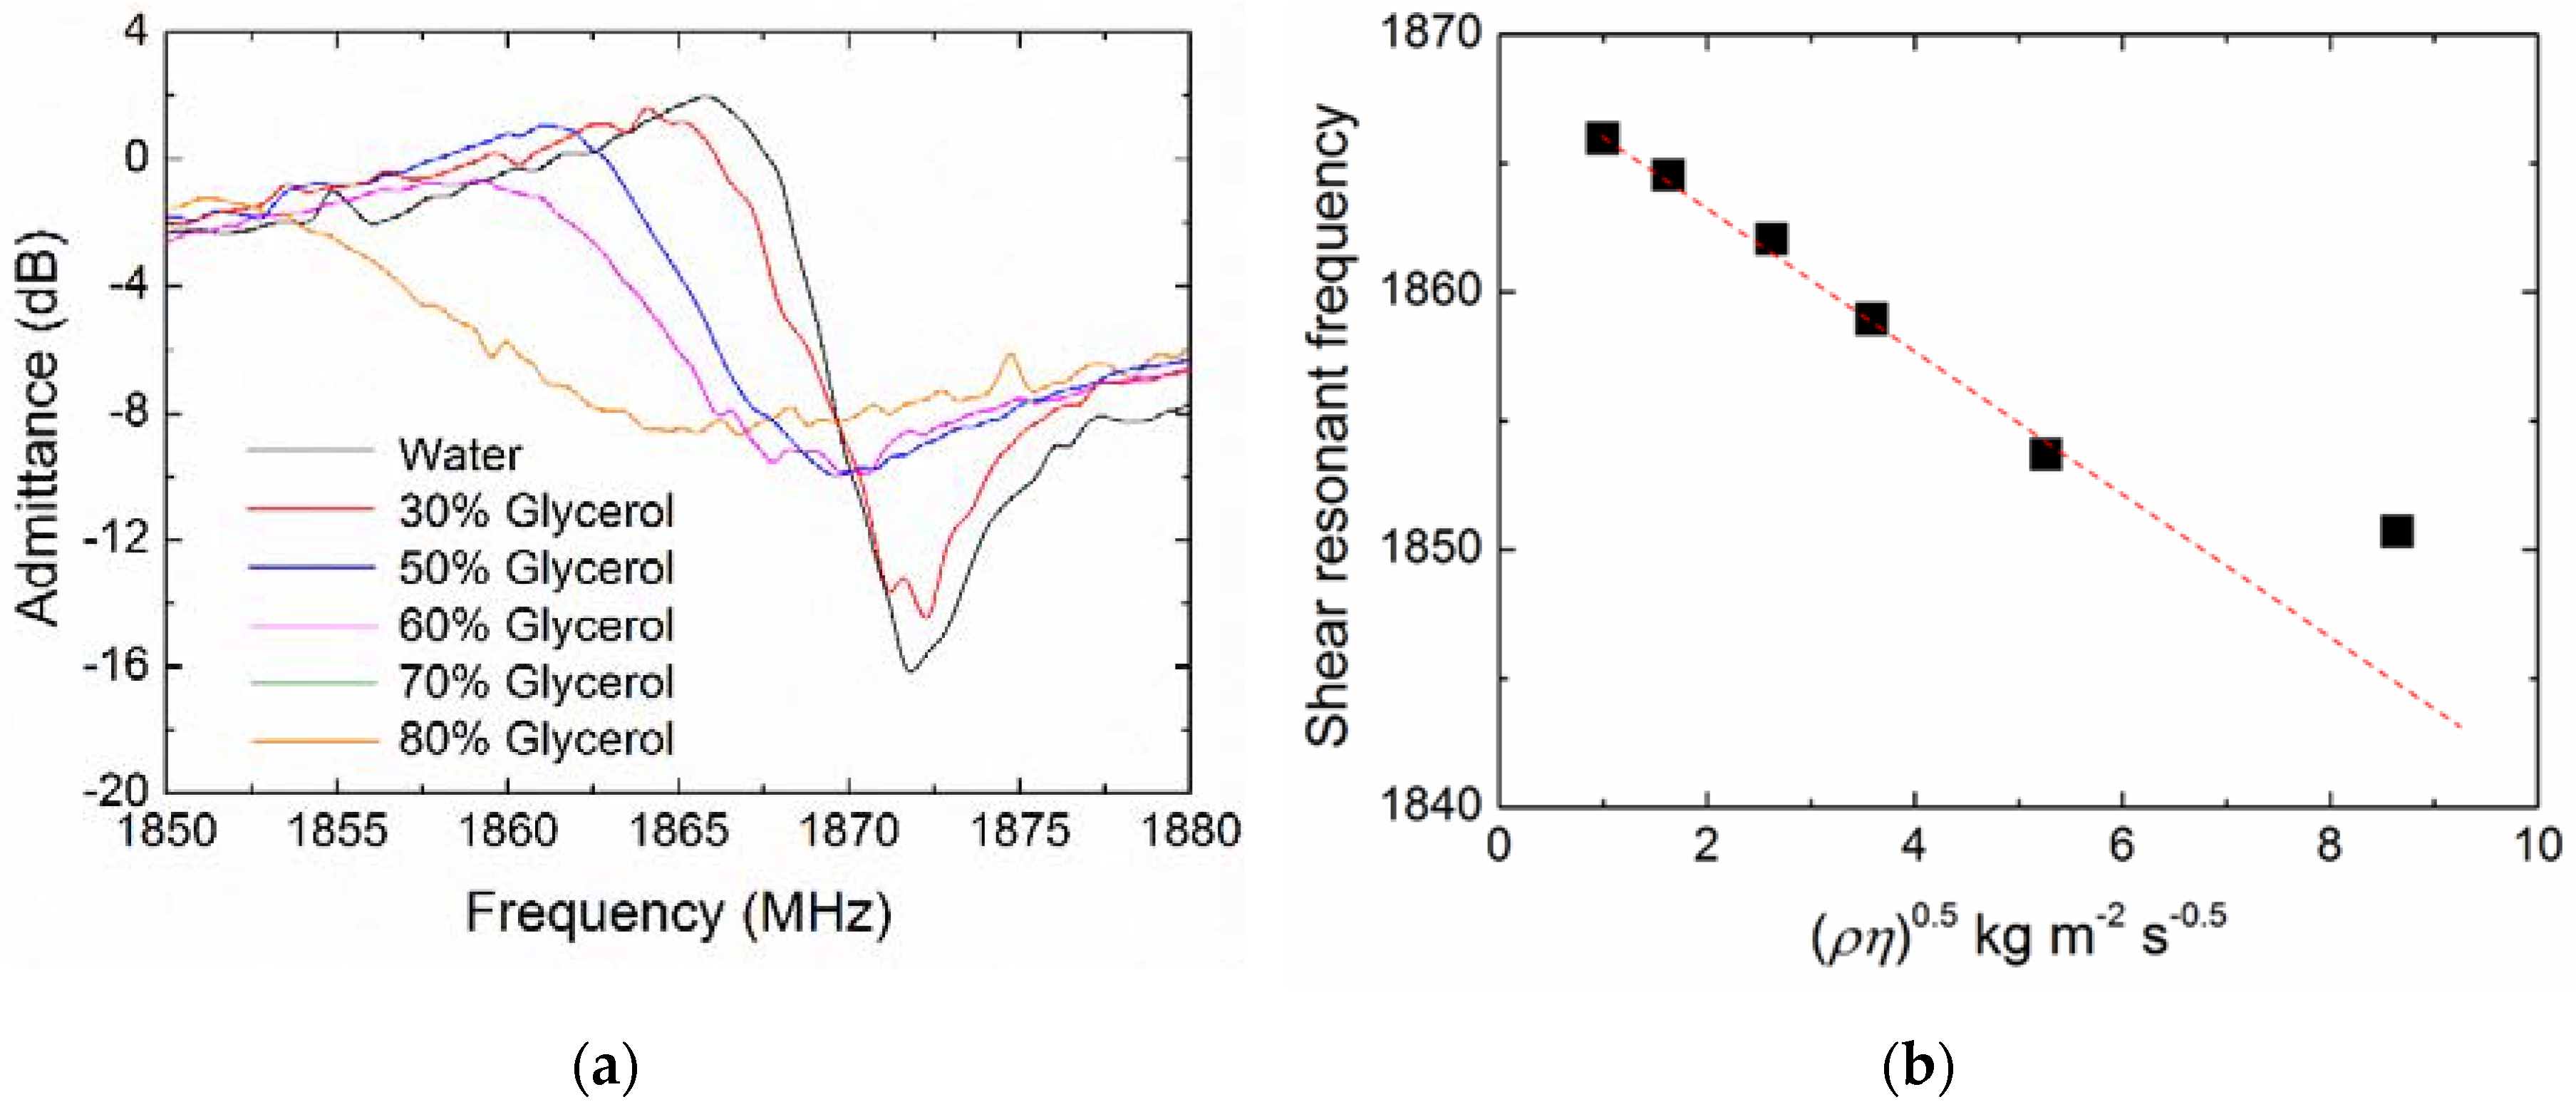
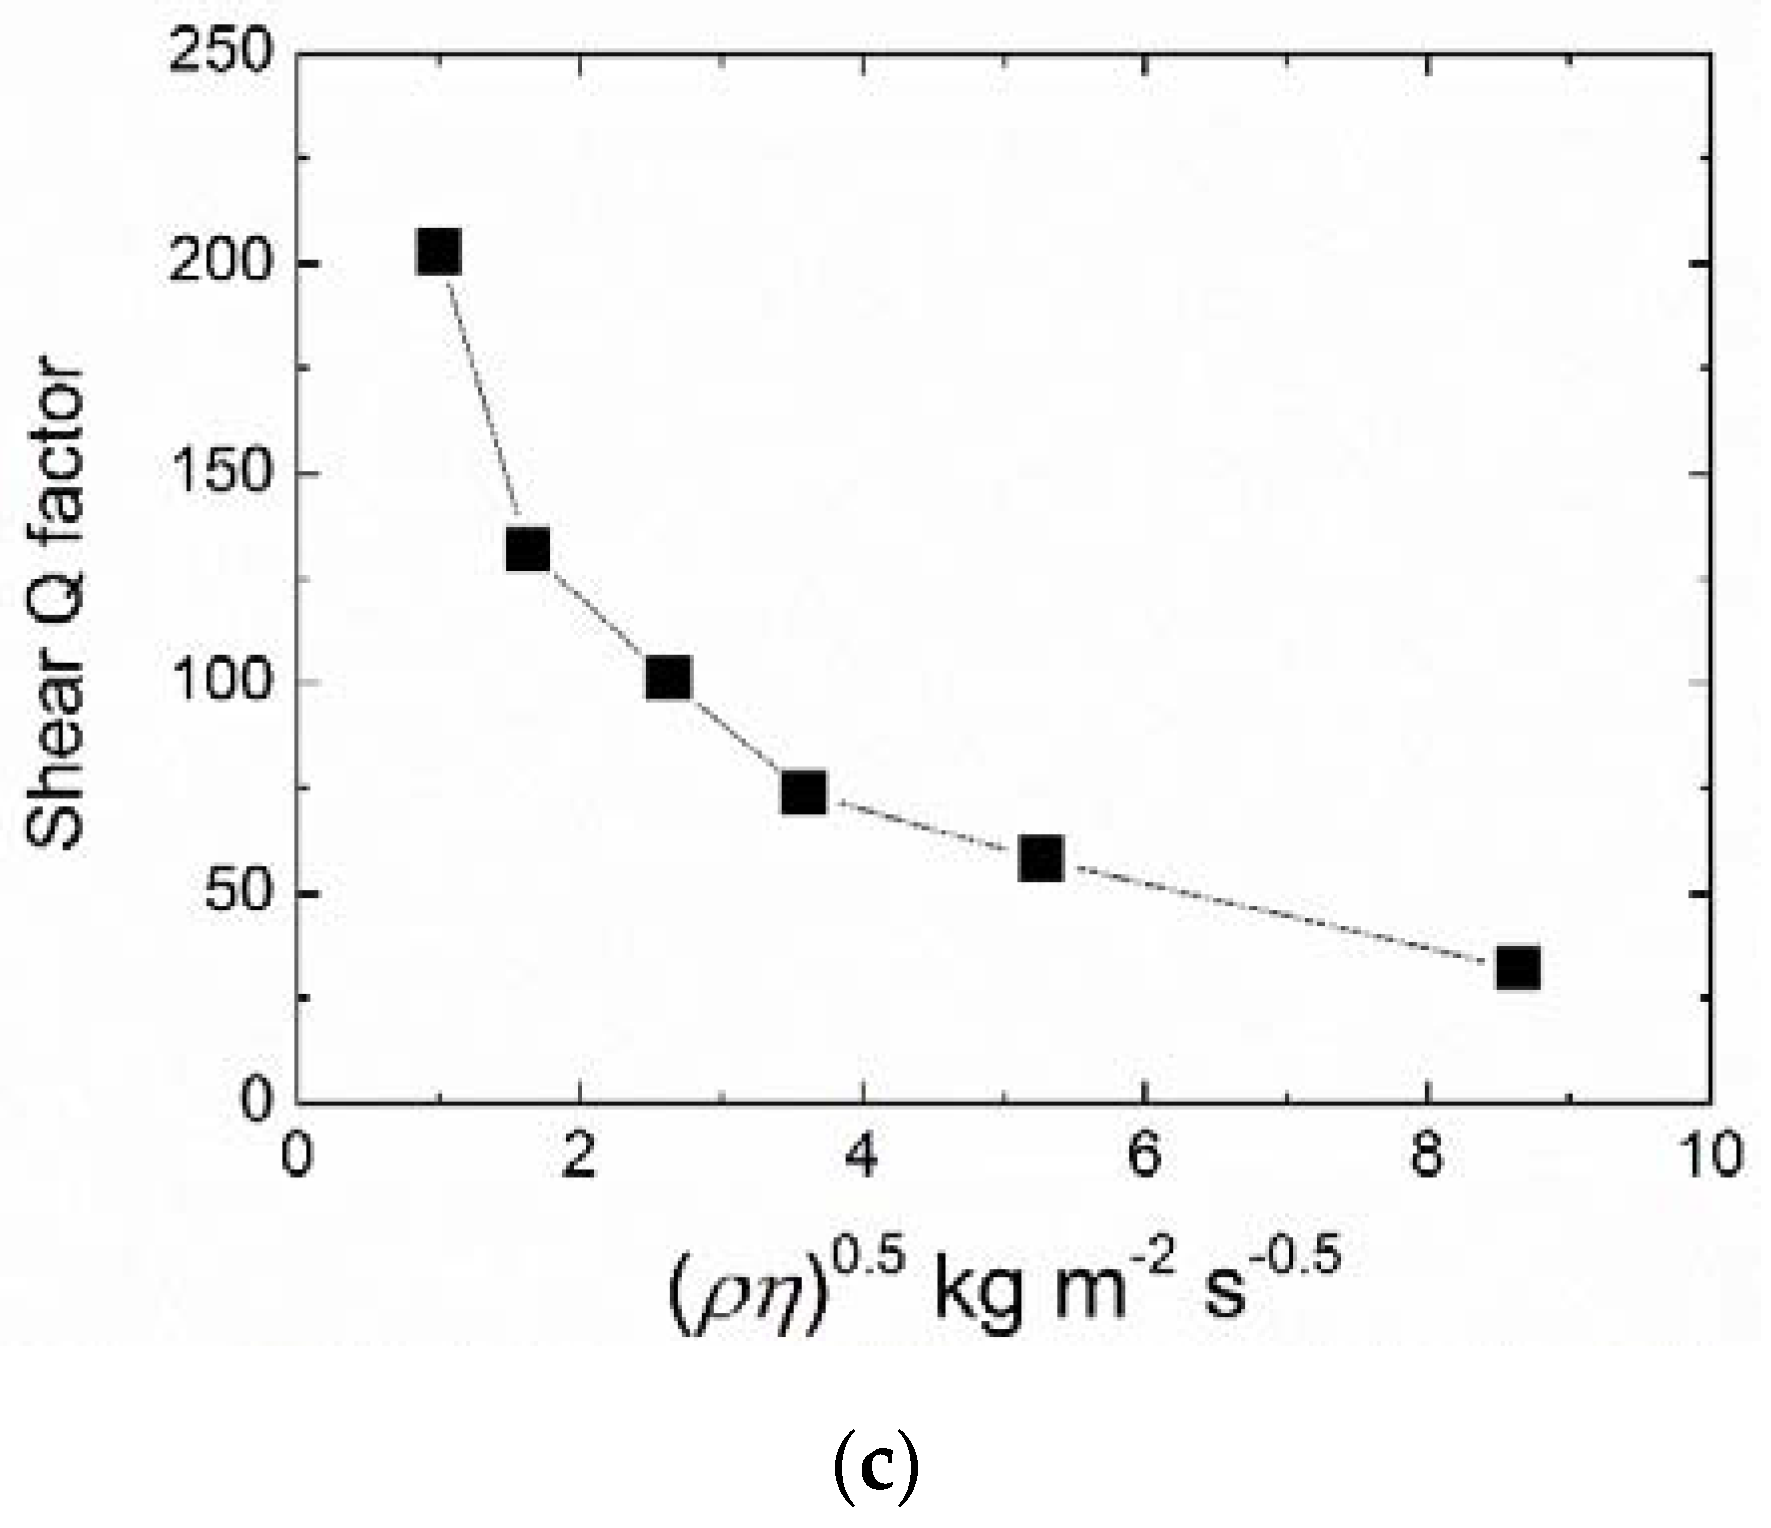
3.3. Viscosity Characterization of Shear Resonance
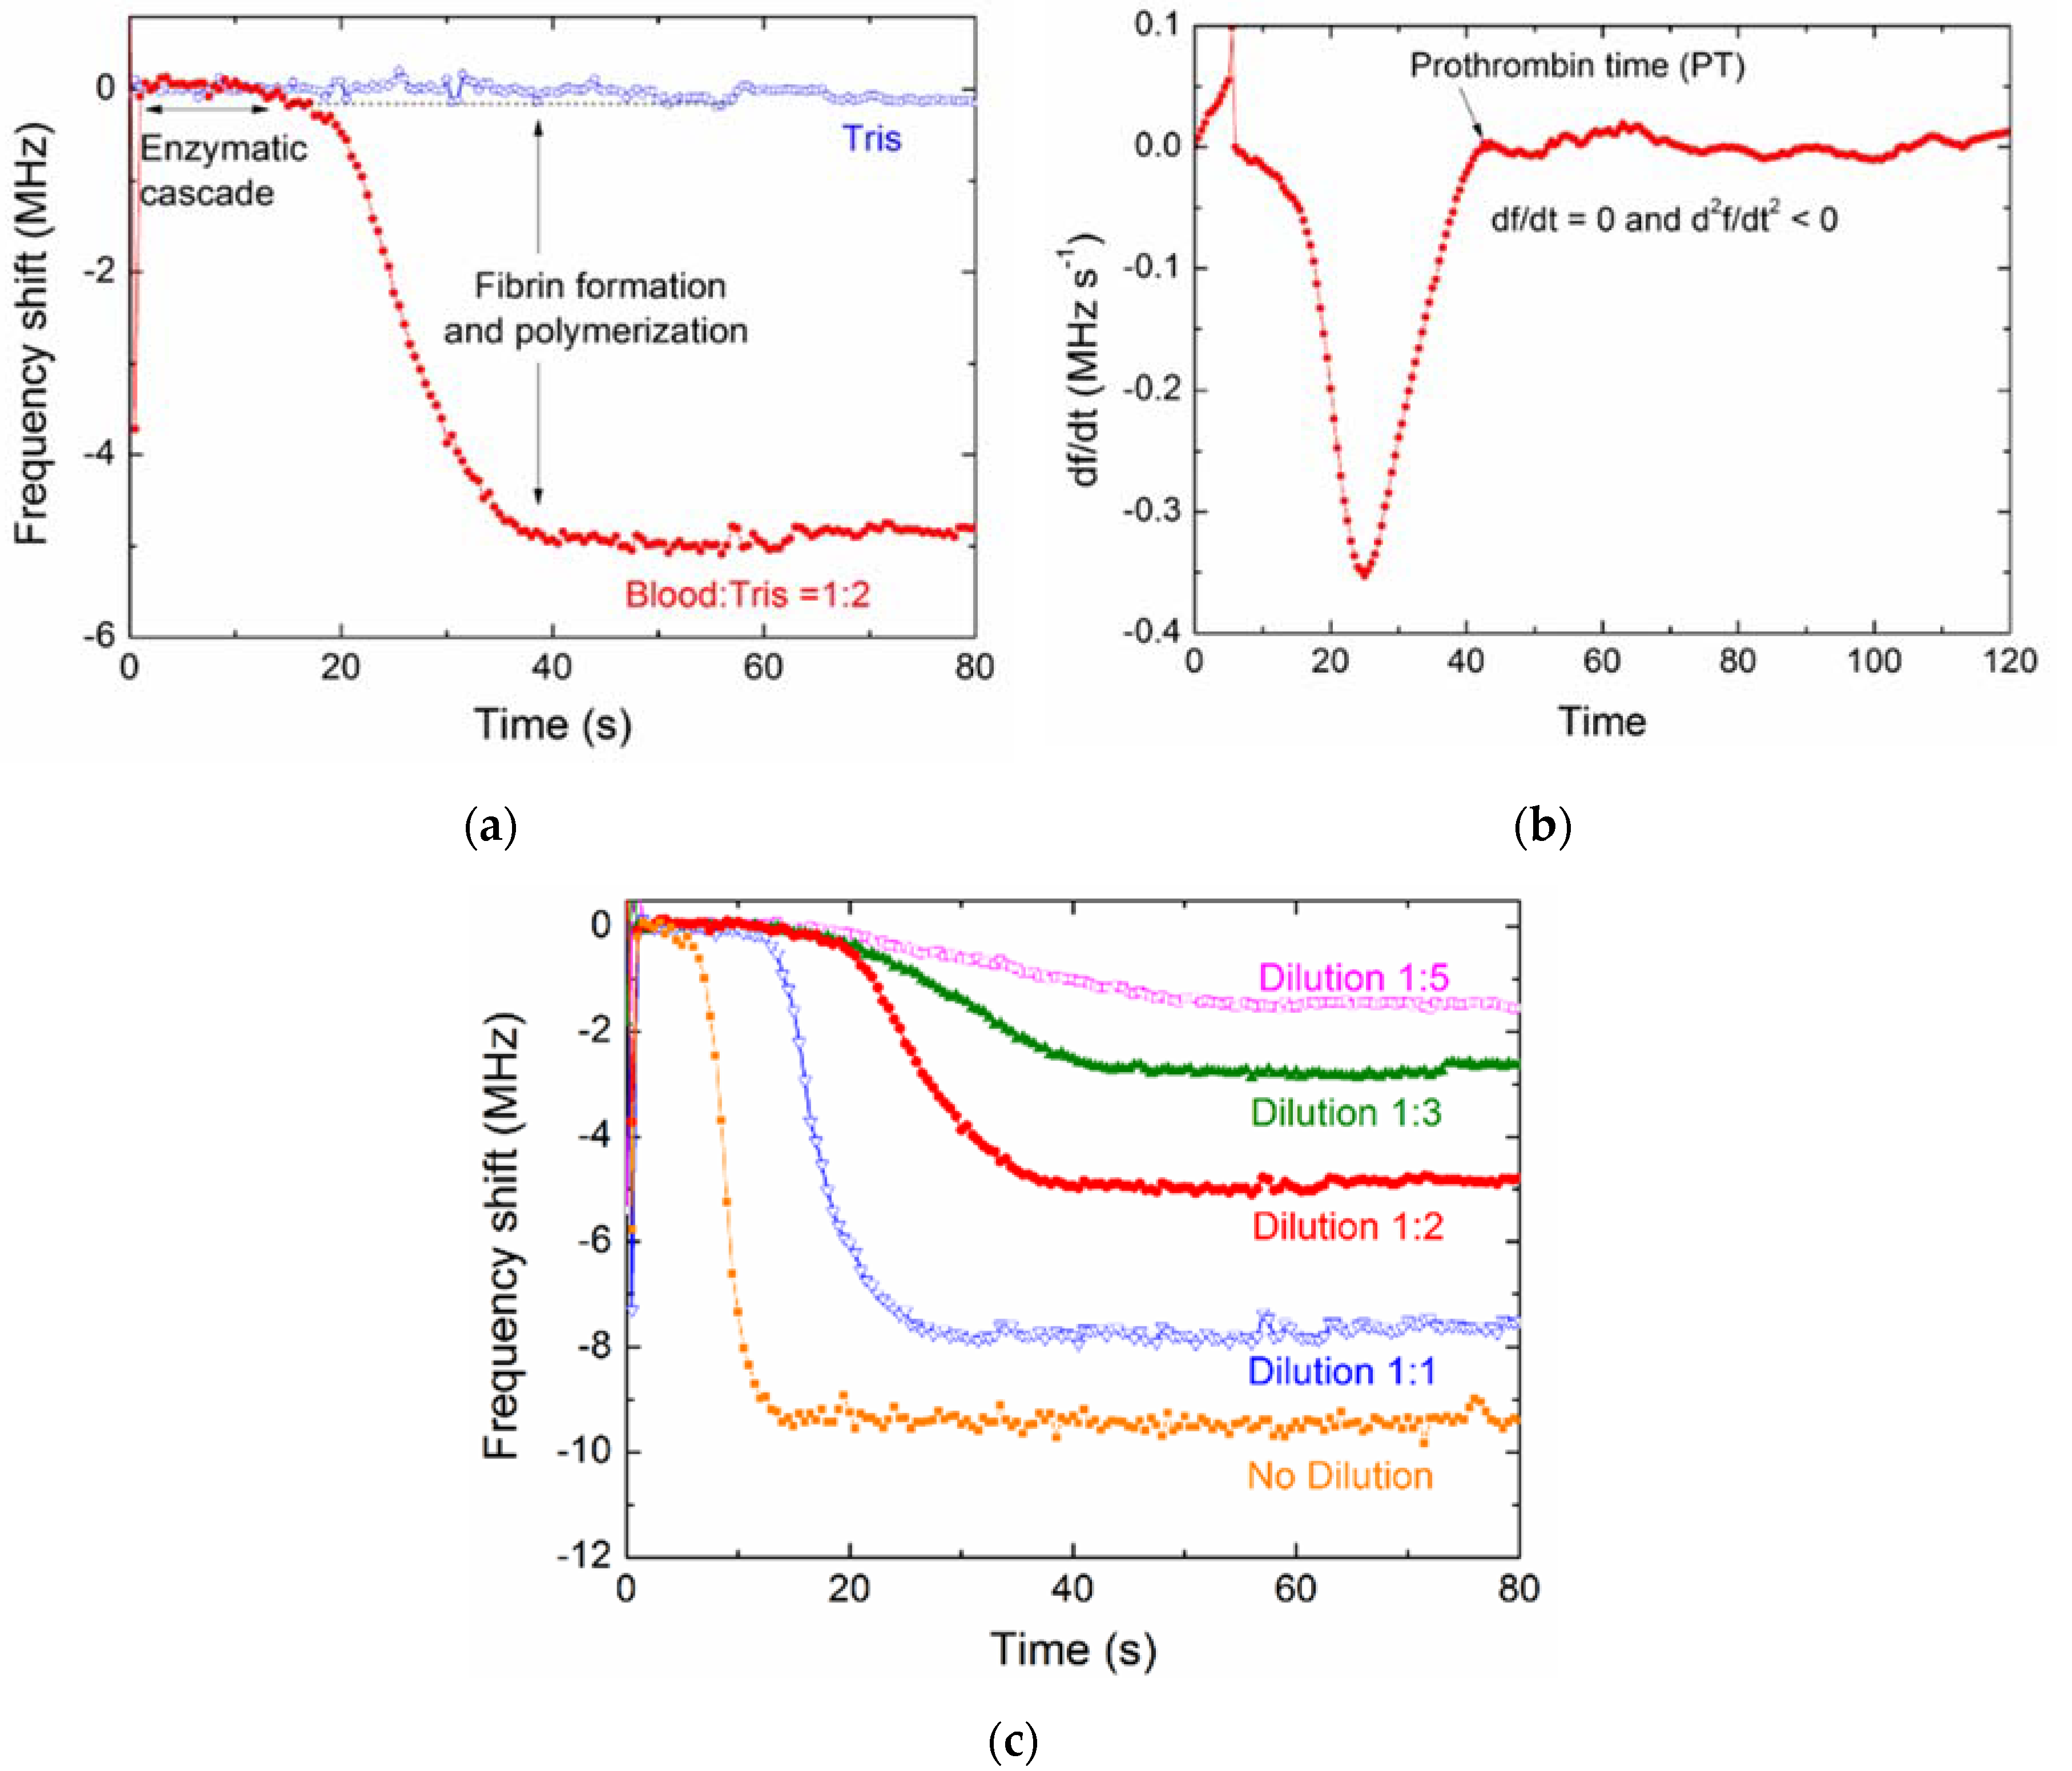
3.4. Blood Coagulation Monitoring
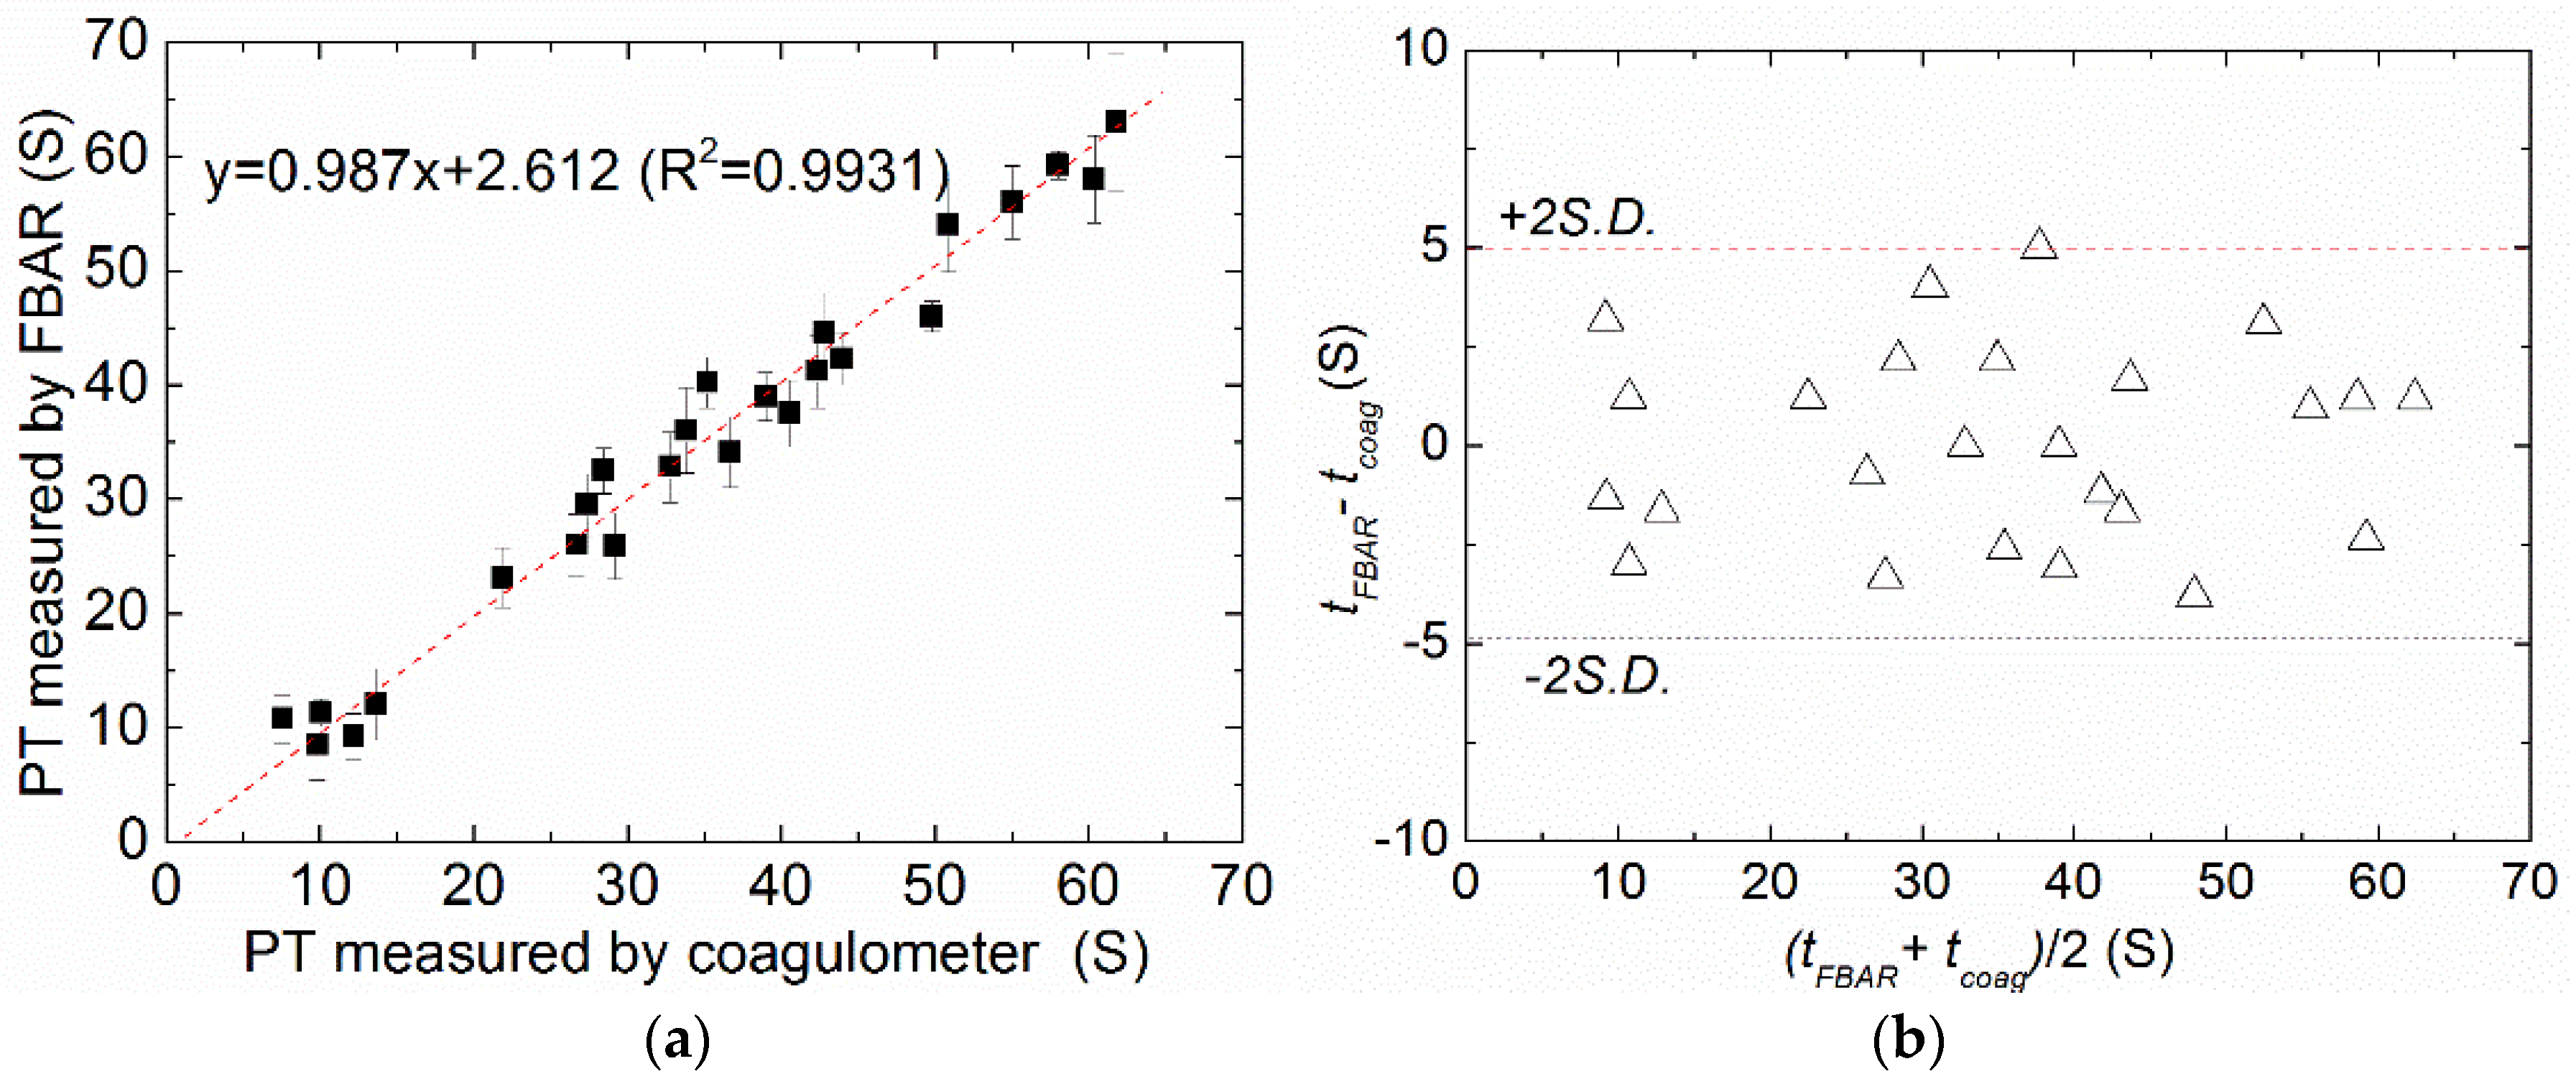
3.5. Comparison of the FBAR Sensor and a Standard Coagulometer
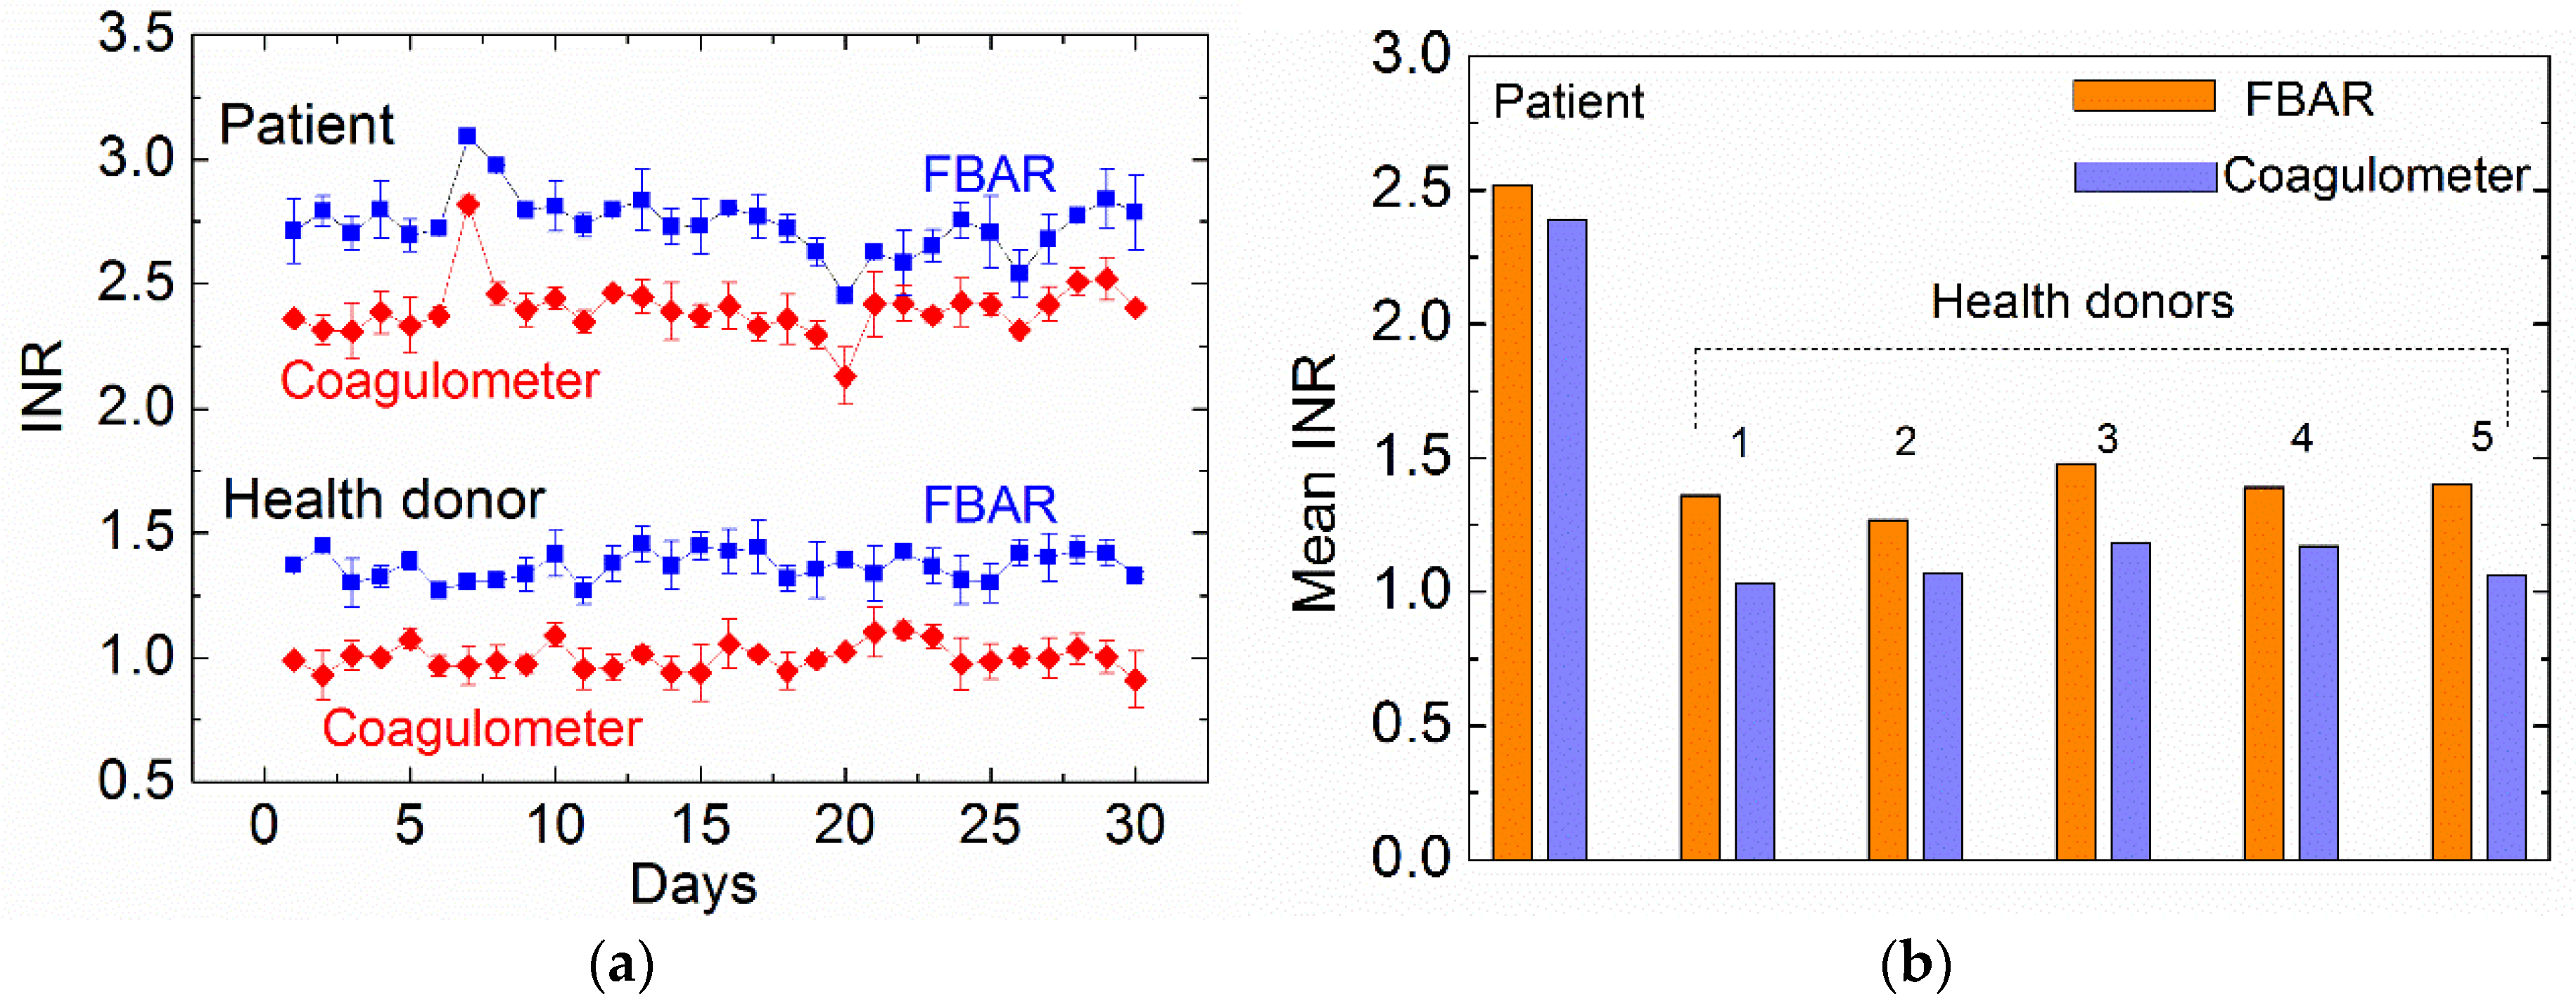
3.6. Application for Warfarin Therapy
4. Conclusions
Supplementary Materials
Author Contributions
Funding
Conflicts of Interest
References
- Cuker, A.; Siegal, D.M.; Crowther, M.A.; Garcia, D.A. Laboratory measurement of the anticoagulant activity of the non-vitamin K oral anticoagulants. J. Am. Coll. Cardiol. 2014, 64, 1128–1139. [Google Scholar] [CrossRef] [PubMed]
- Leite, P.M.; Martins, M.A.P.; Castilho, R.O. Review on mechanisms and interactions in concomitant use of herbs and warfarin therapy. Biomed. Pharmacother. 2016, 83, 14–21. [Google Scholar] [CrossRef] [PubMed]
- Ganter, M.T.; Hofer, C.K. Coagulation monitoring: Current techniques and clinical use of viscoelastic point-of-care coagulation devices. Anesth. Analg. 2008, 106, 1366–1375. [Google Scholar] [CrossRef] [PubMed] [Green Version]
- Whiting, P.; Al, M.; Westwood, M.; Ramos, I.C.; Ryder, S.; Armstrong, N.; Misso, K.; Ross, J.; Severens, J.; Kleijnen, J. Viscoelastic point-of-care testing to assist with the diagnosis, management and monitoring of haemostasis: A systematic review and cost-effectiveness analysis. Health Technol. Assess. 2015, 19, 19580. [Google Scholar] [CrossRef] [PubMed]
- McMichael, M.A.; Smith, S.A. Viscoelastic coagulation testing: Technology, applications, and limitations. Vet. Clin. Pathol. 2011, 40, 140–153. [Google Scholar] [CrossRef] [PubMed]
- Chen, J.Y.; Penn, L.S.; Xi, J. Quartz crystal microbalance: Sensing cell-substrate adhesion and beyond. Biosens. Bioelectron. 2018, 99, 593–602. [Google Scholar] [CrossRef] [PubMed]
- Fukada, K.; Shiratori, S. Viscosity sensing by adjusting the interface of a small liquid droplet/silica composite layer on quartz crystal microbalance. RSC Adv. 2016, 6, 38475–38480. [Google Scholar] [CrossRef] [Green Version]
- Pramod, N.G.; Pandey, S.N.; Sahay, P.P. Sn-doped in2O3 nanocrystalline thin films deposited by spray pyrolysis: Microstructural, optical, electrical, and formaldehyde-sensing characteristics. J. Therm. Spray Technol. 2013, 22, 1035–1043. [Google Scholar] [CrossRef]
- Lakshmanan, R.S.; Efremov, V.; Cullen, S.M.; Killard, A.J. Measurement of the evolution of rigid and viscoelastic mass contributions from fibrin network formation during plasma coagulation using quartz crystal microbalance. Sens. Actuators B 2014, 192, 23–28. [Google Scholar] [CrossRef]
- Efremov, V.; Killard, A.J.; Byrne, B.; Lakshmanan, R.S. The modelling of blood coagulation using the quartz crystal microbalance. J. Biomech. 2013, 46, 437–442. [Google Scholar] [CrossRef] [PubMed]
- Müller, L.; Sinn, S.; Drechsel, H.; Ziegler, C.; Wendel, H.P.; Northoff, H.; Gehring, F.K. Investigation of prothrombin time in human whole-blood samples with a quartz crystal biosensor. Anal. Chem. 2010, 82, 658–663. [Google Scholar] [CrossRef] [PubMed]
- Hussain, M.; Wendel, H.P.; Schmidt, K.; Langer, E.; Körber, M.K.; Faul, O.; Northoff, H.; von Heymann, C.; Gehring, F.K. QCM-D surpassing clinical standard for the dose administration of new oral anticoagulant in the patient of coagulation disorders. Biosens. Bioelectron. 2018, 104, 15–20. [Google Scholar] [CrossRef] [PubMed]
- Chen, D.; Wang, J.J.; Li, D.H.; Xu, Y. Hydrogen sensor based on Pd-functionalized film bulk acoustic resonator. Sens. Actuators B 2011, 159, 234–237. [Google Scholar] [CrossRef]
- Wang, X.; Cui, F.; Lin, J.; Ding, B.; Yu, J.; Al-Deyab, S.S. Functionalized nanoporous TiO2 fibers on quartz crystal microbalance platform for formaldehyde sensor. Sens. Actuators B 2012, 171–172, 658–665. [Google Scholar] [CrossRef]
- Chen, D.; Wang, J.J.; Liu, Q.X.; Xu, Y.; Li, D.H.; Liu, Y.J. Highly sensitive ZnO thin film bulk acoustic resonator for hydrogen detection. J. Micromech. Microeng. 2011, 21, 115018. [Google Scholar] [CrossRef]
- Jingjing, W.; Da, Z.; Ke, W.; Weiwei, H. The detection of formaldehyde using microelectromechanical acoustic resonator with multiwalled carbon nanotubes-polyethyleneimine composite coating. J. Micromech. Microeng. 2018, 28, 015003. [Google Scholar]
- Flewitt, A.J.; Luo, J.K.; Fu, Y.Q.; Garcia-Gancedo, L.; Du, X.Y.; Lu, J.R.; Zhao, X.B.; Iborra, E.; Ramos, M.; Milne, W.I. ZnO based SAW and FBAR devices for bio-sensing applications. J. Non-Newton. Fluid 2015, 222, 209–216. [Google Scholar] [CrossRef]
- Han, C.; Chen, D.; Zhang, Y.; Xu, D.; Liu, Y.; Kong, E.S.-W.; Zhang, Y. High Potential Columnar Nanocrystalline AlN Films Deposited by RF Reactive Magnetron Sputtering. Nano-Micro Lett. 2012, 4, 40–44. [Google Scholar] [CrossRef] [Green Version]
- Wang, J.; Chen, D.; Xu, Y.; Liu, W. Label-free immunosensor based on micromachined bulk acoustic resonator for the detection of trace pesticide residues. Sens. Actuators B 2014, 190, 378–383. [Google Scholar] [CrossRef]
- Chen, D.; Wang, J.J.; Xu, Y.; Liu, W.H.; Wang, P. Film bulk acoustic biosensor for detection of trace pesticide residues in agricultural products. Electron. Lett. 2013, 49, 924–925. [Google Scholar] [CrossRef]
- Zhao, X.; Ashley, G.M.; Garcia-Gancedo, L.; Jin, H.; Luo, J.; Flewitt, A.J.; Lu, J.R. Protein functionalized ZnO thin film bulk acoustic resonator as an odorant biosensor. Sens. Actuators B 2012, 163, 242–246. [Google Scholar] [CrossRef]
- Pang, W.; Zhao, H.; Kim, E.S.; Zhang, H.; Yuc, H.; Hu, X. Piezoelectric microelectromechanical resonant sensors for chemical and biological detection. Lab Chip 2012, 12, 29–44. [Google Scholar] [CrossRef] [PubMed]
- Song, S.; Chen, D.; Wang, H.; Guo, Q.; Wang, W.; Wu, M.; Yu, W. Film bulk acoustic formaldehyde sensor with polyethyleneimine-modified single-wall carbon nanotubes as sensitive layer. Sens. Actuators B 2018, 266, 204–212. [Google Scholar] [CrossRef]
- Wingqvist, G.; Bjurstroöm, J.; Liljeholm, L.; Yantchev, V.; Katardjiev, I. Shear mode AlN thin film electro-acoustic resonant sensor operation in viscous media. Sens. Actuators B 2007, 123, 466–473. [Google Scholar] [CrossRef]
- Chen, D.; Wang, J. Lateral field excited film bulk acoustic resonator for detection of protein–ligand interactions. Electron. Lett. 2012, 48, 1178–1179. [Google Scholar] [CrossRef]
- Chen, D.; Wang, J.; Xu, Y.; Li, D. A pure shear mode ZnO film resonator for the detection of organophosphorous pesticides. Sens. Actuators B 2012, 171, 1081–1086. [Google Scholar] [CrossRef]
- Keiji Kanazawa, K.; Gordon Ii, J.G. The oscillation frequency of a quartz resonator in contact with liquid. Anal. Chim. Acta 1985, 175, 99–105. [Google Scholar] [CrossRef]
- Wang, J.; Chen, D.; Gan, Y.; Sun, X.; Jin, Y. High sensitive self-assembled monolayer modified solid mounted resonator for organophosphate vapor detection. Appl. Surf. Sci. 2011, 257, 4365–4369. [Google Scholar] [CrossRef]
- Weber, J.; Albers, W.M.; Tuppurainen, J.; Link, M.; Gabl, R.; Wersing, W.; Schreiter, M. Shear mode FBARs as highly sensitive liquid biosensors. Sens. Actuators A 2006, 128, 84–88. [Google Scholar] [CrossRef]
- Nirschl, M.; Rantala, A.; Tukkiniemi, K.; Auer, S.; Hellgren, A.C.; Pitzer, D.; Schreiter, M.; Vikholm-Lundin, I. CMOS-integrated film bulk acoustic resonators for label-free biosensing. Sensors 2010, 10, 4180–4193. [Google Scholar] [CrossRef] [PubMed] [Green Version]
- Wingqvist, G.; Bjurstroöm, J.; Hellgren, A.C.; Katardjiev, I. Immunosensor utilizing a shear mode thin film bulk acoustic sensor. Sens. Actuators B 2007, 127, 248–252. [Google Scholar] [CrossRef]
- Chen, D.; Wang, J.; Xu, Y.; Li, D.; Zhang, L.; Li, Z. Highly sensitive detection of organophosphorus pesticides by acetylcholinesterase-coated thin film bulk acoustic resonator mass-loading sensor. Biosens. Bioelectron. 2013, 41, 163–167. [Google Scholar] [CrossRef] [PubMed]
- Xu, W.C.; Appel, J.; Chae, J. Real-Time Monitoring of Whole Blood Coagulation Using a Microfabricated Contour-Mode Film Bulk Acoustic Resonator. J. Microelectromech. Syst. 2012, 21, 302–307. [Google Scholar] [CrossRef]
- Qin, L.; Chen, Q.; Cheng, H.; Chen, Q.; Li, J.-F.; Wang, Q.-M. Viscosity sensor using ZnO and AlN thin film bulk acoustic resonators with tilted polar c-axis orientations. J. Appl. Phys. 2011, 110, 094511. [Google Scholar] [CrossRef]
- Chen, D.; Zhang, Z.; Ma, J.; Wang, W. ZnO Film Bulk Acoustic Resonator for the Kinetics Study of Human Blood Coagulation. Sensors 2017, 17, 1015. [Google Scholar]
- Chen, D.; Wang, J.; Wang, P.; Guo, Q.; Zhang, Z.; Ma, J. Real-time monitoring of human blood clotting using a lateral excited film bulk acoustic resonator. J. Micromech. Microeng. 2017, 27, 045013. [Google Scholar] [CrossRef]
- Chen, D.; Song, S.; Ma, J.; Zhang, Z.; Wang, P.; Liu, W.; Guo, Q. Micro-electromechanical film bulk acoustic sensor for plasma and whole blood coagulation monitoring. Biosens. Bioelectron. 2017, 91, 465–471. [Google Scholar] [CrossRef] [PubMed]
- Katardjiev, I.; Yantchev, V. Recent developments in thin film electro-acoustic technology for biosensor applications. Vacuum 2012, 86, 520–531. [Google Scholar] [CrossRef]
- Link, M.; Weber, J.; Schreiter, M.; Wersing, W.; Elmazria, O.; Alnot, P. Sensing characteristics of high-frequency shear mode resonators in glycerol solutions. Sens. Actuators B 2007, 121, 372–378. [Google Scholar] [CrossRef]
- Song, S.; Chen, D.; Hongfei, W.; Guo, Q.; Yu, W. Shear Mode Bulk Acoustic Viscosity Sensor for Blood Coagulation Monitoring in Oral Anticoagulant Therapy. J. Nanosci. Nanotechnol. 2018, 18, 8099–8104. [Google Scholar] [CrossRef] [PubMed]
- Lin, C.M.; Lien, W.C.; Felmetsger, V.V.; Hopcroft, M.A.; Senesky, D.G.; Pisano, A.P. AlN thin films grown on epitaxial 3C-SiC (100) for piezoelectric resonant devices. Appl. Phys. Lett. 2010, 97, 141907. [Google Scholar] [CrossRef]
- Link, M.; Schreiter, M.; Weber, J.; Gabl, R.; Pitzer, D.; Primig, R.; Wersing, W.; Assouar, M.B.; Elmazria, O. C-axis inclined ZnO films for shear-wave transducers deposited by reactive sputtering using an additional blind. J. Vac. Sci. Technol. A 2006, 24, 218–222. [Google Scholar] [CrossRef]
- Hussain, M.; Northoff, H.; Gehring, F.K. QCM-D providing new horizon in the domain of sensitivity range and information for haemostasis of human plasma. Biosens. Bioelectron. 2015, 66, 579–584. [Google Scholar] [CrossRef] [PubMed]
- Andersson, M.; Andersson, J.; Sellborn, A.; Berglin, M.; Nilsson, B.; Elwing, H. Quartz crystal microbalance-with dissipation monitoring (QCM-D) for real time measurements of blood coagulation density and immune complement activation on artificial surfaces. Biosens. Bioelectron. 2005, 21, 79–86. [Google Scholar] [CrossRef] [PubMed]
- Bandey, H.L.; Cernosek, R.W.; Lee, W.E.; Ondrovic, L.E. Blood rheological characterization using the thickness-shear mode resonator. Biosens. Bioelectron. 2004, 19, 1657–1665. [Google Scholar] [CrossRef] [PubMed]
- Piazza, G.; Stephanou, P.J.; Pisano, A.P. Piezoelectric aluminum nitride vibrating contour-mode MEMS resonators. J. Microelectromech. Syst. 2006, 15, 1406–1418. [Google Scholar] [CrossRef]
- Lin, C.M.; Yantchev, V.; Zou, J.; Chen, Y.Y.; Pisano, A.P. Micromachined one-port aluminum nitride lamb wave resonators utilizing the lowest-order symmetric mode. J. Microelectromech. Syst. 2014, 23, 78–91. [Google Scholar] [CrossRef]
- Martin, S.J.; Frye, G.C.; Ricco, A.J.; Senturia, S.D. Effect of surface roughness on the response of thickness-shear mode resonators in liquids. Anal. Chem. 1993, 65, 2910–2922. [Google Scholar] [CrossRef]
- Poller, L.; Keown, M.; Chauhan, N.; van den Besselaar, A.M.H.P.; Tripodi, A.; Shiach, C.; Jespersen, J. European Concerted Action on Anticoagulation. A multicentre calibration study of WHO international reference preparations for thromboplastin, rabbit (RBT/90) and human (rTF/95). J. Clin. Pathol. 2005, 58, 667–669. [Google Scholar] [CrossRef] [PubMed] [Green Version]
- Cakmak, O.; Ermek, E.; Kilinc, N.; Bulut, S.; Baris, I.; Kavakli, I.H.; Yaralioglu, G.G.; Urey, H. A cartridge based sensor array platform for multiple coagulation measurements from plasma. Lab Chip 2015, 15, 113–120. [Google Scholar] [CrossRef] [PubMed] [Green Version]
- Scarpelini, S.; Rhind, S.G.; Nascimento, B.; Tien, H.; Shek, P.N.; Peng, H.T.; Huang, H.; Pinto, R.; Speers, V.; Reis, M.; et al. Normal range values for thromboelastography in healthy adult volunteers. Braz. J. Med. Biol. Res. 2009, 42, 1210–1217. [Google Scholar] [CrossRef] [PubMed] [Green Version]
- Fritsma, G.A. Hematology: Clinical Principles and Applications; W.B. Saunders Company: Philadelphia, PA, USA, 2002. [Google Scholar]
- Houdijk, W.P.M.; Van Den Besselaar, A.M.H.P. International multicenter international sensitivity index (ISI) calibration of a new human tissue factor thromboplastin reagent derived from cultured human cells. J. Thromb. Haemost. 2004, 2, 266–270. [Google Scholar] [CrossRef] [PubMed] [Green Version]


| Electrode Geometry | Crystal Orientation | Field Intensity (V/m) * | Electromechanical Coupling | Mean Allan Deviation |
|---|---|---|---|---|
| Coplanar(lateral excited) | Normal c-axis | 1.73 | 0.32% | 5.39 × 10⁻⁸ |
| Sandwiched(thickness excited) | Inclined c-axis | 6.67 | 0.68% | 1.61 × 10⁻⁸ |
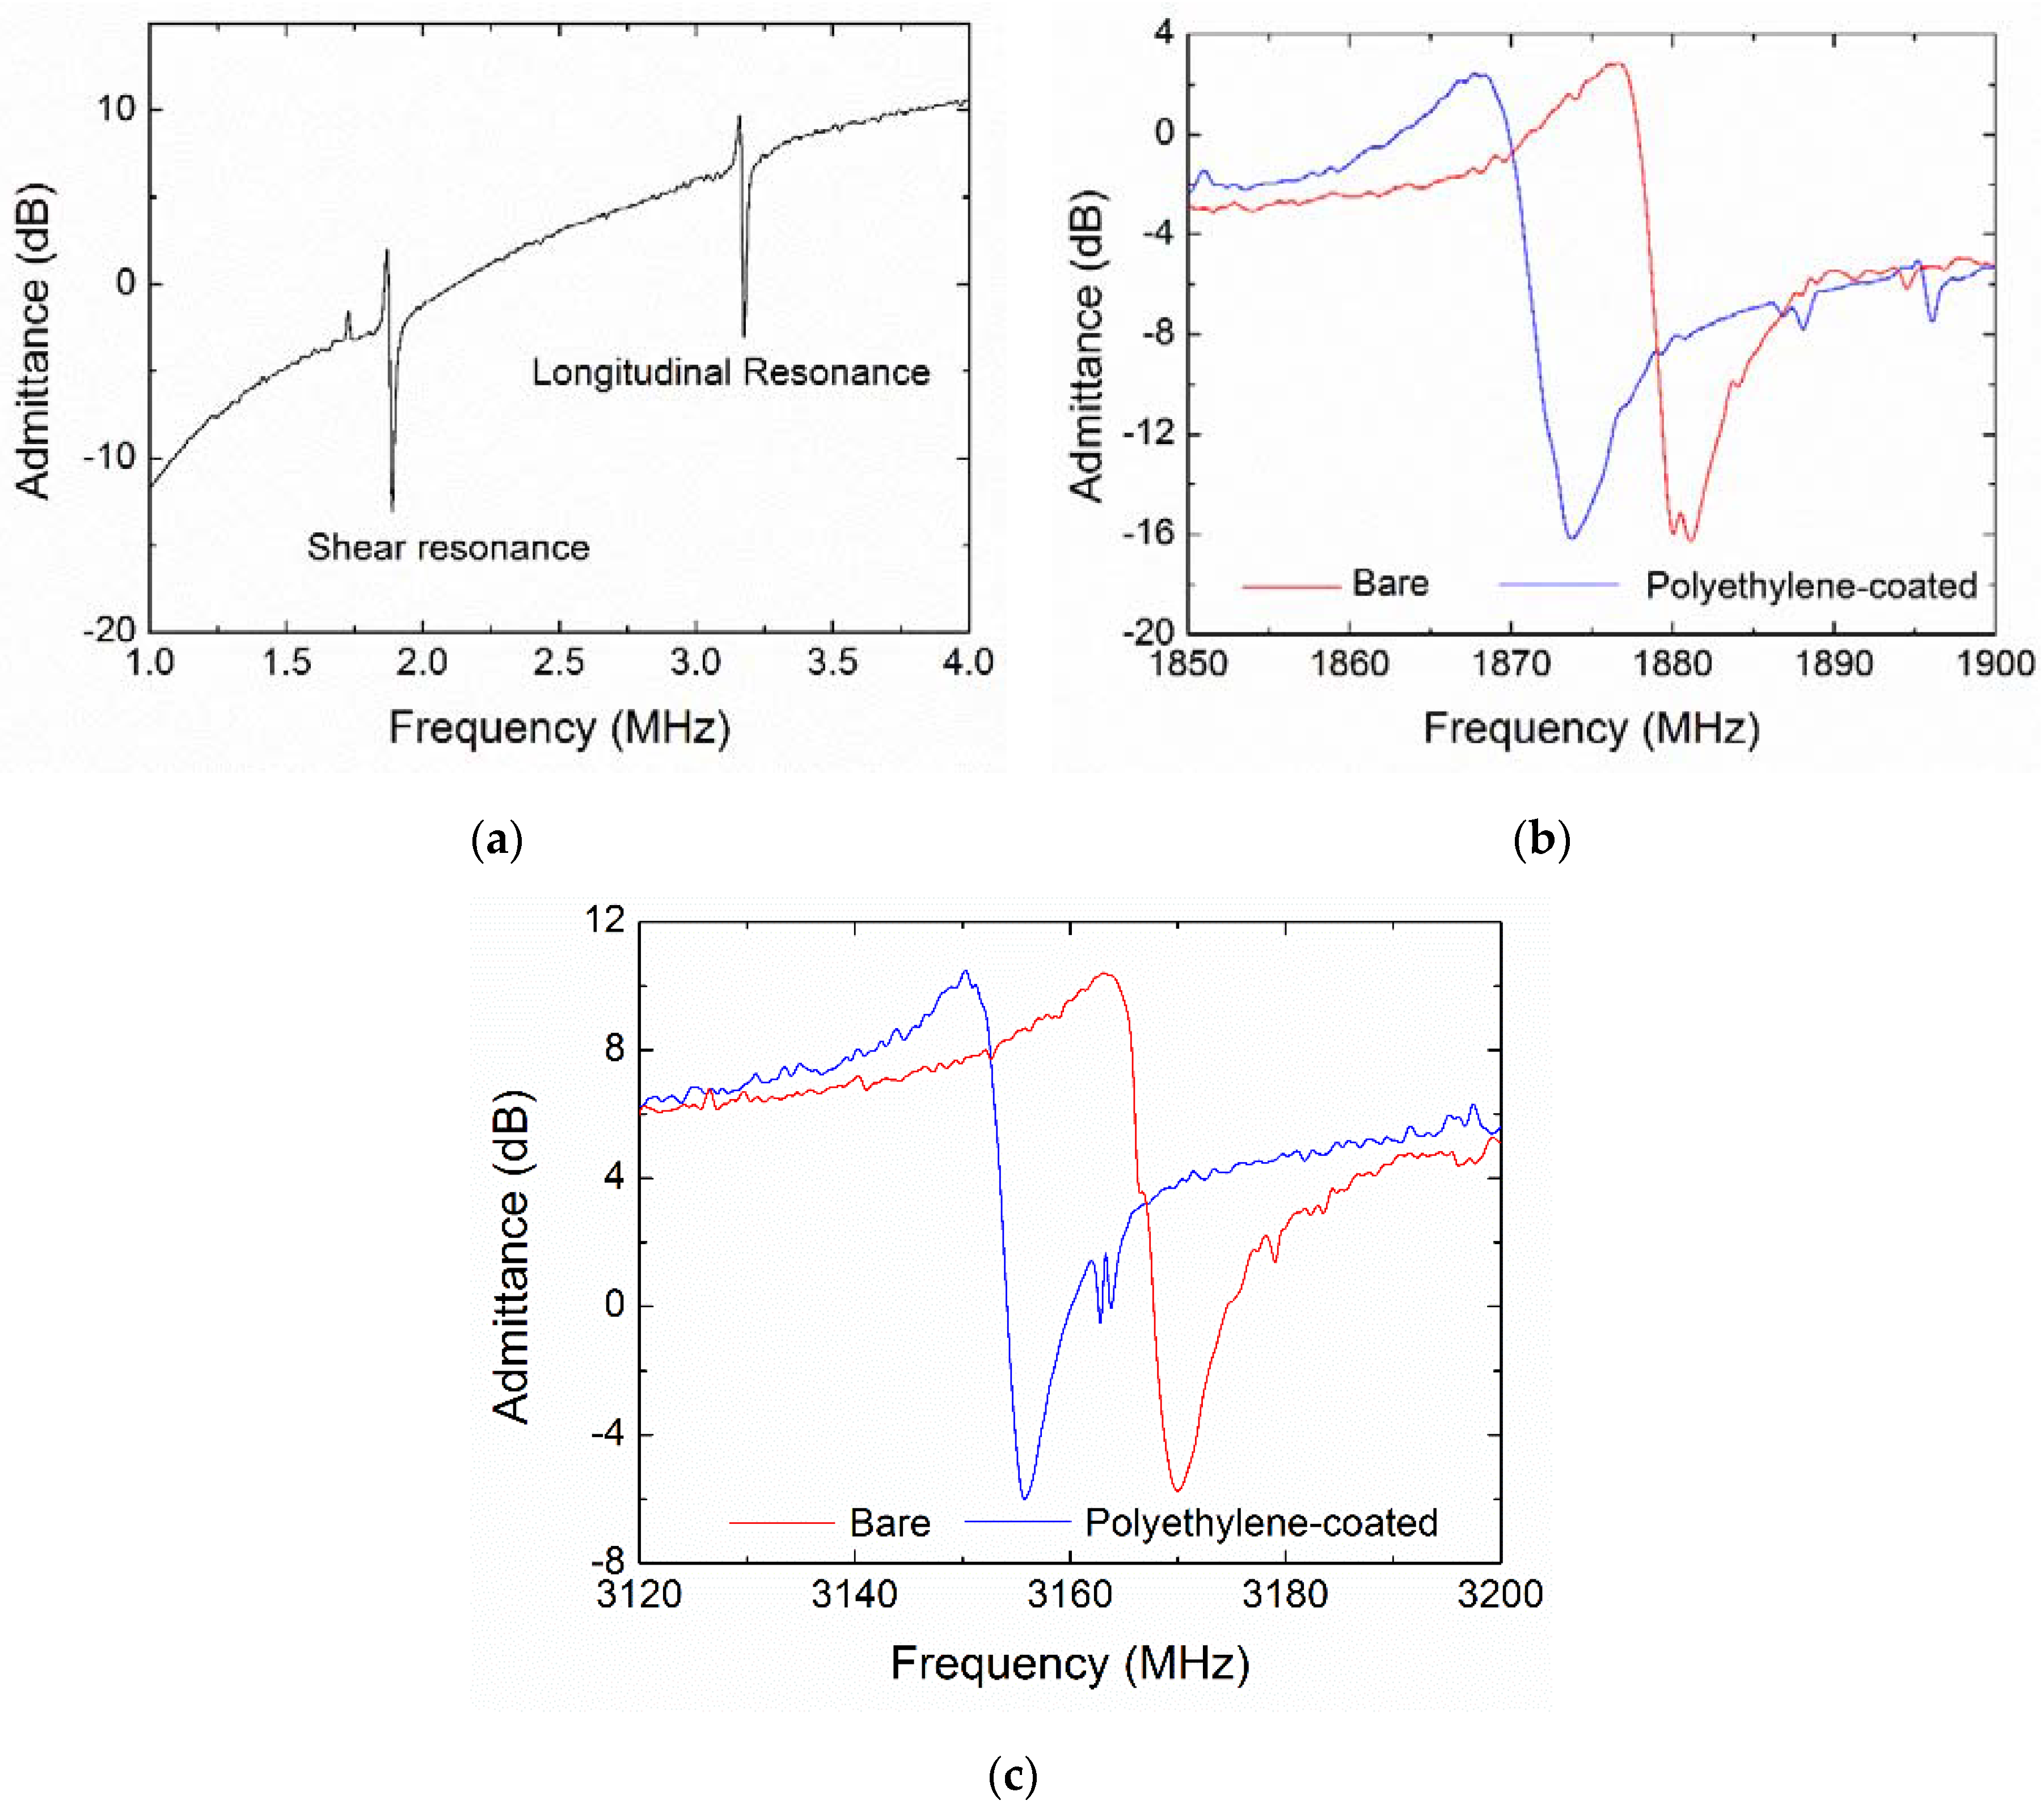
| Resonant Frequency (MHz) | Q Factor | |||
|---|---|---|---|---|
| Bare | Polyethylene-Coated | Bare | Polyethylene-Coated | |
| Shear mode | 1876.4 | 1868.3 | 276 | 263 |
| Longitudinal mode | 3163.3 | 3150.4 | 169 | 176 |
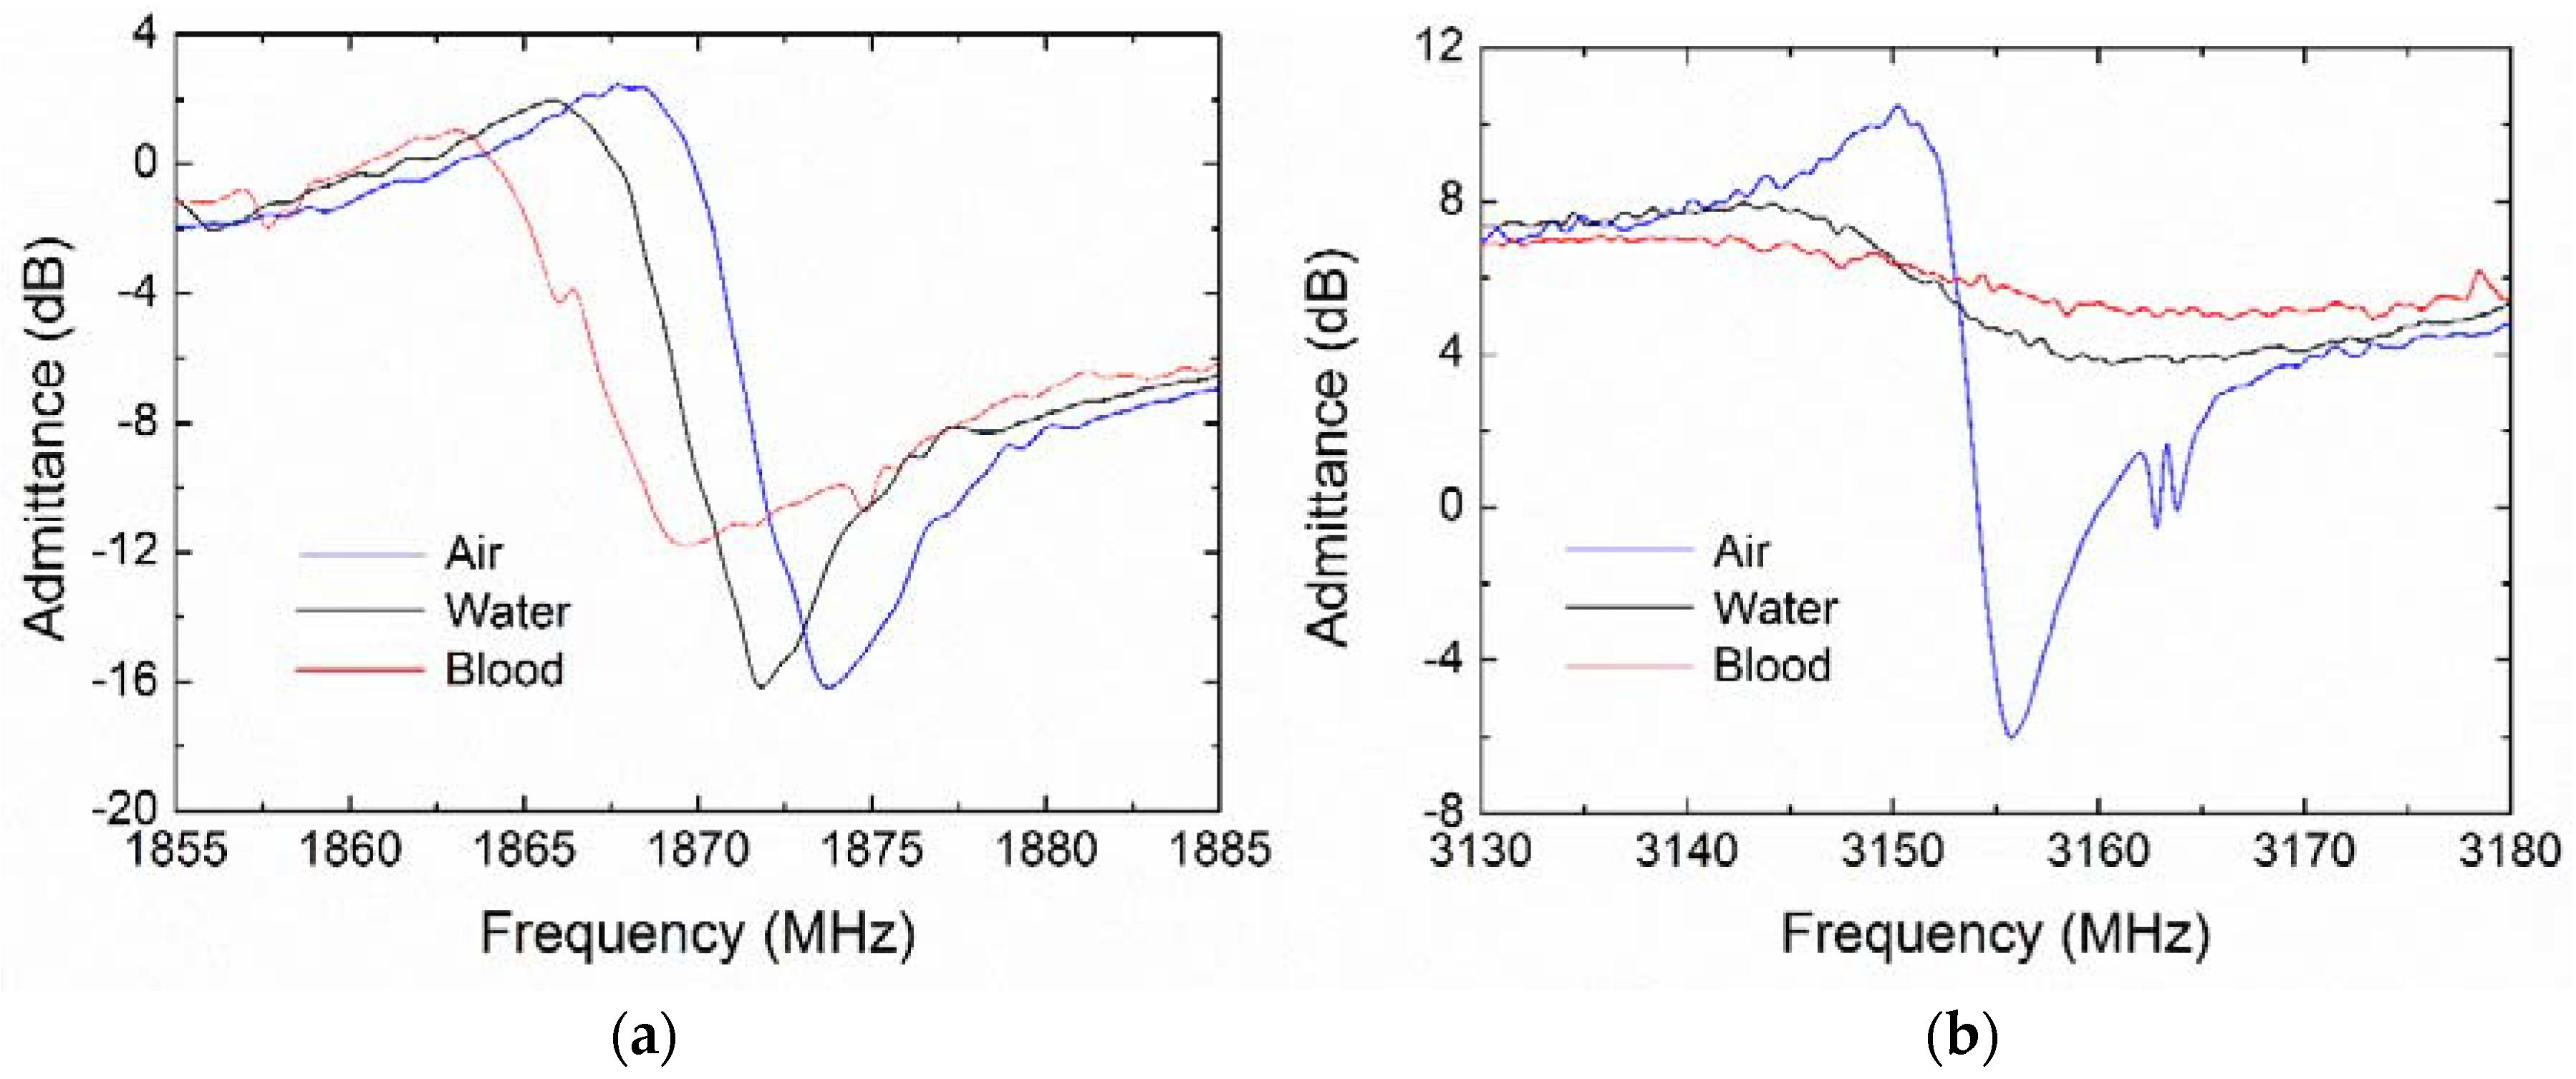
| Resonant Frequency (MHz) | Q Factor | |||||
|---|---|---|---|---|---|---|
| Air | Water | Blood | Air | Water | Blood | |
| Shear mode | 1868.3 | 1865.4 | 1863.1 | 263 | 203 | 129 |
| Longitudinal mode | 3150.4 | 3134.2 | -- | 176 | 21 | -- |
© 2018 by the authors. Licensee MDPI, Basel, Switzerland. This article is an open access article distributed under the terms and conditions of the Creative Commons Attribution (CC BY) license (http://creativecommons.org/licenses/by/4.0/).
Share and Cite
Song, S.; Chen, D.; Wang, H.; Li, C.; Wang, W.; Yu, W.; Wang, Y.; Guo, Q. Shear Mode Bulk Acoustic Resonator Based on Inclined c-Axis AlN Film for Monitoring of Human Hemostatic Parameters. Micromachines 2018, 9, 501. https://doi.org/10.3390/mi9100501
Song S, Chen D, Wang H, Li C, Wang W, Yu W, Wang Y, Guo Q. Shear Mode Bulk Acoustic Resonator Based on Inclined c-Axis AlN Film for Monitoring of Human Hemostatic Parameters. Micromachines. 2018; 9(10):501. https://doi.org/10.3390/mi9100501
Chicago/Turabian StyleSong, Shuren, Da Chen, Hongfei Wang, Chaohui Li, Wei Wang, Wangli Yu, Yanyan Wang, and Qiuquan Guo. 2018. "Shear Mode Bulk Acoustic Resonator Based on Inclined c-Axis AlN Film for Monitoring of Human Hemostatic Parameters" Micromachines 9, no. 10: 501. https://doi.org/10.3390/mi9100501