
Multiple Silicon Nanowires with Enzymatic Modification for Measuring Glucose Concentration

Abstract
:1. Introduction
2. Fabrication and Characteristic of the Proposed Sensor
2.1. Fabrication Procedure of the Proposed Sensor
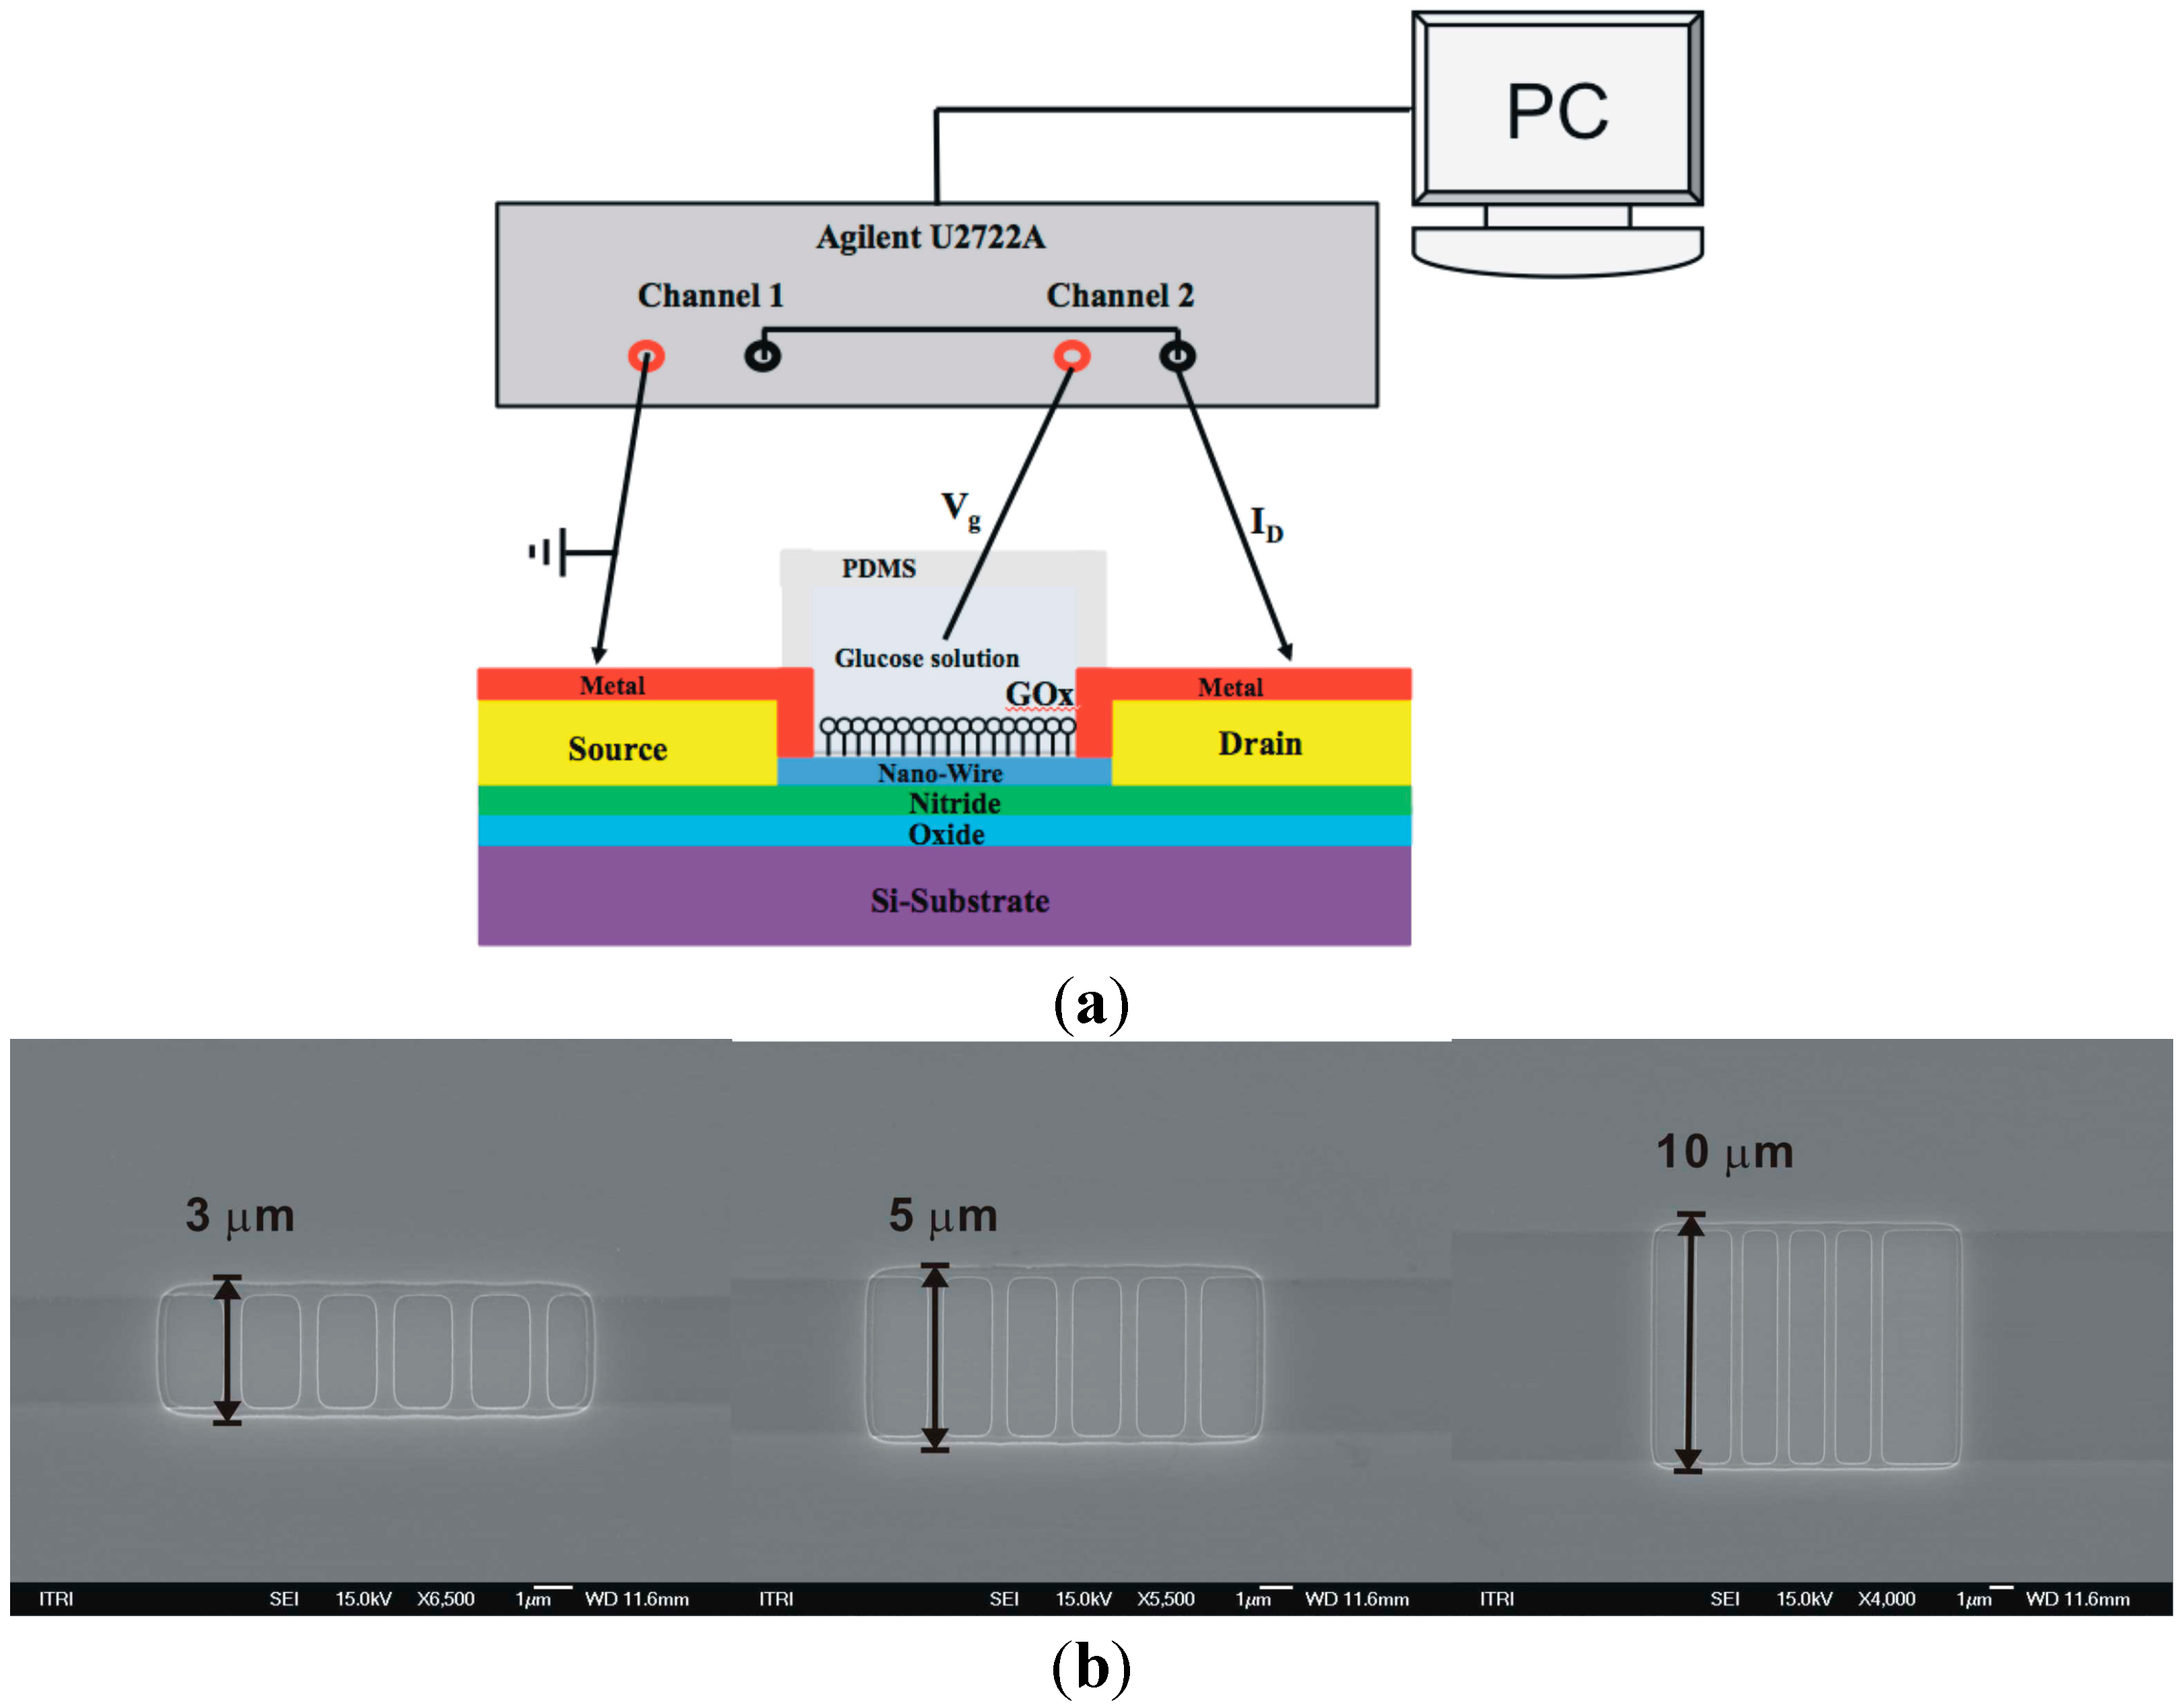
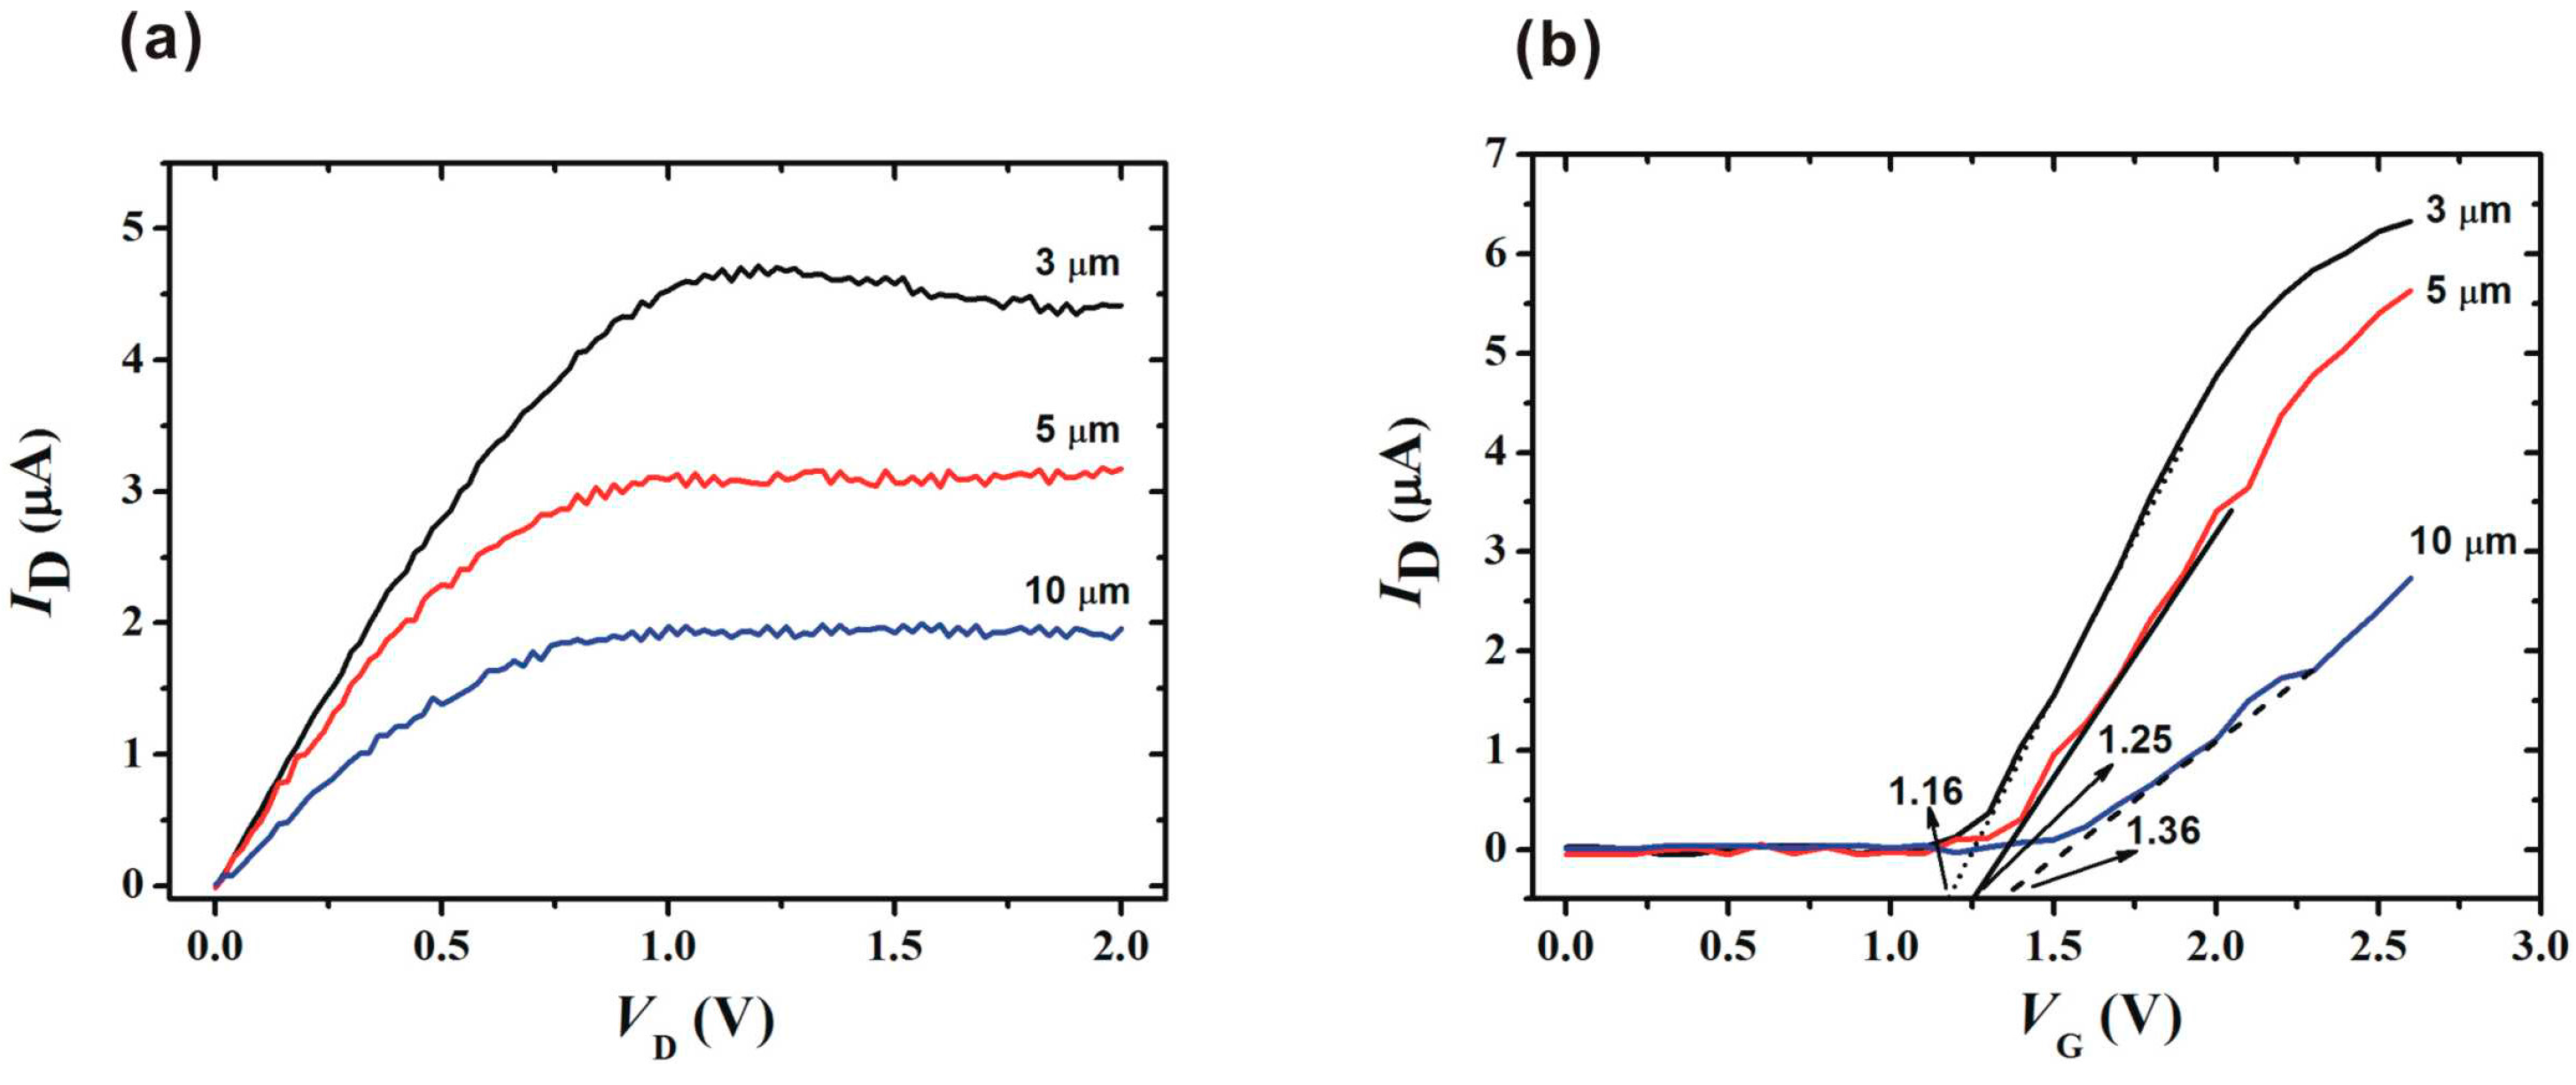
2.2. Characteristic of the Proposed Sensor

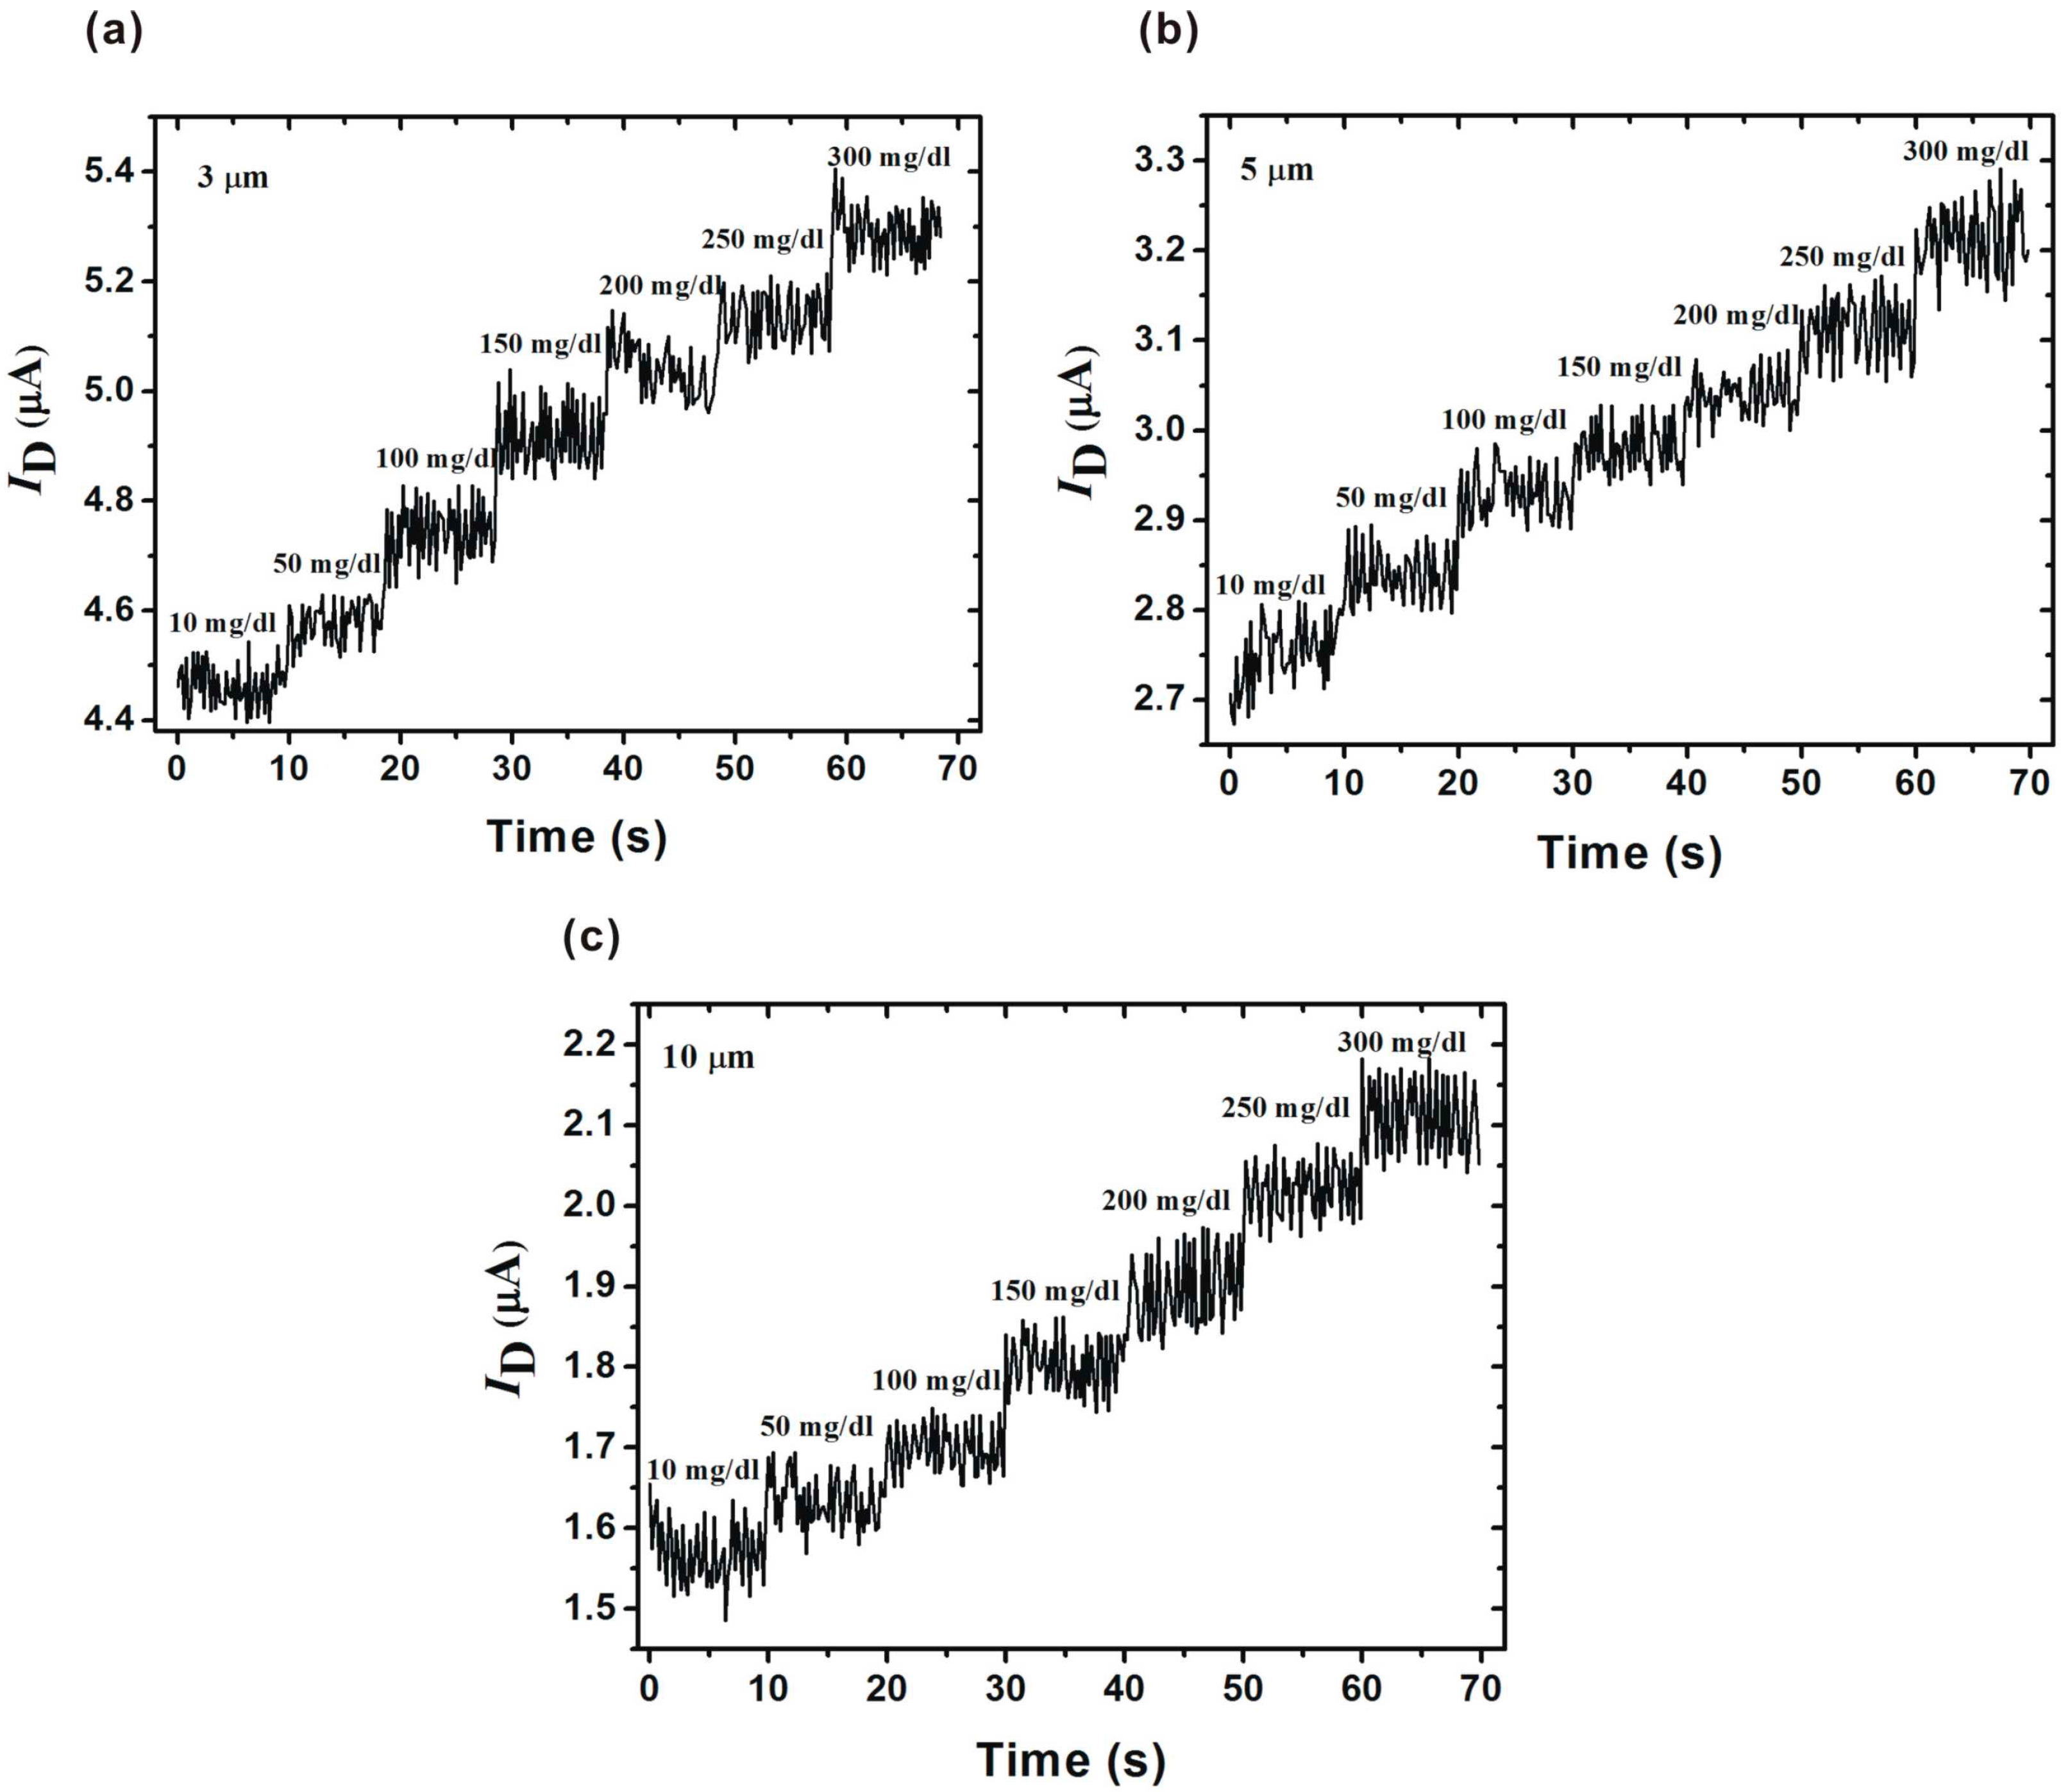
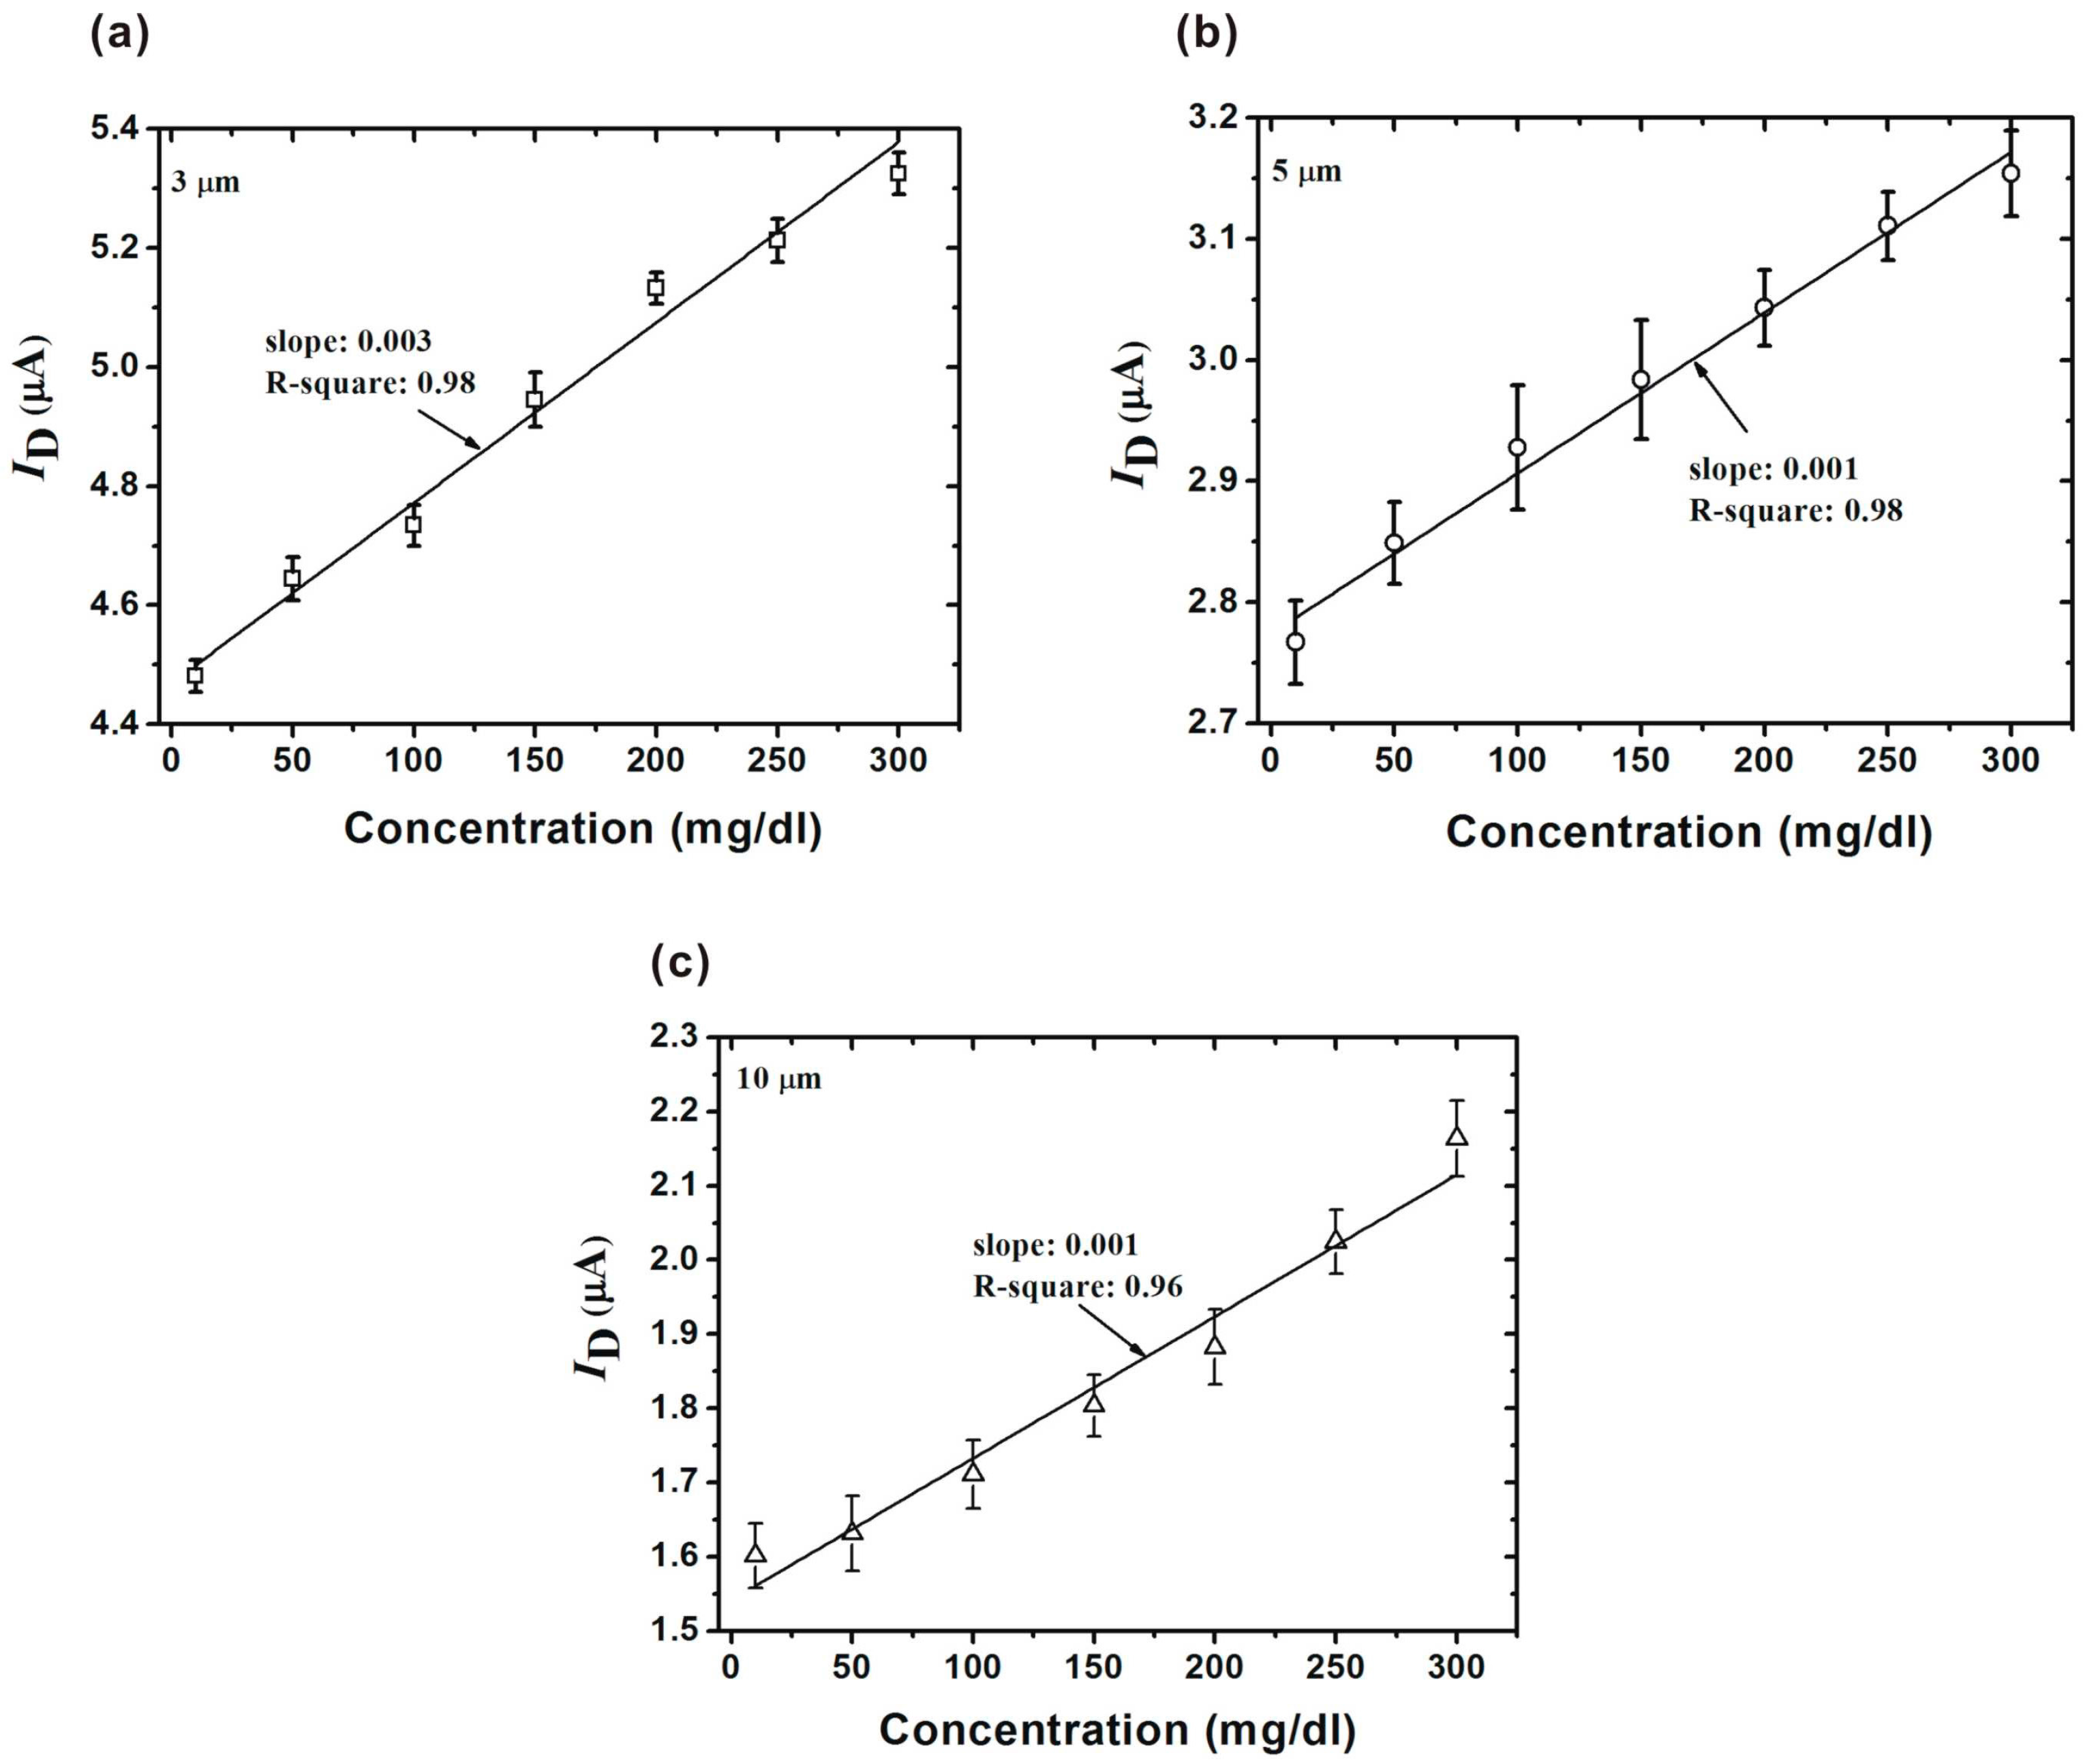
3. Results and Discussion


| Length (µm) | Vth (V) | Sensitivity (s) (µA/(mg/dL)) | Resolution (mg/dL) | |
|---|---|---|---|---|
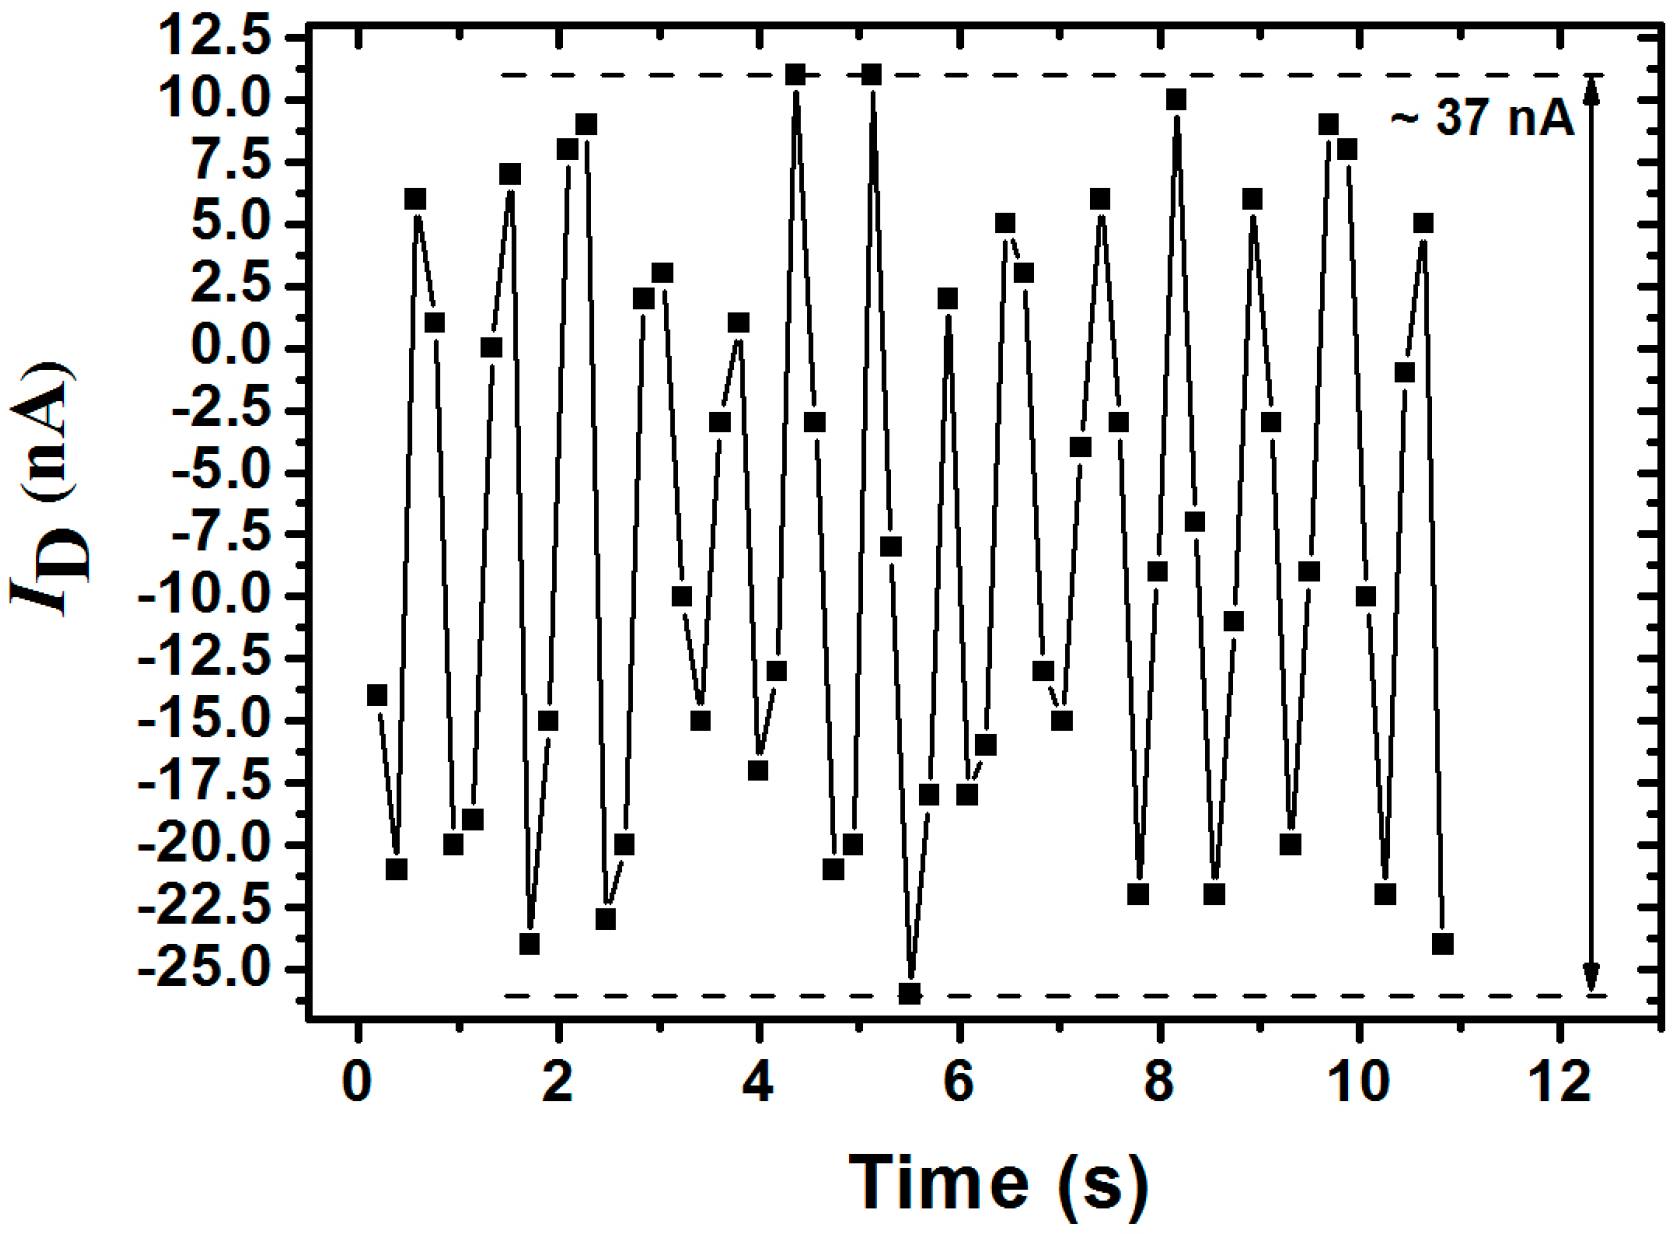
| Theoretical (∆I = 0.1 nA) | Real (∆I = 37 nA) | |||
| 3 | 1.16 | 0.03 | 0.003 | 1.23 |
| 5 | 1.25 | 0.01 | 0.01 | 3.7 |
| 10 | 1.36 | 0.01 | 0.01 | 3.7 |
4. Conclusions
Acknowledgments
Author Contributions
Conflicts of Interest
References
- National Diabetes Statistics Report, 2014 Edition. Available online: http:www.cdc.gov/diabetes/pubs/statsreport14/national-diabetes-report-web.pdf (accessed on 3 July 2015).
- IDF Diabetes Atlas, 6th Edition. Available online: http://www.idf.org/sites/default/files/EN_6E_Atlas_Full_0.pdf (accessed on 13 August 2015).
- Chen, K.I.; Li, B.R.; Chen, Y.T. Silicon nanowire field-effect transistor-based biosensors for biomedical diagnosis and cellular recording investigation. Nano Today 2011, 6, 131–154. [Google Scholar] [CrossRef]
- Rahman, M.M.; Ahammad, A.J.S.; Jin, J.H.; Ahn, S.J.; Lee, J.J. A comprehensive review of glucose biosensors based on nanostructured metal-oxides. Sensors 2010, 10, 4855–4886. [Google Scholar] [CrossRef] [PubMed]
- Yang, C.L.; Zhang, X.H.; Lan, G.; Chen, L.Y.; Chen, M.W.; Zeng, Y.Q.; Jiang, J.Q. Pd-based nanoporous metals for enzyme-free electrochemical glucose sensors. Chin. Chem. Lett. 2014, 25, 496–500. [Google Scholar] [CrossRef]
- Su, S.; Wei, X.; Guo, Y.; Zhong, Y.; Su, Y.; Huang, Q.; Fan, C.; He, Y. A silicon nanowire-based electrochemical sensor with high sensitivity and electrocatalytic activity. Part. Part. Syst. Charact. 2013, 30, 326–331. [Google Scholar] [CrossRef]
- Zang, J.; Li, C.M.; Cui, X.; Wang, J.; Sun, X.; Dong, H.; Sum, C.Q. Tailoring zinc oxide nanowires for high performance amperometric glucose sensor. Electroanalysis 2007, 19, 1008–1014. [Google Scholar] [CrossRef]
- Sze, S.M.; Lee, M.K. Semiconductor Devices Physics and Technology, 3rd ed.; John Wiley & Sons: Hoboken, NJ, USA, 2013. [Google Scholar]
- Elfstrom, N.; Juhasz, R.; Sychugov, I.; Engfeldt, T.; Karlstrom, A.E.; Linnros, J. Surface charge sensitivity of silicon nanowires: size dependence. Nano. Lett. 2007, 7, 2608. [Google Scholar] [CrossRef] [PubMed]
- Hsu, C.C.; Yang, C.Y.; Lai, C.J.; Dai, C.L. Optimization of reusable polysilicon nanowire sensor for salt concentration measurement. Jpn. J. Appl. Phys. 2014, 53, 06JE04. [Google Scholar] [CrossRef]
- Lin, T.Q.; Lu, Y.L.; Hsu, C.C. Fabrication of glucose fiber sensor based on immobilized GOD technique for rapid measurement. Opt. Express 2010, 18, 27560–27566. [Google Scholar] [CrossRef] [PubMed]
- Rahman, S.F.A.; Yusof, N.A.; Hashim, U.; Nuzaihan Md Nor, M. Design and fabrication of silicon nanowire based sensor. Int. J. Electrochem. Sci. 2013, 8, 10946–10960. [Google Scholar]
- Park, I.; Li, Z.; Pisano, A.P.; Williams, R.S. Towards the silicon nanowire-based sensor for intracellular biochemical detection. Biosens. Bioelectron. 2007, 22, 2065–2070. [Google Scholar] [CrossRef] [PubMed]
© 2015 by the authors; licensee MDPI, Basel, Switzerland. This article is an open access article distributed under the terms and conditions of the Creative Commons Attribution license (http://creativecommons.org/licenses/by/4.0/).
Share and Cite
Hsu, C.-C.; Liao, Y.-C.; Tsai, Y.-T.; Yeh, H.-I.; Wu, C.-C. Multiple Silicon Nanowires with Enzymatic Modification for Measuring Glucose Concentration. Micromachines 2015, 6, 1135-1142. https://doi.org/10.3390/mi6081135
Hsu C-C, Liao Y-C, Tsai Y-T, Yeh H-I, Wu C-C. Multiple Silicon Nanowires with Enzymatic Modification for Measuring Glucose Concentration. Micromachines. 2015; 6(8):1135-1142. https://doi.org/10.3390/mi6081135
Chicago/Turabian StyleHsu, Cheng-Chih, Yu-Ching Liao, Yen-Ting Tsai, Hsin-I Yeh, and Chyan-Chyi Wu. 2015. "Multiple Silicon Nanowires with Enzymatic Modification for Measuring Glucose Concentration" Micromachines 6, no. 8: 1135-1142. https://doi.org/10.3390/mi6081135
APA StyleHsu, C.-C., Liao, Y.-C., Tsai, Y.-T., Yeh, H.-I., & Wu, C.-C. (2015). Multiple Silicon Nanowires with Enzymatic Modification for Measuring Glucose Concentration. Micromachines, 6(8), 1135-1142. https://doi.org/10.3390/mi6081135