1. Introduction
Nanopositioning stages are used for a wide and growing scope of applications at the microscale, such as micromanipulation, MEMS (Micro-Electro-Mechanical-Systems), mini-invasive surgery, biological and biomedical characterization [
1,
2,
3,
4]. Most of these applications require one to control very accurately the relative position and/or trajectories between a sample (for example, component to handle, tissue or living cell) and a tool used for manipulation or characterization purposes. In most cases, this ability directly and strongly impacts the results such as the success rate and resolution of the characterization or analysis [
5].
Because of their capability to generate high-resolution motions, nanopositioning stages are usually used to build the micro-nanopositioning robots. Based on the compliant principle, such stages are designed with active-material-based actuators that are able to generate translation and frictionless motions. The compliant structure is also capable of amplifying the actuators’ movement. Such mechanisms are popular for microscale applications since they prevent from any mechanical drawbacks such as backlash and/or friction usually met in micropositioning stages with ballscrew bearings [
6]. The compliant mechanisms generally generate a small range of motion (smaller than 500 μm) but very high resolution (in the nanometer range), straightness, and flatness [
7,
8,
9,
10], which make nanopositioning stages a key technology for applications requiring a high positioning accuracy. However, despite the widespread use, high potential, and strong efforts done to design and fabricate new nanopositioning stages, several negative specificities still have to be overcome to reach the desired performances:
Actuators have nonlinear and sometimes time-varying behaviors, e.g., hysteresis and creep [
11].
The mechanical structure is influenced by environmental conditions. For example, the thermal expansion of a 5 cm long aluminium bar (typical size of nanopositioning stages) subjected to 1 C change (typical change that may happen in a controlled environment) may reach 1.2 μm which is roughly 1000 times the stage’s resolution.
Sensors integrated (if any) in the stage suffer from extremely complex trade-off because many conditions must be met at the same time, such as small volumes, nanometer resolutions, motion ranges of several hundred micrometers, and high bandwidths. To partially tackle this limitation, integrated sensors usually measure the local motion generated by the actuator in front of the compliant structure or at a location of the compliant structure with a maximum mechanical strain (i.e., in the compliant joints). This indirect measurement technique (meaning that the output motion of the stage is not measured directly) requires a model to estimate the motion of the stage. In spite of using the efficient closed-loop control, the problem of locating accurately the mobile-part output of the stage remains.
In addition to these difficulties, achieving the aforementioned micro-nano tasks usually requires control of the nanopositioning stage and position the end-effector with respect to a fixed reference frame; for instance, to insert a needle into a cell with respect to the microscope frame. On one hand, additional sensors may be used to provide an outer-loop control (the often used inner-loop feedback one is based on internal sensors of the stages) [
12]. However, a key limitation is the complexity of integrating sensors able to measure a relative position with required range, resolution, bandwidth and number of DoF (Degree-of-Freedom) [
13]. For example, dedicated machines used for microsystems fabrication enable to position a component relative to the others in the plane with an accuracy of a few tens of nanometers. Nevertheless, they are usually designed for single purposes and extremely costly (in the millions of euros range). On the other hand, it is possible to control nanopositioning stages in open loop at the task level while keeping the inner loop based on internal nanopositioning stage sensors [
14,
15,
16]. The open loop method can be realized with the calibration approach [
17,
18,
19] where a good and reliable model is required to depict the whole system inclusive of all the influential parameters identified. The second alternative is the one chosen in this paper.
Several works have been made to deal with nanopositioning stages [
20,
21] highlighting the need for using a geometric model combined with a thermal compensation. These works provided interesting results in a short experimental duration and did not studied repeatability and robustness.
Interesting works have also been performed in the machine-tools community where the positioning stages used are mechanical guiding based on the friction principle and ball screw mechanisms [
22,
23,
24,
25,
26,
27]. It was also established that temperature is a key parameter to guarantee a high positioning accuracy. Some studies notably compensated the thermal drift by using thermal models. Nevertheless, the thermal effects are strongly influenced by scale effects. Then even if nominal phenomena (conduction, convection,
etc.) are still the same, their relative influence is not clear at the micro-nano scale [
28,
29]. In addition, at such a tiny scale, influential parameters are quite complex to identify due to several reasons: lack of sensors, difficulty of arranging several sensors at the same time, influence of the sensor (thermal sensors are as big as parts of the system), difficulties of isolating external disturbances, lack of efficient measurement procedures,
etc.
Among the microrobotic community, microrobot calibration has been used notably through deriving a mapping [
30,
31,
32], which was drawn via interpolating a set of taught locations with least squares fitting. Their results showed that an accuracy of 2∼6 μm can be obtained but thermal errors was not considered as a key factor at this scale where other factors are likely more critical.
Meanwhile, the international standard ISO 9283:1998 [
33] provides a methodology and hypothesis to quantify the positioning accuracy of industrial robots. A representative set of poses has to be measured experimentally to provide a statistical analysis. Then, the definition of repeatability and accuracy are notably given. Possible influential parameters have to be kept constant during the experiments, so the values of repeatability and accuracy obtained are for these parameters. This is reasonable because controlled environments may be used for applications requiring a good level of accuracy or for experiments to characterize the robot’s accuracy. Micro and especially nanoscale systems are strongly influenced by temperature. Moreover, it is not possible to keep a system within an environment with temperature controlled well enough during a sufficiently long duration so as to reach nanometer positioning accuracy.
Based on these different works, the objective of this paper is to quantify the positioning accuracy coherent with ISO 9283:1998 taking into account environmental parameters change and to propose solutions for improving the accuracy of translation nanopositioning stages using the robot calibration approach. The contributions of this paper include:
A measurement procedure is proposed in consistent with international practices defined by the standards and adapted to the considered scale. This normalized procedure will make a comparison easier and facilitate measurement analysis.
The positioning accuracy of a nanopositioning stage is qualified using this measurement procedure.
The positioning accuracy is improved based on the calibration approach, i.e., the model-based open loop approach at the task level of the system.
The remainder of this paper is organized as follows.
Section 2 presents the formulation of calibration and proposes two new concepts, namely intrinsic and extrinsic repeatability. Modeling of the geometric error and thermal drift is discussed in
Section 3 where a case study of nanopositioning stages is scoped.
Section 4 presents the results of experimental validations on two calibration models and provides detailed discussions.
Section 5 presents the 2-DoF nanopositioning calibration. Finally, we conclude the paper with
Section 6.
2. Problem Formulation
In ISO 9283:1998, the standardized definitions of repeatability and accuracy are given. However, positioning performances in the literature are usually defined according to different criteria and named in different ways, such as absolute errors, positioning errors, accuracy, MSE (Mean Squared Error) and so on. This makes comparison and reference difficult. Moreover, there is no clear formulation analysis to distinguish between different error components that are induced by different sources. Here, we seek to unify the calculation of nanopositioning performances and express the roles of different components according to the calculation methods of ISO 9283:1998 [
34].
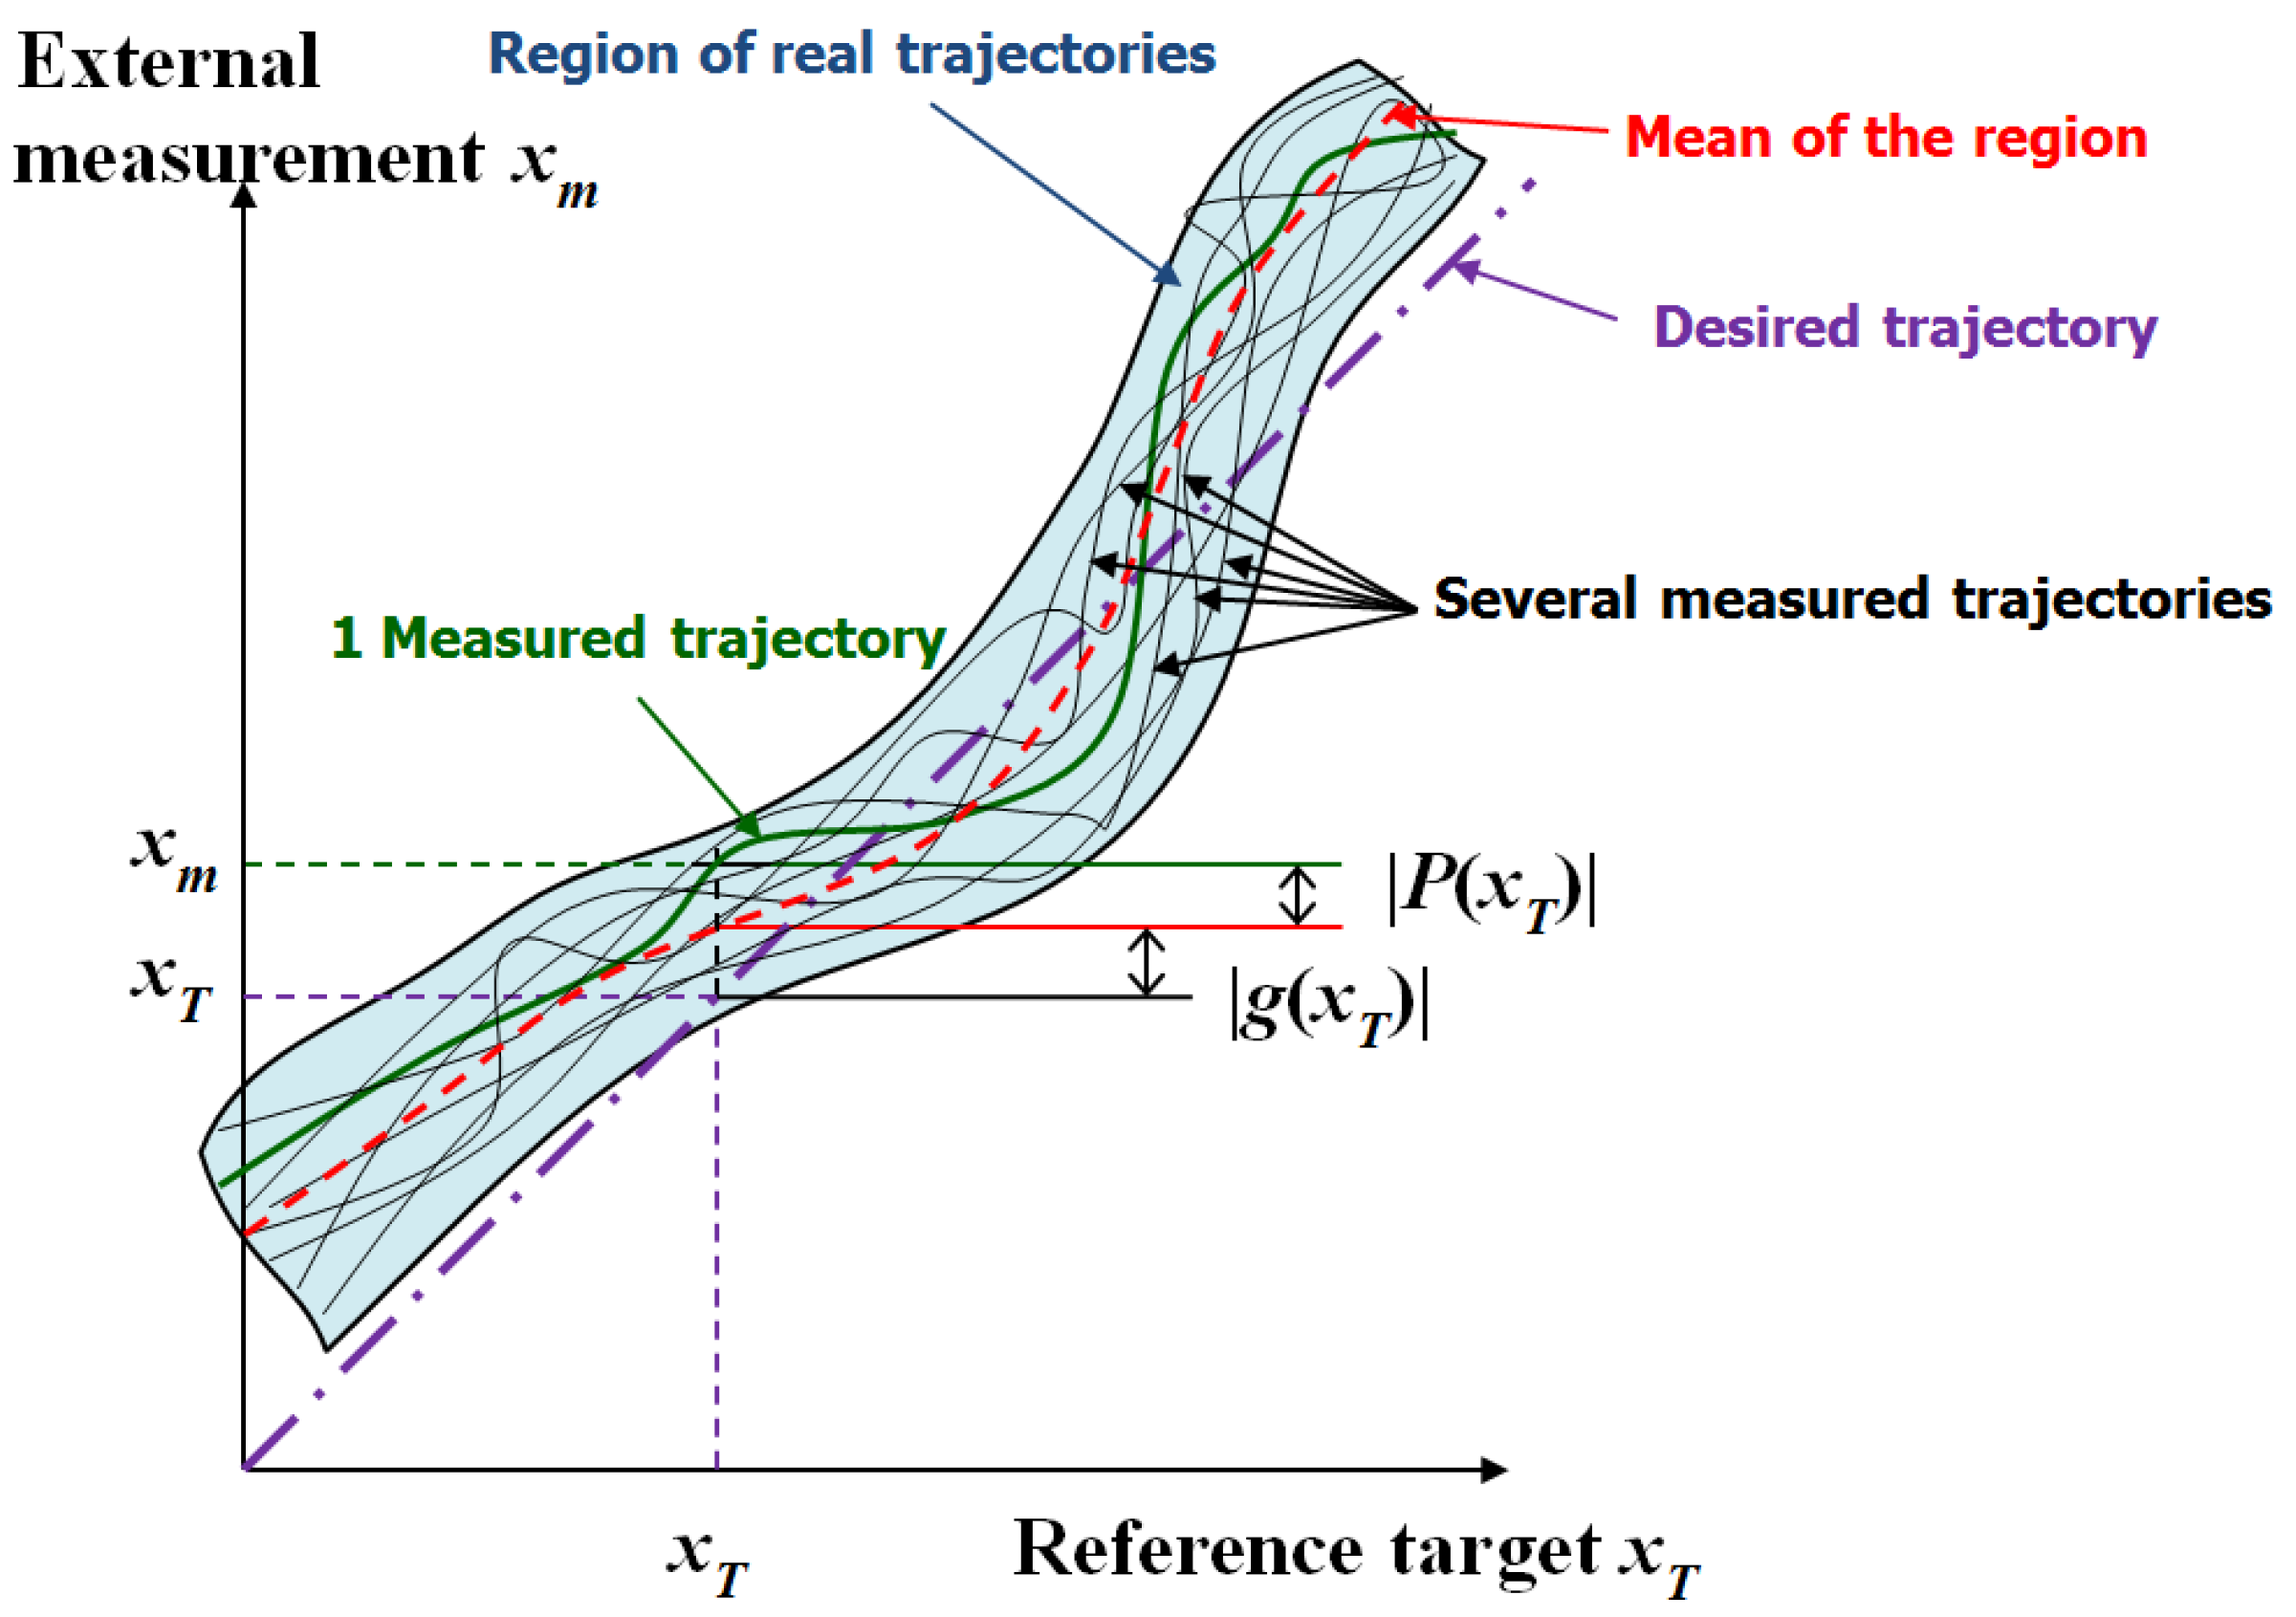
Without loss of generality, the following calculation and analysis will be based on 1-DoF (Degree-of-Freedom) nanopositioning stage which is easy to expand to multi-DoF. Given the target input
, the real position
of the 1-DoF nanopositioning stage is measured by an external sensor and defined by:
where
is the drift induced by environment (we will consider thermal effect) acting on the nanopositioning stage;
is the intrinsic error component inherent in the stage, which results from the control precision of actuator layer which is affected by controller capability and resolution of internal sensor and cannot be compensated by calibration;
is the position-dependent error corresponding to the target input
.
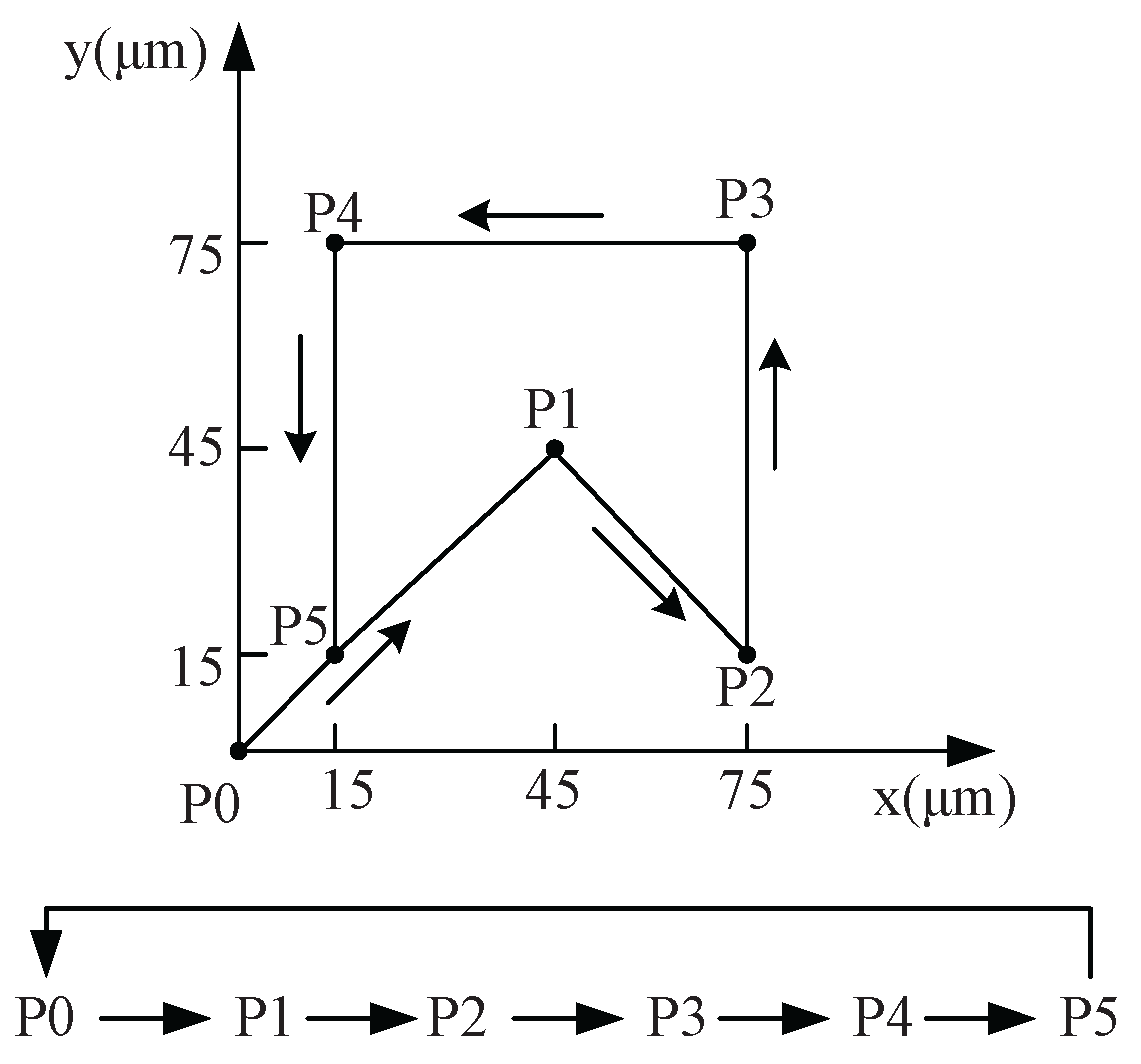
Figure 1 shows the geometric representation of every component of input-output of the 1-DoF nanopositioning stage without thermal drift
.
can be minimized by robot calibration.
can be minimized by design, fabrication and control.
Figure 1.
Geometric representation of every component of input-output of the 1-DoF nanopositioning stage without thermal drift .
Figure 1.
Geometric representation of every component of input-output of the 1-DoF nanopositioning stage without thermal drift .
Given a pose, the accuracy expresses the deviation between the command target
and the mean of a set of measured poses
when reaching the target
n times. The 1D accuracy (
) can be calculated:
The positioning repeatability (
) is expressed as:
with
σ the standard deviation.
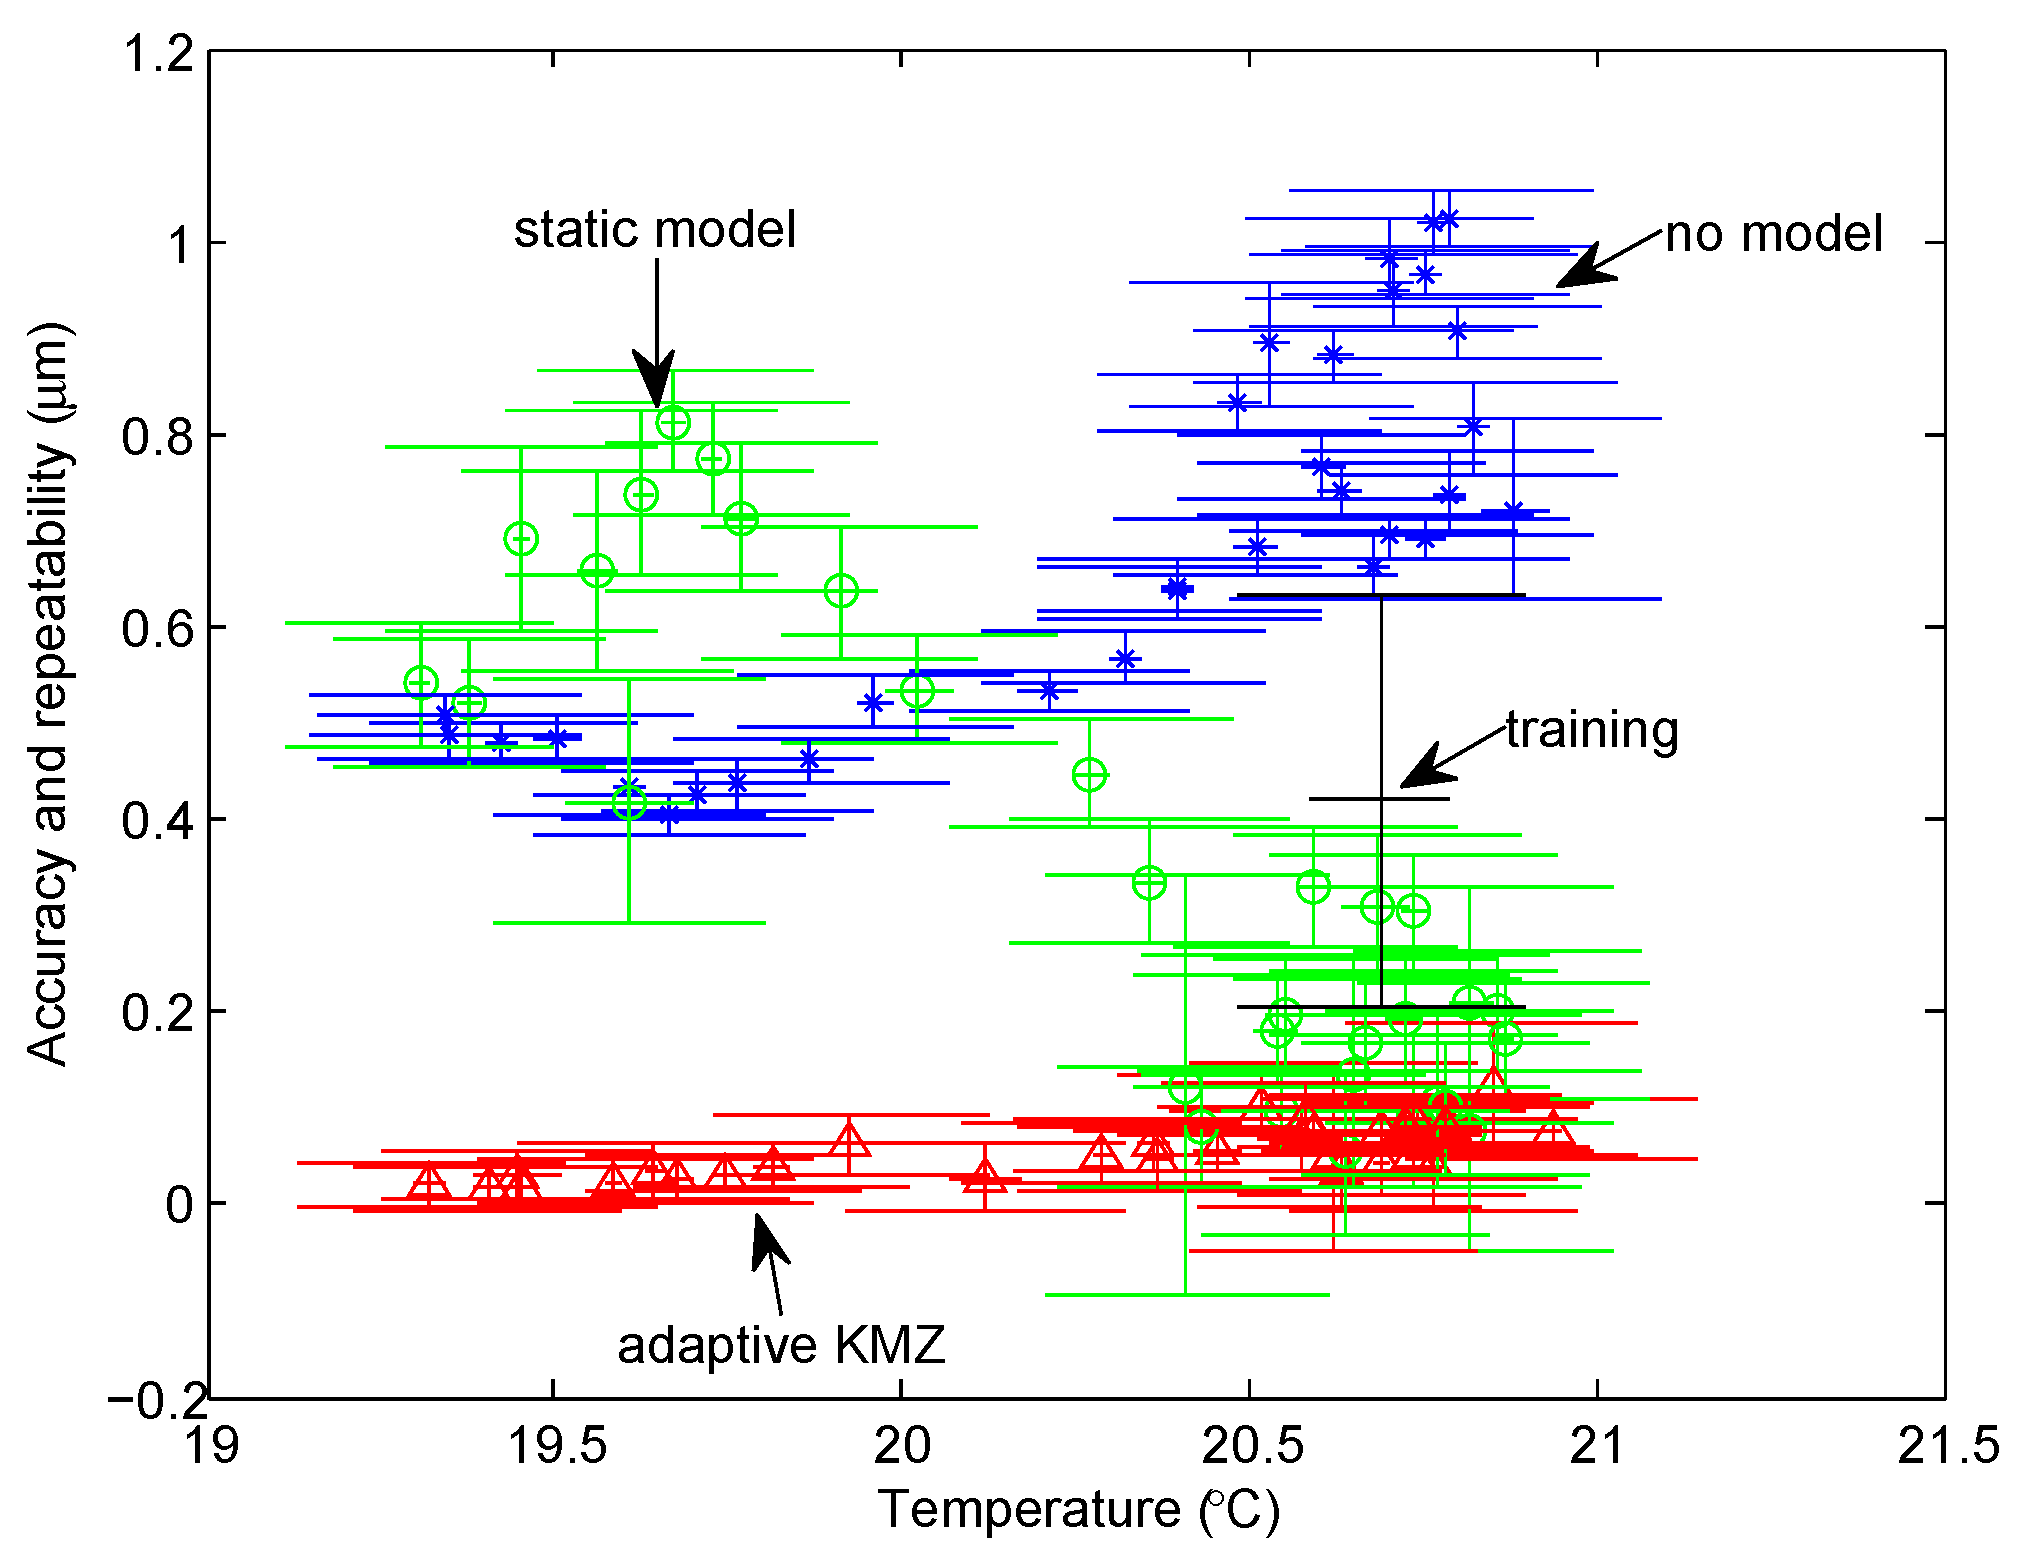
Under external disturbances, the accuracy of the micropositioning stage using calibration is degraded by intrinsic errors and residual errors of imperfect compensation based on the assumption of completely compensating the geometric error; the repeatability is a combination of the intrinsic part and the extrinsic part represented by residual drift.
where subscript “
S” represents the static model and
is the residual thermal errors after thermal compensation. Ideally, it is zero, but due to the imperfection of the thermal compensation,
is usually not equal to zero.
And, the final accuracy and repeatability are determined by the maximum values of the test with
M testing poses:
3. Calibration of 1-DoF Nanopositioning Stage
3.1. Geometric Modeling
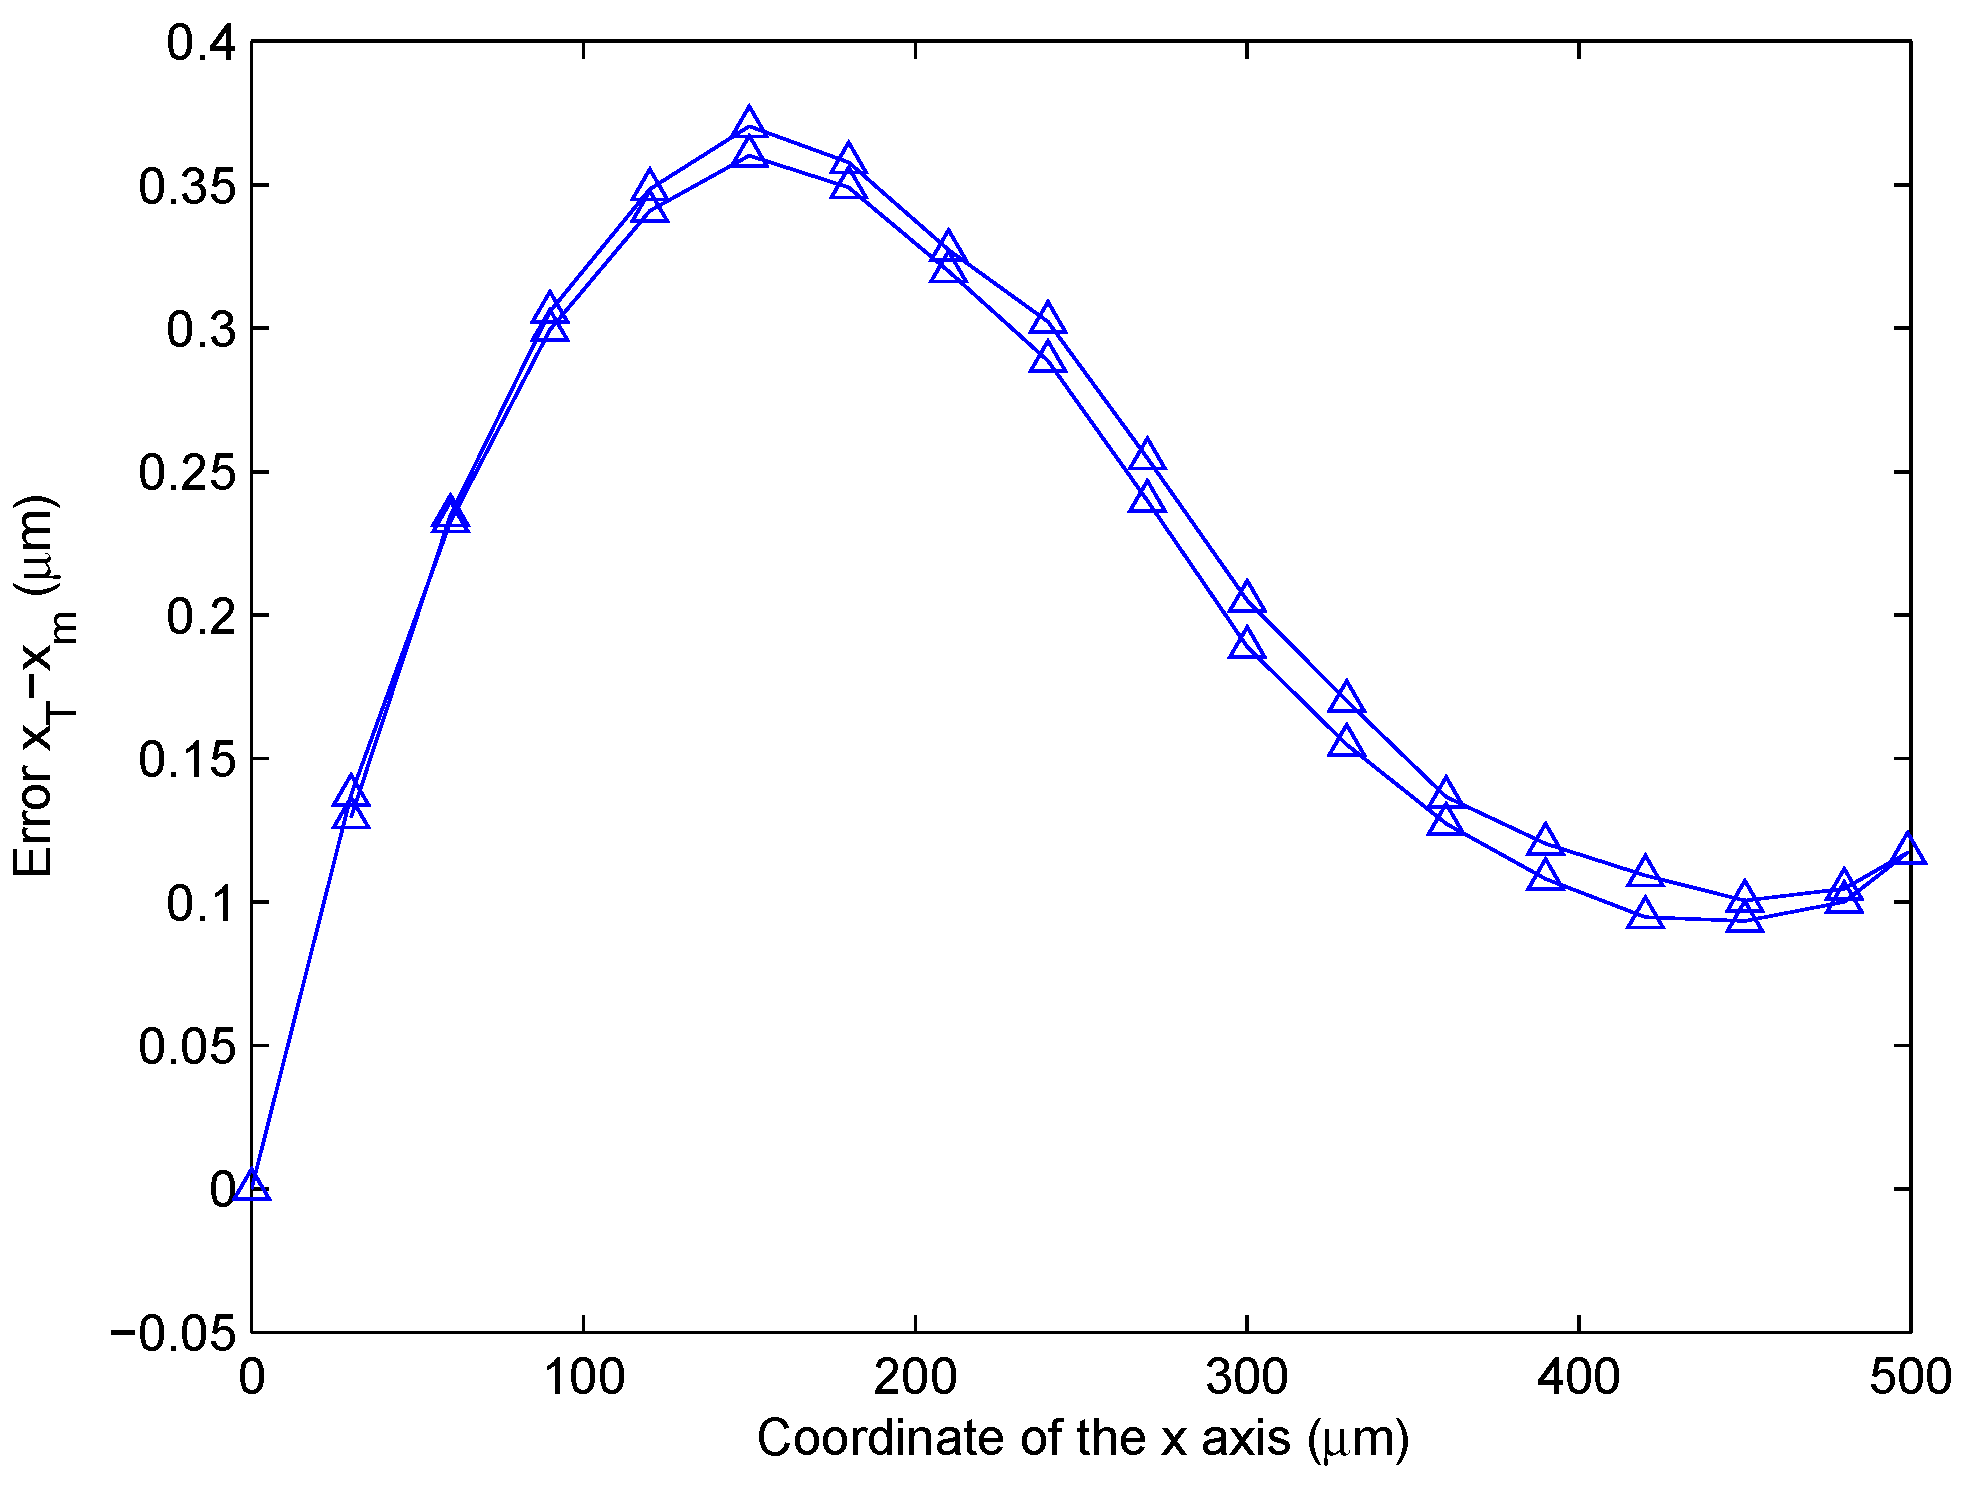
The modeling of nonlinearity errors inherent in the nanopositioning stage is called geometric modeling. To model such errors, a preliminary measurement of the error behavior should be conducted. To do that, the nanopositioning stage is controlled to reach some positions and actual positions are measured by an external sensor (in this case, an interferometer).
Figure 2 shows the measured position-dependent errors of a nanopositioning stage. In this case, the curve of errors is a cubic function (3rd order) with two critical points. It is worth mentioning that positioning errors are significant (up to 400 nm) for nanopositioning purposes, even though the stage is already closed loop controlled at the actuator layer. This error is repeatable and then can be compensated through calibration to reach down to a few tens of nanometers.
Figure 2.
Geometric errors of the nanopositioning stage where is the target, is the measured position along x. The lower curve corresponds to forward motion while the bottom one to the backward.
Figure 2.
Geometric errors of the nanopositioning stage where is the target, is the measured position along x. The lower curve corresponds to forward motion while the bottom one to the backward.
Because of the simple structure of the 1-DoF stage, we can investigate inverse kinematic modeling directly instead of first forward kinematics and then inverse kinematics. The following model is chosen:
where
is the joint input of the robot;
x is the measured position by the external sensor;
are geometric coefficients;
is the order of the geometric model (here,
= 3).
3.2. Thermal-Drift Modeling
There are two main sets of methods for thermal-drift modeling, namely principle-based and empirical-based methods. The heat transfer model of the compact and small-sized system is very complex, which is difficult if is not impossible to establish analytically and specifically for robots. Hence, we used the latter one because of the fact that empirical-based methods are more appropriate for modeling the relation between the temperature variance and part deformation. This paper emphasizes and focuses on quasi-static calibration problems that directly impact the positioning accuracy of the stages. Such a consideration is valid under certain assumptions that are usually normal when operating nanopositioning stages, for example, when manipulation tasks (e.g., assembly and bonding operations) are carried out at equilibrium or at low-speed (quasi-equilibrium) states [
35].
Because the dynamic control is a key issue for applications requiring nanopositioning (for example, scanning probe microscopy), models presented in this paper may also be combined with dynamic control. In this case, the proposed control mode based on calibration approach would act on the positioning accuracy while the internal control loop would act on the transient part. These two control modes would be fully complementary. The closed-loop control of the nanopositioning stage is based on sensory feedback which provides indirect measurements inducing inaccuracies as what
Figure 2 shows. Basically, the thermal drift varies slowly and is mainly related to the mechanical structure.
3.2.1. Thermal-Drift Measurement
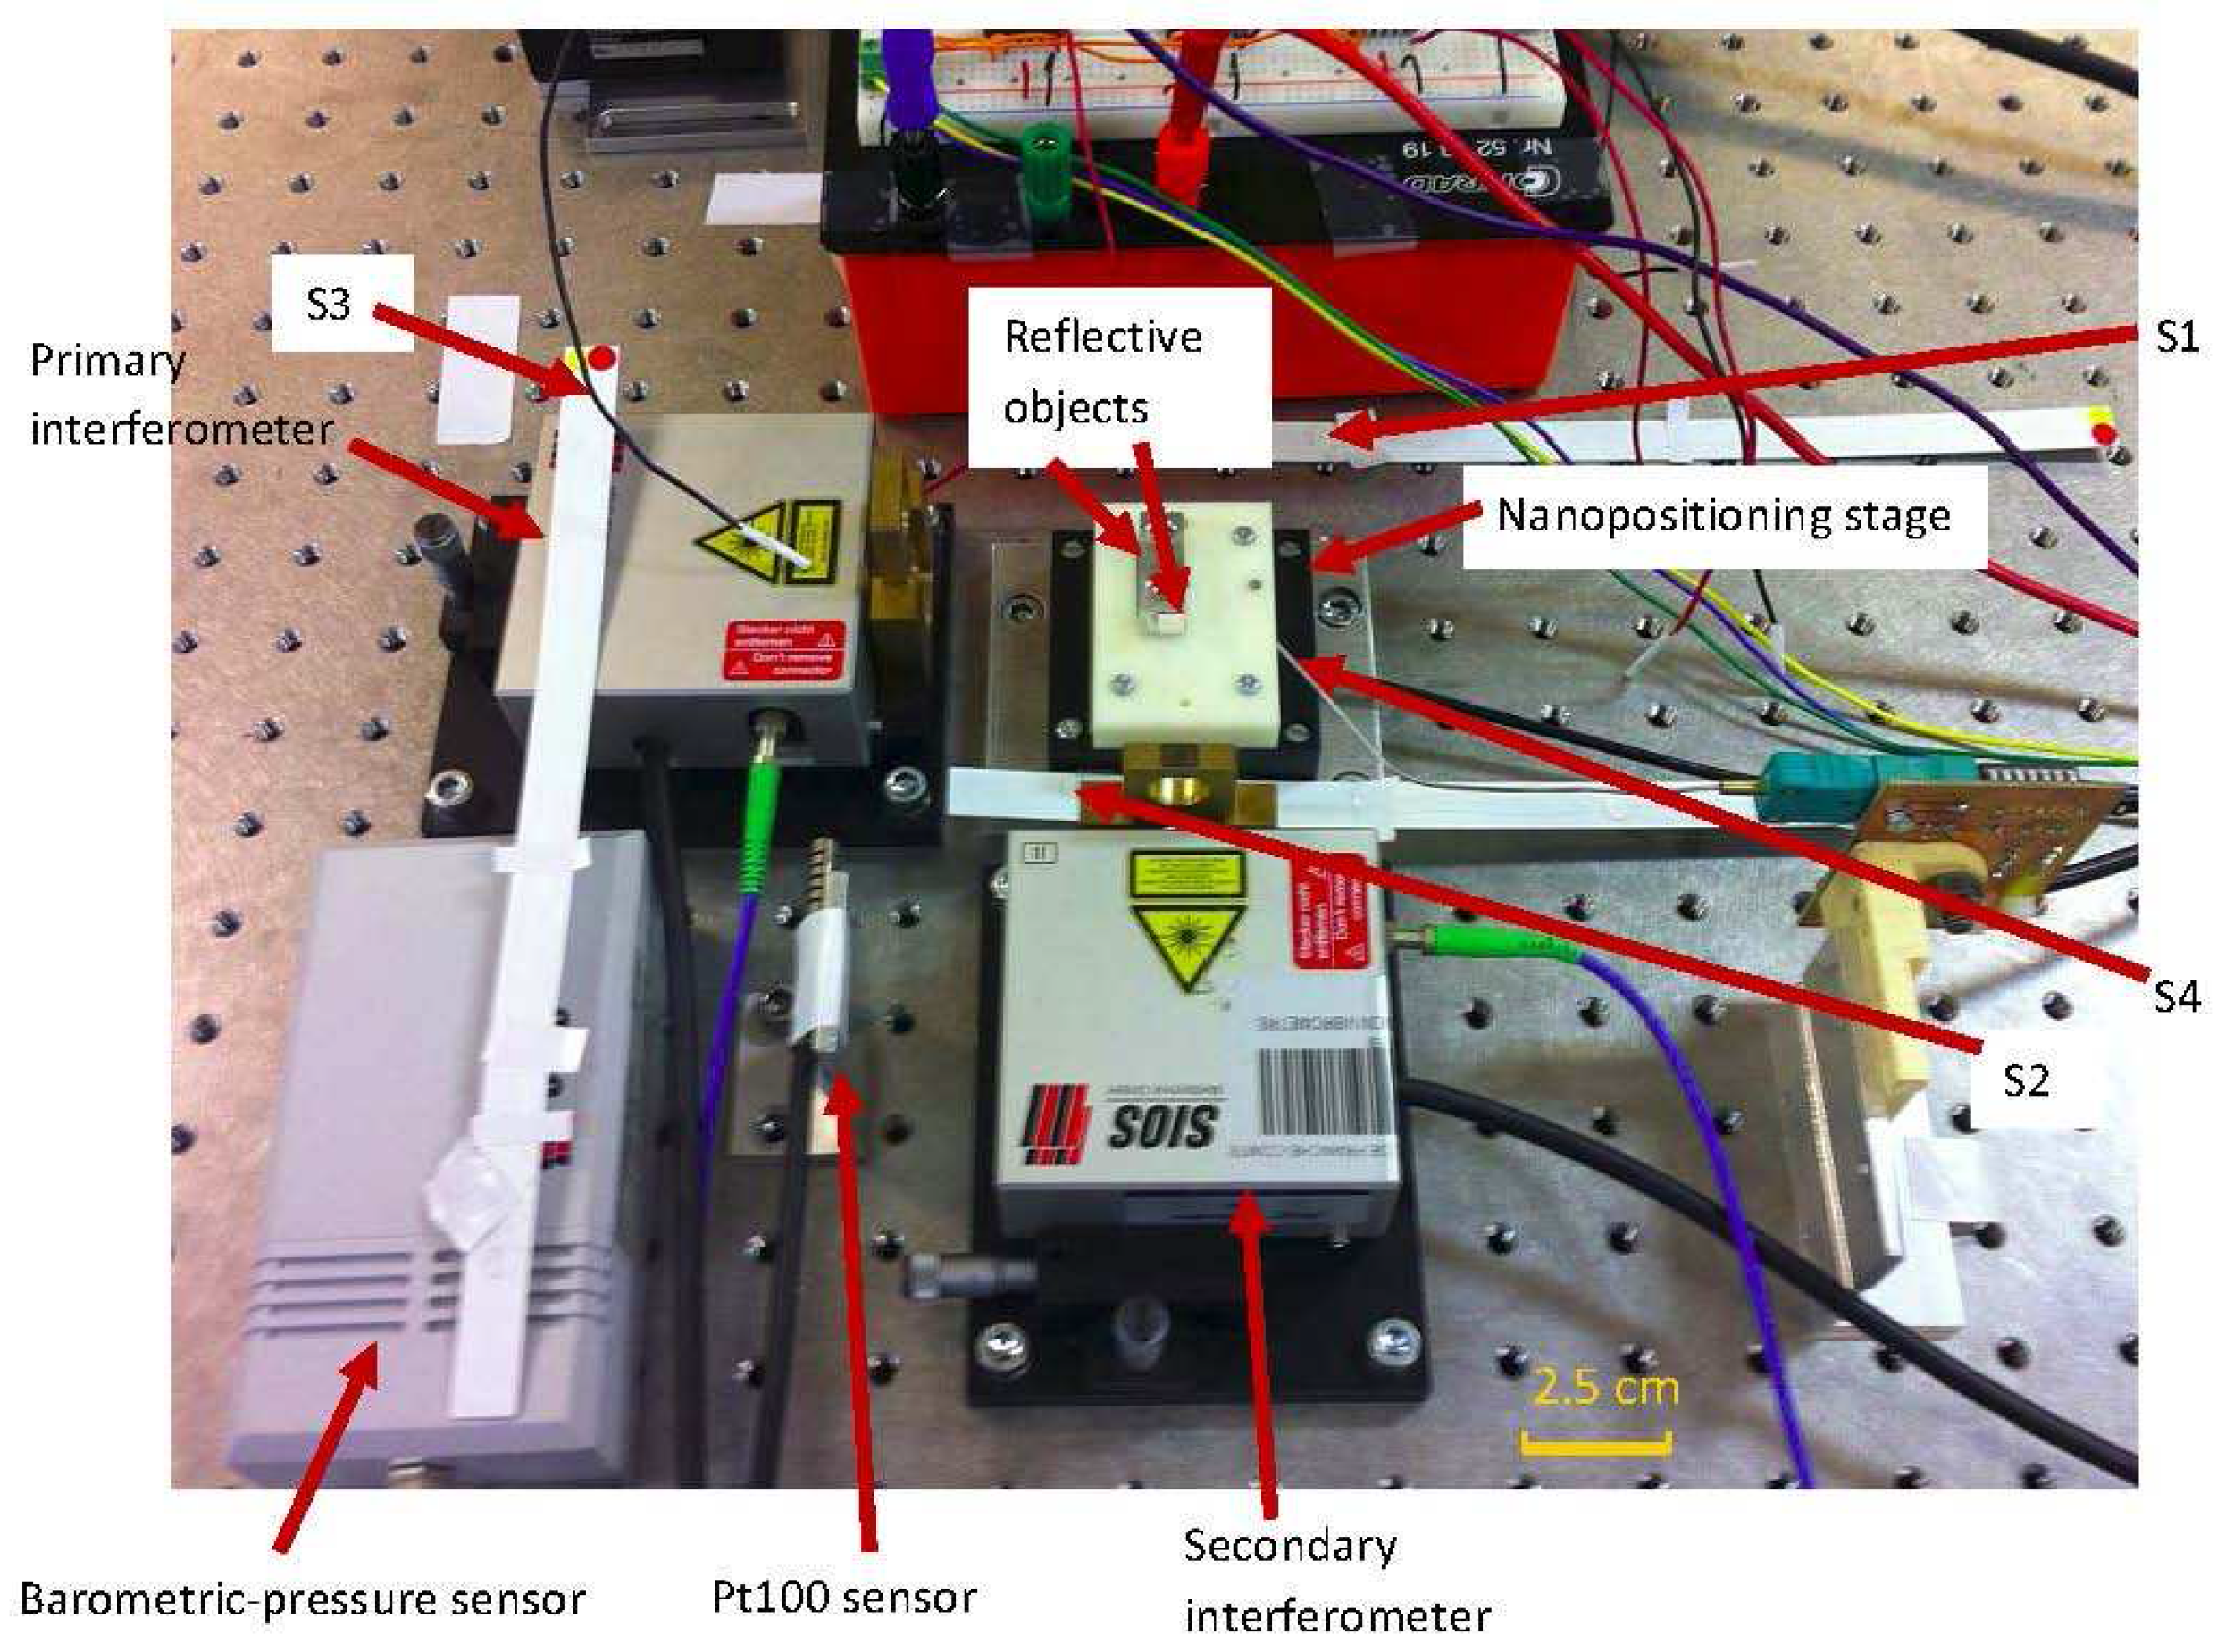
Except for geometric errors, the system is also highly susceptible to thermal disturbances. To choose a suitable calibration model considering thermal effect, we first perform an experiment to characterize the relation between the temperature and drift. In this experiment, the interferometer is used to measure the position of the switched-off nanopositioning stage useful to focus mainly on thermal elongation. The interferometer is defined as a global frame in two days of measurement. Even though without inputting moving commands, the interferometer detects the drift of the stage.
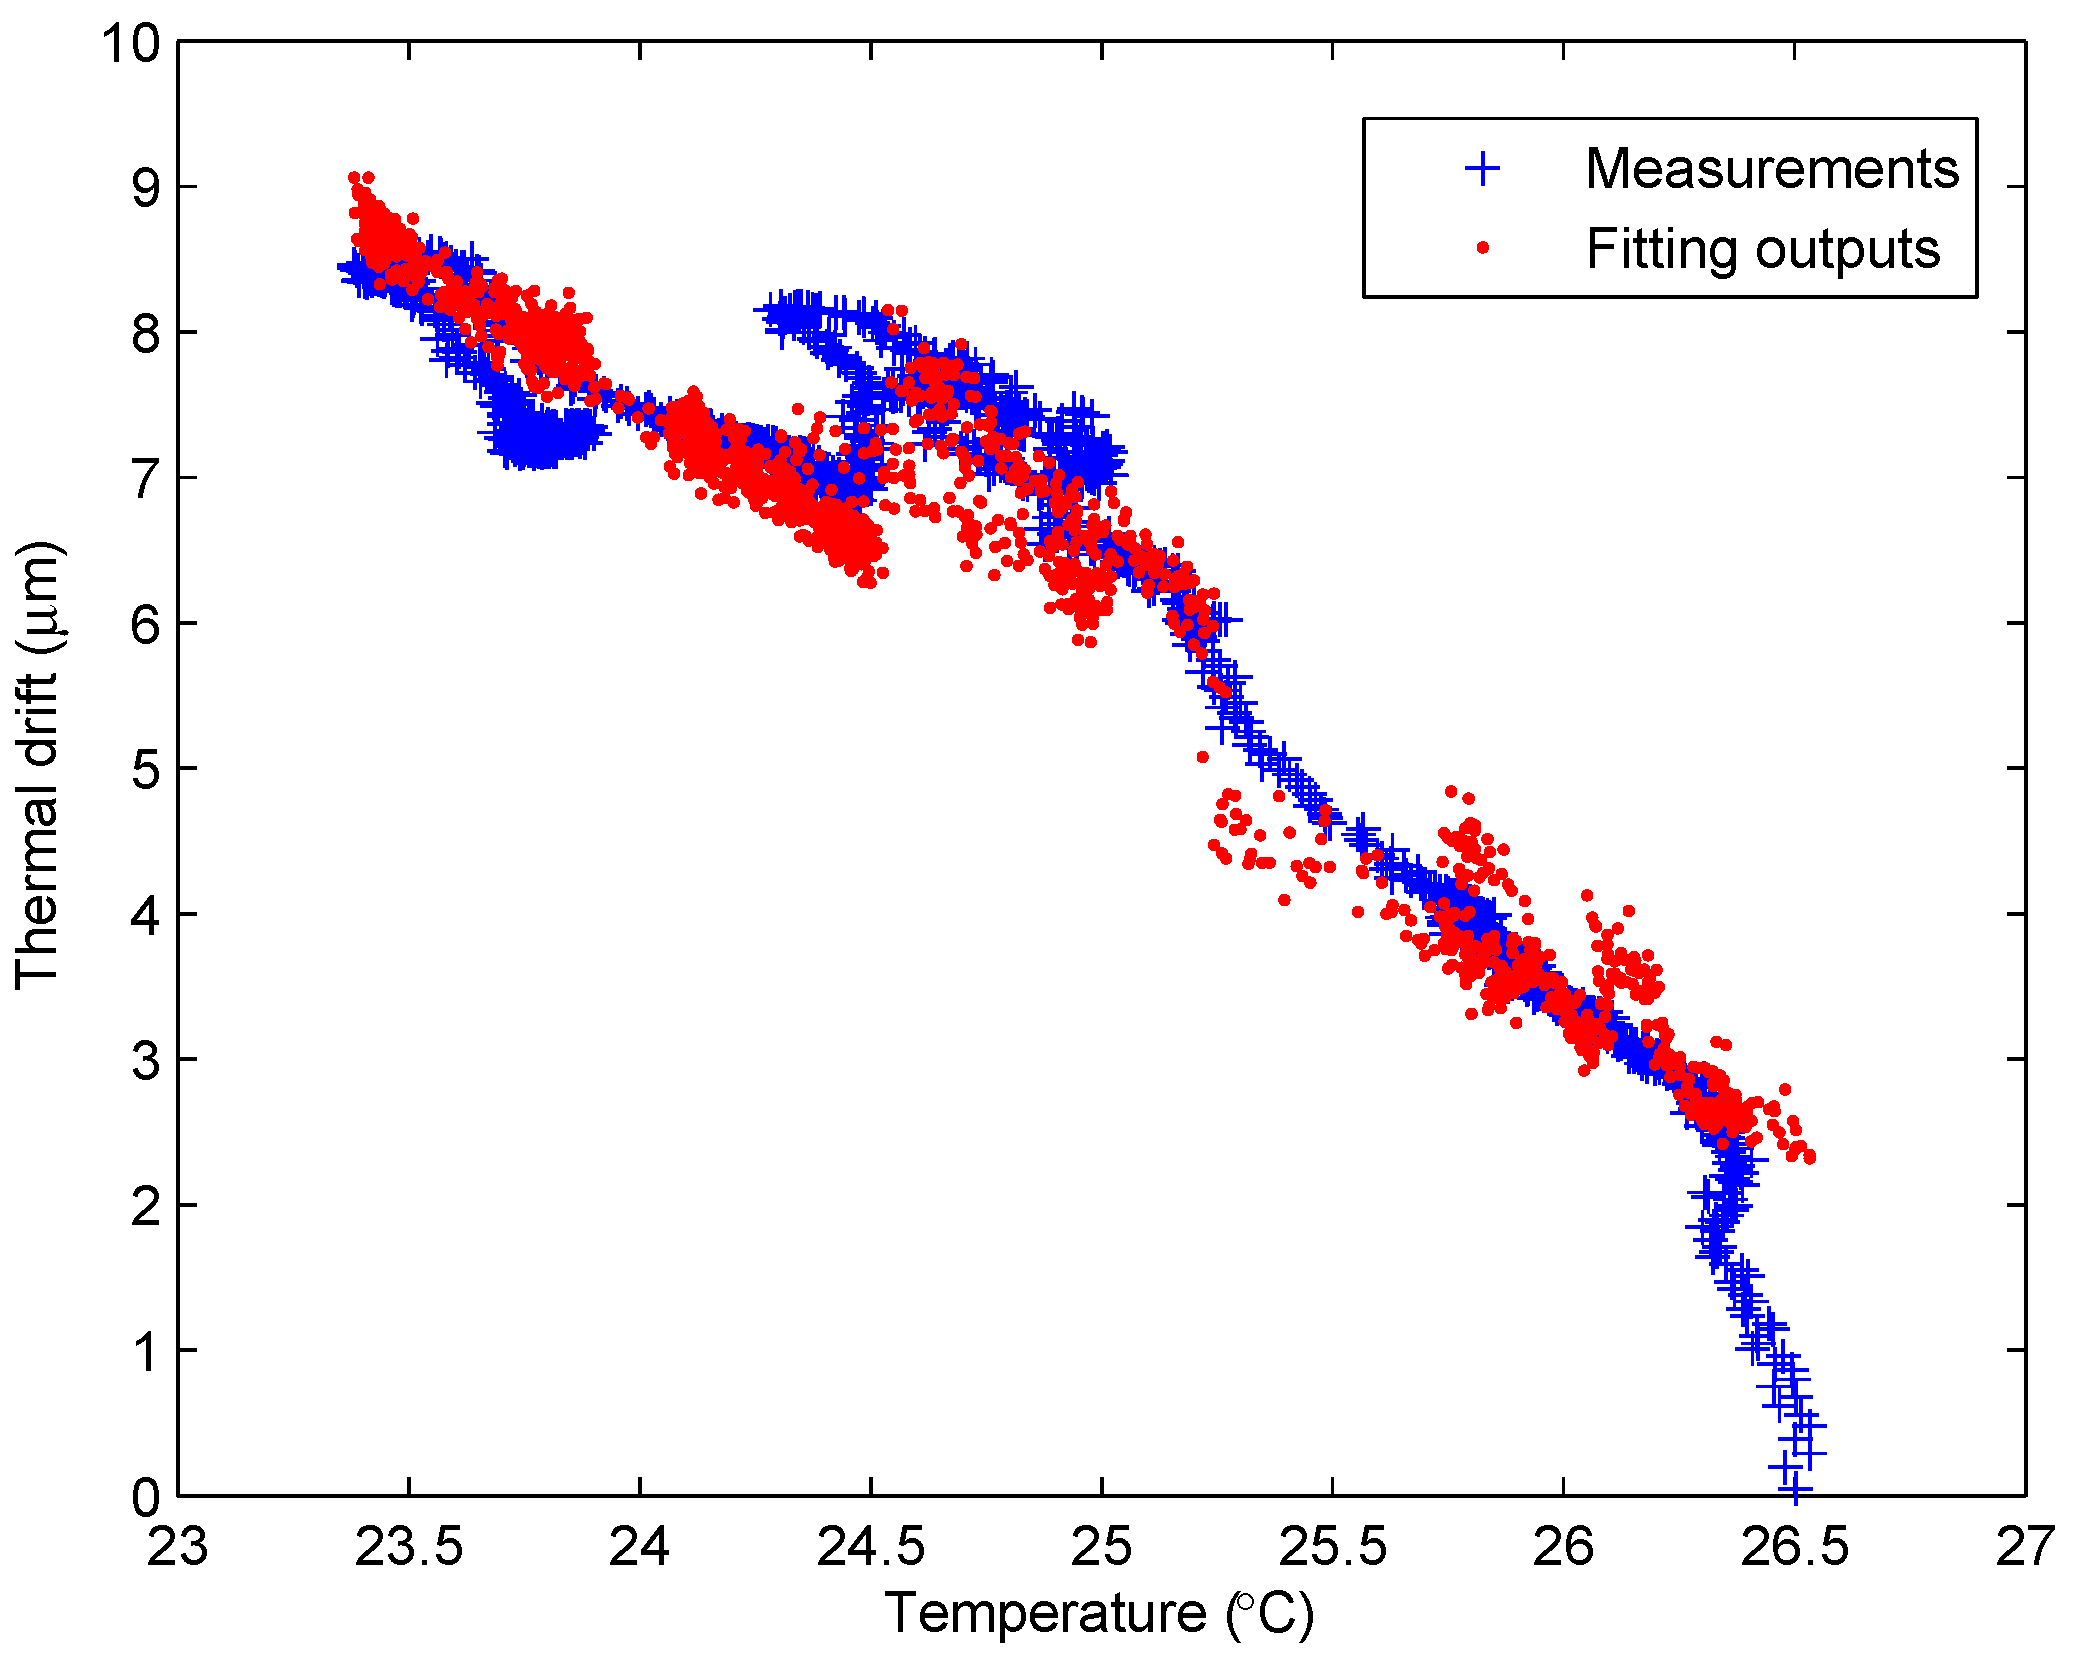
Figure 3 shows that the drift increases when the ambient temperature (corresponding to S4 in
Figure 6) decreases oppositely. The temperature measurement of one sensor only reflect the temperature change nearby. However, the thermal drift is affected by the temperature change around the stage, which might be due to the thermal effects aggregated from different parts of the setup and surrounding environment. The fitting outputs of the model Equation (
10) is the combination of measurements from several sensors. The measurements of all the thermocouples are similar, but there are still some minor differences. At the microscale, these minor differences are important for precisely building an accurate model. Therefore, the relationship shown in
Figure 3 is not completely linear.
Figure 3.
Relationship between the thermal drift and temperature during the 2-days measurement in ambient environment.
Figure 3.
Relationship between the thermal drift and temperature during the 2-days measurement in ambient environment.
3.2.2. Thermal-Drift Modeling
The drift mainly comes from the thermal elongation
δ in different parts of the stage. Considering a ideal and simple case,
δ can be computed based on the following equation:
where
is the length at reference temperature
;
α is the thermal-expansion coefficient;
l is the length of the component after the temperature change
. The thermal expansions from different parts form the gross thermal drift.
Considering the non-uniform temperature field and combination of thermal expansions, we monitor temperatures at several points of the workspace and have the 1st order thermal-drift model:
where
is thermal compensation input;
is the
ith measured temperature and
is the corresponding coefficient;
λ plays a role of bias;
is the total number of temperature sensors. The model correlates the temperature field to the induced drift through coefficients
. Using this model we can approximate the thermal drift using the temperature information, and the fitting result is shown in
Figure 3.
3.3. Static Calibration Model
Combining the geometric and thermal drift models yields the complete model [
20]:
Obtaining a high fitting precision (e.g., submicron) requires a set of poses/measuring data for training (which is a process of obtaining the parameters of the model using a set of input-output data):
where
m is the number of measurements.
The equation could be written in matrix form
To perform training and parameter identification, the stepwise regression (, ™, MathWorks, Natick, MA, USA) is used because it is able to automatically search the coefficient space and keep the most influential ones by calculating the p-value of F-statistic. The algorithm could be implemented conveniently by a Matlab function .
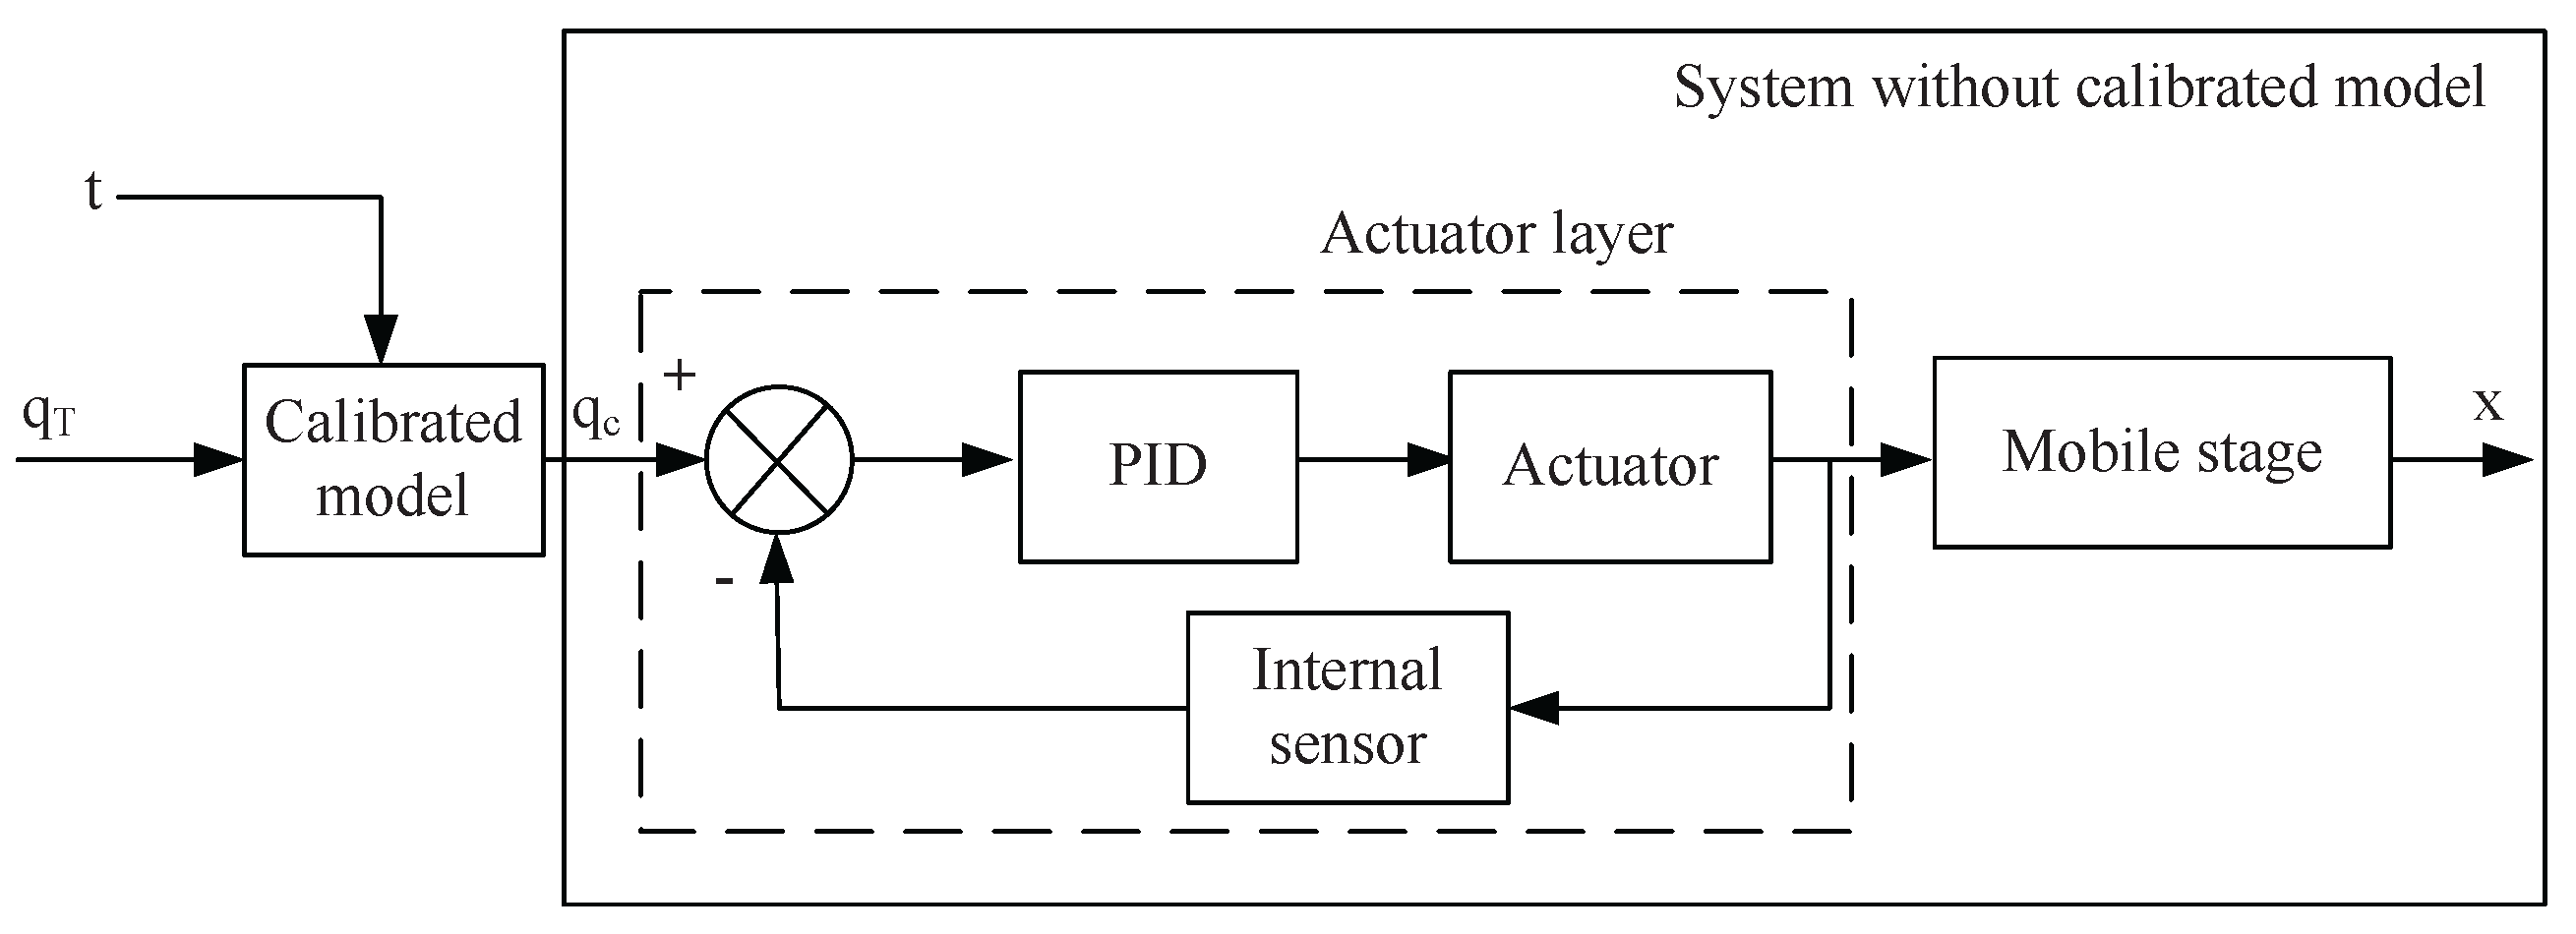
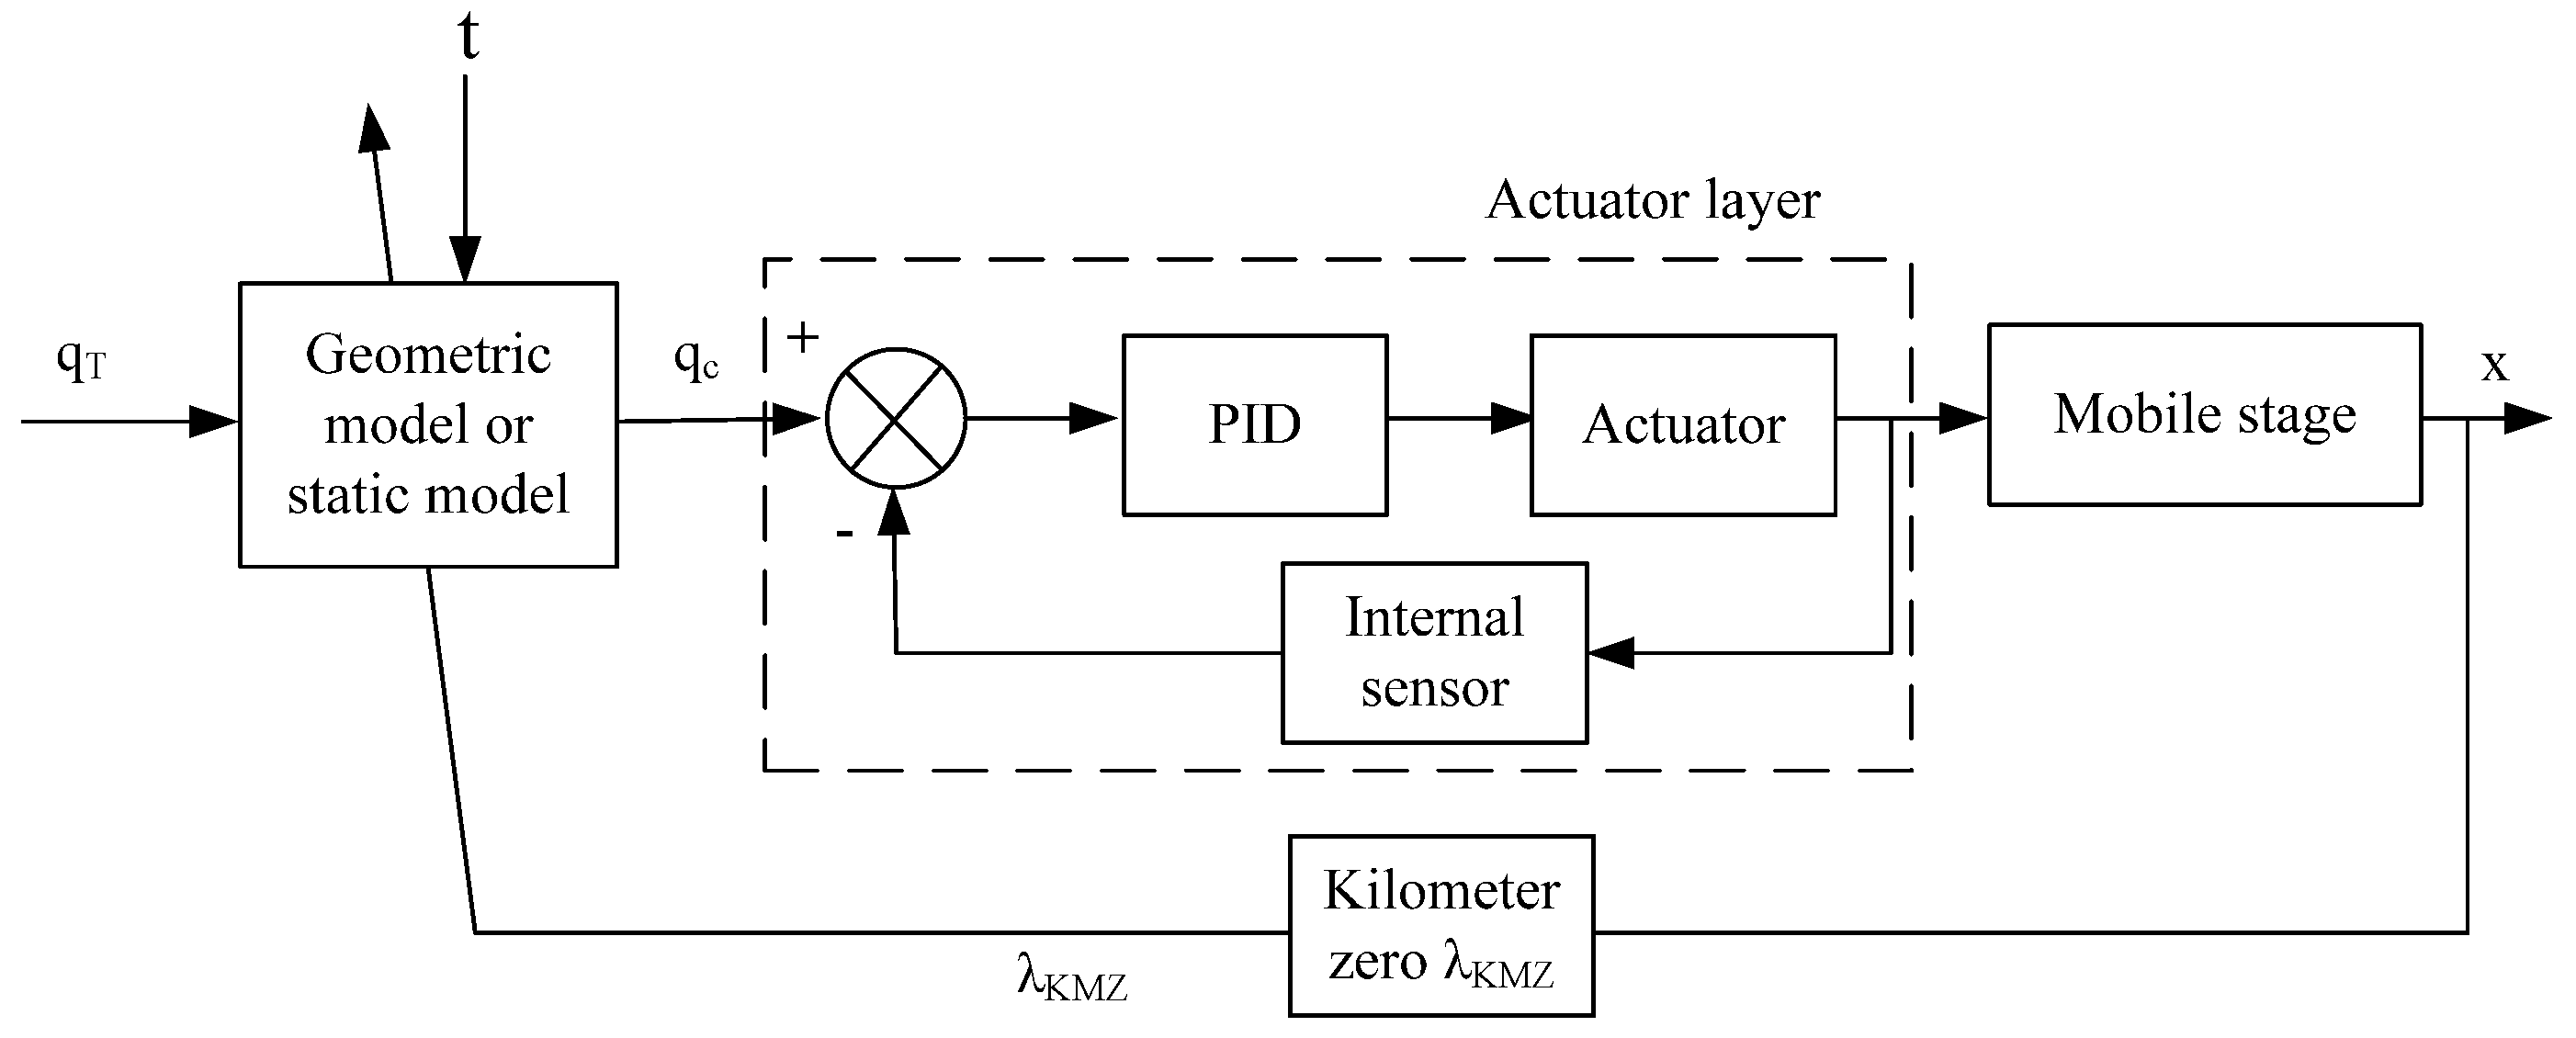
Figure 4 is the block diagram of the nanopositioning stage working in closed loop at actuator layer and in open loop at planning layer. A PID controller is used for the closed loop control. The control input
is calculated by the calibrated model with the target
. In the case without calibrated model, the control input is directly fed with
.
Figure 4.
Block diagram of the nanopositioning stage with the static calibration model.
Figure 4.
Block diagram of the nanopositioning stage with the static calibration model.
3.4. Adaptive Model Using KiloMeter-Zero (KMZ)
The thermal behavior is complex and difficult to model accurately, especially at the microscale. On one hand, to perform open loop control, we need to construct the static feedforward model as discussed before. On the other hand, to improve the positioning performance over the long term, we propose an adaptive model to update the compensation of the thermal drift.
Based on the knowledge that the thermal drift is position-independent, we propose to measure the thermal drift at the local position, and then use this information for the compensation along the whole stroke of the stage. To this end, we need to define an absolute frame to which the drift refers. We call this frame KiloMeter-Zero (KMZ). The frame can be defined by a sensor performing direct measurements, or a fixed precise tool (e.g., a fixed AFM tip). In this paper, we use the interferometer to define the KMZ. The working principle of the adaptive model using KMZ is as follows:
The absolute reference point is defined globally as the KMZ using a sensor or a fixed precise tool.
The KMZ is reached and the measurement of the sensor is recorded.
After a period of time, the KMZ is re-reached again and the new measurement is recorded. The drift in this period is the difference of two measurements of the sensor.
The thermal drift is compensated by adding the calculated difference of the two measurements.
One adaptive model can be formulated as:
where
is the drift detected by reaching the KMZ. Such a model is a way to update the drift that can evolve with changing temperature during the modeling process. The first term of Equation (
14) is the same as that of the static model which compensates for the geometric errors. In the following experimental studies, the adaptive models all refer to Equation (
14). In addition, we can also use the following model:
The block diagram of the adaptive model using the KMZ is shown in
Figure 5. Since the feedback happens at predefined intervals, the adaptive model is a trade-off solution between open loop and closed loop control in planning layer.
With compensation using the adaptive model,
replaces
as control input. In a given test, the
ith measurement corresponding to target
is:
The accuracy is
where subscript “
A” stands for the adaptive model and
is only measured at the first zero position, so
=
, when
= 0. Then the accuracy becomes
If
,
is very close to
, then
=
.
Therefore, if the temperature change is very small, the accuracy after compensation could be at the level without geometric error and external drift which is the highest accuracy theoretically. However, in most cases, the temperature change is not small in the long term. Moreover, because temperature change is relatively slow in the normal micromanipulation laboratories, the frequency of visiting the KMZ could be adjusted based on the temperature magnitude and changing rate.
Figure 5.
Block diagram of the system with adaptive model using KMZ.
Figure 5.
Block diagram of the system with adaptive model using KMZ.
3.5. Robustness Criterion
There are some works tackling calibration of macro or micro robots with thermal compensation. However, few of them investigate the robustness of calibration which is very important for practical applications. To evaluate robustness of calibration, we propose the following definition:
Definition 1. Robustness is defined as the outstanding degree and uniformity of the calibration, which is classified into two types, namely space and time robustness.
Space robustness defines the uniformity of the positioning accuracy of different positions in the whole workspace. The calculation equation is:
which evaluates the sum of deviations between the maximum and minimum accuracies of all tests in a period of time.
Time robustness defines the uniformity of the positioning accuracy in the whole process. The calculation equation is:
which evaluates the sum of maximum accuracies of all tests in a period of time.
If the values of and are smaller, the space and time robustness is better.
6. Conclusions
Nanopositioning systems usually suffer from geometric errors due to imperfect actuator behavior. In addition, thermal drift is also a major source of inaccuracy. To improve the nanopositioning accuracy, we need to compensate for the geometric errors and thermal drift. This paper presented theoretical formulations, modeling discussions, and experimental validation results. A static model and an adaptive model have been proposed. The static model depicted the geometric errors and thermal drift in a static structure. The adaptive model was able to compensate for thermal drift by updating the drift information through revisiting the kilometer-zero. Based on measurements of interferometer and thermocouples, a set of experiments have been conducted to characterize, to calibrate, and to validate the performances of the nanopositioning stage.
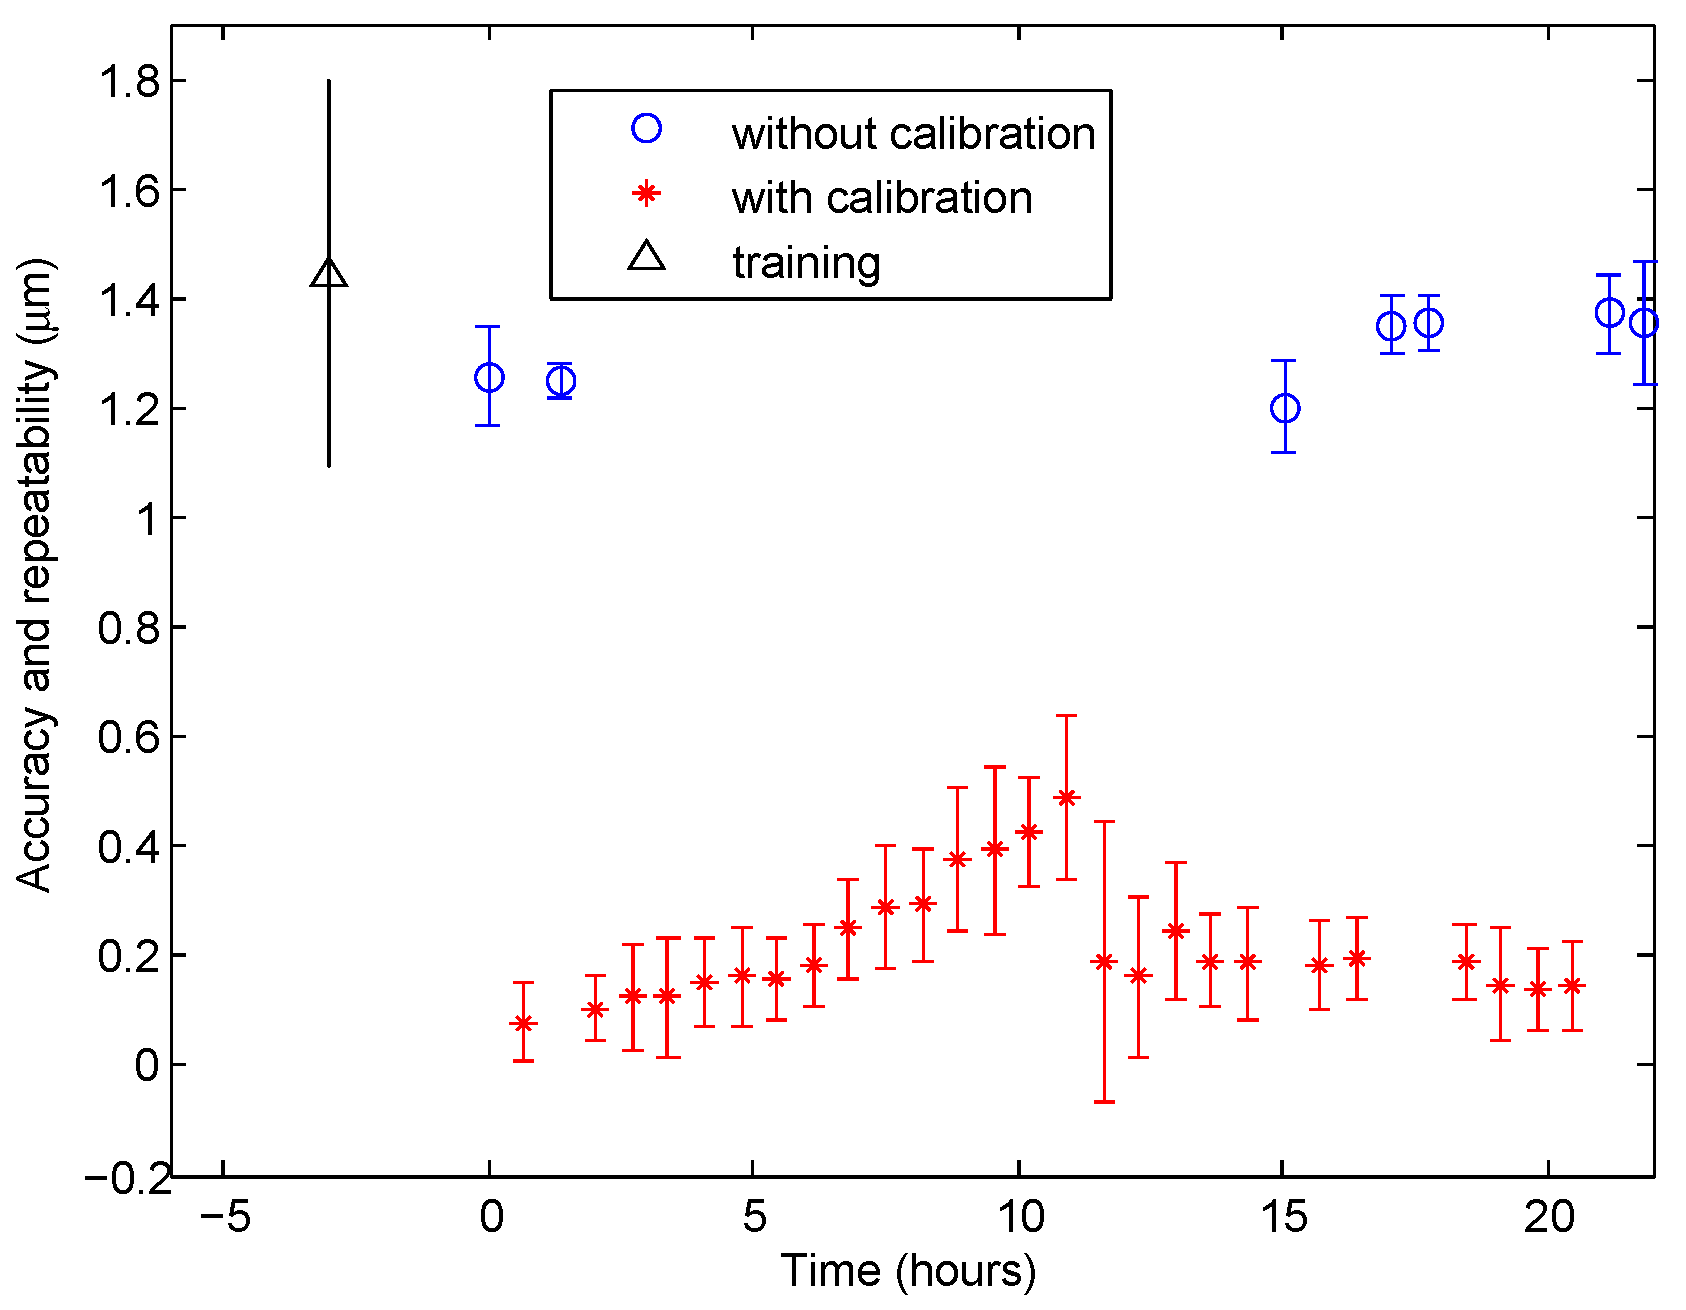
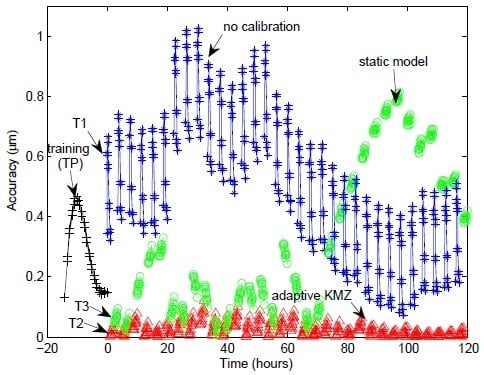
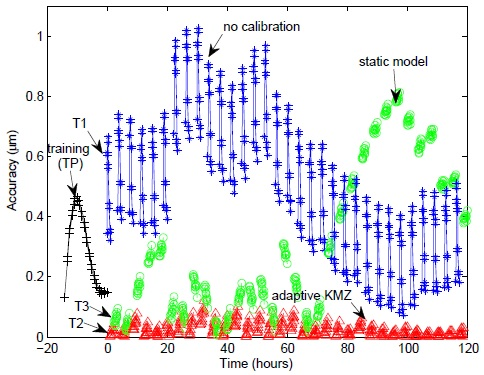
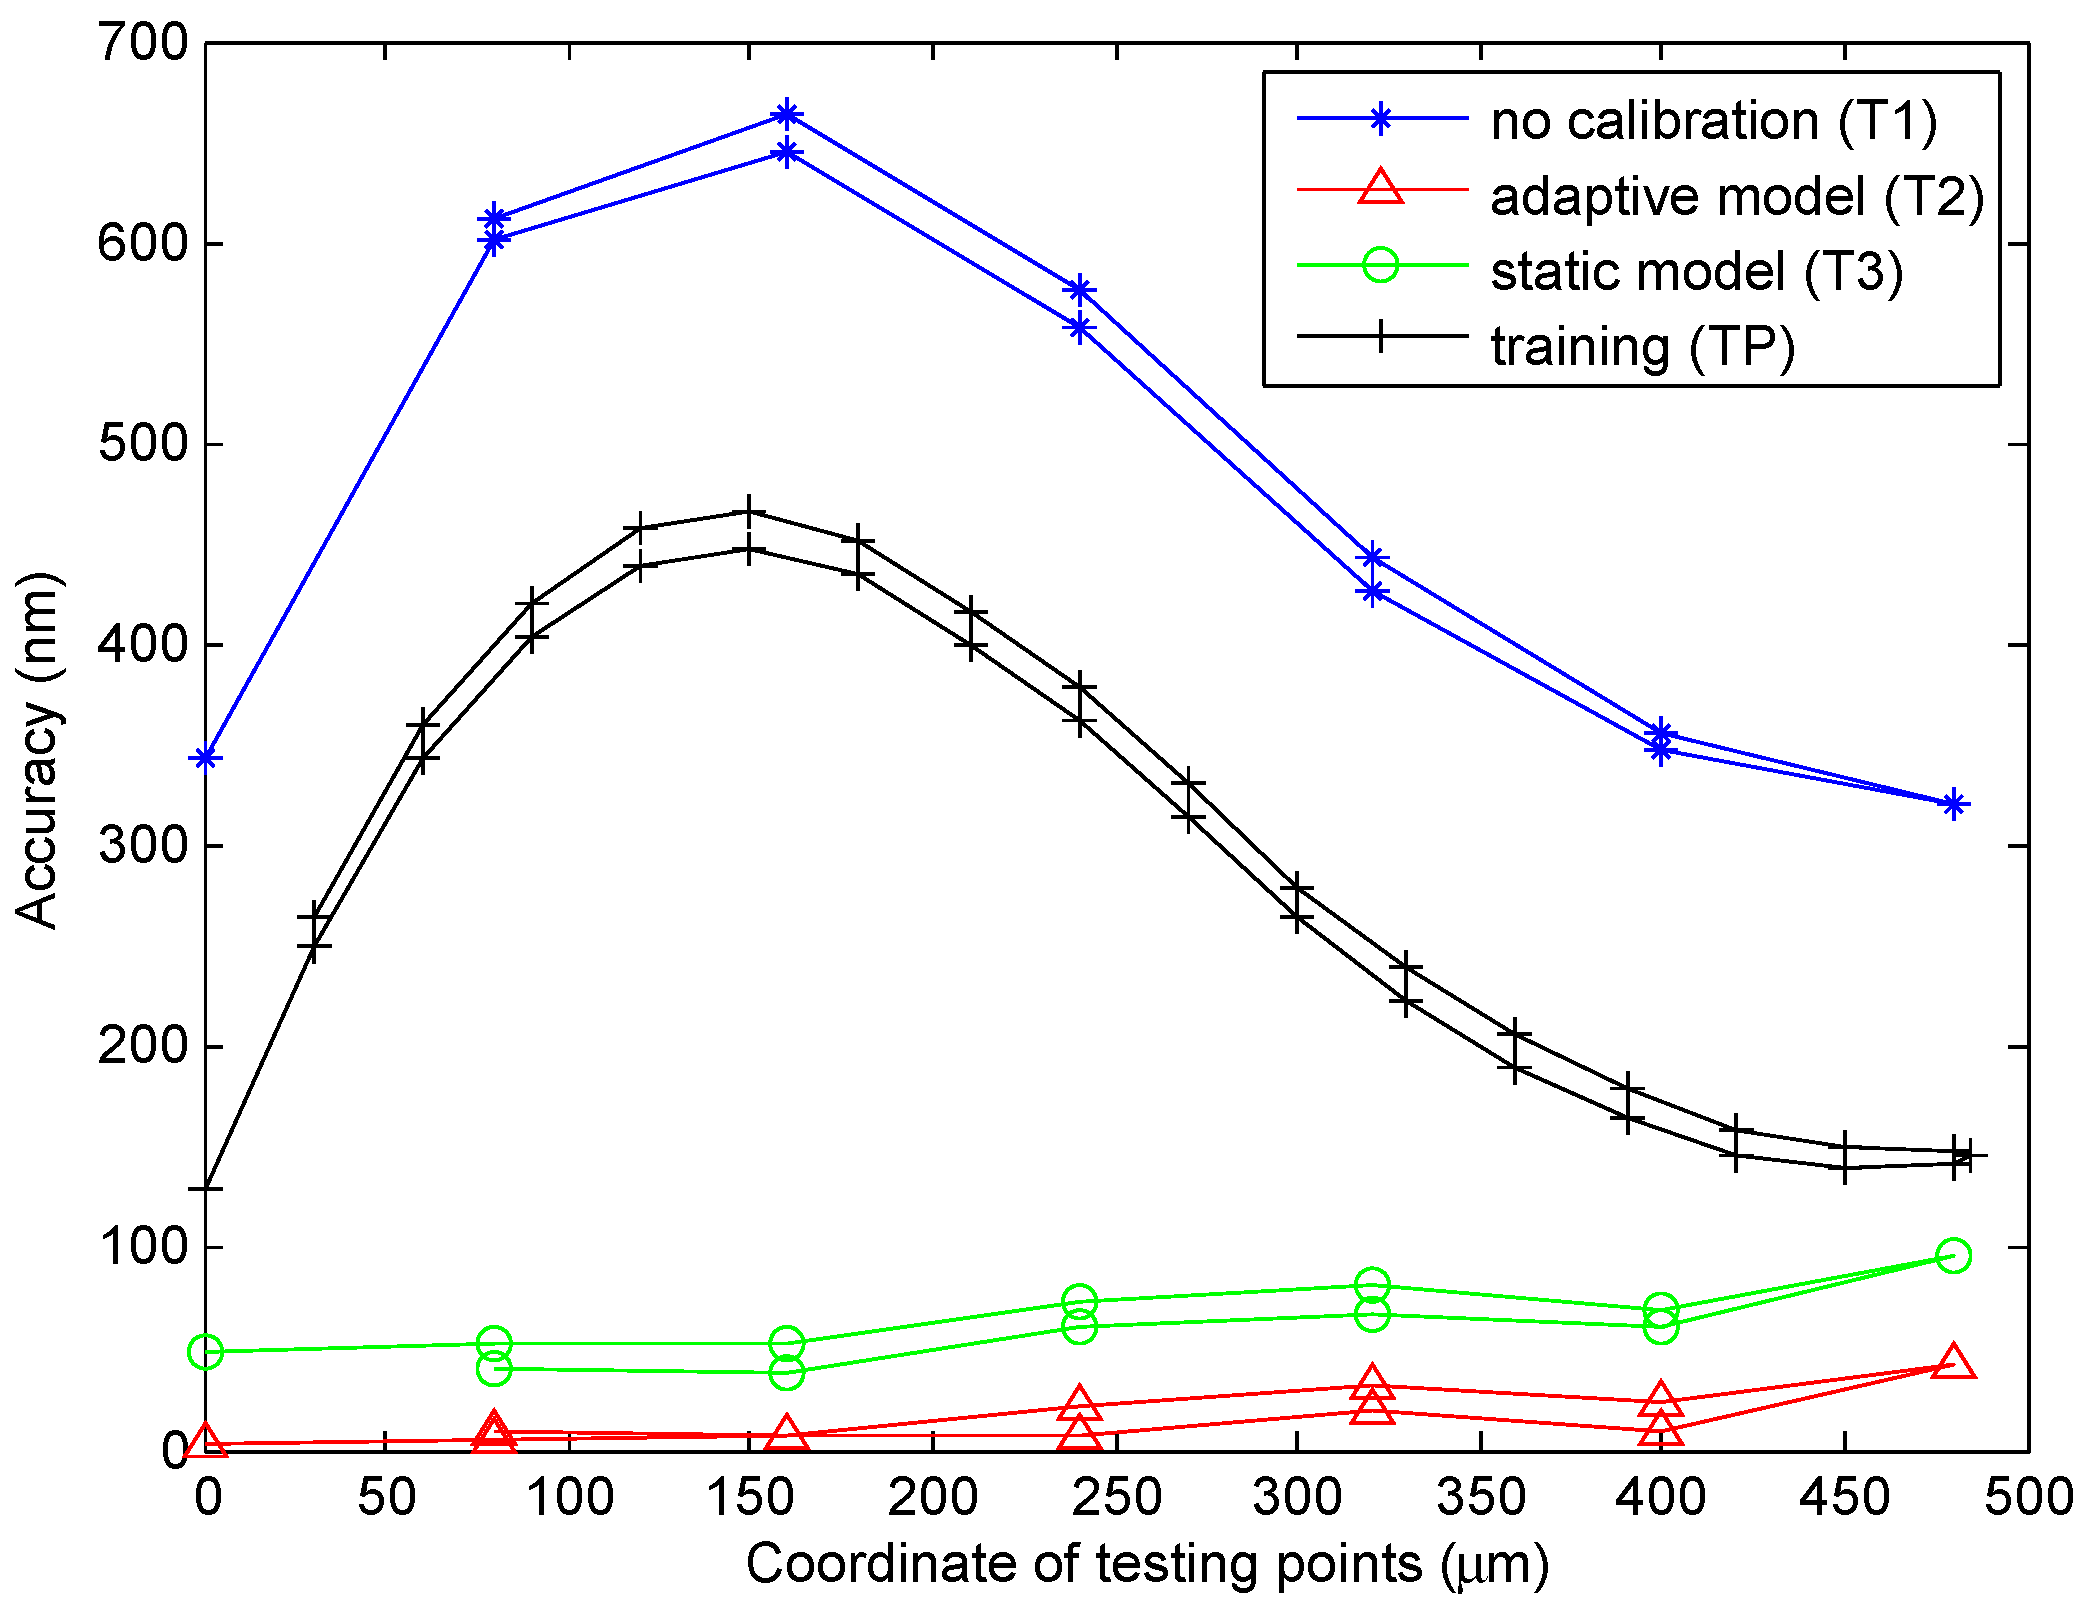
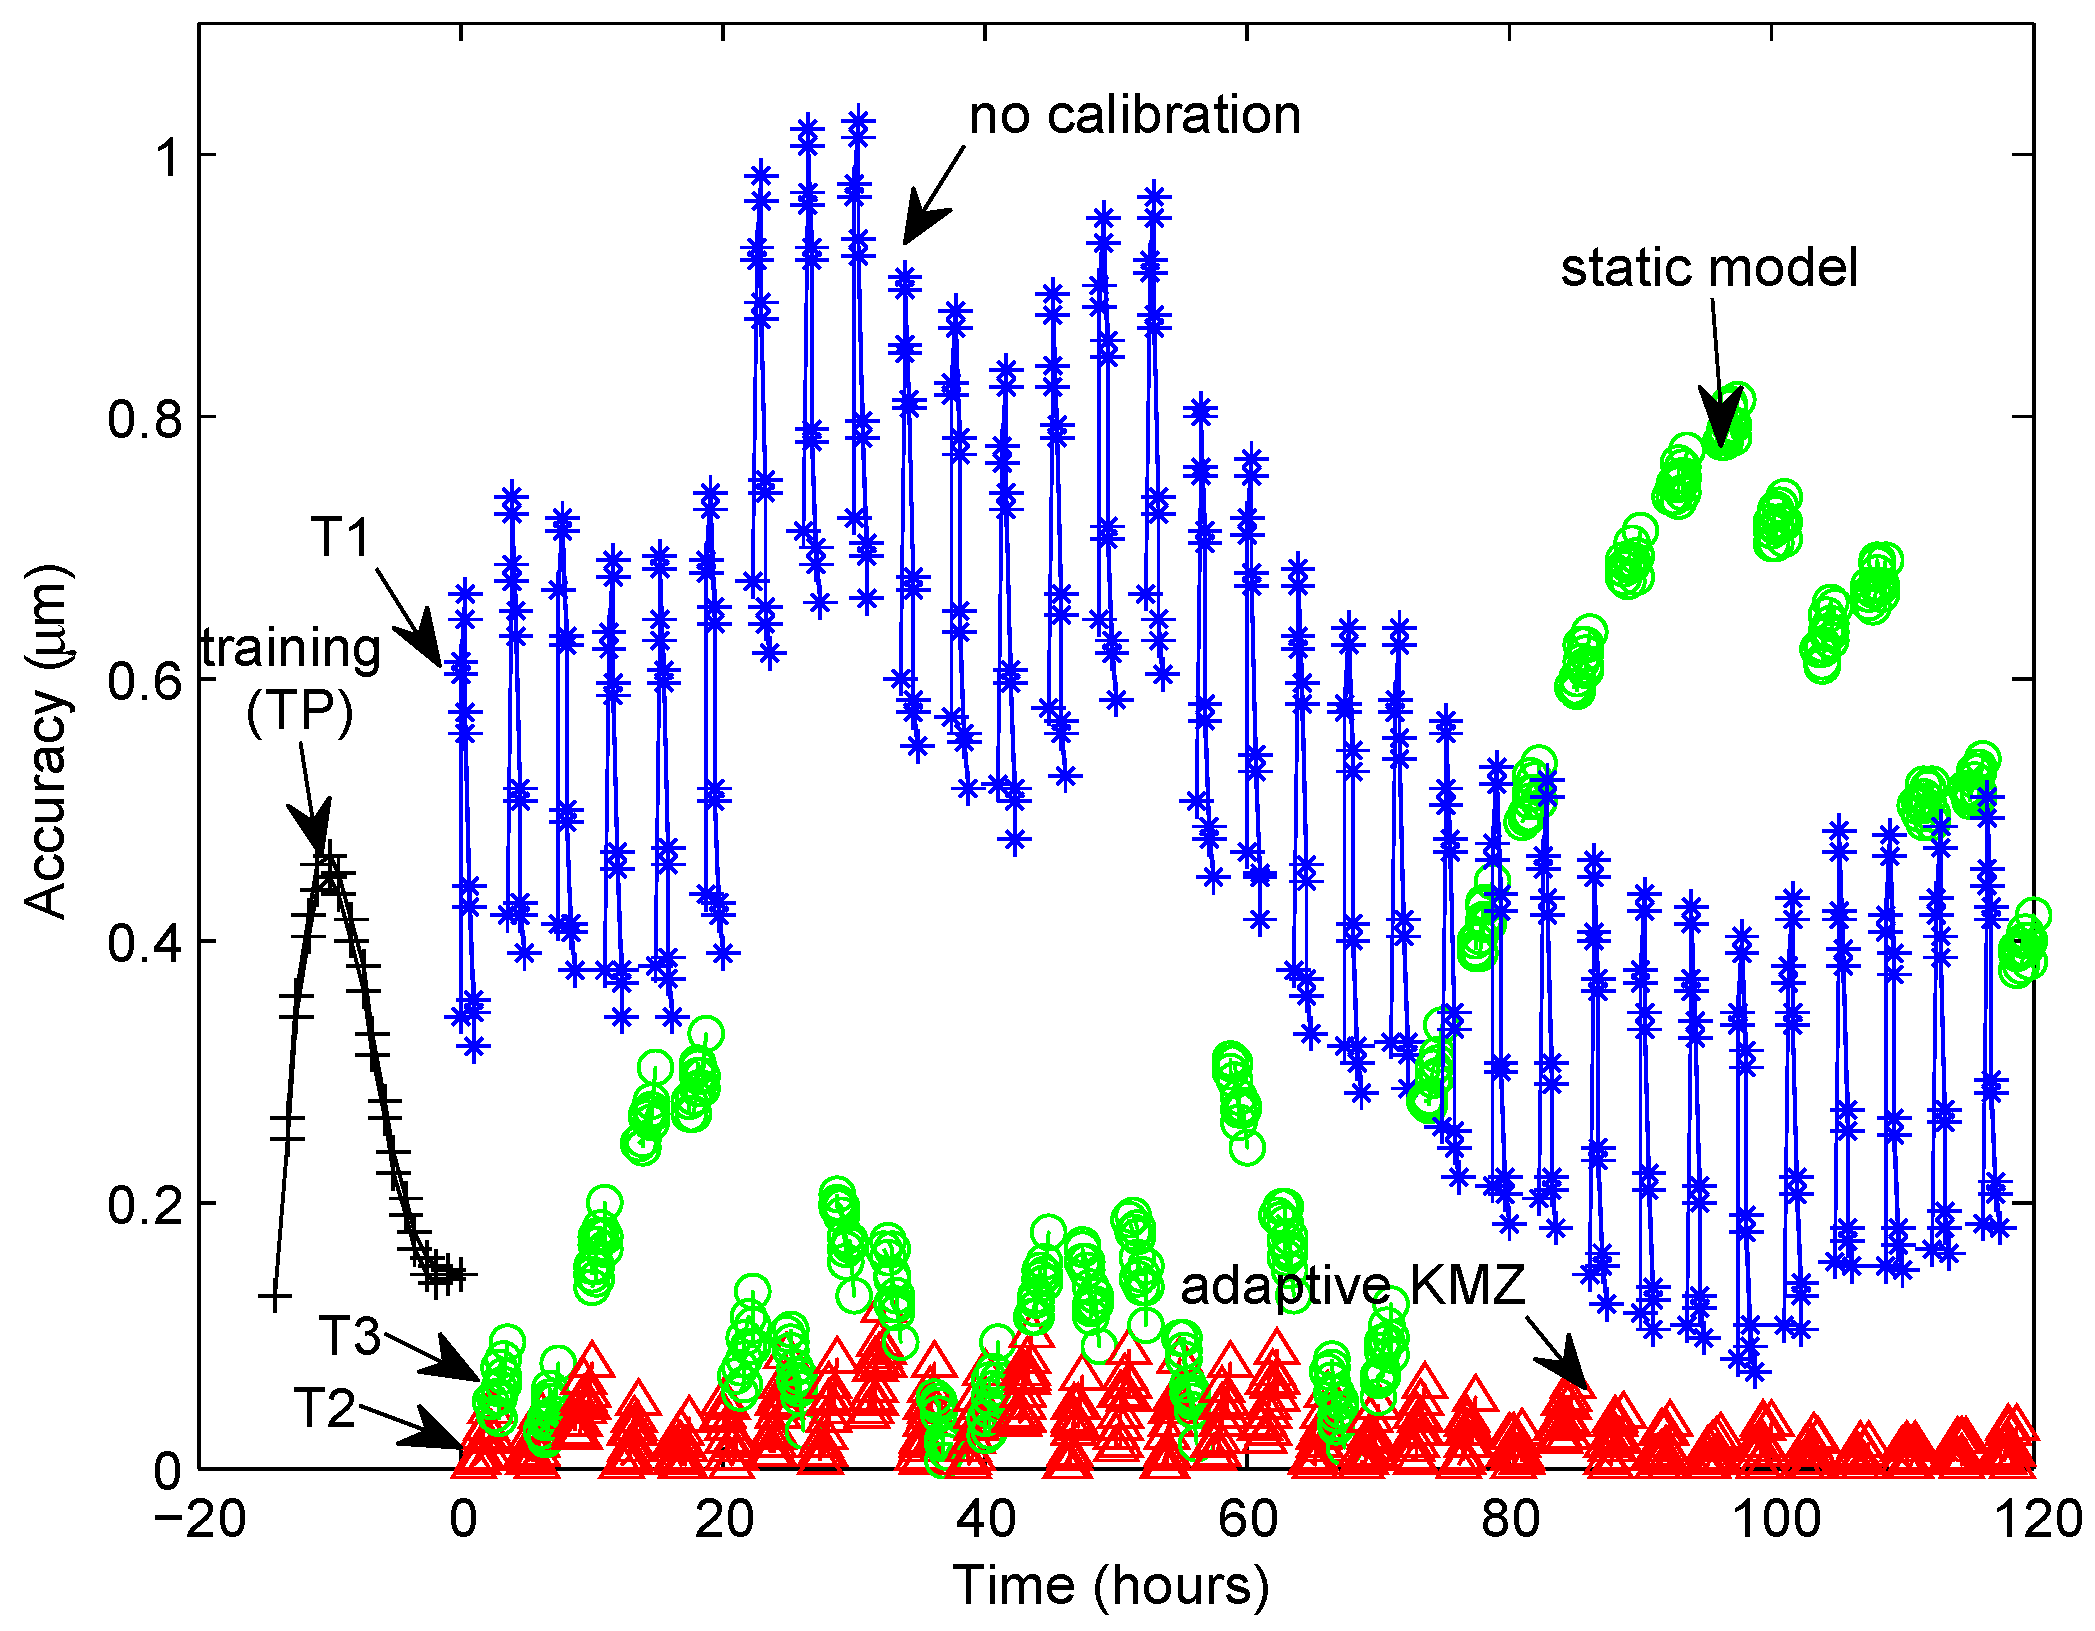
The experimental results demonstrated that the performance of the static model depended largely on the consistency of conditions before and after training. If the drift behavior and temperature range after training were close to those during training, the static model can guarantee efficient compensation based on training knowledge. Results showed that accuracy was better 400 nm in this case. The adaptive model was able to update the new information that thermal drift can be compensated efficiently in spite of how temperature changes. The achieved accuracies were almost better than 100 nm. On the other side, without compensation, accuracy could be up to 1 μm even if temperature did not go far away from the training range. Calculation of time and space robustness provided numerical comparisons of two models and no model. In addition, we extended the 1-DoF calibration to multi-DoF with a case study of a 2-DoF nanopositioning robot. Results also demonstrated that the model efficiently improved the 2D accuracy from 1400 nm to 200 nm.
Future work will be using a low cost (high resolution, small range) sensor, which is able to measure accurately in a very small space to integrate in the stages.


